Business Wire News

PLANO, Texas--(BUSINESS WIRE)--Vine Energy Inc. (NYSE: VEI) (the “Company” or “Vine”) announced today the execution of an agreement with Project Canary, the standard for trusted Environmental, Social, and Governance data, in which Vine is expected to become the first in the Haynesville Basin to certify 100% of the company’s assets and gain access to certified, responsibly sourced gas (RSG) markets.


The certification process is expected to begin in November 2021, when Project Canary will begin its TrustWell™ operational certification review of all the company’s producing wells. In addition, Project Canary will deploy “Canary X” continuous emissions monitoring devices across locations representing 25-30% of Vine’s natural gas production which will target domestic and international RSG markets.

Noting the significance of the agreement, Eric Marsh, Chairman, President and Chief Executive Officer, commented, “Since Vine’s inception, we have demonstrated an unwavering commitment to environmental stewardship. In the past three years alone, we’ve reduced our methane intensity by 62% and our greenhouse gas intensity by 35%, all while growing production nearly three times over the same period. Our relationship with Project Canary will impart the reach necessary to both independently verify our performance and reduce our emissions even further, while concurrently meeting the growing demand for cleaner and affordable natural gas across the globe. As an essential component of our nation’s energy backbone, we are proud of the leadership role we are playing to protect our ecosystems for future generations with energy sourced in an environmentally responsible manner.”

Chris Romer, CEO and co-founder of Project Canary said, “Vine Energy is a well-recognized leader in the Haynesville and we are proud to be working with them to extend their operational and environmental performance goals and objectives.”

About Vine Energy Inc.

Vine Energy Inc., based in Plano, Texas, is an energy company focused on the development of natural gas properties in the stacked Haynesville and Mid-Bossier shale plays in the Haynesville Basin of Northwest Louisiana. The Company is listed on the New York Stock Exchange under the symbol “VEI”.

About Project Canary

Project Canary is a Denver-based B-Corp focused on delivering trusted responsibly sourced gas certification and advanced continuous emissions monitoring technology to help energy companies achieve best-in-class ESG performance. With more than 600 operational data points analyzed, TrustWell is the most comprehensive operational certification program available, providing a recognized badge of high standards. Project Canary’s team of scientists, engineers, and seasoned industry operators have earned recognition for their uncompromising standards, including being named “Best for the World 2021” for creating the greatest impact through its business. www.ProjectCanary.com

Forward-Looking Statements

The information in this press release includes “forward-looking statements.” All statements, other than statements of historical fact included in this Notice, regarding our strategy, future operations, financial position, estimated revenue and losses, projected costs, prospects, plans and objectives of management are forward-looking statements. When used in this Notice, the words “could,” “believe,” “anticipate,” “intend,” “estimate,” “expect,” “project” and similar expressions are intended to identify forward-looking statements, although not all forward-looking statements contain such identifying words. These forward-looking statements are based on our current expectations and assumptions about future events and are based on currently available information as to the outcome and timing of future events. These forward-looking statements are based on management’s current belief, based on currently available information, as to the outcome and timing of future events. We caution you that these forward-looking statements are subject to all of the risks and uncertainties, most of which are difficult to predict and many of which are beyond our control, incident to the exploration for and development, production and sale of natural gas. These risks include, but are not limited to, commodity price volatility, lack of availability of drilling and production equipment and services, costs for drilling and completion and production services, drilling and other operating risks, environmental risks, regulatory changes, the uncertainty inherent in estimating natural gas reserves and in projecting future rates of production, cash flow and access to capital, the timing of development expenditures, and other risks.


Contacts

David Erdman
(469) 605-2480
This email address is being protected from spambots. You need JavaScript enabled to view it.

Brian Miller
Vice President of Growth and Policy, Project Canary
(202) 669-3801
This email address is being protected from spambots. You need JavaScript enabled to view it.

MINNEAPOLIS--(BUSINESS WIRE)--$DCI #Donaldson--Donaldson Company, Inc. (NYSE: DCI) today announced that its Board of Directors declared a regular cash dividend of 22.0 cents per share. The dividend is payable August 31, 2021, to shareholders of record on August 16, 2021. The Company has paid a cash dividend every quarter for 65 years and was added to the S&P High-Yield Dividend Aristocrats Index in January 2016 after 20 consecutive years of annual dividend increases.


About Donaldson Company

Founded in 1915, Donaldson (NYSE: DCI) is a global leader in technology-led filtration products and solutions, serving a broad range of industries and advanced markets. Our diverse, skilled employees at over 140 locations on six continents partner with customers—from small business owners to the world’s biggest OE brands—to solve complex filtration challenges. Discover how Donaldson is Advancing Filtration for a Cleaner World at www.Donaldson.com.


Contacts

Charley Brady (952) 887-3753

Business Expands Commodities Trading, Risk Management and Hedging Services

DALLAS--(BUSINESS WIRE)--Hilltop Securities Inc. (HilltopSecurities) today announced the expansion of its commodities brokerage and trading business with the launch of a new division, HTS Commodities. The division consists of 19 experienced commodities professionals in Texas and Tennessee, including nine in Amarillo, and three in Memphis who joined the firm on July 30. The team will provide a full suite of commodities trading, risk management, and wealth management services to farmers and ranchers across the United States.


The new additions include managing directors Brock Thompson and Will Snead in Amarillo, who serve as co-heads of HTS Commodities’ central plains region and managing directors Lewis Williamson and Marvin Coleman in Memphis, who serve as co-heads of the mid-south region. They join HilltopSecurities’ legacy team of seven commodities professionals in Plano, Texas. The newly expanded group is co-headed by Richard Konkel and Jerome Gaudry, with each bringing over two decades of banking, commodities, and financial engineering experience.

“The launch of HTS Commodities with the addition of 12 highly experienced and accomplished commodities and futures professionals is another important step in HilltopSecurities’ growth plan,” said Brad Winges, President and CEO of HilltopSecurities. “We are proud to welcome these talented individuals to our team and look forward to their contributions as we continue to seek opportunities to build this business and expand our product offerings to farmers and ranchers in the United States.”

HTS Commodities will focus on a broad range of commodities and futures trading including livestock, grains, cotton, energy, metals, U.S. market indices, and U.S. and foreign currencies, among other wealth advisory services. In addition, the division will provide commodities consulting services and customized hedging strategies for producers, consumers, and investors. HTS Commodities’ recent hires more than double the size of the firm’s existing commodities desk with plans to continue its growth throughout other geographic regions.

“As a full-service investment bank, HilltopSecurities is focused on expanding across our business lines and the markets we serve to deliver a comprehensive suite of financial services for our clients,” said Konkel.

“The launch of HTS Commodities marks a significant milestone as we increase the scope of our trading and hedging solutions for individual and institutional clients. We’re excited to begin this next chapter and look forward to continued growth for HTS Commodities,” added Gaudry.

More information about HTS Commodities can be found at HTSCommodities.com.

About Brock Thompson

Thompson co-founded TRU Trading, LLC in Amarillo in 2012 before announcing last month that the firm’s nine employees were joining HilltopSecurities. He has spent 19 years working with clients in the agriculture and energy industries, providing marketing recommendations and commodity risk management. He has been a Commodity Trading Advisor and has advised clients on managed futures programs. Thompson remains active in the cattle feeding industry as a cattle feeder and is a member of the Texas Cattle Feeders Association. He is also a member of the National Cattlemen’s Beef Association’s Tax and Finance Committee, as well as the College of Agricultural Developmental Council for Texas A&M University, where he earned a bachelor’s degree in Animal Science.

About Will Snead Jr.

Snead is a co-founder of TRU Trading, LLC and has 15 years of experience in the commodities industry focusing on risk management strategies in the agriculture and energy sectors. He has previously served as a wealth manager for Morgan Stanley and Merrill Lynch. In addition to his experience as a futures broker and systems trader, Snead is a licensed real estate agent with TRU Land Realty Group/Keller Williams, servicing the farm and ranch industry, and also co-founded crop marketing management firm, TRU Vision Ag. He is a graduate of Texas A&M where he earned a degree in Finance and Accounting.

About Lewis Williamson Jr.

Williamson brings 37 years of experience to his role at HTS Commodities, most recently as senior vice president with Morgan Stanley where he served as a commodity specialist focusing on risk management. He has deep experience in the soy crushing industry, ethanol sector, grain elevators, broiler industry, and exporters of U.S. agricultural products. He also has focused on balance sheet analysis for the row crop sector throughout his career. Williamson began his career with Merrill Lynch.

About Marvin Coleman

Coleman joins HTS Commodities from Morgan Stanley in Memphis, Tennessee, where he served as senior vice president, commodity futures specialist. He has more than two decades of experience advising agricultural entities and select individuals on their commodity hedging and speculative programs, with a special focus on rough rice futures.

About Hilltop Securities Inc.

Hilltop Securities Inc. delivers forthright advice and tailored solutions to municipal issuers, institutions, broker-dealers, and individuals. The full-service investment bank and registered investment adviser is headquartered in Dallas, Texas, with offices across the United States. Areas of focus include public finance; municipal and taxable fixed income underwriting, sales, and trading; retail brokerage services; securities clearing; structured finance; and securities lending. A wholly owned subsidiary of Hilltop Holdings Inc. (NYSE: HTH), HilltopSecurities’ affiliates include Momentum Independent Network Inc., PlainsCapital Bank, and PrimeLending. Learn more at www.HilltopSecurities.com. Member: NYSE/FINRA/SIPC.

FORWARD-LOOKING STATEMENTS

This press release contains forward-looking statements within the meaning of the Private Securities Litigation Reform Act of 1995. These forward-looking statements involve known and unknown risks, uncertainties and other factors that may cause our actual results, performance or achievements to be materially different from any future results, performance or achievements anticipated in such statements. Forward-looking statements speak only as of the date they are made and, except as required by law, we do not assume any duty to update forward-looking statements. . Such forward-looking statements include, but are not limited to, statements concerning such things as our plans, objectives, strategies, expectations, intentions and other statements that are not statements of historical fact, and may be identified by words such as “building,” “focus,” “grow,” “look,” “plan,” “seek,” “view,” “will” or “would” or the negative of these words and phrases or similar words or phrases. For further discussion of such factors, see the risk factors described in Hilltop’s most recent Annual Report on Form 10-K, and subsequent Quarterly Reports on Form 10-Q and other reports that are filed with the Securities and Exchange Commission. All forward-looking statements are qualified in their entirety by this cautionary statement.


Contacts

Hilltop Holdings Inc.
Ben Brooks
214.252.4047
This email address is being protected from spambots. You need JavaScript enabled to view it.

HOUSTON & LONDON--(BUSINESS WIRE)--Baker Hughes (NYSE: BKR) announced today that the Baker Hughes Board of Directors declared a cash dividend of $.18 per share of Class A common stock payable on August 20, 2021 to holders of record on August 10, 2021.


About Baker Hughes:

Baker Hughes (NYSE: BKR) is an energy technology company that provides solutions to energy and industrial customers worldwide. Built on a century of experience and with operations in over 120 countries, our innovative technologies and services are taking energy forward – making it safer, cleaner and more efficient for people and the planet. Visit us at bakerhughes.com.


Contacts

Investor Relations
Jud Bailey
+1 281-809-9088
This email address is being protected from spambots. You need JavaScript enabled to view it.

Media Relations
Thomas Millas
+1 713-879-2862
This email address is being protected from spambots. You need JavaScript enabled to view it.

Company joins major global businesses in setting aggressive climate agenda

DENVER--(BUSINESS WIRE)--#carbon--Vantage Data Centers, a leading global provider of hyperscale data center campuses, today announced that the company will achieve net zero carbon emissions globally by 2030. This marks a significant step for the company in its long-time efforts to continually increase efficiencies and reduce environmental impacts at its hyperscale data center campuses worldwide.


With Vantage’s commitment to net zero carbon emissions, the company will not only actively work to reduce greenhouse gas emissions but will also invest in technologies and projects that remove carbon from the atmosphere. Vantage’s goal specifically targets reductions for emissions that the company directly controls, Scope 1 and 2 emissions, as well as reductions that it can guide or influence throughout its supply chain. Vantage is creating interim reduction targets that are in alignment with the Science Based Target Initiative (SBTi) methodology, which defines and promotes emissions reduction in line with climate science.

“As major consumers of power and land, data center operators have an undeniable responsibility to aggressively reduce emissions and lessen environmental impacts wherever possible. This is why we’ve set our target at net zero rather than carbon neutral,” explained Justin Thomas, chief technology officer, Vantage Data Centers. “Our goal is to be a sustainability leader, and we are setting interim reduction goals that touch every part of our business.”

Vantage will continue to prioritize partnerships and projects that directly benefit the environment and communities in which the company operates. Vantage will reach its net zero goal by focusing on four key areas:

  • Emissions Reduction: Vantage is investing in technologies that target reductions in emissions, starting with a focus on energy efficiency and emissions reductions from on-site generators. In addition, the company will develop processes and partnerships to reduce Scope 3 emissions outside of its control, such as emissions associated with customer IT and cooling loads.
  • Renewable Energy: Vantage has already taken a proactive approach in designing highly efficient data center campuses with industry-leading Power Usage Effectiveness (PUE). Most recently, the company announced that it now offers renewable energy options to customers across all campuses globally. In addition, Vantage actively works with energy providers, customers and industry groups, like the Renewable Energy Buyers Alliance (REBA), to advocate for and invest in additional renewable energy sources globally.
  • Supply Chain: Vantage is working closely with its vendors and suppliers to decarbonize its supply chain.
  • Carbon Offsets: Only in areas where emissions are unavoidable, Vantage will purchase offsets. The offsets purchased will provide funding for carbon removal projects and investments in communities where the company operates its data centers.

“Vantage is taking a forward-looking approach to decarbonization by investing in the team, technology and processes needed to actively reduce our carbon footprint across the design, construction and operation of our data center campuses,” said Amanda Sutton, senior director of sustainability, Vantage Data Centers. “Our comprehensive strategy includes everything from the use of renewable energy to water conservation, waste reduction and recycling. We are making a strong commitment to sustainability while also rapidly expanding globally to support our customers’ technological innovations today and into the future.”

Vantage’s environmental sustainability goals and activities align with those of its hyperscale, cloud and large enterprise customers, as well as its investors, including DigitalBridge, which have made similar climate and environmental commitments across their respective companies.

“We view implementing Net Zero 2030 as both a business and an ethical imperative for our firm and for all of our portfolio companies,” said Marc Ganzi, chief executive officer, DigitalBridge. “We are proud that Vantage is leading from the front and committing to this bold initiative.”

For more information about Vantage’s sustainability commitments, please visit www.vantage-dc.com/features/sustainability.

About Vantage Data Centers

Vantage Data Centers powers, cools, protects and connects the technology of the world’s well-known hyperscalers, cloud providers and large enterprises. Developing and operating across six markets in North America and six markets in Europe, Vantage has evolved data center design in innovative ways to deliver dramatic gains in reliability, efficiency and sustainability in flexible environments that can scale as quickly as the market demands.

For more information, visit www.vantage-dc.com


Contacts

Press Contacts

Mark Freeman
Vantage Data Centers
This email address is being protected from spambots. You need JavaScript enabled to view it.
+1 202-680-4243

Ben Stanton
REQ for Vantage Data Centers
This email address is being protected from spambots. You need JavaScript enabled to view it.
+1 703-287-7800

HOUSTON--(BUSINESS WIRE)--SANDRIDGE PERMIAN TRUST (OTC Pink: PERS) today announced a distribution of approximately $9.5 million, or $0.182 per unit. This amount reflects (a) the distribution for the three-month period ended June 30, 2021 (which primarily relates to production attributable to the Trust’s royalty interests from March 1, 2021 to May 31, 2021) of approximately $0.4 million, (b) approximately $3.5 million (reflecting payments to the Trust of approximately $0.3 million and approximately $3.2 million) representing payment in full of the remaining unpaid portion of the amount Avalon Energy, LLC (“Avalon”) owed to the Trust relating to the three-month period ended March 31, 2020 (which primarily related to production attributable to the Trust’s royalty interests from December 1, 2019 to February 29, 2020 (the “May 2020 Quarterly Payment”), including accrued interest, and (c) the approximately $5.6 million of net proceeds received from the sale of the Trust’s assets to Montare Resources I, LLC (“Montare”) on June 18, 2021. The distribution is expected to occur on or before August 27, 2021 to holders of record as of the close of business on August 13, 2021.

As the Trust sold its remaining assets to Montare effective July 1, 2021, there will be no further income received by the Trust from oil and gas production. Cash reserves remaining after the distribution on or before August 27, 2021 will be used by the Trustee to complete the winding up process of the Trust, which includes the preparation and filing of a Form 10-Q for the period ended June 30, 2021, the filing of a Form 15 with the Securities and Exchange Commission (“SEC”) to deregister the Trust as a reporting company, notification to the OTC Markets Group of the Trust’s deregistration with the SEC and notice to stop trading of the Trust’s common units, and preparation and issuance of Forms K-1 for all holders of Common Units. If any cash reserves remain following the payment of the Trust’s estimated remaining expenses and liabilities, the Trustee will make a final distribution to unitholders of such amount. The Trust will remain in existence until the winding up process is completed, after which the Trustee will file a certificate of cancellation with the Secretary of State of the State of Delaware.

The Trust owned Royalty Interests in oil and natural gas properties and was entitled to receive proceeds from the sale of production attributable to the Royalty Interests up to June 1, 2021. As described in the Trust’s filings with the SEC, the amount of the quarterly distributions fluctuated from quarter to quarter, depending on the proceeds received by the Trust as a result of actual production volumes, oil, natural gas and natural gas liquids prices, and the amount and timing of the Trust’s administrative expenses, among other factors. All Trust unitholders share distributions on a pro rata basis.

During the three-month production period ended May 31, 2021, combined sales volumes were slightly higher than the previous period. In addition there was a material increase in the average price of oil during the production period as compared to the three-month production period ended February 28, 2021.

Volumes, average prices and distributable income available to unitholders for the three-month period ended June 30, 2021 are presented below (dollars in thousands, except average prices and per unit):

Sales Volumes


Oil (MBbl)


12


Natural Gas Liquids (MBbl)


1


Natural Gas (MMcf)


4


Combined (MBoe)


14


Average Price


Oil (per Bbl)


$

61.48


Natural Gas Liquids (per Bbl)


$

27.35


Natural Gas (per Mcf)


$

2.17


Natural Gas (per Mcf) including impact of post-production expenses


$

1.91


Royalty income


$

797


Expenses


(417)


Distributable income


380


Company Distribution Amount(1)


368


Payment of May 2020 Quarterly Payment(2)


3,160


Proceeds from sale of Trust assets


6,000


Expenses of sale of Trust assets


(375)


Distributable income available to unitholders


$

9,533


Distributable income per unit (52,500,000 units issued and outstanding)


$

0.182


(1) Represents the deposit of Avalon’s portion of the May 2021 distribution to Trust unitholders, pursuant to the Repayment Agreement dated as of March 1, 2021 between Avalon and the Trust.


(2) Represents the payment by Montare of the remaining unpaid portion of the missed May 2020 Quarterly Payment, together with accrued interest, as disclosed in the Trust’s Current Report on Form 8-K dated June 18, 2021.


Pursuant to Internal Revenue Code Section 1446, withholding tax on income effectively connected to a United States trade or business allocated to non-U.S. persons (“ECI”) should be made at the highest marginal rate. Under Section 1441, withholding tax on fixed, determinable, annual, periodic income from United States sources allocated to non-U.S. persons should be made at a 30% rate unless the rate is reduced by treaty. This is intended to be a qualified notice by SandRidge Permian Trust to nominees and brokers as provided for under Treasury Regulation Section 1.1446-4(b), and while specific relief is not specified for Section 1441 income, this disclosure is intended to suffice. Nominees and brokers should withhold at the highest marginal rate on the distribution made to non-U.S. persons. The Tax Cuts and Jobs Act (the “TCJA”) enacted in December 2017 treats a non-U.S. holder’s gain on the sale of Trust units as ECI to the extent such holder would have had ECI if the Trust had sold all of its assets at fair market value on the date of the sale of such Trust units. The TCJA also requires a transferee of Trust units to withhold 10% of the amount realized on the sale or exchange of such units (generally, the purchase price) unless the transferor certifies that it is not a non-resident alien individual or foreign corporation or another exception is available. Pursuant to final Treasury Regulations issued on October 7, 2020, this new withholding obligation will become applicable to transfers of units in publicly traded partnerships such as the Trust (which is classified as a partnership for federal and state income tax purposes) occurring on or after January 1, 2022.

This press release contains statements that are “forward-looking statements” within the meaning of Section 21E of the Securities Exchange Act of 1934, as amended. All statements contained in this press release, other than statements of historical facts, are “forward-looking statements” for purposes of this provision. These forward-looking statements include the amount and date of any anticipated distribution to unitholders; the amount and date of any future distributions to unitholders of the Trust; expectations regarding the timing of the winding up of the Trust, including the cancellation of the Trust units; and statements regarding the possibility of future distributions to unitholders during the winding up period. Statements made in this press release are qualified by the cautionary statements made above. Neither Avalon nor the Trustee intends, and neither assumes any obligation, to update any of the statements included in this press release. An investment in common units issued by the Trust is subject to the risks described in the Trust’s Annual Report on Form 10-K for the year ended December 31, 2020, and all of its other filings with the SEC. The Trust’s annual, quarterly and other filed reports are or will be available over the Internet at the SEC’s website at http://www.sec.gov.


Contacts

SandRidge Permian Trust
The Bank of New York Mellon Trust Company, N.A., as Trustee
Sarah Newell
1(512) 236-6555

  • Hyliion continues to support industry leading logistics firm in the oil and gas space with a vision of full electrification as it plans for fleet expansion
  • Extended commercial relationship builds on the successful deployment and operation of Hyliion’s Hybrid Electric units, purchased by Detmar earlier this year
  • Hypertruck ERX™ is a next generation electric powertrain that is recharged by an onboard natural gas generator – enables long range and quick refueling – can provide net-negative carbon emissions to commercial fleets
  • 300-unit Hypertruck ERX™ reservation highlights growing demand for Hyliion’s powertrain solutions from major fleets and logistics providers

AUSTIN, Texas--(BUSINESS WIRE)--Hyliion Holdings Corp. (NYSE: HYLN) (“Hyliion”), a leader in electrified powertrain solutions for Class 8 semi-trucks, today announced that Detmar Logistics LLC has executed a reservation agreement covering 300 Hypertruck ERX™ systems. The agreement is part of Hyliion’s latest collaboration with the Texas-based frac sand solutions provider, whose reservation marks the next step in their continued effort to fully electrify their fleet over the next five years. Detmar is actively expanding their fleet operations and sees Hyliion’s Hypertruck ERX™ as an enabling technology to accelerate their growth.


The Hypertruck ERX™ is an electric powertrain that is recharged by an onboard natural gas generator for Class 8 commercial trucks that aims to provide lower operating costs, emissions reductions, and superior performance. Utilizing the 700+ commercial natural gas vehicle filling stations across North America, it enables long range and quick refueling, and when fueled with renewable natural gas, can provide net-negative carbon emissions to commercial fleets.

An early adopter of electrification in the oil and gas industry, Detmar placed an initial order of 10 Hyliion Hybrid Electric units earlier this spring. The successful program and deployment—met with positive feedback from Detmar’s operations team, drivers, and customers—generated further interest in the Hypertruck ERX™ solution and a longer-term commercial relationship with Hyliion.

“We are thrilled to add another chapter to a growing relationship with a business that shares our vision for reducing carbon emissions in the commercial transportation industry. Detmar is setting the pace with their commitment to alternative fuels and their readiness to power their entire fleet with low emission solutions,” said Thomas Healy, Founder and CEO of Hyliion.

“The demand for the Hypertruck ERX™ is continuing to expand, especially from companies who are already operating our hybrid systems and are actively growing the size of their fleets. Hyliion’s technology offers practical solutions that empower fleets to make environmentally conscious decisions, while realizing superior performance, lower operating costs and flexibility,” Healy added.

“We are very excited for the opportunity to reserve a large order of Hypertruck ERX™ units and be one of the first trucking companies to define our path to full electrification in a bold way. Hyliion has been an exceptional partner as we’ve converted our trucks to their diesel hybrid system, and the positive feedback we’ve received from our customers is only matched by their interest in achieving net-negative carbon emissions with RNG. It’s certainly opening new doors for our business,” said Matt Detmar, President and CEO of Detmar Logistics.

“Our drivers are also eager to get behind the wheel of this new technology. They’ve had an outstanding experience with the hybrid trucks and their anticipation for the Hypertruck ERX™ is even greater,” Detmar concluded.

Hyliion will begin showcasing the Hypertruck ERX™ demonstration units to the Detmar team in late 2021, with trials running in 2022. The purchase and sale of the 300 Hypertruck ERX™ units is subject to the execution of a final agreement between Hyliion and Detmar. In April, Hyliion announced a first of its kind Hypertruck Innovation Council with leading companies that will test and provide feedback on the Hypertruck ERX™.

About Hyliion

Hyliion’s mission is to reduce the carbon intensity and greenhouse gas (GHG) emissions of Class 8 commercial trucks by being a leading provider of electrified powertrain solutions. Leveraging advanced software algorithms and data analytics capabilities, Hyliion offers fleets an easy, efficient system to decrease fuel and operating expenses while seamlessly integrating with their existing fleet operations. Headquartered in Austin, Texas, Hyliion designs, develops, and sells electrified powertrain solutions that are designed to be installed on most major Class 8 commercial trucks, with the goal of transforming the commercial transportation industry’s environmental impact at scale. For more information, visit www.hyliion.com.

Forward Looking Statements

The information in this press release includes “forward-looking statements” within the meaning of Section 27A of the Securities Act of 1933, as amended, and Section 21E of the Securities Exchange Act of 1934, as amended. All statements, other than statements of present or historical fact included in this press release, regarding Hyliion and its future financial and operational performance, as well as its strategy, future operations, estimated financial position, estimated revenues, and losses, projected costs, prospects, plans and objectives of management are forward looking statements. When used in this press release, including any oral statements made in connection therewith, the words “could,” “should,” “will,” “may,” “believe,” “anticipate,” “intend,” “estimate,” “expect,” “project,” the negative of such terms and other similar expressions are intended to identify forward-looking statements, although not all forward-looking statements contain such identifying words. These forward-looking statements are based on management’s current expectations and assumptions about future events and are based on currently available information as to the outcome and timing of future events. Except as otherwise required by applicable law, Hyliion expressly disclaims any duty to update any forward-looking statements, all of which are expressly qualified by the statements herein, to reflect events or circumstances after the date of this press release. Hyliion cautions you that these forward-looking statements are subject to numerous risks and uncertainties, most of which are difficult to predict and many of which are beyond the control of Hyliion. These risks include, but are not limited to, Hyliion’s ability to disrupt the powertrain market, Hyliion’s focus in 2021 and beyond, the effects of Hyliion’s dynamic and proprietary solutions on its commercial truck customers, accelerated commercialization of the Hypertruck ERX™, the ability to meet 2021 and future product milestones, the impact of COVID-19 on long-term objectives, the ability to reduce carbon intensity and greenhouse gas emissions and the other risks and uncertainties set forth in “Risk Factors” section of Hyliion’s annual report on Form 10-K/A filed with the Securities and Exchange Commission (the “SEC”) on May 17, 2021 for the year ended December 31, 2020. Given these risks and uncertainties, readers are cautioned not to place undue reliance on such forward-looking statements. Should one or more of the risks or uncertainties described in this press release occur, or should underlying assumptions prove incorrect, actual results and plans could different materially from those expressed in any forward-looking statements. Additional information concerning these and other factors that may impact Hyliion’s operations and projections can be found in its filings with the SEC. Hyliion’s SEC Filings are available publicly on the SEC’s website at www.sec.gov, and readers are urged to carefully review and consider the various disclosures made in such filings.


Contacts

Ryann Malone
This email address is being protected from spambots. You need JavaScript enabled to view it.
(833) 495-4466

OKLAHOMA CITY--(BUSINESS WIRE)--Enable Midstream Partners, LP (NYSE: ENBL) announced that the board of directors of its general partner declared today a quarterly cash distribution of $0.16525 per unit on all outstanding common units for the quarter ended June 30, 2021. The distribution is unchanged from the previous quarter. The quarterly cash distribution of $0.16525 per unit on all outstanding common units will be paid Aug. 24, 2021, to unitholders of record at the close of business Aug. 12, 2021.


Enable also announced today that the board declared a quarterly cash distribution of $0.5439 per unit on all Series A Preferred Units for the quarter ended June 30, 2021. The quarterly cash distribution of $0.5439 on all Series A Preferred Units outstanding will be paid Aug. 13, 2021, to unitholders of record at the close of business July 30, 2021.

ABOUT ENABLE MIDSTREAM PARTNERS

Enable owns, operates and develops strategically located natural gas and crude oil infrastructure assets. Enable’s assets include approximately 14,000 miles of natural gas, crude oil, condensate and produced water gathering pipelines, approximately 2.6 Bcf/d of natural gas processing capacity, approximately 7,800 miles of interstate pipelines (including Southeast Supply Header, LLC of which Enable owns 50%), approximately 2,200 miles of intrastate pipelines and seven natural gas storage facilities comprising 84.5 billion cubic feet of storage capacity. For more information, visit https://enablemidstream.com.

This release is intended to be a qualified notice under Treasury Regulation Section 1.1446-4(b). Brokers and nominees should treat one hundred percent (100%) of Enable’s distributions to foreign investors as being attributable to income that is effectively connected with a United States trade or business. Accordingly, Enable’s distributions to foreign investors are subject to federal income tax withholding at the highest applicable effective tax rate. Brokers and nominees, and not Enable, are treated as the withholding agents responsible for withholding on the distributions received by them on behalf of foreign investors.


Contacts

Media and Investor
Matt Beasley
(405) 558-4600

PLANO, Texas--(BUSINESS WIRE)--United Energy (OTCMKTS:UNRG):


United Energy announces a significant shareholder update in corporate direction for the remainder of 2021 and beyond. Embracing its pandemic resiliency while operating quietly throughout the past year, United Energy successfully transitioned its business model to meet the growing global energy demand. Over the last 12 months, UE experienced a change of control and began divesting of lesser performing, non-core assets and marginal oil producing leases. Simultaneously, UE began positioning itself to emerge from the past year as a more robust, diversified energy company. “We haven’t seen this level of excitement in the energy industry in a long time,” stated Brian Guinn, Chairman and CEO of United Energy Corporation. “Going forward, our energy assets will be diversified under three main categories: Exploration and Production, Technology, and Oil and Fuel Storage.”

Today, United Energy announces that the company has purchased a significant combination of assets in the Counties of Rogers, Nowata, Osage and Washington, Oklahoma as well as Montgomery Kansas. The purchases include operated and non-operated oil and gas leases in over 240,000 acres, including 2200+ wells and 1200 miles of natural gas pipelines. This investment represents a key step in UE’s effort to invest heavily in cleaner, more abundant and reliable forms of energy like Natural Gas. “With Natural Gas hitting $4 per mcf last Friday, July 23rd, we feel our timing is very ideal,” explained Rick Coody, COO of United Energy Corporation. UE will provide shareholder updates as it continues to evaluate the leases and their potential.

Additionally, United Energy is announcing it has purchased a minority ownership position in a planned oil and refined fuels storage terminal facility in Louisiana. The project, which hopes to break ground in 2022, will have an initial oil storage capacity of 6.8M barrels of oil and will serve as an important hub of oil transportation and storage to and from the Gulf of Mexico. UE has a desire to increase its involvement and investment in this space and will seriously consider it in the year ahead.

UE is currently evaluating exploration and development opportunities in North Dakota and Montana. “Our new corporate direction can be summed up in three words, Profitability, Responsibility, and Sustainability,” said Brian Guinn.

Forward-Thinking Disclaimer

https://twitter.com/UNRGCorp


Contacts

Media Contact:
Kimberly Stillwagon
This email address is being protected from spambots. You need JavaScript enabled to view it.
214-901-5453

Investor Contact:
Brian Guinn
This email address is being protected from spambots. You need JavaScript enabled to view it.
469-209-5829

LEAWOOD, KS--(BUSINESS WIRE)--This notice provides stockholders of Tortoise Power and Energy Infrastructure Fund, Inc. (NYSE: TPZ) with information regarding the distribution paid on July 30, 2021 and cumulative distribution paid fiscal year-to-date.


The following table sets forth the estimated amounts of the current distribution, payable July 30, 2021 and the cumulative distribution paid this fiscal year to date from the following sources: net investment income, net realized short-term capital gains, net realized long-term capital gains and return of capital. All amounts are expressed per common share.

Tortoise Power and Energy Infrastructure Fund, Inc.


Estimated Sources of Distributions


($) Current
Distribution


% Breakdown
of the Current
Distribution


($) Total Cumulative
Distributions for the
Fiscal Year to Date


% Breakdown of the
Total Cumulative
Distributions for the
Fiscal Year to Date

Net Investment Income

0.0217


43

%


0.1584


40

%

Net Realized Short-Term Capital Gains

0.0007


1

%


0.2416


60

%

Net Realized Long-Term Capital Gains

0.0000


0

%


0.0000


0

%

Return of Capital

0.0276


56

%


0.0000


0

%

Total (per common share)

0.0500


100

%


0.4000


100

%


Average annual total return (in relation to NAV) for the 5 years ending on 6/30/2021


0.89

%

Annualized current distribution rate expressed as a percentage of NAV as of 6/30/2021


3.74

%


Cumulative total return (in relation to NAV) for the fiscal year through 6/30/2021


26.89

%

Cumulative fiscal year distributions as a percentage of NAV as of 6/30/2021


2.49

%

You should not draw any conclusions about TPZ’s investment performance from the amount of this distribution or from the terms of TPZ’s distribution policies.

TPZ estimates that it has distributed more than its income and net realized capital gains; therefore, a portion of your distribution may be a return of capital. A return of capital may occur, for example, when some or all of the money that you invested in TPZ is paid back to you. A return of capital distribution does not necessarily reflect TPZ’s investment performance and should not be confused with "yield" or "income."

The amounts and sources of distributions reported are only estimates and are not being provided for tax reporting purposes. The actual amounts and sources of the amounts for tax reporting purposes will depend upon TPZ's investment experience during the remainder of its fiscal year and may be subject to changes based on tax regulations. TPZ will send you a Form 1099-DIV for the calendar year that will tell you how to report these distributions for federal income tax purposes.

Tortoise Capital Advisors is the Adviser to the Tortoise Power and Energy Infrastructure Fund, Inc.

For additional information on these funds, please visit cef.tortoiseecofin.com.

About Tortoise

Tortoise focuses on energy & power infrastructure and the transition to cleaner energy. Tortoise’s solid track record of energy value chain investment experience and research dates back more than 20 years. As one of the earliest investors in midstream energy, Tortoise believes it is well-positioned to be at the forefront of the global energy evolution that is underway. With a steady wins approach and a long-term perspective, Tortoise strives to make a positive impact on clients and communities. To learn more, please visit www.TortoiseEcofin.com.

Cautionary Statement Regarding Forward-Looking Statements

This press release contains certain statements that may include “forward-looking statements” within the meaning of Section 27A of the Securities Act of 1933 and Section 21E of the Securities Exchange Act of 1934. All statements, other than statements of historical fact, included herein are "forward-looking statements." Although the funds and Tortoise Capital Advisors believe that the expectations reflected in these forward-looking statements are reasonable, they do involve assumptions, risks and uncertainties, and these expectations may prove to be incorrect. Actual results could differ materially from those anticipated in these forward-looking statements as a result of a variety of factors, including those discussed in the fund’s reports that are filed with the Securities and Exchange Commission. You should not place undue reliance on these forward-looking statements, which speak only as of the date of this press release. Other than as required by law, the funds and Tortoise Capital Advisors do not assume a duty to update this forward-looking statement.

Safe Harbor Statement

This press release shall not constitute an offer to sell or a solicitation to buy, nor shall there be any sale of these securities in any state or jurisdiction in which such offer or solicitation or sale would be unlawful prior to registration or qualification under the laws of such state or jurisdiction.


Contacts

Maggie Zastrow, (913) 981-1020
This email address is being protected from spambots. You need JavaScript enabled to view it.

WASHINGTON--(BUSINESS WIRE)--Summit Oil and Shipping Co. Ltd. (“SOSCL”), the first and largest private sector importer and supplier of fuel oil to Bangladesh, announced today that it has signed a Memorandum of Understanding (MOU) with Commonwealth LNG to collaborate in the supply of LNG to Asia, including Bangladesh. SOSCL is part of the Summit Group, Bangladesh’s largest infrastructure conglomerate.


The scope of the MOU includes SOSCL potentially contracting for 1 million tons per year (MTPA) of LNG offtake, for a term of up to 20 years, from Commonwealth’s 8.4 MTPA facility currently under development in Cameron, Louisiana.

SOSCL’s associated companies within Summit Group have approximately 3 GW of gas-to-power electricity in operation or development within the Indian subcontinent, and operate a 500 mmcf/d Floating Storage and Regasification Unit (FSRU) and LNG terminal under Summit LNG Terminal Co (Pvt) Ltd (“SLNG”) in Moheshkhali, Cox’s Bazar, Bangladesh.

“We’re proud of what this step means towards securing this major source of clean energy for the growing economy of Bangladesh,” said Farid Khan, Vice Chairman of Summit Group. “We look forward to having Commonwealth LNG as a partner that can deliver U.S.-sourced LNG, providing diversification of supply for Bangladesh and the pricing stability associated with Henry Hub.”

From Commonwealth LNG’s perspective, President and CEO Paul Varello said the MOU is evidence of just how aligned the parties are in achieving their shared objectives.

“Commonwealth’s focus on producing the lowest-cost liquefaction in the U.S. remains important in a highly competitive global market,” said Varello. “This becomes even more critical for a rapidly emerging economy such as Bangladesh where the need for additional energy is critical for sustaining its economic growth. Summit has recognized that need and Commonwealth LNG looks forward to partnering in these efforts.”

Commonwealth is implementing an accelerated construction schedule that will allow the project to be built in three years using a predominantly modular approach with major components being fabricated offsite.

About Commonwealth LNG

Commonwealth LNG is an 8.4 MTPA liquefied natural gas (LNG) export terminal project located on the Calcasieu River at the Gulf of Mexico near Cameron, Louisiana. The project’s leadership team is committed to building a world-class LNG facility by staying relentlessly focused on managing risk and lowering capital cost.

Website: www.CommonwealthLNG.com
Linkedin: https://www.linkedin.com/company/commonwealth-lng/

About Summit Oil and Shipping Company Limited

Incorporated in 1998, Summit Oil & Shipping Co. Ltd. (“SOSCL”) is a leading private sector company in Bangladesh engaged in shipping, trading, importing, storing and supplying of fuel oil to the nation’s power generation sector.

Website: www.SOSCL.net
Facebook: https://www.facebook.com/SummitOilShipping


Contacts

Media Inquiries:

Commonwealth LNG
Lyle Hanna
Director of Communications
Ph: 346-352-4436
Email: This email address is being protected from spambots. You need JavaScript enabled to view it.

Summit Corporation Limited
Mohsena Hassan
Head of Public Relations & Media
Whatsapp/Ph: +880 1713 081 905
Email: This email address is being protected from spambots. You need JavaScript enabled to view it.

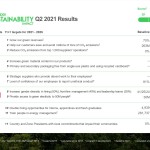
RUEIL-MALMAISON, France--(BUSINESS WIRE)--Schneider Electric, the leader in the digital transformation of energy management and automation, published today its half-year progress overview on setting up and advancing on its 2021-2025 sustainability impact targets. Schneider Electric, named as the world’s most sustainable corporation 2021 by the Corporate Knights Global 100 Index, announced the acceleration of its sustainability strategy in January, aligned to its commitments regarding climate, resources, trust, equal opportunities, generations, and local communities.


Since then, the Group has successfully launched The Zero Carbon Project, its initiative to halve carbon emissions of its top supply chain partners by 2025, a call to action already joined by 91% of them. By engaging, training, and supporting the sustainable transformation of each of its 1,000 partners, the Group will sharply reduce its Scope 3 emissions. 917 suppliers have now been trained and are ready to drive climate action as part of this project.

As the digital partner for efficiency and sustainability, Schneider Electric also continues to support its customers in attaining their own sustainability goals, with digital innovation and solutions. The Roca Group has recently opted for Schneider Electric's climate change consulting services to accelerate their transformation. Since 2018, Schneider has helped its customers save and avoid 302 million tons of CO2 emissions.

“A successful sustainability program can only be built on trust and engagement.” said Olivier Blum, Schneider Electric’s Chief Strategy and Sustainability Officer. “It’s very encouraging to see such a high-level mobilization from our supply chain partners in our decarbonization journey, as well as that of our customers and employees – all of whom count on our unique expertise and experience in this field.”

With regards to local initiatives, 100% of Schneider Electric’s country and zone presidents have identified and established all their local targets for 2025, confirming strong engagement and commitment from around the globe to deliver always more meaningful sustainability impact.

Find out more on Schneider Sustainability Impact, results and highlights:

Schneider Electric’s Environmental, Social and Governance (ESG):

Latest Schneider Electric’s Sustainability awards and rankings:

About Schneider Electric

Schneider’s purpose is to empower all to make the most of our energy and resources, bridging progress and sustainability for all. We call this Life Is On.

Our mission is to be your digital partner for Sustainability and Efficiency.

We drive digital transformation by integrating world-leading process and energy technologies, end-point to cloud connecting products, controls, software and services, across the entire lifecycle, enabling integrated company management, for homes, buildings, data centers, infrastructure and industries.

We are the most local of global companies. We are advocates of open standards and partnership ecosystems that are passionate about our shared Meaningful Purpose, Inclusive and Empowered values.

www.se.com

Discover Life Is On

Follow us on: Twitter | Facebook | LinkedIn | YouTube | Instagram | Blog

Hashtags: #LifeIsOn #Sustainability #SRI #OurImpact


Contacts

Schneider Electric Media Relations
Sophie Souquet
E mail: This email address is being protected from spambots. You need JavaScript enabled to view it.

And annual expenditures with diverse suppliers increased 41 percent over the five-year period

CHICAGO--(BUSINESS WIRE)--Exelon spent $11.2 billion with diverse-certified suppliers across its enterprise from 2016-2020, while Exelon’s 2020 $2.7 billion spend alone supported 19,967 jobs and generated an incremental $3.6 billion in revenue and $1.1 billion in wages for local businesses in communities the company serves. These and other findings are included in the 2020 Exelon Diverse Business Empowerment (EDBE) Annual Report. The expenditures spanned the entire business, including Exelon’s six electric and gas utilities, Exelon Generation and Constellation.


“One of the best ways we can support diversity is to ensure that our dollars are spent with businesses that reflect the diversity we see in the communities we serve,” said Bridget Reidy, executive vice president and COO, Exelon, “We strive to apply these same ideals in everything we do, from how we build our workforce to the investments we make in nonprofit organizations across our service territories. It’s not just the right thing to do, but it also makes us a better, stronger and more responsive company.”

Exelon operates in some of the nation’s largest and most ethnically diverse metropolitan areas, including Baltimore, Chicago, Washington, D.C., and Philadelphia.

Some additional information about Exelon’s diverse spend from the 2020 Supplier Diversity Report:

  • 2020 diversity-certified supplier spend was $2.7 billion, an increase of $346.9 million, or 13 percent, over 2019
  • 63 percent of the total was spent locally in Exelon's key operating areas – Illinois, Pennsylvania, Maryland, New Jersey, Delaware, District of Columbia and Texas – where its businesses are most heavily concentrated
  • 71 percent of the total diversity-certified supplier spend was with Tier 1 contractors, which are defined as diverse contractors with a direct supply contract with Exelon
  • 2020 Tier 1 spend increased $183 million over the 2019 Tier 1 diversity-certified supplier expenditures

Click here to access the full 2020 Exelon Diverse Business Empowerment (EDBE) Report.

About Exelon

Exelon Corporation (Nasdaq: EXC) is a Fortune 100 energy company with the largest number of electricity and natural gas customers in the U.S. Exelon does business in 48 states, the District of Columbia and Canada and had 2020 revenue of $33 billion Exelon serves approximately 10 million customers in Delaware, the District of Columbia, Illinois, Maryland, New Jersey and Pennsylvania through its Atlantic City Electric, BGE, ComEd, Delmarva Power, PECO and Pepco subsidiaries. Exelon is one of the largest competitive U.S. power generators, with more than 31,000 megawatts of nuclear, gas, wind, solar and hydroelectric generating capacity comprising one of the nation’s cleanest and lowest-cost power generation fleets. The company’s Constellation business unit provides energy products and services to approximately 2 million residential, public sector and business customers, including three fourths of the Fortune 100. Follow Exelon on Twitter @Exelon.


Contacts

Liz Keating
Corporate Communications
312-394-4111
This email address is being protected from spambots. You need JavaScript enabled to view it.

Company Has Reached Civil Settlements with Shasta County and Continues to Work to Settle Additional Civil Cases  

PG&E CEO Says Company Committed to Making Profound Changes to Keep Customers and Communities Safe

SAN FRANCISCO,--(BUSINESS WIRE)--PG&E Corporation (NYSE: PCG) shared the following statements today in regard to the announcement by the Shasta County District Attorney’s office that it will file criminal charges against PG&E related to the 2020 Zogg Fire.

“The loss of life and devastation in the communities impacted by the 2020 Zogg Fire is heartbreaking, and we recognize that nothing can heal the hearts of those who have lost so much. We thank the courageous first responders who saved lives, protected property and worked to contain and put out the fire last year.

The company already has resolved civil claims with Shasta County and continues to reach settlements with individual victims and their families impacted by the Zogg Fire in an effort to make it right. We do not, however, agree with the District Attorney’s conclusion that criminal charges are warranted given the facts of this case.

We remain committed to doing everything we can to keep our customers and communities safe.”

PG&E Corporation Chief Executive Officer Patti Poppe said, “I came to PG&E earlier this year to ensure that we make it right for those who have been impacted, and make it safe for the communities we are privileged to serve. We have taken a safety stand that everyone and everything is always safe, and we are determined to deliver on that promise.”

New Undergrounding Initiative: Make It Safe/Bury the Lines

PG&E recently announced a major new initiative to expand the undergrounding of electric distribution power lines in High Fire Threat Districts (HFTD) to further harden its system and help prevent wildfires. The new infrastructure safety initiative is a multi-year effort to underground approximately 10,000 miles of power lines.

PG&E’s Commitment to Wildfire Safety

PG&E’s multi-faceted Community Wildfire Safety Program (CWSP) includes short-, medium- and long-term action plans to further reduce wildfire risk and keep our customers and communities safe.

Since 2018, its wildfire safety work has resulted in:

  • Multiple inspections of distribution, transmission and substation equipment in the Tier 2 and Tier 3 high fire-threat areas;
  • Hardening more than 600 miles of its system with stronger lines and poles to better withstand severe weather;
  • Conducting enhanced vegetation safety work on nearly 5,000 line miles in high fire-threat areas (This is in addition to the more than 5 million trees that PG&E has trimmed or removed as part of its routine vegetation management efforts);
  • Installing more than 1,000 sectionalizing devices and switches that limit the risk of wildfires and size of Public Safety Power Shutoff outages;
  • Installing more than 1,150 advanced weather stations to help gather more data and information, so PG&E can better predict and respond to extreme weather threats;
  • Installing than 400 high-definition cameras to monitor and respond to wildfires;
  • Securing more than 65 helicopters reserved to quickly restore power after severe weather;
  • Monitoring wildfire threats in real-time through a dedicated team at PG&E’s Wildfire Safety Operations Center, which is staffed 24 hours a day during wildfire season.

Ongoing PG&E Wildfire Mitigation and Resiliency Efforts

In addition to significantly expanding its undergrounding, PG&E’s ongoing safety work to enhance grid resilience and address the growing threat of severe weather and wildfires continues on a risk-based and data-driven basis, as outlined in PG&E's 2021 Wildfire Mitigation Plan (WMP).

This includes:

Learn more about PG&E’s wildfire safety efforts by visiting pge.com/wildfiresafety.

About PG&E Corporation

(NYSE: PCG) is the parent company of Pacific Gas and Electric Company, a combined natural gas and electric utility serving more than 16 million people across 70,000 square miles in Northern and Central California. For more information, visit pgecorp.com.


Contacts

Investor Relations Contact: 415.972.7080 | Media Inquiries Contact: 415.973.5930


HOUSTON--(BUSINESS WIRE)--Magnolia Oil & Gas Corporation (NYSE: MGY) announced today that its Board of Directors declared a semi-annual interim cash dividend of $0.08 per share of Class A common stock, and a cash distribution of $0.08 per Class B unit payable on September 1, 2021 to shareholders of record as of August 12, 2021.


We believe this dividend payment level is secure and sustainable with oil prices at approximately half their current levels. Magnolia expects to announce the remaining portion of its total annual dividend payment next February in conjunction with the release of our full-year 2021 financial results. The second portion of our annual dividend payment will be based on our 2021 results and our long-term view of product prices.

“Our dividend framework is aligned with the characteristics of our business model,” said Steve Chazen, Magnolia’s Chairman, President and CEO. “These principles include maintaining our low leverage, limiting our capital spending to allow for consistent and sizable free cash flow generation while providing moderate volume growth and strong pre-tax margins. Part of Magnolia’s total shareholder return proposition is to establish a differentiated approach toward paying a regular and sustainable dividend that will grow over time as we continue to execute our business plan.”

About Magnolia Oil & Gas

Magnolia is a publicly traded oil and gas exploration and production company with operations primarily in South Texas in the core of the Eagle Ford Shale and Austin Chalk formations. Magnolia focuses on generating value for shareholders through steady production growth, strong pre-tax margins, and free cash flow. For more information, visit www.magnoliaoilgas.com.


Contacts

Brian Corales
713-842-9036
This email address is being protected from spambots. You need JavaScript enabled to view it.

  • Earnings of $3.1 billion; adjusted earnings of $3.3 billion
  • Cash flow from operations of $7.0 billion; free cash flow of $5.2 billion
  • Resuming share repurchases, targeted at $2-3 billion per year

SAN RAMON, Calif.--(BUSINESS WIRE)--Chevron Corporation (NYSE: CVX) today reported earnings of $3.1 billion ($1.60 per share - diluted) for second quarter 2021, compared with a loss of $8.3 billion ($(4.44) per share - diluted) in second quarter 2020. Included in the current quarter were remediation charges associated with previously sold assets of $120 million and pension settlement costs of $115 million. Foreign currency effects increased earnings by $43 million. Adjusted earnings of $3.3 billion ($1.71 per share - diluted) in second quarter 2021 compares to an adjusted loss of $2.9 billion ($(1.56) per share - diluted) in second quarter 2020. For a reconciliation of adjusted earnings/(loss), see Attachment 5.


Sales and other operating revenues in second quarter 2021 were $36 billion, compared to $16 billion in the year-ago period.

Earnings Summary


Three Months
Ended June 30


Six Months
Ended June 30


Millions of dollars


2021


2020


2021


2020


Earnings by business segment


Upstream


$3,178


$(6,089)


$5,528


$(3,169)


Downstream


839


(1,010)


844


93


All Other


(935)


(1,171)


(1,913)


(1,595)


Total (1)(2)


$3,082


$(8,270)


$4,459


$(4,671)


(1) Includes foreign currency effects


$43


$(437)


$41


$77


(2) Net income attributable to Chevron Corporation (See Attachment 1)


“Second quarter earnings were strong, reflecting improved market conditions, combined with transformation benefits and merger synergies,” said Mike Wirth, Chevron’s chairman and chief executive officer.

“Our free cash flow was the highest in two years due to solid operational and financial performance and lower capital spending,” Wirth added. “We will resume share repurchases in the third quarter at an expected rate of $2-3 billion per year.”

Chevron continued to exercise capital discipline with year-to-date capital spending down 32 percent from a year ago. The company recently sanctioned the Jansz-lo Compression project in Australia, which is expected to maintain an important source of clean-burning natural gas. GS Caltex, a 50 percent owned equity affiliate, also started up an olefins mixed-feed cracker and associated polyethylene unit at its Yeosu, South Korea refinery ahead of schedule and under budget.

In the second quarter, Chevron continued to pursue the development of renewable and lower carbon fuels. The company began to produce renewable diesel at its El Segundo, California refinery by co-processing bio-feedstock. The company also established its first branded compressed natural gas (CNG) station as part of its plan to sell renewable natural gas through more than 30 CNG stations in California by 2025. In addition, the company announced separate agreements to collaborate with Toyota Motor North America, Inc. and Cummins Inc. to advance its goal of building a commercially viable, large-scale hydrogen business.

UPSTREAM

Worldwide net oil-equivalent production was 3.13 million barrels per day in second quarter 2021, an increase of 5 percent from a year ago.

U.S. Upstream


Three Months
Ended June 30


Six Months
Ended June 30


Millions of dollars


2021


2020


2021


2020


Earnings

$

1,446


$

(2,066

)


$

2,387


$

(1,825

)


U.S. upstream operations earned $1.4 billion in second quarter 2021, compared with a loss of $2.1 billion a year earlier. The improvement was primarily due to higher crude oil realizations and the absence of second quarter 2020 charges for special items including impairments, write-offs and severance accruals. Higher crude oil production also contributed to the improvement between periods.

The company’s average sales price per barrel of crude oil and natural gas liquids was $54 in second quarter 2021, up from $19 a year earlier. The average sales price of natural gas was $2.16 per thousand cubic feet in second quarter 2021, up from $0.81 in last year’s second quarter.

Net oil-equivalent production of 1.14 million barrels per day in second quarter 2021 was up 145,000 barrels per day from a year earlier. The increase was due to an additional 227,000 barrels per day of production following the Noble Energy acquisition and lower production curtailments, partially offset by a 68,000 barrels per day decrease related to the Appalachian asset sale and lower production due to normal field declines. The net liquids component of oil-equivalent production in second quarter 2021 increased 15 percent to 857,000 barrels per day, and net natural gas production also increased 15 percent to 1.68 billion cubic feet per day, compared to last year’s second quarter.

International Upstream


Three Months
Ended June 30


Six Months
Ended June 30


Millions of dollars


2021


2020


2021


2020


Earnings*

$

1,732


$

(4,023

)


$

3,141


$

(1,344

)


*Includes foreign currency effects


$

78


$

(262

)


$

26


$

206


International upstream operations earned $1.7 billion in second quarter 2021, compared with a loss of $4.0 billion a year ago. The increase in earnings was primarily due to the absence of second quarter 2020 special item charges and benefits including write-offs and impairments, severance charges, tax items and the gain on the Azerbaijan asset sale as well as higher current quarter crude oil realizations. Foreign currency effects had a favorable impact on earnings of $340 million between periods.

The average sales price for crude oil and natural gas liquids in second quarter 2021 was $62 per barrel, up from $21 a year earlier. The average sales price of natural gas was $4.92 per thousand cubic feet in the second quarter, up from $4.48 in last year’s second quarter.

Net oil-equivalent production of 1.99 million barrels per day in second quarter 2021 decreased slightly from second quarter 2020. Higher production of an additional 148,000 barrels per day following the Noble Energy acquisition and lower production curtailments were more than offset by unfavorable entitlement effects and operational impacts. The net liquids component of oil-equivalent production decreased 8 percent to 990,000 barrels per day in second quarter 2021, while net natural gas production of 5.99 billion cubic feet per day increased 8 percent, compared to last year's second quarter.

DOWNSTREAM

U.S. Downstream


Three Months
Ended June 30


Six Months
Ended June 30


Millions of dollars


2021


2020


2021


2020


Earnings

$

776


$

(988

)


$

646


$

(538

)


U.S. downstream operations reported earnings of $776 million in second quarter 2021, compared with a loss of $988 million a year earlier. The increase was mainly due to higher margins on refined product sales, higher earnings from the 50 percent-owned Chevron Phillips Chemical Company, higher sales volumes, and lower operating expenses, including the absence of second quarter 2020 severance accruals.

Refinery crude oil input in second quarter 2021 increased 65 percent to 956,000 barrels per day from the year-ago period, as the company increased refinery runs in response to higher demand and the improved refining margin environment.

Refined product sales of 1.16 million barrels per day were up 40 percent from the year-ago period, mainly due to higher gasoline and jet fuel demand as travel restrictions associated with the COVID-19 pandemic eased.

International Downstream


Three Months
Ended June 30


Six Months
Ended June 30


Millions of dollars


2021


2020


2021


2020


Earnings*

$63


$(22)


$198


$631


*Includes foreign currency effects


$1


$(23)


$60


$37


International downstream operations reported earnings of $63 million in second quarter 2021, compared with a loss of $22 million a year earlier. The increase in earnings was largely due to the absence of second quarter 2020 severance accruals. Foreign currency effects had a favorable impact on earnings of $24 million between periods.

Refinery crude oil input of 580,000 barrels per day in second quarter 2021 decreased 2 percent from the year-ago period.

Refined product sales of 1.28 million barrels per day in second quarter 2021 increased 16 percent from the year-ago period, mainly due to higher gasoline, jet fuel and diesel demand.

ALL OTHER


Three Months
Ended June 30


Six Months
Ended June 30


Millions of dollars


2021


2020


2021


2020


Net Charges*

$

(935

)


$

(1,171

)


$

(1,913

)


$

(1,595

)


*Includes foreign currency effects


$

(36

)


$

(152

)


$

(45

)


$

(166

)


All Other consists of worldwide cash management and debt financing activities, corporate administrative functions, insurance operations, real estate activities and technology companies.

Net charges in second quarter 2021 were $935 million, compared to $1.2 billion a year earlier. The decrease in net charges between periods was mainly due to the absence of second quarter 2020 severance accruals, partially offset by higher tax items and pension settlement costs. Foreign currency effects decreased net charges by $116 million between periods.

CASH FLOW FROM OPERATIONS

Cash flow from operations in the first six months of 2021 was $11.2 billion, compared with $4.8 billion in 2020. Excluding working capital effects, cash flow from operations in the first six months of 2021 was $12.2 billion, compared with $5.2 billion in 2020.

CAPITAL AND EXPLORATORY EXPENDITURES

Capital and exploratory expenditures in the first six months of 2021 were $5.3 billion, compared with $7.7 billion in 2020. The amounts included $1.5 billion in 2021 and $2.3 billion in 2020 for the company’s share of expenditures by affiliates, which did not require cash outlays by the company. Expenditures for upstream represented 84 percent of the company-wide total in 2021.

Chevron is one of the world’s leading integrated energy companies. We believe affordable, reliable and ever-cleaner energy is essential to achieving a more prosperous and sustainable world. Chevron produces crude oil and natural gas; manufactures transportation fuels, lubricants, petrochemicals and additives; and develops technologies that enhance our business and the industry. To advance a lower-carbon future, we are focused on cost efficiently lowering our carbon intensity, increasing renewables and offsets in support of our business, and investing in low-carbon technologies that enable commercial solutions.

NOTICE

Chevron’s discussion of second quarter 2021 earnings with security analysts will take place on Friday, July 30, 2021, at 8:00 a.m. PT. A webcast of the meeting will be available in a listen-only mode to individual investors, media, and other interested parties on Chevron’s website at www.chevron.com under the “Investors” section. Prepared remarks for today’s call, additional financial and operating information and other complementary materials will be available prior to the call at approximately 3:15 a.m. PT and located under “Events and Presentations” in the “Investors” section on the Chevron website.

As used in this news release, the term “Chevron” and such terms as “the company,” “the corporation,” “our,” “we,” “us” and “its” may refer to Chevron Corporation, one or more of its consolidated subsidiaries, or to all of them taken as a whole. All of these terms are used for convenience only and are not intended as a precise description of any of the separate companies, each of which manages its own affairs.

Please visit Chevron’s website and Investor Relations page at www.chevron.com and www.chevron.com/investors, LinkedIn: www.linkedin.com/company/chevron, Twitter: @Chevron, Facebook: www.facebook.com/chevron, and Instagram: www.instagram.com/chevron, where Chevron often discloses important information about the company, its business, and its results of operations.

Non-GAAP Financial Measures - This news release includes adjusted earnings/(loss), which reflect earnings or losses excluding significant non-operational items including impairment charges, write-offs, severance costs, Noble Energy acquisition costs, gains on asset sales, unusual tax items, effects of pension settlements and curtailments, foreign currency effects and other special items. During the first quarter of 2021, the Company updated its calculation of adjusted earnings to exclude pension settlement costs. The Company recognizes settlement gains or losses when the cost of all settlements for a plan during a year is greater than the sum of its service and interest costs during the year. By adjusting earnings to exclude pension settlement costs, the Company believes it removes non-operational costs that would otherwise obscure its underlying operating results. Adjusted earnings/(loss) for 2020 were recast to conform with the current presentation. We believe it is useful for investors to consider this measure in comparing the underlying performance of our business across periods. The presentation of this additional information is not meant to be considered in isolation or as a substitute for net income (loss) as prepared in accordance with U.S. GAAP. A reconciliation to net income (loss) attributable to Chevron Corporation is shown in Attachment 5.

This news release also includes free cash flow and free cash flow excluding working capital. Free cash flow is defined as net cash provided by operating activities less cash capital expenditures, and represents the cash available to creditors and investors after investing in the business. Free cash flow excluding working capital is defined as net cash provided by operating activities excluding working capital less cash capital expenditures and represents the cash available to creditors and investors after investing in the business excluding the timing impacts of working capital. The company believes these measures are useful to monitor the financial health of the company and its performance over time. A reconciliation of free cash flow and free cash flow excluding working capital are shown in Attachment 3.

CAUTIONARY STATEMENTS RELEVANT TO FORWARD-LOOKING INFORMATION FOR THE PURPOSE OF “SAFE HARBOR” PROVISIONS OF THE PRIVATE SECURITIES LITIGATION REFORM ACT OF 1995

This news release contains forward-looking statements relating to Chevron’s operations that are based on management's current expectations, estimates and projections about the petroleum, chemicals and other energy-related industries. Words or phrases such as “anticipates,” “expects,” “intends,” “plans,” “targets,” “advances,” “commits,” “drives,” “aims,” “forecasts,” “projects,” “believes,” “approaches,” “seeks,” “schedules,” “estimates,” “positions,” “pursues,” “may,” “can,” “could,” “should,” “will,” “budgets,” “outlook,” “trends,” “guidance,” “focus,” “on track,” “goals,” “objectives,” “strategies,” “opportunities,” “poised,” “potential” and similar expressions are intended to identify such forward-looking statements. These statements are not guarantees of future performance and are subject to certain risks, uncertainties and other factors, many of which are beyond the company’s control and are difficult to predict. Therefore, actual outcomes and results may differ materially from what is expressed or forecasted in such forward-looking statements. The reader should not place undue reliance on these forward-looking statements, which speak only as of the date of this news release. Unless legally required, Chevron undertakes no obligation to update publicly any forward-looking statements, whether as a result of new information, future events or otherwise.

Among the important factors that could cause actual results to differ materially from those in the forward-looking statements are: changing crude oil and natural gas prices and demand for our products, and production curtailments due to market conditions; crude oil production quotas or other actions that might be imposed by the Organization of Petroleum Exporting Countries and other producing countries; public health crises, such as pandemics (including coronavirus (COVID-19)) and epidemics, and any related government policies and actions; changing economic, regulatory and political environments in the various countries in which the company operates; general domestic and international economic and political conditions; changing refining, marketing and chemicals margins; the company’s ability to realize anticipated cost savings, expenditure reductions and efficiencies associated with enterprise transformation initiatives; actions of competitors or regulators; timing of exploration expenses; timing of crude oil liftings; the competitiveness of alternate-energy sources or product substitutes; technological developments; the results of operations and financial condition of the company’s suppliers, vendors, partners and equity affiliates, particularly during extended periods of low prices for crude oil and natural gas during the COVID-19 pandemic; the inability or failure of the company’s joint-venture partners to fund their share of operations and development activities; the potential failure to achieve expected net production from existing and future crude oil and natural gas development projects; potential delays in the development, construction or start-up of planned projects; the potential disruption or interruption of the company’s operations due to war, accidents, political events, civil unrest, severe weather, cyber threats, terrorist acts, or other natural or human causes beyond the company’s control; the potential liability for remedial actions or assessments under existing or future environmental regulations and litigation; significant operational, investment or product changes undertaken or required by existing or future environmental statutes and regulations, including international agreements and national or regional legislation and regulatory measures to limit or reduce greenhouse gas emissions; the potential liability resulting from pending or future litigation; the company's ability to achieve the anticipated benefits from the acquisition of Noble Energy, Inc.; the company’s future acquisitions or dispositions of assets or shares or the delay or failure of such transactions to close based on required closing conditions; the potential for gains and losses from asset dispositions or impairments; government mandated sales, divestitures, recapitalizations, taxes and tax audits, tariffs, sanctions, changes in fiscal terms or restrictions on scope of company operations; foreign currency movements compared with the U.S. dollar; material reductions in corporate liquidity and access to debt markets; the receipt of required Board authorizations to pay future dividends; the effects of changed accounting rules under generally accepted accounting principles promulgated by rule-setting bodies; the company’s ability to identify and mitigate the risks and hazards inherent in operating in the global energy industry; and the factors set forth under the heading “Risk Factors” on pages 18 through 23 of the company's 2020 Annual Report on Form 10-K and in other subsequent filings with the U.S. Securities and Exchange Commission. Other unpredictable or unknown factors not discussed in this news release could also have material adverse effects on forward-looking statements.

CHEVRON CORPORATION - FINANCIAL REVIEW

Attachment 1

(Millions of Dollars, Except Per-Share Amounts)


(unaudited)


CONSOLIDATED STATEMENT OF INCOME


Three Months

Ended June 30


Six Months

Ended June 30

REVENUES AND OTHER INCOME

2021


2020


2021


2020


Sales and other operating revenues

$

36,117


$

15,926


$

67,193


$

45,631


Income (loss) from equity affiliates

1,442


(2,515

)


2,353


(1,550

)


Other income (loss)

38


83


80


914


Total Revenues and Other Income

37,597


13,494


69,626


44,995


COSTS AND OTHER DEDUCTIONS


Purchased crude oil and products

20,629


8,144


38,197


23,653


Operating expenses *

6,160


7,198


12,454


13,270


Exploration expenses

113


895


199


1,053


Depreciation, depletion and amortization

4,522


6,717


8,808


11,005


Taxes other than on income

1,566


965


2,986


2,132


Interest and debt expense

185


172


383


334


Total Costs and Other Deductions

33,175


24,091


63,027


51,447


Income (Loss) Before Income Tax Expense

4,422


(10,597

)


6,599


(6,452

)


Income tax expense (benefit)

1,328


(2,320

)


2,107


(1,756

)


Net Income (Loss)

3,094


(8,277

)


4,492


(4,696

)


Less: Net income (loss) attributable to noncontrolling interests

12


(7

)


33


(25

)


NET INCOME (LOSS) ATTRIBUTABLE TO

CHEVRON CORPORATION

$

3,082


$

(8,270

)


$

4,459


$

(4,671

)


* Includes operating expense, selling, general and administrative expense, and other components of net periodic benefit costs


PER-SHARE OF COMMON STOCK


Net Income (Loss) Attributable to Chevron Corporation


- Basic

$

1.61


$

(4.44

)


$

2.33


$

(2.51

)


- Diluted

$

1.60


$

(4.44

)


$

2.32


$

(2.51

)


Weighted Average Number of Shares Outstanding (000's)


- Basic

1,917,536


1,853,313


1,915,243


1,857,793


- Diluted

1,921,958


1,853,313


1,918,940


1,857,793


CHEVRON CORPORATION - FINANCIAL REVIEW

Attachment 2

(Millions of Dollars)


(unaudited)


EARNINGS BY MAJOR OPERATING AREA

Three Months

Ended June 30


Six Months

Ended June 30


2021


2020


2021


2020


Upstream


United States

$

1,446


$

(2,066

)


$

2,387


$

(1,825

)


International

1,732


(4,023

)


3,141


(1,344

)


Total Upstream

3,178


(6,089

)


5,528


(3,169

)


Downstream


United States

776


(988

)


646


(538

)


International

63


(22

)


198


631


Total Downstream

839


(1,010

)


844


93


All Other (1)

(935

)


(1,171

)


(1,913

)


(1,595

)


Total (2)

$

3,082


$

(8,270

)


$

4,459


$

(4,671

)


SELECTED BALANCE SHEET ACCOUNT DATA (Preliminary)


June 30,
2021


Dec 31,
2020

Cash and Cash Equivalents


$

7,527


$

5,596


Marketable Securities


$

34


$

31


Total Assets


$

242,806


$

239,790


Total Debt


$

43,018


$

44,315


Total Chevron Corporation Stockholders' Equity


$

133,182


$

131,688


Three Months
Ended June 30


Six Months
Ended June 30

CAPITAL AND EXPLORATORY EXPENDITURES(3)

2021


2020


2021


2020

United States


Upstream

$

1,074


$

1,011


$

2,123


$

3,028


Downstream

264


178


506


454


Other

31


45


83


139


Total United States

1,369


1,234


2,712


3,621


International


Upstream

1,237


1,496


2,296


3,380


Downstream

174


573


272


721


Other

6


3


10


8


Total International

1,417


2,072


2,578


4,109


Worldwide

$

2,786


$

3,306


$

5,290


$

7,730


(1) Includes worldwide cash management and debt financing activities, corporate administrative functions, insurance operations, real estate activities, and technology companies.


(2) Net Income (Loss) Attributable to Chevron Corporation (See Attachment 1).


(3) Includes interest in affiliates:


United States

$

80


$

56


$

166


$

175


International

769


1,019


1,361


2,083


Total

$

849


$

1,075


$

1,527


$

2,258


CHEVRON CORPORATION - FINANCIAL REVIEW

Attachment 3

(Billions of Dollars)


(unaudited)


SUMMARIZED STATEMENT OF CASH FLOWS (Preliminary)(1)


Three Months
Ended June 30


Six Months
Ended June 30

OPERATING ACTIVITIES

2021


2021


2020


Net Income (Loss)

$

3.1


$

4.5


$

(4.7

)


Adjustments


Depreciation, depletion and amortization

4.5


8.8


11.0


Distributions more (less) than income from equity affiliates

(0.9

)


(1.4

)


2.3


Loss (gain) on asset retirements and sales


(0.1

)


(0.6

)


Net foreign currency effects


0.2


Deferred income tax provision

0.1


(0.2

)


(2.5

)


Net decrease (increase) in operating working capital

(0.1

)


(1.0

)


(0.4

)


Other operating activity

0.3


0.4


(0.2

)


Net Cash Provided by Operating Activities

$

7.0


$

11.2


$

4.8


INVESTING ACTIVITIES


Capital expenditures

(1.8

)


(3.5

)


(5.2

)


Proceeds and deposits related to asset sales and returns of investment

0.2


0.4


1.9


Other investing activity(2)


(1.1

)


Net Cash Used for Investing Activities

$

(1.6

)


$

(3.1

)


$

(4.4

)


FINANCING ACTIVITIES


Net change in debt

(2.5

)


(1.3

)


7.0


Cash dividends — common stock

(2.6

)


(5.0

)


(4.8

)


Net sales (purchases) of treasury shares

0.1


0.4


(1.6

)


Distributions to noncontrolling interests


Net Cash Provided by (Used for) Financing Activities

$

(4.9

)


$

(6.0

)


$

0.6


EFFECT OF EXCHANGE RATE CHANGES ON CASH, CASH EQUIVALENTS AND RESTRICTED CASH


(0.1

)


(0.1

)


NET CHANGE IN CASH, CASH EQUIVALENTS AND RESTRICTED CASH

$

0.4


$

2.0


$

0.9


(1) Totals may not match sum of parts due to presentation in billions.


(2) Primarily borrowings of loans by equity affiliates.


RECONCILIATION OF NON-GAAP MEASURES


Net Cash Provided by Operating Activities

$

7.0


$

11.2


$

4.8


Less: Capital expenditures

1.8


3.5


5.2


Free Cash Flow

$

5.2


$

7.7


$

(0.4

)


Less: Net decrease (increase) in operating working capital

(0.1

)


(1.0

)


(0.4

)


Free Cash Flow Excluding Working Capital

$

5.3


$

8.7


$


Contacts

Sean Comey -- +1 925-842-5509


Read full story here

KUALA LUMPUR, Malaysia--(BUSINESS WIRE)--Mudrock Media will present at Gastech 2021 exhibition, the first major energy event to take place live & in-person from September 21-23, 2021 at Dubai World Trade Centre, United Arab Emirates, and the 28th World Gas Conference (WGC2022) from May 23-27, 2022 in Daegu, South Korea. Mudrock Media will hand out 3,000 complimentary copies of printed Oil & Gas Storage and Trade Series –World Oil Refinery & LNG Plant Map at both exhibitions.


The map is open now for sponsorship and advertising opportunities for exclusive mileage at Gastech 2021 or WGC2022. Companies that wish to sponsor and advertise their brand and marketing with the World Crude Oil Refinery and LNG Plant Map –version 2021/22, can download the booking form. Limited to four advert slots!

The Crude Oil Refinery and LNG Plant Map is very handy for reference or display, and can be purchased as an A0 poster, without sponsors advertisement displayed or with sponsors advertisement displayed at generous discount.

East Asia Energy Series: Offshore Wind and Power Plant Map was launched at Wind Energy Asia 2021 in March 2021 in downloadable PDF format.

MUDROCK MEDIA MOBILE APPS was developed in late 2016 to enhance the use of printed wall poster 'SMARTER MAP' that allow quick access to more detail information. You can use the mobile apps to search for the activities and status of exploration, production field, as well as supporting facilities in the oil & gas industry by scanning on the QR code from the SMARTER MAP.

Click on Android or iPhone to install the Mudrock Media Mobile Apps.

ABOUT OIL & GAS STORAGE AND TRADE SERIES: WORLD CRUDE OIL & LNG PLANT MAP

The first World Oil Refinery & LNG Plant Map published in 2018, is the essential reference map for all energy and oil & gas professionals, and launched at World Gas Conference in Washington DC (June) with a total distribution of 10,000 copies, carrying sponsors’ logo and advertisements. Detailed information covering operator name, capacity and location of Crude Oil Refinery and LNG Plant is shown on the poster map sized 29x37 inch.

Key Features

  • Graphic pie chart – Export of Dry natural Gas by Region (2018)
  • Graphic pie chart – Top 10 Export Countries of Dry natural Gas (2018)
  • Graphic pie chart – Imports of Dry natural Gas by Region (2018)
  • Graphic pie chart – Top 10 Import Countries of Dry natural Gas (2018)
  • Graphic pie chart – Dry natural Gas Production by Region (2018)
  • Graphic pie chart – Asia Dry natural Gas Production by Region (2018)
  • Graphic pie chart – World Crude Oil Proved Reserves (2020)
  • Graphic pie chart – Asia Crude Oil Proved Reserves (2020)
  • Graphic pie chart – Total Petroleum and Other Liquids Production (2020)
  • Graphic pie chart – Asia Petroleum and Other Liquids Production (2020)
  • Exclusive power data and analysis from U.S. Energy Information Administration.

Oil & Gas

  • Coverage of every country.
  • All maps based on Data platform of more than 1,500 generation projects and plants.
  • Maps show crude oil refinery, oil terminal and LNG plant sites that are operating, under construction or planned.
  • Overview of oil and gas production across the continent and the state of associated infrastructure such as pipelines, tanker terminals, LNG and FLNG installations.
  • Extended coverage of key countries Algeria, Egypt (with detail of Nile Delta, Western Desert and Gulf of Suez regions), Nigeria and Angola.
  • Downstream infrastructure covering oil refineries, CTL and GTL plants.

ABOUT MUDROCK MEDIA SDN BHD

Mudrock Media, a cartographic and advertising company, is the leading mapping solution and published a series of Map of Oil & Gas Activities for regions and countries including Southeast-Asia, Middle-East, Australasia, Asia-Pacific, South-Asia, Malaysia, and Myanmar. Advertise at our Oil & Gas Map series with over 500,000 FREE Circulation, an opportunity for companies to reinforce their company’s brand, products, services and projects through our industrial wall maps collection.

Learn more at https://mudrockmedia.com/ and follow updates on LinkedIn.


Contacts

MudrockMedia.com
Kitt Yee KONG, General Manager
This email address is being protected from spambots. You need JavaScript enabled to view it.
For WhatsApp call and message +60 12 216 2412

TORONTO--(BUSINESS WIRE)--$LGO #VRFB--Largo Resources Ltd. ("Largo" or the "Company") (TSX: LGO) (NASDAQ: LGO) is pleased to announce that it has received a notice to proceed (“NTP”) on its previously announced sales contract with Enel Green Power España for the delivery of a 5 hour 6.1 MWh VCHARGE± system located in Spain.


Paulo Misk, President and CEO for Largo, stated: “We are thrilled to be working with a reputable partner such as Enel Green Power España and to starting the activities required to deliver on the contract.” He continued: “We look forward to the successful deployment of this system and to delivering additional clean energy solutions to customers in the future.”

About Largo Resources

Largo Resources is an industry preferred, vertically integrated vanadium company. It services multiple vanadium market applications through the supply of its unrivaled VPURE™ and VPURE+™ products, from one of the world’s highest-grade vanadium deposits at the Company’s Maracás Menchen Mine located in Brazil. Largo is also focused on the advancement of renewable energy storage solutions through its vertically integrated VCHARGE± vanadium redox flow battery technology. The Company's common shares are listed on the Toronto Stock Exchange and on the Nasdaq Stock Market under the symbol "LGO".

For more information on Largo and VPURE™, please visit www.largoresources.com and www.largoVPURE.com.

For additional information on Largo Clean Energy, please visit www.largocleanenergy.com.

Forward-looking Information:

This press release contains forward-looking information under Canadian securities legislation, ("forward-looking statements"). Forward‐looking information in this press release includes, but is not limited to, statements with respect to our ability to market and sell our VCHARGE± battery system on specification and at a competitive price, the production, delivery and sale to Enel Green Power of a VCHARGE+ battery system, the design of that system, expected transaction value, future VCHARGE+ battery system sales, and the growth of the long-duration energy storage market. Forward-looking statements can be identified by the use of forward-looking terminology such as "plans", "expects" or "does not expect", "is expected", "budget", "scheduled", "estimates", "forecasts", "intends", "anticipates" or "does not anticipate", or "believes", or variations of such words and phrases or statements that certain actions, events or results "may", "could", "would", "might" or "will be taken", "occur" or "be achieved". All information contained in this news release, other than statements of current and historical fact, is forward looking information. Forward-looking statements are subject to known and unknown risks, uncertainties and other factors that may cause the actual results, level of activity, performance or achievements of Largo or Largo Clean Energy to be materially different from those expressed or implied by such forward-looking statements, including but not limited to the failure to satisfy conditions in the agreement with Enel, termination of the agreement, and those risks described in the annual information form of Largo and in its public documents filed on www.sedar.com and www.sec.gov from time to time. Forward-looking statements are based on the opinions and estimates of management as of the date such statements are made. Although management of Largo has attempted to identify important factors that could cause actual results to differ materially from those contained in forward-looking statements, there may be other factors that cause results not to be as anticipated, estimated or intended. There can be no assurance that such statements will prove to be accurate, as actual results and future events could differ materially from those anticipated in such statements. Accordingly, readers should not place undue reliance on forward-looking statements. Largo does not undertake to update any forward-looking statements, except in accordance with applicable securities laws. Readers should also review the risks and uncertainties sections of Largo's annual and interim MD&As which also apply.

Trademarks are owned by Largo Resources Ltd.


Contacts

For further information, please contact:

Investor Relations:
Alex Guthrie
Senior Manager, External Relations
This email address is being protected from spambots. You need JavaScript enabled to view it.
Tel: +1 416‐861‐9797

MELBOURNE, Fla.--(BUSINESS WIRE)--The Board of Directors of L3Harris Technologies (NYSE:LHX) has declared a quarterly cash dividend of $1.02 per share on the common stock, payable September 17, 2021, to shareholders of record as of the close of business on September 3, 2021.


About L3Harris Technologies

L3Harris Technologies is an agile global aerospace and defense technology innovator, delivering end-to-end solutions that meet customers’ mission-critical needs. The company provides advanced defense and commercial technologies across air, land, sea, space and cyber domains. L3Harris has approximately $18 billion in annual revenue and 48,000 employees, with customers in more than 100 countries. L3Harris.com.


Contacts

Rajeev Lalwani
Investor Relations
This email address is being protected from spambots. You need JavaScript enabled to view it.
321-727-9383

Jim Burke
Media Relations
This email address is being protected from spambots. You need JavaScript enabled to view it.
321-727-9131

HOUSTON & CALGARY, Alberta--(BUSINESS WIRE)--Civeo Corporation (NYSE:CVEO) today reported financial and operating results for the second quarter ended June 30, 2021.


Highlights include:

  • Reported second quarter revenues of $154.2 million, a net loss of $0.5 million and operating cash flow of $16.5 million;
  • Delivered second quarter Adjusted EBITDA of $32.2 million and free cash flow of $13.7 million; and
  • Reduced total debt to $226.8 million as of June 30, 2021 from $238.1 million as of March 31, 2021.

“In the second quarter of 2021, we once again stuck to our objectives of operating safely, generating free cash flow and reducing our debt balance. The second quarter marks our eighth consecutive quarter of debt and leverage ratio reduction," stated Bradley J. Dodson, Civeo's President and Chief Executive Officer.

Mr. Dodson concluded, "In Canada, we are encouraged and thankful for the rapid decline of COVID-19 cases after the strong third wave occurred in April, and as a result, customer activity in the Canadian oil sands and pipeline work continued to strengthen. In Australia, Civeo and its customers continue to deal with labor supply issues and subdued activity due to COVID-19 travel restrictions and the lingering China/Australia trade dispute, but we continue to view these issues as transitory. Australia has been more successful in finding demand for its met coal exports, and Australian met coal is now trading above $200/tonne, an increase of almost 100% since the first quarter of 2021."

Second Quarter 2021 Results

In the second quarter of 2021, Civeo generated revenues of $154.2 million and reported a net loss of $0.5 million, or $0.03 per diluted share. The loss results in part from $7.9 million in costs associated with asset impairments on properties in Australia. During the second quarter of 2021, Civeo produced operating cash flow of $16.5 million, Adjusted EBITDA of $32.2 million and free cash flow of $13.7 million.

By comparison, in the second quarter of 2020, Civeo generated revenues of $114.7 million and reported net income of $6.1 million, or $0.37 per diluted share. Net income included $4.7 million of income associated with the settlement of a representations and warranties claim related to the Noralta acquisition. During the second quarter of 2020, Civeo produced operating cash flow of $24.5 million, Adjusted EBITDA of $28.1 million and free cash flow of $25.1 million.

Overall, the increase in revenues and Adjusted EBITDA in the second quarter of 2021 compared to 2020 was primarily due to a significant increase in billed rooms in the oil sands lodges and Canadian mobile camp activity, partially offset by $6.2 million of other income in 2020 related to proceeds from the Canadian Emergency Wage Subsidy ("CEWS") program and increased labor costs in our Australian business during the second quarter of 2021.

(EBITDA is a non-GAAP financial measure that is defined as net income plus interest, taxes, depreciation and amortization, and Adjusted EBITDA is defined as EBITDA adjusted to exclude impairment charges and proceeds from the settlement of a representation and warranties claim related to a prior acquisition. Free cash flow is a non-GAAP financial measure that is defined as net cash flows provided by operating activities less capital expenditures plus proceeds from asset sales. Please see the reconciliations to GAAP measures at the end of this news release.)

Business Segment Results

(Unless otherwise noted, the following discussion compares the quarterly results for the second quarter of 2021 to the results for the second quarter of 2020.)

Canada

During the second quarter of 2021, the Canadian segment generated revenues of $83.3 million, operating income of $7.5 million and Adjusted EBITDA of $22.6 million, compared to revenues of $53.0 million, operating loss of $6.7 million and Adjusted EBITDA of $15.3 million in the second quarter of 2020. Operating income and Adjusted EBITDA for the second quarter of 2021 included $0.7 million of other income related to proceeds from CEWS. The second quarter of 2020 Adjusted EBITDA included $6.2 million of other income related to proceeds from CEWS and a $1.7 million gain on sale of assets from the partial sale of assets from our Henday lodge. Results from the second quarter of 2021 reflect the impact of a strengthened Canadian dollar relative to the U.S. dollar, which increased revenues and Adjusted EBITDA by $9.6 million and $2.7 million, respectively.

On a constant currency basis, the Canadian segment experienced a 39% period-over-period increase in revenues driven by a 76% year-over-year increase in billed rooms, primarily in the oil sands lodges, related to increased customer activity as a result of the recovery of oil prices from the impact of COVID-19. Adjusted EBITDA for the Canadian segment increased 48% year-over-year primarily due to the increase in billed rooms coupled with increased mobile camp activity, partially offset by decreased billed rooms at Sitka lodge due to British Columbia's health order protocol.

Australia

During the second quarter of 2021, the Australian segment generated revenues of $64.0 million, operating loss of $2.7 million and Adjusted EBITDA of $15.4 million, compared to revenues of $57.1 million, operating income of $8.2 million and Adjusted EBITDA of $18.8 million in the second quarter of 2020. Results from the second quarter of 2021 reflect the impact of a strengthened Australian dollar relative to the U.S. dollar, which increased revenues and Adjusted EBITDA by $9.4 million and $2.3 million, respectively. Operating loss for the second quarter of 2021 includes asset impairment charges of $7.9 million.

On a constant currency basis, the Australian segment experienced modestly lower period-over-period revenues, driven by a 7% year-over-year decrease in billed rooms due to subdued customer spending in the Bowen Basin. Adjusted EBITDA from the Australian segment decreased 18% year-over-year due to lower village occupancy in the Bowen Basin, as well as higher labor costs in the Integrated Services business.

U.S.

The U.S. segment generated revenues of $6.9 million, operating loss of $1.1 million and Adjusted EBITDA of $0.3 million in the second quarter of 2021, compared to revenues of $4.6 million, operating loss of $2.6 million and negative Adjusted EBITDA of $1.4 million in the second quarter of 2020. Revenues and Adjusted EBITDA increased year-over-year primarily due to increased offshore fabrication activity coupled with higher occupancy in the U.S. lodges.

Financial Condition

As of June 30, 2021, Civeo had total liquidity of approximately $116.5 million, consisting of $112.1 million available under its revolving credit facilities and $4.4 million of cash on hand.

Civeo’s total debt outstanding on June 30, 2021 was $226.8 million, an $11.2 million decrease since March 31, 2021. The decrease consisted of $14.4 million in debt payments from cash flow generated by the business, partially offset by an unfavorable foreign currency translation of $3.2 million.

Civeo reduced its leverage ratio to 2.0x as of June 30, 2021 from 2.1x as of March 31, 2021.

During the second quarter of 2021, Civeo invested $3.2 million in capital expenditures, up from $1.2 million during the second quarter of 2020.

Full Year 2021 Guidance

For the full year of 2021, Civeo is maintaining its revenue and Adjusted EBITDA guidance range of $555 million to $580 million and $90 million to $100 million, respectively. This guidance is based on our expectations as of today and assumes no material changes to the current macro environment, or conditions related to the COVID-19 pandemic. The Company is lowering its full year 2021 capital expenditure guidance to $15 million to $20 million.

Conference Call

Civeo will host a conference call to discuss its second quarter 2021 financial results today at 11:00 a.m. Eastern time. This call is being webcast and can be accessed at Civeo's website at www.civeo.com. Participants may also join the conference call by dialing (800) 289-0438 in the United States or (323) 794-2423 internationally and using the conference ID 8892853#. A replay will be available after the call by dialing (844) 512-2921 in the United States or (412) 317-6671 internationally and using the conference ID 8892853#.

About Civeo

Civeo Corporation is a leading provider of hospitality services with prominent market positions in the Canadian oil sands and the Australian natural resource regions. Civeo offers comprehensive solutions for lodging hundreds or thousands of workers with its long-term and temporary accommodations and provides food services, housekeeping, facility management, laundry, water and wastewater treatment, power generation, communications systems, security and logistics services. Civeo currently operates a total of 28 lodges and villages in Canada, Australia and the U.S., with an aggregate of approximately 30,000 rooms. Civeo is publicly traded under the symbol CVEO on the New York Stock Exchange. For more information, please visit Civeo's website at www.civeo.com.

Forward Looking Statements

This news release contains forward-looking statements within the meaning of the Securities Act of 1933 and Section 21E of the Securities Exchange Act of 1934. Forward-looking statements are those that do not state historical facts and are, therefore, inherently subject to risks and uncertainties. The forward-looking statements herein include the statements regarding Civeo’s future plans and outlook, including guidance, current trends and liquidity needs, are based on then current expectations and entail various risks and uncertainties that could cause actual results to differ materially from those expressed or implied by these forward-looking statements. Such risks and uncertainties include, among other things, risks associated with global health concerns and pandemics, including the COVID-19 pandemic, any increases in or severity of COVID-19 cases (including due to existing or new variants) and the risk that room occupancy may decline if our customers are limited or restricted in the availability of personnel who may become ill or be subjected to quarantine, risks associated with the general nature of the accommodations industry, risks associated with the level of supply and demand for oil, coal, iron ore and other minerals, including the level of activity, spending and developments in the Canadian oil sands, the level of demand for coal and other natural resources from, and investments and opportunities in, Australia, and fluctuations or sharp declines in the current and future prices of oil, natural gas, coal, iron ore and other minerals, risks associated with failure by our customers to reach positive final investment decisions on, or otherwise not complete, projects with respect to which we have been awarded contracts, which may cause those customers to terminate or postpone contracts, risks associated with currency exchange rates, risks associated with the company’s ability to integrate acquisitions, risks associated with labor shortages, risks associated with the development of new projects, including whether such projects will continue in the future, risks associated with the trading price of the company’s common shares, availability and cost of capital, risks associated with general global economic conditions, global weather conditions, natural disasters and security threats and changes to government and environmental regulations, including climate change, and other factors discussed in the “Management’s Discussion and Analysis of Financial Condition and Results of Operations” and “Risk Factors” sections of Civeo’s annual report on Form 10-K for the year ended December 31, 2020 and other reports the company may file from time to time with the U.S. Securities and Exchange Commission. Each forward-looking statement contained herein speaks only as of the date of this release. Except as required by law, Civeo expressly disclaims any intention or obligation to revise or update any forward-looking statements, whether as a result of new information, future events or otherwise.

CIVEO CORPORATION

UNAUDITED CONSOLIDATED STATEMENTS OF OPERATIONS

(in thousands, except per share amounts)


Three Months Ended
June 30,


Six Months Ended
June 30,


2021


2020


2021


2020


Revenues

$

154,176


$

114,702


$

279,606


$

253,494


Costs and expenses:


Cost of sales and services

108,002


83,133


207,812


186,446


Selling, general and administrative expenses

14,703


11,490


28,884


25,427


Depreciation and amortization expense

21,377


22,205


42,646


47,707


Impairment expense

7,935


7,935


144,120


Other operating expense (income)

30


(285)


101


704


152,047


116,543


287,378


404,404


Operating income (loss)

2,129


(1,841)


(7,772)


(150,910)


Interest expense

(3,401)


(3,854)


(6,763)


(9,449)


Interest income

2


4


2


20


Other income

788


12,642


5,702


12,667


(Loss) income before income taxes

(482)


6,951


(8,831)


(147,672)


Income tax benefit (expense)

492


(122)


(584)


8,689


Net income (loss)

10


6,829


(9,415)


(138,983)


Less: Net income attributable to noncontrolling interest

(3)


222


56


480


Net income (loss) attributable to Civeo Corporation

13


6,607


(9,471)


(139,463)


Less: Dividends attributable to Class A preferred shares

480


471


958


939


Net (loss) income attributable to Civeo common shareholders

$

(467)


$

6,136


$

(10,429)


$

(140,402)


Net (loss) income per share attributable to Civeo Corporation common shareholders:


Basic

$

(0.03)


$

0.37


$

(0.73)


$

(9.96)


Diluted

$

(0.03)


$

0.37


$

(0.73)


$

(9.96)


Weighted average number of common shares outstanding:


Basic

14,278


14,151


14,244


14,097


Diluted

14,278


14,166


14,244


14,097


CIVEO CORPORATION

CONDENSED CONSOLIDATED BALANCE SHEETS

(in thousands)


June 30, 2021


December 31, 2020


(UNAUDITED)


Current assets:


Cash and cash equivalents

$

4,414


$

6,155


Accounts receivable, net

114,187


89,782


Inventories

6,958


6,181


Assets held for sale

2,205


3,910


Prepaid expenses and other current assets

15,513


13,185


Total current assets

143,277


119,213


Property, plant and equipment, net

442,819


486,930


Goodwill, net

8,474


8,729


Other intangible assets, net

98,967


99,749


Operating lease right-of-use assets

21,445


22,606


Other noncurrent assets

2,705


3,626


Total assets

$

717,687


$

740,853


Current liabilities:


Accounts payable

$

43,956


$

42,056


Accrued liabilities

23,983


27,349


Income taxes

225


203


Current portion of long-term debt

35,593


34,585


Deferred revenue

21,486


6,812


Other current liabilities

5,997


5,760


Total current liabilities

131,240


116,765


Long-term debt

189,228


214,000


Operating lease liabilities

17,997


19,834


Other noncurrent liabilities

15,817


14,897


Total liabilities

354,282


365,496


Shareholders' equity:


Preferred shares

60,974


60,016


Common shares


Additional paid-in capital

1,580,213


1,578,315


Accumulated deficit

(918,156)


(907,727)


Treasury stock

(8,050)


(6,930)


Accumulated other comprehensive loss

(352,171)


(348,989)


Total Civeo Corporation shareholders' equity

362,810


374,685


Noncontrolling interest

595


672


Total shareholders' equity

363,405


375,357


Total liabilities and shareholders' equity

$

717,687


$

740,853


CIVEO CORPORATION

UNAUDITED CONSOLIDATED STATEMENTS OF CASH FLOWS

(in thousands)


Six Months Ended

June 30,


2021


2020


Cash flows from operating activities:


Net loss

$

(9,415)


$

(138,983)


Adjustments to reconcile net loss to net cash provided by operating activities:


Depreciation and amortization

42,646


47,707


Impairment charges

7,935


144,120


Deferred income tax expense (benefit)

416


(8,941)


Non-cash compensation charge

1,898


3,539


Gains on disposals of assets

(1,941)


(1,819)


Provision for credit losses, net of recoveries

147


25


Other, net

1,483


(3,240)


Changes in operating assets and liabilities:


Accounts receivable

(24,617)


10,231


Inventories

(830)


(1,895)


Accounts payable and accrued liabilities

(563)


(4,583)


Taxes payable

21


251


Other current assets and liabilities, net

12,170


(1,094)


Net cash flows provided by operating activities

29,350


45,318


Cash flows from investing activities:


Capital expenditures

(6,530)


(3,847)


Proceeds from disposition of property, plant and equipment

7,012


1,897


Other, net


4,619


Net cash flows provided by investing activities

482


2,669


Cash flows from financing activities:


Term loan repayments

(17,874)


(16,551)


Revolving credit borrowings (repayments), net

(12,104)


(25,630)


Taxes paid on vested shares

(1,120)


(1,458)


Net cash flows used in financing activities

(31,098)


(43,639)


Effect of exchange rate changes on cash

(475)


(368)


Net change in cash and cash equivalents

(1,741)


3,980


Cash and cash equivalents, beginning of period

6,155


3,331


Cash and cash equivalents, end of period

$

4,414


$

7,311


CIVEO CORPORATION

SEGMENT DATA

(in thousands)

(unaudited)


Three Months Ended

June 30,


Six Months Ended

June 30,


2021


2020


2021


2020

Revenues


Canada

$

83,281


$

52,986


$

145,166


$

132,334


Australia

64,019


57,071


123,656


106,184


United States

6,876


4,645


10,784


14,976


Total revenues

$

154,176


$

114,702


$

279,606


$

253,494


EBITDA (1)


Canada

$

22,604


$

19,991


$

33,400


$

(100,265)


Australia

7,513


18,798


20,322


34,959


United States

297


(1,389)


(924)


(13,442)


Corporate and eliminations

(6,117)


(4,616)


(12,278)


(12,268)


Total EBITDA

$

24,297


$

32,784


$

40,520


$

(91,016)


Adjusted EBITDA (1)


Canada

$

22,604


$

15,301


$

33,400


$

26,726


Australia

15,448


18,798


28,257


34,959


United States

297


(1,389)


(924)


(1,003)


Corporate and eliminations

(6,117)


(4,616)


(12,278)


(12,268)


Total adjusted EBITDA

$

32,232


$

28,094


$

48,455


$

48,414


Operating income (loss)


Canada

$

7,452


$

(6,719)


$

(207)


$

(143,350)


Australia

(2,656)


8,191


651


14,355


United States

(1,109)


(2,623)


(3,707)


(16,757)


Corporate and eliminations

(1,558)


(690)


(4,509)


(5,158)


Total operating income (loss)

$

2,129


$

(1,841)


$

(7,772)


$

(150,910)


(1) Please see Non-GAAP Reconciliation Schedule.


CIVEO CORPORATION

NON-GAAP RECONCILIATIONS

(in thousands)

(unaudited)


Three Months Ended

June 30,


Six Months Ended

June 30,


2021


2020


2021


2020


EBITDA (1)

$

24,297


$

32,784


$

40,520


$

(91,016)


Adjusted EBITDA (1)

$

32,232


$

28,094


$

48,455


$

48,414


Free Cash Flow (2)

$

13,736


$

25,110


$

29,832


$

43,368


(1)

The term EBITDA is defined as net income (loss) attributable to Civeo Corporation plus interest, taxes, depreciation and amortization. The term Adjusted EBITDA is defined as EBITDA adjusted to exclude impairment charges and proceeds from the settlement of a representation and warranties claim related to a prior acquisition. EBITDA and Adjusted EBITDA are not measures of financial performance under generally accepted accounting principles and should not be considered in isolation from or as a substitute for net income or cash flow measures prepared in accordance with generally accepted accounting principles or as a measure of profitability or liquidity. Additionally, EBITDA and Adjusted EBITDA may not be comparable to other similarly titled measures of other companies. Civeo has included EBITDA and Adjusted EBITDA as supplemental disclosures because its management believes that EBITDA and Adjusted EBITDA provide useful information regarding its ability to service debt and to fund capital expenditures and provide investors a helpful measure for comparing Civeo's operating performance with the performance of other companies that have different financing and capital structures or tax rates. Civeo uses EBITDA and Adjusted EBITDA to compare and to monitor the performance of its business segments to other comparable public companies and as a benchmark for the award of incentive compensation under its annual incentive compensation plan.


The following table sets forth a reconciliation of EBITDA and Adjusted EBITDA to net income (loss) attributable to Civeo Corporation, which is the most directly comparable measure of financial performance calculated under generally accepted accounting principles (in thousands) (unaudited):


Three Months Ended

June 30,


Six Months Ended

June 30,


2021


2020


2021


2020


Net income (loss) attributable to Civeo Corporation

$

13


$

6,607


$

(9,471)


$

(139,463)


Income tax expense (benefit)

(492)


122


584


(8,689)


Depreciation and amortization

21,377


22,205


42,646


47,707


Interest income

(2)


(4)


(2)


(20)


Interest expense

3,401


3,854


6,763


9,449


EBITDA

$

24,297


$

32,784


$

40,520


$

(91,016)


Adjustments to EBITDA


Impairment of long-lived assets (a)

7,935


7,935


50,514


Impairment of goodwill (b)


93,606


Representations and warranties settlement (c)


(4,690)


(4,690)


Adjusted EBITDA

$

32,232


$

28,094


$

48,455


$

48,414


(a)

Relates to asset impairments in the second quarter of 2021 and the first quarter of 2020. In the second quarter of 2021, we recorded a pre-tax loss related to the impairment of long-lived assets in our Australian segment of $7.9 million, which is included in Impairment expense on the unaudited statements of operations.


In the first quarter of 2020, we recorded a pre-tax loss related to the impairment of long-lived assets in our Canadian segment of $38.1 million and a pre-tax loss related to the impairment of long-lived assets in our U.S. segment of $12.4 million, which is included in Impairment expense on the unaudited statements of operations.


(b)

Relates to the impairment of goodwill in the first quarter of 2020. The $93.6 million impairment is related to our Canada reporting unit and is included in Impairment expense on the statements of operations.

 
(c)

In the second quarter of 2020, we recorded $4.7 million of income associated with the settlement of a representations and warranties claim related to the Noralta acquisition, which is included in Other income on the unaudited statements of operations.

(2)

The term Free Cash Flow is defined as net cash flows provided by operating activities less capital expenditures plus proceeds from asset sales. Free Cash Flow is not a measure of financial performance under generally accepted accounting principles and should not be considered in isolation from or as a substitute for cash flow measures prepared in accordance with generally accepted accounting principles or as a measure of profitability or liquidity. Additionally, Free Cash Flow may not be comparable to other similarly titled measures of other companies. Civeo has included Free Cash Flow as a supplemental disclosure because its management believes that Free Cash Flow provides useful information regarding the cash flow generating ability of its business relative to its capital expenditure and debt service obligations. Civeo uses Free Cash Flow to compare and to understand, manage, make operating decisions and evaluate Civeo's business. It is also used as a benchmark for the award of incentive compensation under its annual incentive compensation plan.


The following table sets forth a reconciliation of Free Cash Flow to Net Cash Flows Provided by Operating Activities, which is the most directly comparable measure of financial performance calculated under generally accepted accounting principles (in thousands) (unaudited):


Contacts

Carolyn J. Stone
Civeo Corporation
Senior Vice President & Chief Financial Officer
713-510-2400


Read full story here
Offshore Source Logo

Offshore Source keeps you updated with relevant information concerning the Offshore Energy Sector.

Any views or opinions represented on this website belong solely to the author and do not represent those of the people, institutions or organizations that Offshore Source or collaborators may or may not have been associated with in a professional or personal capacity, unless explicitly stated.

Corporate Offices

Technology Systems Corporation
8502 SW Kansas Ave
Stuart, FL 34997

info@tscpublishing.com