Business Wire News

RICHMOND, Va.--(BUSINESS WIRE)--#energy--Consumer Energy Alliance (CEA), the leading energy and environmental advocate for families and businesses, today released a report that finds that a natural gas ban would cost every household in Virginia more than $26,000.


The report, “The Hidden Costs of a Virginia Natural Gas Ban,” examines the impact of a natural gas ban if it were forced onto families and Virginians. Using open-source consumer data, CEA developed a cost calculator to provide an estimate of what a typical household in Richmond could expect to pay as a result of policies to ban natural gas service and use, depending on home configuration, appliances used and other factors.

These findings dovetail with previous research performed by CEA which found that the cost to replace just major gas appliances in homes nationwide would be more than $258 billion. The report also found that attempts to “electrify everything” would require a massive infrastructure buildout of over $100 billion in the state.

With one in three Virginia households using natural gas for home heating, banning natural gas would be financially devastating to families who would have to pay upwards of $26,000 to involuntarily reconfigure their home and purchase new appliances. A ban on natural gas would also disproportionately harm the 9.9% of Virginians who live at or below the poverty level, those on fixed incomes, and businesses still recovering from the economic hardships of COVID-19; as energy bills will inevitably increase,” CEA Vice President of State Affairs Kevin Doyle said.

Doyle added: “Natural gas is a critical resource for fueling Virginia’s families and businesses, but it has also been pivotal in the remarkable reductions in emissions that the state has achieved in recent years. Significant emissions reductions have occurred in Virginia while natural gas use has increased and expanded.”

“Virginians want affordable, reliable, secure, and sustainable energy to power their businesses, homes, and communities. This CEA report clearly demonstrates that banning natural gas from the market as a fuel or a feedstock fails this consumer test. Clean natural gas must be part of our future,” said Brett Vassey, President and CEO of the Virginia Manufacturers Association.

Doyle added: “Misguided attempts to ban energy services will only lead to undue financial burdens on Virginia’s families, seniors, small businesses and manufacturers and work against our environmental and climate goals. Consumers should retain the right to keep the energy service they want and choose appliances they wish to use – not activists with ill-considered agendas that put families last.”

To view the report, click here. The Virginia Report is part of a series of CEA reports on the impact natural gas bans would have on states. For more, click here.

About Consumer Energy Alliance

Consumer Energy Alliance (CEA) is the leading voice for sensible energy and environmental policies for consumers, bringing together families, farmers, small businesses, distributors, producers, and manufacturers to support America’s environmentally sustainable energy future. With more than 550,000 members nationwide, we are committed to leading the nation’s dialogue around energy, its critical role in the economy, and how it supports the vital supply chains for the families and businesses that depend on them. CEA works daily to encourage communities across the nation to seek sensible, realistic, and environmentally responsible solutions to meet our nation’s energy needs.


Contacts

Bryson Hull
(202) 657-2855
This email address is being protected from spambots. You need JavaScript enabled to view it.

Enhanced certification adds to existing listing, confirms design-process capabilities and robustness.

DECATUR, Tenn.--(BUSINESS WIRE)--#AS9100--Storm Power Components, a leading manufacturer of electrical bus bars and related power components, is pleased to announce that its ISO 9001:2015 and AS9100D certifications have been extended to include the Design and Development component per AS9100 Section 8.3. Storm’s certified robust design process guides customers who are new to the complexities of custom-designed or multi-layer laminated electrical busbars which carry high voltages and/or currents. This support begins with initial concepts, proceeds through optimizing topology, best materials & finishes, electrical & mechanical testing, and finishes with complete in-house manufacturing in our large Decatur, Tennessee facility. “Adding design to our certification is another step that enables our customers to capitalize on the vast experience of our design team when dealing with the intricate details involved in designing laminated bus bars” -Rick Whistler, Director of Laminated Bus


The AS9100D standard specifies the Quality Management System requirements for organizations that design, develop, or manufacture aviation, space, and defense products. The standard is an SAE document developed by the International Aerospace Quality Group (IAQG) which includes the ISO 9001:2015 requirements. It also identifies additional requirements specifically for the aviation, space, and defense industries. Storm’s skilled busbar designers help customers develop a wide variety of busbars ranging from simple machined and fabricated parts up through low-inductance, multi-layer laminated busbars.

About Storm Power Components: Storm Power Components is a leading manufacturer of custom copper and aluminum bus bars. Founded in 1990, the company focuses exclusively on fabrication, electroplating, and dielectric coatings for single-layer and multilayer copper and aluminum bus bars needed by original equipment manufacturers (OEMs) and serves a wide variety of commercial and industrial, and military/aerospace users.

Storm manufactures and delivers over 6 million bus bars each year to customers all over the world. Applications which rely on these components include power inverters; motor drives; grid-based, solar, and wind-energy systems; battery and other energy-storage facilities; electric and hybrid vehicles, railway, and ship transportation; radar systems; server/data centers; and more. Learn more at: https://stormpowercomponents.com.


Contacts

Jim Millard
This email address is being protected from spambots. You need JavaScript enabled to view it.

IHS Markit Vice Chairman Daniel Yergin convenes panel of senior energy experts in latest edition of CERAWeek Conversations – available at https://ondemand.ceraweek.com/cwc


WASHINGTON--(BUSINESS WIRE)--The pathways to net zero emissions by 2050 and the implications for energy markets, technology, geopolitics, supply chains and business strategy are explored in the latest episode of CERAWeek Conversations.

The pace and ultimate form of energy transition is a major force shaping the “New Map” of energy and geopolitics. Where past energy transitions have taken many decades or even centuries, ambitions to reach net zero emissions by 2050 necessitate a reshaping of the global energy system and the $93 trillion world economy in just 28 and a half years.

In a conversation moderated by Daniel Yergin, vice chairman, IHS Markit (NYSE: INFO) and author of The New Map: Energy, Climate, and the Clash of Nations, senior IHS Markit energy experts examine the key questions and implications on the “changing landscape” of energy transition.

“You can’t go anywhere in the energy world and indeed the policy world these days without running into those two words—Energy Transition,” Yergin says. “But energy transition has a lot of different meanings and there is a lot of confusion about it. So, what we want to do in this conversation is sort it out and provide some perspectives on where we are and where we’re going.”

Featured panelists:

  • Jim Burkhard, vice president, oil markets, energy and mobility, IHS Markit
  • Susan Farrell, vice president, climate and sustainability, IHS Markit
  • Atul Arya, senior vice president and chief energy strategist, IHS Markit

The complete video is available at: https://ondemand.ceraweek.com/cwc

Podcast version available: CERAWeek Conversations is also available via audio podcast on Apple Podcasts, Google Podcasts, Soundcloud, Spotify and Stitcher.

Selected excerpts:
Interview Recorded Tuesday, July 27, 2021

(Edited slightly for brevity only)

  • On the current momentum in global climate aspirations:

Jim Burkhard: “One of the more remarkable developments in 2020 that has continued into this year is the increase in aspirations on the part of governments to decarbonize. But if you go back to April of 2020—the depth of the lockdowns globally, the most severe global economic disruption since World War II—I don’t think it was inevitable at that time that there would be this move to increase aspirations to strengthen policy, to decarbonize. We saw aspirations increase; policies strengthen. Why is that?

“This is not just an academic question. The answer to this will shed light on how deeply rooted this recent momentum is. Part of the answer could be that COVID-19 reordered values and priorities for people [and] for governments. It could have also fed the sense that something is off track with nature.”

Susan Farrell: “The net zero target that started with China in September 2020—China is the number one emitter in the world—was a pretty big deal—followed by the number two emitter with the Biden administration also having a net zero by 2050 target. But in addition to that, there are several other actors on the stage who have really been forceful in the last 18 months. And the first is the financial sector.”

  • On the long horizon of energy transitions:

Atul Arya: “Changing the energy system takes decades, sometimes more than decades. Just in the last 12 months demand for all energy sources—oil, gas, coal—has increased significantly, in some cases above 2019 levels and emissions have also gone up significantly. This is a long journey and it’s not going to be that straightforward to just have a scenario and say that we can get to net zero by 2050 or 2060.”

Jim Burkhard: “The changes we’re seeing in the automotive system are the greatest in more than 100 years. One thing that’s clear is battery electric vehicles have won the capital allocation battle, have won the regulatory battle, particularly in Europe. But in the big picture, plug-in electric vehicles are still just about one percent of the global fleet. EVs today are about 10 million vehicles while there’s still about 1.3 billion oil-powered vehicles on the road.

“This transition is going to unfold over decades and not a year or two. Oil demand has been on a spectacular recovery since that massive decline in April [2020]. We’re on track to exceed the pre-COVID levels probably sometime next year. Oil demand this year is up over 7 mmbd over just a few months. It’s going to take time for oil to hit that plateau and then, perhaps in decades to come, decline.”

  • The financial and strategic pressures facing energy companies in the transition:

Susan Farrell: “[The financial sector has] continually throughout 2020 increased the number of signatories to the Task Force on Climate-Related Financial Disclosures. That requires companies to evaluate different futures and talk about their business values and business propositions, including in a world which reaches the Paris Agreement target of 1.5 degree limiting temperature rise. That world is very stringent on what happens to energy. They’re being asked to talk to their business strategies in that world, whether or not they think that’s likely to happen. There’s a lot of pressure on companies to talk about the future in different ways than before.”

“[Oil and gas companies] are seriously struggling with the pressure from the financial investors to demonstrate they are going to do something different in a time period that appears to be very different than the world might actually look. On one side they are planning to make investments that make sense in a world they believe is going to happen. On the other, they also have to explain what would happen if a very different world were to happen such as the net zero [scenarios].”

  • The three buckets of energy technologies for a low-carbon transition:

Atul Arya: “The way I would characterize the technology landscape is in three buckets. In one you have solar PV, also onshore wind and, increasingly, offshore wind which are really ready for scaled deployment. Then there is a second set of technologies which are ready for deployment; they still have cost challenges which would include carbon capture and sequestration and green hydrogen where we know there is a pathway to get to a low-cost, but it requires more deployment because that is where the learning will happen. There is a third bucket of technologies which are not quite there yet, and I would put storage in there. Large scale storage is quite far away, and it will require some very significant technological breakthrough.”

  • The shift from “Big Oil” to “Big Shovels” to power low-carbon technologies and the implications for global supply chains:

Daniel Yergin: “People know the term ‘Big Oil’—it’s been used for decades. But in The New Map I argue that we’re going to be talking about ‘big shovels’ because the wind and the sun are free, but you need a lot of materials [for renewable energy technologies]. There’s going to be whole new supply chains that have to be created. If everybody is rushing in the same direction at the same time, you’re going to get pressure on supply chains.

“We’re living now in a period of real pressure on supply chains—it could get much more intense and it’s going to get more geopolitical. China has a very key role and every day it seems the tensions between the United States and China are getting higher. That's something that's not getting that much attention, but you cannot remake what today is currently a $93 trillion world economy in 28 and a half years without a lot of “stuff”—and where that material is going to come from is going to be very important.”

  • On the varying pathways to net-zero and low-carbon between developed and developing countries:

Susan Farrell: “We tend to focus a lot on Europe and it’s because they’ve taken a leadership role and they want a leadership role in creating real change around the world. But the fact is that at the end of the day they are the fourth largest emitter when you take all EU 27 countries together; and they are behind China, the U.S. and India and they are already headed down. Their absolute emissions are not going to move the dial in getting to a lower carbon world. It’s got to be those big countries. There’s a real difference of views about how fast that can actually happen. How fast can you actually move this ship? It’s a huge energy system. Today 80% of primary energy comes from oil, gas and coal. Not will that move—it will move—but how fast can it move? There’s a great deal of discussion and debate at executive levels about how to adjust a company to take advantage of that in a profitable way.”

Atul Arya: “You just can’t force a country like India to flip the switch. Coal is deeply embedded in the Indian economy. But [people] think that we can switch coal to renewables; possibly gas, but maybe not that easily. Affordability is going to be hugely important. Also, the issue of employment. The coal industry in India employs millions of people. You can’t just flip the switch and say that we will move to renewables. You have to think about the employment for millions of people in a country like India.”

“Coal is 10% of global emissions—the biggest single source of emissions. What happens with coal is going to determine the path to net zero. You can have carbon capture, or you can substitute coal with gas or renewables but it’s not that straightforward. We need to think about what happens [with coal]. The other issue is money with technology. For COP 26, follow-the money. There was a commitment in Paris that $100 billion would go from the developed world to the developing world. That hasn’t happened. In a post-COVID world will that really happen? Unless the developing world decarbonizes, the path to net zero doesn’t exist.”

Jim Burkhard: “The priorities, the interests in Germany or the U.K. or France are not the same as India, Nigeria, or Vietnam. We are a long way away from having some type of globally aligned system to constrain carbon growth. It’s going to be a very bumpy road and the regulations—what prospers, what doesn’t—is going to vary by geography because the interests in these jurisdictions are not the same.”

  • Differentiated company strategies in the energy transition:

Susan Farrell: “Some companies are looking at an energy transition and others are looking at a transformation—some companies are transforming themselves. The auto companies may be moving faster than the market is. They are looking forward a long time because they have a long production period and new model times and therefore, they are changing quickly. Energy companies are doing the same thing and they are balancing off a scale portfolio with a growth portfolio. The really big integrated companies can do both. They can be present in the scale of oil and gas and they can participate in the growth markets of electricity and in the renewable sector at the same time. Other smaller companies in the oil and gas sector don’t really have that luxury to participate in both so they are trying to decide how to work through an energy transition as opposed to transforming their company. A third group—the national oil companies—are also struggling differently with looking at the future. Some can participate in both, but then there are others that simply have oil and gas as their patrimony, and they need to produce it because that is what their role is.”

Atul Arya: “If you go back 30 or 40 years to the Seven Sisters and the big oil and gas companies, it was a very narrow band within which they operated. Their strategies were very similar. But now the differentiation is huge, probably the biggest I have seen in my lifetime in their strategies. Also, European vs. U.S. differentiation has really expanded. I think we are going to see multiple strategies. Some want to go from international oil companies to integrated energy companies—easier said than done. It will be very interesting to see how this landscape evolves. One of the ways we look at it is: What are the service companies doing? They are, in a way, a leading indicator of what happens. What service companies are doing now are focusing on carbon capture, hydrogen, geothermal, lithium mining. You will see kind of a preview of what happens.”

Watch the complete video at: https://ondemand.ceraweek.com/cwc

Recent CERAWeek Conversations segments also include:

About CERAWeek Conversations:

CERAWeek Conversations features original interviews and discussion with energy industry leaders, government officials and policymakers, leaders from the technology, financial and industrial communities—and energy technology innovators.

The series is produced by the team responsible for the world’s preeminent energy conference, CERAWeek by IHS Markit.

The complete episode library is available at https://ondemand.ceraweek.com/cwc.

CERAWeek Conversations is also available via audio podcast on Apple Podcasts, Google Podcasts, Soundcloud, Spotify and Stitcher.

About IHS Markit (www.ihsmarkit.com)

IHS Markit (NYSE: INFO) is a world leader in critical information, analytics and solutions for the major industries and markets that drive economies worldwide. The company delivers next-generation information, analytics and solutions to customers in business, finance and government, improving their operational efficiency and providing deep insights that lead to well-informed, confident decisions. IHS Markit has more than 50,000 business and government customers, including 80 percent of the Fortune Global 500 and the world’s leading financial institutions. Headquartered in London, IHS Markit is committed to sustainable, profitable growth.

IHS Markit is a registered trademark of IHS Markit Ltd. and/or its affiliates. All other company and product names may be trademarks of their respective owners © 2021 IHS Markit Ltd. All rights reserved.


Contacts

News Media:
Jeff Marn
IHS Markit
+1 202 463 8213
This email address is being protected from spambots. You need JavaScript enabled to view it.

Press Team
+1 303 858 6417
This email address is being protected from spambots. You need JavaScript enabled to view it.

IDE to build and operate a MAXH2O Desalter Demo unit using standard size commercial membranes to minimize cooling tower blowdown


KADIMA, Israel--(BUSINESS WIRE)--IDE Water Technologies, a world leader in water treatment solutions, has signed a contract with ENEL Generación Chile S.A. to demonstrate the company’s MAXH2O Desalter solution at ENEL's San Isidro Power Plant.

The scope of the ENEL Generación Chile S.A. San Isidro Power Plant project includes the fabrication, installation and operation of a fully advanced demonstration treatment unit implementing IDE's MAXH2O Desalter technology. This unit will use standard commercial size membrane elements and will be shipped to Chile to be installed and operated by IDE in partnership with a local subcontractor. IDE believes that cooling tower blowdown poses a challenge for many industries in general and for power plants in particular. By introducing IDE's MAXH2O technology for this industrial application, much of the cooling tower blowdown can be minimized and reused, thus offering an economic and sustainable solution.

“From the beginning, IDE’s MAXH2O technology impressed us and interested us to further explore the applicability and performance on the complex cooling tower blowdown minimization needs of our power plants,” said Daniela Galla, Innovation Manager, Innovation Global Power Generation, ENEL. “As one of the largest power and energy company in the world, we continually strive to be more sustainable in our practices and have complete confidence in IDE’s technology to help us achieve this goal.”

IDE’s MAXH2O Desalter operates by recirculating treated water through the reverse osmosis system and a fluidized bed pellet reactor at high velocity, continuously precipitating supersaturated salts from the recirculated brine. The solution offers high recovery rates and flexibility without endangering the membranes’ service life, translating into low investment and operational costs for the facility.

“We are excited to have been selected by ENEL Generación to provide our MAXH2O Desalter technology for their San Isidro power plant, and to have the opportunity to commission a first of its kind demo unit for a facility of this size,” said Matan Alper, Head of Industrial Water Business Development, IDE Water Technologies. “We are working hard on this installation and look forward to the positive impact IDE’s innovative water technologies will have on the plant’s sustainability in the coming years.”

For more information on IDE Technologies’ comprehensive water solutions, visit www.ide-tech.com.

About Enel Generación

Enel Generación is the leading generation company in Chile with a combined gross installed capacity that amounted to 6,000 MW at the end of 2020, 59.1% corresponding to renewable energies and 40.9% to thermal power plants. The company owns and operates 109 generation units: 38 are hydroelectric (3,469 MW of gross installed capacity); 20 thermal generation units (2,454 MW of installed capacity); and 51 wind generation units (78 MW of installed capacity). As of December 31, 2020, the market share in energy sales (GWh) reached 30.4% of the energy sold in the National Electric System (SEN).

About IDE Technologies

A world leader provider of desalination and water treatment solutions, IDE specializes in the development, engineering, construction and operation of some of the world’s largest and most advanced thermal and membrane desalination facilities and industrial water treatment plants. IDE partners with a wide range of customers – municipalities, oil & gas, mining, refineries and power plants – on all aspects of water projects, and delivers approximately 3 million m3/day of high-quality water worldwide.

For more information, visit www.ide-tech.com.


Contacts

Gabrielle Kondracki
This email address is being protected from spambots. You need JavaScript enabled to view it.

Funding will accelerate the commercialization of the company’s advanced nuclear technology

PORTLAND, Ore.--(BUSINESS WIRE)--NuScale Power today announced that recent private capital investments from a diverse base of strategic investors total $152 million, closing out NuScale’s A-5 round of investments, and bringing the company’s total funding year to date to approximately $192 million. Investments have been secured from GS Energy, Doosan Heavy Industry and Construction, IHI Corporation, Samsung C&T Corporation, Sargent & Lundy and Sarens. This announcement follows a $40 million investment from JGC Holdings Corporation earlier this year.


NuScale is the leading developer of a small modular reactor (SMR) that delivers scalable, safe and reliable carbon-free nuclear power. Since 2007, NuScale has invested hundreds of millions in the development and commercialization of its SMR technology, which includes both private investments and cost-sharing awards from the U.S. Department of Energy (DOE).

“NuScale is incredibly excited to receive the support of such a distinguished group of partners who share our vision to transform the clean energy sector,” said John Hopkins, NuScale Power Chairman and Chief Executive Officer. “Taken together, these investments reflect the growing and substantial interest in NuScale’s technology as the world looks to us to provide affordable, carbon-free energy solutions.”

In August 2020, NuScale made history as the first and only SMR to receive design approval from the U.S. Nuclear Regulatory Commission (NRC), and in July of 2021, the Commission published the proposed rule that would certify the NuScale design – a crucial step towards the construction and deployment of this SMR technology.

This accomplishment would not have been possible without the support of the DOE, and this public-private partnership remains critical to the successful advancement of NuScale’s technology as it progresses to commercial deployment. The cost-shared funding provided by U.S. Congress has already accelerated NuScale’s advancement through the complex and rigorous NRC Design Certification process.

The Company maintains strong program momentum towards the commercialization of its SMR technology, including supply chain development, standard plant design, planning of plant delivery activities and startup and commissioning plans.

​​​​​About NuScale Power

NuScale Power has developed a new modular light water reactor nuclear power plant to supply energy for electrical generation, district heating, desalination, and other process heat applications. This groundbreaking small modular reactor (SMR) design features a fully factory-fabricated NuScale Power Module™ capable of generating 77 MW of electricity using a safer, smaller, and scalable version of pressurized water reactor technology. NuScale's scalable design—power plants that can house up to four, six, or 12 individual power modules—offers the benefits of carbon-free energy and reduces the financial commitments associated with gigawatt-sized nuclear facilities. The majority investor in NuScale is Fluor Corporation, a global engineering, procurement, and construction company with a 70-year history in commercial nuclear power.

NuScale is headquartered in Portland, OR, and has offices in Corvallis, OR; Rockville, MD; Charlotte, NC; Richland, WA; and London, UK. Follow us on Twitter: @NuScale_Power, Facebook: NuScale Power, LLC, LinkedIn: NuScale-Power, and Instagram: nuscale_power. Visit NuScale Power’s website.


Contacts

Diane Hughes, NuScale Vice President, Marketing & Communications
This email address is being protected from spambots. You need JavaScript enabled to view it. (C) 503-270-9329

FRAMINGHAM, Mass.--(BUSINESS WIRE)--#cleanenergy--Ameresco, Inc. (NYSE:AMRC), a leading cleantech integrator specializing in energy efficiency and renewable energy, today announced that members of its management team will attend the following investor conference:


  • On August 12, 2021, Ameresco’s Senior Vice President and Chief Financial Officer, Doran Hole, will participate in a fireside chat at the Canaccord Genuity 41st Annual Growth Conference. The presentation will take place at 1:00pm ET. Management will also host virtual investor meetings throughout the day. Interested parties can tune in at the following webcast link: https://wsw.com/webcast/canaccord60/amrc/2427436.

About Ameresco, Inc.
Founded in 2000, Ameresco, Inc. (NYSE:AMRC) is a leading cleantech integrator and renewable energy asset developer, owner and operator. Our comprehensive portfolio includes energy efficiency, infrastructure upgrades, asset sustainability and renewable energy solutions delivered to clients throughout North America and the United Kingdom. Ameresco’s sustainability services in support of clients’ pursuit of Net Zero include upgrades to a facility’s energy infrastructure and the development, construction, and operation of distributed energy resources. Ameresco has successfully completed energy saving, environmentally responsible projects with Federal, state and local governments, healthcare and educational institutions, housing authorities, and commercial and industrial customers. With its corporate headquarters in Framingham, MA, Ameresco has more than 1,000 employees providing local expertise in the United States, Canada, and the United Kingdom. For more information, visit www.ameresco.com.


Contacts

Media Contacts:
Ameresco: Leila Dillon, 508.661.2264, This email address is being protected from spambots. You need JavaScript enabled to view it.
Investor Relations: Eric Prouty, AdvisIRy Partners, 212.750.5800, This email address is being protected from spambots. You need JavaScript enabled to view it.
Lynn Morgen, AdvisIRy Partners, 212.750.5800, This email address is being protected from spambots. You need JavaScript enabled to view it.

BRYN MAWR, Pa.--(BUSINESS WIRE)--Essential Utilities Inc. (NYSE: WTRG) today announced that its Aqua Texas water utility has acquired the water treatment and distribution system in The Commons of Lake Houston community in Huffman, Texas yesterday. The Commons’ system serves approximately 1,000 homes in the development.


The transaction is the first of which Aqua Texas was able to use a new Texas law that allows regulated water companies to pay a fair market value for the purchase of water and wastewater systems. Prior to the new law, enacted in 2019, a system’s value previously was determined by its depreciated original cost, which generally did not reflect a reasonable market value for those assets. The new FMV law applies to all water and wastewater utilities including those owned and operated by private investors and municipal governments.

When the agreement of sale was reached several months ago, Essential Chairman and CEO Christopher Franklin said The Commons agreement illustrated the benefits of the new fair market value law. “The Texas fair market value law offers a compelling solution to municipalities, developers and other utility owners who must meet ever-increasing health and environmental standards and the costs of operating and maintaining their systems,” said Franklin. “Aqua can benefit other communities like The Commons by leveraging our expertise in compliance, large-scale purchasing power and other efficiencies that can be realized with a larger, regional operation.”

My team and I are proud to welcome residents of The Commons as our new customers,” said Aqua Texas President Bob Laughman. “Although this is not a municipal acquisition, it is worth noting that municipalities in other states with FMV legislation have sold their utility systems to Aqua and used the proceeds to offset tax increases, build new municipal facilities, and fund new infrastructure projects among other things. In other cases, the sale has enabled municipalities to avoid the necessary cost to bring their systems into environmental regulatory compliance by shifting that responsibility to Aqua, as we are experts in compliance.”

The Commons is the first acquisition completed by Essential’s Aqua companies in 2021. The company currently has seven additional signed purchase agreements for water and wastewater systems which have a total purchase price of $458.5 million and represent approximately 233,000 equivalent dwelling units.

Aqua Texas serves about 200,000 people in 53 counties across Texas. Visit AquaAmerica.com for more information or follow @MyAquaAmerica on Facebook and Twitter.

About Essential

Essential is one of the largest publicly traded water, wastewater and natural gas providers in the U.S., serving approximately 5 million people across 10 states under the Aqua and Peoples brands. Essential is committed to excellence in proactive infrastructure investment, regulatory expertise, operational efficiency and environmental stewardship. The company recognizes the importance water and natural gas play in everyday life and is proud to deliver safe, reliable services that contribute to the quality of life in the communities it serves. For more information, visit http://www.essential.co.

Forward-Looking Statements

This release contains forward-looking statements within the meaning of the Private Securities Litigation Reform Act of 1995, including. There are important factors that could cause actual results to differ materially from those expressed or implied by the forward-looking statements including: general economic business conditions; the successful integration of the customers and the facility; and other factors discussed in our Annual Report on Form 10-K, which is on file with the Securities and Exchange Commission. For more information regarding risks and uncertainties associated with Essential Utilities’ business, please refer to Essential Utilities’ annual, quarterly and other SEC filings. Essential Utilities is not under any obligation — and expressly disclaims any such obligation — to update or alter its forward-looking statements whether as a result of new information, future events or otherwise.

WTRGF


Contacts

Brian Dingerdissen
Investor Relations
O: 610.645.1191
This email address is being protected from spambots. You need JavaScript enabled to view it.

Donna Alston
Communications and Marketing
O: 610.645.1095
This email address is being protected from spambots. You need JavaScript enabled to view it.

Collaborative approach creates an energy-efficient hospital despite the challenges of COVID-19

NEW YORK--(BUSINESS WIRE)--#collaboration--utiliVisor, a leader in utility submetering and plant optimization, announces that their collaboration with The New Valley Hospital has helped the hospital save more than $1.025 million. utiliVisor was initially brought in to help evaluate bids from service contractors during construction.


"Because of utiliVisor's knowledge and great negotiating skill, we received - and awarded - a bid that was below what we had budgeted for. And we received more from that bid than we originally had asked for. It's been a very successful process and saved over $1.025 million. And we couldn't have done it without utiliVisor's involvement.​​​​​​​"
- Joseph Lorino, PE, LEED AP | Vice President, Facilities Management, Valley Health System

utiliVisor continues to collaborate with The New Valley Hospital team in establishing sustainable energy practices. Even after the hospital opens, utiliVisor will provide ongoing monitoring and metering to maintain long-term solutions that save energy and costs.

“utiliVisor's continued involvement will help us in making decisions, whether it's their own expertise or bringing us experts. They make sure we’re consistently achieving peak efficiency. Their involvement is critical to our success because we need to operate and maintain this system to give our patients a great healing environment. That's why we value utiliVisor and what they do,” said Lorino.

The New Valley Hospital is a community hospital currently being built in Paramus, New Jersey, and plans to have its first patient by the end of 2023.

For more information on the collaborative approach that The New Valley Hospital is taking, read utiliVisor’s case study here.

ABOUT UTILIVISOR

Your tenant submetering and energy plant optimization services are an essential part of your operation. You deserve personalized energy insights from a team that knows buildings from the inside out, applies IoT technology and is energized by providing you with accurate data and energy optimization insights. When you need experience, expertise, and service, you need utiliVisor on your side. Experts that deliver consistent energy and cost-saving strategies for you. What more can our 40 years of experience and historical data do for you? Call utiliVisor at 212-260-4800 or visit https://www.utilivisor.com/.


Contacts

Kathy Fealy
utiliVisor Marketing Director
This email address is being protected from spambots. You need JavaScript enabled to view it.

SEATTLE--(BUSINESS WIRE)--Expeditors International of Washington, Inc. (NASDAQ:EXPD) today announced second quarter 2021 financial results including the following highlights compared to the same quarter of 2020:

  • Diluted Net Earnings Attributable to Shareholders per share (EPS1) increased 69% to $1.84
  • Net Earnings Attributable to Shareholders increased 72% to $316 million
  • Operating Income increased 66% to $411 million
  • Revenues increased 50% to $3.6 billion
  • Airfreight tonnage volume and ocean container volume increased 37% and 34%, respectively

“We continued to move unprecedented volumes during the quarter, as ocean and air buy/sell rates remained elevated and volatile, capacity was extremely tight, and supply chain disruptions showed no signs of abatement,” said Jeffrey S. Musser, President and Chief Executive Officer. “Our entire company continues to perform at its very best, with strong performance and growth across all of our products. Because of ongoing supply/demand imbalances, as well as labor and equipment shortages around the globe, shippers face extraordinarily complex challenges throughout their supply chains. Logistics is now top of mind at the highest levels in most organizations. Unfortunately, there is no quick or simple fix to any of these issues and every one of our transactions seems to require significantly more attention and dedication. Whether it’s an ocean container, a customs declaration, a fulfillment order in one of our warehouses, or a high-touch, white-glove delivery for one of our Transcon customers – just about everything we do requires us to be more innovative, flexible, and alert to change in the current operating environment. I want to express enormous gratitude to our employees, who have continued to take care of our customers throughout these challenges.

“During the quarter, we achieved new records in airfreight tonnage and ocean container volumes, operating income and net earnings. Buy and sell rates remained significantly higher than pre-pandemic norms, as we worked with our carrier partners to secure precious space for our customers. It has not been easy. Many of the impediments to smoother trade flow, such as port congestion and equipment shortages, were not appreciably better in Q2 than they were in Q1.

“Currently, we do not foresee any meaningful improvements to the operating environment over at least the remainder of the year, as the global infrastructure for moving freight seems nearly stretched to its limit. Robust demand is bumping up against capacity constraints in the air and ocean markets, all of which is made more challenging by limited warehouse space, staffing constraints, port congestion, equipment dislocations, and driver shortages, not to mention additional disturbances such as the closure of the Yantian port due to a COVID-19 outbreak in May or the blockage of the Suez Canal back in March.

“We will continue to do all that we can to help our customers during such difficult times. While we remain optimistic that conditions will improve over time, we are unable to predict when that might take place, or how even the recovery might be, and we believe that demand will likely continue to outstrip capacity in both air and ocean for the near term, keeping buy/sell rates unsettled for at least the duration of 2021.”

Bradley S. Powell, Senior Vice President and Chief Financial Officer, added, “The quarter just ended provides the first meaningful comparisons to a strong year-ago quarter in 2020, when we first started to see the results of our improved performance during the unprecedented conditions brought on by the global COVID-19 pandemic. At that time, we were just starting to demonstrate our ability to quickly adapt to a radically different operating environment of high demand for very specific products in certain lanes at a time when the vast majority of air capacity had been removed and most of our people were settling in to working from home. A year later, as we are cautiously beginning to bring our people back on site, we are navigating a multitude of challenges and performing at levels we have never seen before across the company and in all of our products. We are busier than ever, generating growth in revenue, operating income, and earnings that is well ahead of expenses, as we continue to learn how to operate in this environment. While we believe the current environment is likely to remain at least through the end of 2021, I would again caution that we are unable to predict how long these ongoing conditions will persist or the impact they will have on our future operations. Regardless, we will continue to make important investments in people, processes, and technology, as well as to invest in our strategic efforts to explore new areas for profitable growth.”

Expeditors is a global logistics company headquartered in Seattle, Washington. The Company employs trained professionals in 176 district offices and numerous branch locations located on six continents linked into a seamless worldwide network through an integrated information management system. Services include the consolidation or forwarding of air and ocean freight, customs brokerage, vendor consolidation, cargo insurance, time-definite transportation, order management, warehousing and distribution and customized logistics solutions.

____________________

1Diluted earnings attributable to shareholders per share.

NOTE: See Disclaimer on Forward-Looking Statements in this release.

Expeditors International of Washington, Inc.

Second Quarter 2021 Earnings Release, August 3, 2021

Financial Highlights for the three and six months ended June 30, 2021 and 2020 (Unaudited)

(in 000's of US dollars except per share data)


Three months ended June 30,


Six months ended June 30,


2021


2020


% Change


2021


2020


% Change

Revenues3


$

3,609,093


$

2,411,078


50%


$

6,807,913


$

4,254,845


60%

Directly related cost of transportation and other expenses1,3


$

2,598,633


$

1,661,487


56%


$

4,845,917


$

2,890,118


68%

Salaries and other operating expenses2


$

599,815


$

501,965


19%


$

1,165,836


$

958,046


22%

Operating income


$

410,645


$

247,626


66%


$

796,160


$

406,681


96%

Net earnings attributable to shareholders


$

316,372


$

183,869


72%


$

603,592


$

306,213


97%

Diluted earnings attributable to shareholders per share


$

1.84


$

1.09


69%


$

3.52


$

1.80


96%

Basic earnings attributable to shareholders per share


$

1.87


$

1.10


70%


$

3.57


$

1.83


95%

Diluted weighted average shares outstanding


171,677


169,290


171,660


170,382


Basic weighted average shares outstanding


169,210


166,767


169,140


167,751


____________________

1Directly related cost of transportation and other expenses totals Operating Expenses from Airfreight services, Ocean freight and ocean services and Customs brokerage and other services as shown in the Condensed Consolidated Statements of Earnings.

2Salaries and other operating expenses totals Salaries and related, Rent and occupancy, Depreciation and amortization, Selling and promotion and Other as shown in the Condensed Consolidated Statements of Earnings.

3Beginning in the first quarter 2019, the Company made changes to its process and presentation of freight services revenue and directly related transportation operating expenses with the objective that at each reporting level (reporting entity, segment and consolidated level) the gross revenue and associated directly related operating expenses be representative of the location where the services were performed, the operating expenses were incurred and where the revenues were earned. During the second quarter 2021, management identified and corrected certain immaterial errors in the Company’s historical financial statements primarily related to this process that was utilized through the first quarter of 2021. The process missed an intercompany elimination of revenues and an equal and offsetting amount of directly related transportation expenses, principally impacting airfreight services in North Asia. The errors overstated revenues and directly related transportation operating expenses by equal amounts in the consolidated statements of earnings. The errors had no impact on operating income, net earnings, and earnings per share nor any other financial statement amount. Further, the errors had no impact on the balance sheets, statements of shareholders’ equity, other comprehensive income and cash flows. These errors do not affect any of the metrics used to calculate or evaluate management’s compensation and had no impact on bonuses, commissions, share-based compensation or any other employee remuneration. Historical amounts have been revised and are presented on a comparable basis.

During the three and six months ended June 30, 2021, we repurchased 0.5 million and 1.4 million shares of common stock at an average price of $124.94 and $104.20 per share, respectively. During the three and six months ended June 30, 2020, we repurchased 0.4 million and 4.4 million shares of common stock at an average price of $77.46 and $71.41 per share, respectively.


Employee Full-time Equivalents as of
June 30,


2021


2020

North America


6,949


6,749


Europe


3,700


3,419


North Asia


2,416


2,413


South Asia


1,671


1,654


Middle East, Africa and India


1,496


1,528


Latin America


781


823


Information Systems


968


971


Corporate


399


380


Total

18,380


17,937

Disclaimer on Forward-Looking Statements:

NOTE: See Disclaimer on Forward-Looking Statements in this release.


Second quarter year-over-year
percentage increase in:

2021


Airfreight
kilos


Ocean freight
FEU

April


29%


34%

May


39%


36%

June


46%


30%

Quarter


37%


34%

Investors may submit written questions via e-mail to: This email address is being protected from spambots. You need JavaScript enabled to view it.. Questions received by the end of business on August 6, 2021 will be considered in management's 8-K “Responses to Selected Questions.”

Disclaimer on Forward-Looking Statements:

Certain statements contained in this news release are “forward-looking statements,” based on management’s views with respect to future events and underlying assumptions that involve risks and uncertainties. These forward-looking statements include statements regarding the future stabilization of supply/demand imbalance and rate volatility; the continued unsettled operating environment due to continued scarce air and ocean capacity; elevated air and ocean pricing and an increase in demand for such services; port congestion; equipment imbalances; trade disruptions; rising fuels costs; and the uneven lifting of the COVID-19 pandemic restrictions. Future financial performance could differ materially because of factors such as: our ability to leverage the strength of our carrier relationships to secure space; the strength of our non-asset-based operating model; our expectation that the supply/demand imbalance and rate volatility will continue for the remainder of 2021 and will stabilize over time; our ability to re-open our offices for return-to-work; our ability to continue to enhance our productivity; our expectation that the current unprecedented operating conditions will not persist long-term; our ability to invest in our strategic efforts to explore new areas for profitable growth; and our ability to remain a strong, healthy, unified and resilient organization. The COVID-19 pandemic could have the effect of heightening many of the other risks described in Item 1A of our Annual Report on Form 10-K, including, without limitation, those related to the success of our strategy and desire to maintain historical unitary profitability, our ability to attract and retain customers, our ability to manage costs, interruptions to our information technology systems, the ability of third-party providers to perform and potential litigation as updated by our reports on Form 10-Q, filed with the Securities and Exchange Commission. These and other factors are discussed in the Company’s regulatory filings with the Securities and Exchange Commission, including those in “Item 1A. Risk Factors” of the Company’s Annual Report on Form 10-K for the fiscal year ended December 31, 2020. The forward-looking statements contained in this news release speak only as of this date and the Company does not assume any obligation to update them except as required by law.

EXPEDITORS INTERNATIONAL OF WASHINGTON, INC.

AND SUBSIDIARIES

Condensed Consolidated Balance Sheets

(In thousands, except per share data)

(Unaudited)


June 30,
2021


December 31,
2020

Assets:


Current Assets:


Cash and cash equivalents


$

1,674,121


$

1,527,791


Accounts receivable, less allowance for credit loss of $6,104 at June 30, 2021 and $5,579 at December 31, 2020


2,647,516


1,998,055


Deferred contract costs


534,692


327,448


Other


128,933


110,250


Total current assets


4,985,262


3,963,544


Property and equipment, less accumulated depreciation and amortization of $534,790 at June 30, 2021 and $516,988 at December 31, 2020


499,282


506,425


Operating lease right-of-use assets


443,708


432,723


Goodwill


7,927


7,927


Other assets, net


16,992


16,884


Total assets


$

5,953,171


$

4,927,503


Liabilities:


Current Liabilities:


Accounts payable


$

1,408,572


$

1,136,859


Accrued expenses, primarily salaries and related costs


319,696


257,021


Contract liabilities


619,140


379,722


Current portion of operating lease liabilities


80,210


74,004


Federal, state and foreign income taxes


57,608


45,437


Total current liabilities


2,485,226


1,893,043


Noncurrent portion of operating lease liabilities


370,333


364,185


Deferred federal and state income taxes, net


13,961


7,048


Commitments and contingencies


Shareholders’ Equity:


Preferred stock, none issued


Common stock, par value $0.01 per share. Issued and outstanding: 169,169 shares at June 30, 2021 and 169,294 shares at December 31, 2020


1,692


1,693


Additional paid-in capital


79,357


157,496


Retained earnings


3,104,471


2,600,201


Accumulated other comprehensive loss


(106,066

)


(99,753

)

Total shareholders’ equity


3,079,454


2,659,637


Noncontrolling interest


4,197


3,590


Total equity


3,083,651


2,663,227


Total liabilities and equity


$

5,953,171


$

4,927,503


EXPEDITORS INTERNATIONAL OF WASHINGTON, INC.

AND SUBSIDIARIES

Condensed Consolidated Statements of Earnings

(In thousands, except per share data)

(Unaudited)


Three months ended June 30,


Six months ended June 30,


2021


2020


2021


2020

Revenues:


Airfreight services


$

1,523,569


$

1,269,654


$

2,849,484


$

1,925,252


Ocean freight and ocean services


1,098,550


489,385


2,052,462


980,725


Customs brokerage and other services


986,974


652,039


1,905,967


1,348,868


Total revenues


3,609,093


2,411,078


6,807,913


4,254,845


Operating Expenses:


Airfreight services


1,136,328


932,137


2,090,872


1,398,865


Ocean freight and ocean services


862,251


361,272


1,604,686


725,668


Customs brokerage and other services


600,054


368,078


1,150,359


765,585


Salaries and related


481,186


395,107


933,291


737,147


Rent and occupancy


45,366


41,375


90,646


83,899


Depreciation and amortization


12,675


14,109


25,662


26,769


Selling and promotion


3,172


3,113


6,242


11,356


Other


57,416


48,261


109,995


98,875


Total operating expenses


3,198,448


2,163,452


6,011,753


3,848,164


Operating income


410,645


247,626


796,160


406,681


Other Income (Expense):


Interest income


2,188


2,559


4,134


7,366


Other, net


2,649


797


5,649


4,181


Other income, net


4,837


3,356


9,783


11,547


Earnings before income taxes


415,482


250,982


805,943


418,228


Income tax expense


98,508


66,794


201,019


111,258


Net earnings


316,974


184,188


604,924


306,970


Less net earnings attributable to the noncontrolling interest


602


319


1,332


757


Net earnings attributable to shareholders


$

316,372


$

183,869


$

603,592


$

306,213


Diluted earnings attributable to shareholders per share


$

1.84


$

1.09


$

3.52


$

1.80


Basic earnings attributable to shareholders per share


$

1.87


$

1.10


$

3.57


$

1.83


Weighted average diluted shares outstanding


171,677


169,290


171,660


170,382


Weighted average basic shares outstanding


169,210


166,767


169,140


167,751


EXPEDITORS INTERNATIONAL OF WASHINGTON, INC.

AND SUBSIDIARIES

Condensed Consolidated Statements of Cash Flows

(In thousands)

(Unaudited)


Three months ended June 30,


Six months ended June 30,


2021


2020


2021


2020

Operating Activities:


Net earnings


$

316,974


$

184,188


$

604,924


$

306,970


Adjustments to reconcile net earnings to net cash from operating activities:


Provisions for losses on accounts receivable


1,090


2,389


2,289


4,209


Deferred income tax expense


1,850


9,287


10,001


4,148


Stock compensation expense


30,909


21,638


42,094


32,794


Depreciation and amortization


12,675


14,109


25,662


26,769


Other, net


346


118


897


551


Changes in operating assets and liabilities:


Increase in accounts receivable


(410,783

)


(185,055

)


(663,697

)


(168,375

)

Increase in accounts payable and accrued expenses


100,118


106,760


333,271


107,677


Increase in deferred contract costs


(150,382

)


(2,333

)


(221,640

)


(18,401

)

Increase (decrease) in contract liabilities


174,504


(595

)


254,094


20,606


(Decrease) increase in income taxes payable, net


(47,994

)


20,154


(1,356

)


30,642


Decrease (increase) in other, net


1,164


16,061


(324

)


4,131


Net cash from operating activities


30,471


186,721


386,215


351,721


Investing Activities:


Purchase of property and equipment


(6,539

)


(22,114

)


(14,930

)


(28,241

)

Other, net


138


(68

)


104


(211

)

Net cash from investing activities


(6,401

)


(22,182

)


(14,826

)


(28,452

)

Financing Activities:


Proceeds from issuance of common stock


22,711


29,187


42,468


52,586


Repurchases of common stock


(62,472

)


(30,985

)


(148,469

)


(314,225

)

Dividends paid


(98,387

)


(86,815

)


(98,387

)


(86,815

)

Payments for taxes related to net share settlement of equity awards


(13,893

)


(9,170

)


(15,168

)


(10,566

)

Net cash from financing activities


(152,041

)


(97,783

)


(219,556

)


(359,020

)

Effect of exchange rate changes on cash and cash equivalents


8,699


1,726


(5,503

)


(14,285

)

Change in cash and cash equivalents


(119,272

)


68,482


146,330


(50,036

)

Cash and cash equivalents at beginning of period


1,793,393


1,111,973


1,527,791


1,230,491


Cash and cash equivalents at end of period


$

1,674,121


$

1,180,455


$

1,674,121


$

1,180,455


Taxes Paid:


Income taxes


$

143,959


$

38,504


$

190,536


$

73,808


EXPEDITORS INTERNATIONAL OF WASHINGTON, INC.

AND SUBSIDIARIES

Business Segment Information

(In thousands)

(Unaudited)


UNITED
STATES


OTHER

NORTH
AMERICA


LATIN
AMERICA


NORTH
ASIA


SOUTH
ASIA


EUROPE


MIDDLE
EAST,
AFRICA
AND
INDIA


ELIMI-
NATIONS


CONSOLI-
DATED

For the three months ended June 30, 2021:


Revenues


$

997,567


101,465


46,981


1,309,382


417,718


544,949


192,186


(1,155

)


3,609,093


Directly related cost of transportation and other expenses1


$

566,882


59,311


25,952


1,086,641


335,219


376,856


148,290


(518

)


2,598,633


Salaries and other operating expenses2


$

241,121


31,300


14,735


106,812


49,046


123,408


34,026


(633

)


599,815


Operating income


$

189,564


10,854


6,294


115,929


33,453


44,685


9,870


(4

)


410,645


Identifiable assets at period end


$

2,972,363


196,558


102,296


1,114,475


377,370


929,706


291,406


(31,003

)


5,953,171


Capital expenditures


$

2,905


64


72


400


532


2,100


466


6,539


Equity


$

2,163,114


80,802


36,316


318,111


146,583


255,006


128,148


(44,429

)


3,083,651


For the three months ended June 30, 2020:


Revenues3


$

639,226


73,679


37,553


984,715


217,152


358,060


101,571


(878

)


2,411,078


Directly related cost of transportation and other expenses1, 3


$

354,619


40,814


22,701


775,572


153,194


242,170


72,868


(451

)


1,661,487


Salaries and other operating expenses2


$

207,703


25,283


12,112


97,171


39,184


95,757


25,188


(433

)


501,965


Operating income


$

76,904


7,582


2,740


111,972


24,774


20,133


3,515


6


247,626


Identifiable assets at period end


$

1,886,463


170,873


72,912


669,335


213,007


581,988


221,381


(5,782

)


3,810,177


Capital expenditures


$

19,076


1,148


216


385


182


993


114


22,114


Equity


$

1,399,124


71,165


29,758


306,022


108,777


168,060


116,279


(37,587

)


2,161,598


UNITED
STATES


OTHER
NORTH
AMERICA


LATIN
AMERICA


NORTH
ASIA


SOUTH
ASIA


EUROPE


MIDDLE
EAST,
AFRICA
AND
INDIA


ELIMI-
NATIONS


CONSOLI-
DATED

For the six months ended June 30, 2021:


Revenues3


$

1,872,957


195,582


91,845


2,518,430


767,484


1,011,282


352,692


(2,359

)


6,807,913


Directly related cost of transportation and other expenses1, 3


$

1,069,517


112,361


52,652


2,054,170


605,163


683,765


269,399


(1,110

)


4,845,917


Salaries and other operating expenses2


$

479,819


57,037


27,112


213,732


92,211


232,863


64,301


(1,239

)


1,165,836


Operating income


$

323,621


26,184


12,081


250,528


70,110


94,654


18,992


(10

)


796,160


Identifiable assets at period end


$

2,972,363


196,558


102,296


1,114,475


377,370


929,706


291,406


(31,003

)


5,953,171


Capital expenditures


$

5,930


186


125


757


1,111


5,654


1,167


14,930


Equity


$

2,163,114


80,802


36,316


318,111


146,583


255,006


128,148


(44,429

)


3,083,651


For the six months ended June 30, 2020:


Revenues3


$

1,289,631


154,910


75,444


1,481,872


383,233


665,020


206,553


(1,818

)


4,254,845


Directly related cost of transportation and other expenses1, 3


$

728,578


86,104


46,467


1,160,075


271,515


450,488


147,787


(896

)


2,890,118


Salaries and other operating expenses2


$

433,647


48,995


23,861


154,604


69,092


177,611


51,138


(902

)


958,046


Operating income


$

127,406


19,811


5,116


167,193


42,626


36,921


7,628


(20

)


406,681


Identifiable assets at period end


$

1,886,463


170,873


72,912


669,335


213,007


581,988


221,381


(5,782

)


3,810,177


Capital expenditures


$

23,573


1,209


318


710


370


1,638


423


28,241


Equity


$

1,399,124


71,165


29,758


306,022


108,777


168,060


116,279


(37,587

)


2,161,598


Contacts

Jeffrey S. Musser
President and Chief Executive Officer
(206) 674-3433

Bradley S. Powell
Senior Vice President and Chief Financial Officer
(206) 674-3412

Geoffrey Buscher
Director - Investor Relations
(206) 892-4510


Read full story here

Next generation test system delivers greater power in less space

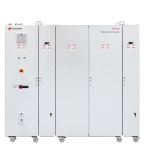
SANTA ROSA, Calif.--(BUSINESS WIRE)--$KEYS #SiC--Keysight Technologies, Inc. (NYSE: KEYS), a leading technology company that delivers advanced design and validation solutions to help accelerate innovation to connect and secure the world, announced the Scienlab SL1700A Series, the next generation battery pack test system for high voltage battery packs - up to 1500 V for automotive and industrial application.


Customers need vast labs with multiple test channels to develop batteries, but space and power supplies are limited. Keysight’s SL1700A Series utilizes new high voltage silicon carbide (SiC) technology to achieve higher efficiency and energy recovery capabilities, which is crucial to reduce overall lab costs. It provides high power in a small footprint and is modular and upgradable to address future power needs.

“Our next generation battery pack test systems based on high voltage SiC technology, provide more power and higher voltages in less space, when compared to similar systems,” said Michael Schugt, managing technology director of Keysight’s Automotive & Energy Solutions group. “When combined with the solutions energy efficiency, it allows our customers to design new batteries in their lab with greater flexibility.”

A battery pack is a complex system involving high voltages and currents, electrical and mechanical components, cooling system and a battery management system (BMS). All components require thorough testing to draw conclusions about the durability, range, efficiency and heating of the pack. Keysight’s SL1700A Series addresses these requirements and offers the following key features:

  • A small footprint to deliver high power and more output in a reduced space.
  • High energy recovery capabilities, reducing energy consumption and lowering lab running costs.
  • Synchronized control of all components in the test environment, including climate chamber, conditioning of the device under test (DUT) and BMS.
  • Recorded measured values to use as a variable during the remainder of the test sequence.
  • Direct evaluation of data using practical analysis tools: post-processing is not necessary.

About Keysight Technologies

Keysight delivers advanced design and validation solutions that help accelerate innovation to connect and secure the world. Keysight’s dedication to speed and precision extends to software-driven insights and analytics that bring tomorrow’s technology products to market faster across the development lifecycle, in design simulation, prototype validation, automated software testing, manufacturing analysis, and network performance optimization and visibility in enterprise, service provider and cloud environments. Our customers span the worldwide communications and industrial ecosystems, aerospace and defense, automotive, energy, semiconductor and general electronics markets. Keysight generated revenues of $4.2B in fiscal year 2020. For more information about Keysight Technologies (NYSE: KEYS), visit us at www.keysight.com.

Additional information about Keysight’s SL1700A Series is available here.

Additional information about Keysight Technologies is available in the newsroom at https://www.keysight.com/go/news and on Facebook, LinkedIn, Twitter and YouTube.


Contacts

Geri Lynne LaCombe, Americas/Europe
+1 303 662 4748
This email address is being protected from spambots. You need JavaScript enabled to view it.

Fusako Dohi, Asia
+81 42 660-2162
This email address is being protected from spambots. You need JavaScript enabled to view it.
The funds will be used to accelerate development of Quaise’s millimeter wave drilling technology towards its first field demonstration in the Western U.S.

CAMBRIDGE, Mass.--(BUSINESS WIRE)--Quaise Inc., an energy company pioneering millimeter wave drilling technology to access deep geothermal energy (“Quaise”), today announced that it has raised $12 million in financing from Nabors Industries (“Nabors”), a leading provider of advanced technology for the global energy industry and one of the world’s largest land drilling companies. The proceeds of this financing will be utilized to accelerate development of Quaise’s millimeter wave drilling technology towards its first field demonstration in the Western U.S., uniquely positioning the company to scale geothermal energy to terawatts.

“This partnership puts us on a path to show the true potential of geothermal within the next three years domestically,” said Quaise co-founder and CEO Carlos Araque. “Not only will Nabors’ technology development and deployment capabilities cut years of development time, but it will also provide us with an established human capital and supply chain base to scale to terawatts.”


“We believe that geothermal can play a much larger role in the energy transition,” said Anthony G. Petrello, Nabors’ Chairman, CEO and President. “We see in Quaise one of the most potentially disruptive technologies in the space, and we believe the team is well positioned to capture the ultimate potential of this technology.”

Quaise has raised a total of $18 million to date, which includes $6 million in Seed Funding led by The Engine, with participation from Collaborative Fund, Vinod Khosla and Safar Partners.

ABOUT QUAISE

Quaise is developing and commercializing novel millimeter wave drilling systems to harness geothermal energy around the globe, overcoming the geographic constraints limiting this energy source today. Quaise’s technology enables the clean energy transition by accessing the largest source of power-dense clean energy on Earth. More about Quaise www.quaise.energy.

ABOUT NABORS INDUSTRIES

Nabors Industries is a leading provider of advanced technology for the energy industry. With operations in approximately 20 countries, Nabors has established a global network of people, technology and equipment to deploy solutions that deliver safe, efficient and sustainable energy production. By leveraging its core competencies, particularly in drilling, engineering, automation, data science and manufacturing, Nabors aims to help shape the future of energy and enable the transition to a lower carbon world. Learn more about Nabors and its 100-year history of energy technology leadership: www.nabors.com.


Contacts

Media:
Carlos Araque
This email address is being protected from spambots. You need JavaScript enabled to view it.

DUBLIN--(BUSINESS WIRE)--The "Space Power Supply Market Size, Share, Trend, Forecast, & Industry Analysis: 2021-2026" report has been added to ResearchAndMarkets.com's offering.


The global space power supply market logged an impressive growth of more than 100% (year-over-year) to reach US$ 2.8 billion in 2020

The power supply system covers all aspects: generation, storage, conditioning, distribution, and conversion for space applications. Space missions can last from few minutes to decades; therefore, finding the optimum primary and secondary sources with an architecture that will make the best use remains paramount.

The space industry including space power supply is highly regulated where all parts require a rigorous quality check and legal documentation before their use in a spacecraft. Furthermore, the industry's demand for power supply products is largely impacted by new technological advancements, satellite launches, regulations (EWR 127-1, MIL-STD), etc. Major players have been hammering hard for the advancements in the existing products for meeting the changing market requirements.

SpaceX, Blue Origin, OneWeb, and Virgin Galactic are the key investment recipients in 2019, collectively embraced about US$ 3.9 billion, translating into 68% of the total investments. Despite the lingering COVID-19 pandemic, the space industry witnessed robust growth in the year 2020, making it a record year for the industry.

Market Segments' Analysis

Increasing investments in space start-ups are driving companies to launch several small satellites in the LEO orbit. More than 1,200 satellites were launched in 2020, of which more than 1,100 were small satellites. SpaceX's constellation "Starlink" deployed hundreds of communication satellites, which led the market to register an extraordinary growth in the year 2020. Furthermore, there are thousands of more such satellites already in the pipeline, ensuring a bright future for the industry in the coming years.

The space power supply market is segmented as solar panels & arrays, batteries, power modules, thermoelectric generators, and others based on the product type. Power modules dominated the market with DC convertor modules being one of the key components. The batteries segment is further classified into battery type as primary, secondary, and reserve battery as well as into material type as nickel, lithium, silver-zinc, and others. Lithium-ion batteries are likely to remain the dominant and the fastest-growing material type in the years to come.

In terms of regions, North America is likely to maintain its huge dominance in the market in the foreseen future. The USA held a huge dominance, alone capturing more than two-thirds share of the total market. The region is likely to offer the highest growth opportunities during the forecast period as well with increasing investments of start-ups and aggressive launch activities by SpaceX.

Asia-Pacific to remain the second-largest region of the market during the forecast period. The region's space budget is almost half of North America's space budget. China and India are other key countries, having a conspicuous share in the global market.

Key Players

The supply chain of this market comprises raw material suppliers, space power supply product manufacturers, space agencies, research institutes, and satellite manufacturers.

The key space power supply manufacturers are Airborne, Airbus SE, AZUR SPACE Solar Power GmbH, DHV Technology, EaglePicher Technologies, GS Yuasa Corporation, Northrup Grumman Corporation, Saft Groupe S.A., Sierra Nevada Corporation, SolAero Technologies, Inc., and Teledyne Technologies Incorporated.

Key Topics Covered:

1. Executive Summary

2. Space Power Supply Market Overview and Segmentation

2.1. Space Power Supply Market Segmentation

2.2. PEST Analysis

2.3. Supply Chain Analysis

2.4. Industry Life Cycle Analysis

2.5. Market Drivers

2.6. Market Challenges

3. Space Power Supply Market - Assessment

3.1. Space Power Supply Penetration in the Overall Space Industry

3.2. Space Power Supply Market Trend and Forecast (US$ Million)

3.3. Market Segments' Analysis (US$ Million)

3.4. Regional and Country-Level Analysis (US$ Million)

4. Competitive Analysis

4.1. Market Concentration Level

4.2. Regional Competitive Dynamics

4.3. Key Information Regarding Regional Players

4.4. Product Portfolio Analysis

4.5. New Product Launches

4.6. Strategic Alliances

4.7. Porter's Five Forces Analysis

5. Space Power Supply Market Trend and Forecast by Application Type (2021-2026)

5.1. Segment's Analysis

5.2. Solar Panels & Arrays: Trend and Forecast (US$ Million)

5.3. Batteries: Trend and Forecast (US$ Million)

5.3.1. Battery Type (Primary, Secondary, and Reserve Battery): Trend and Forecast (US$ Million)

5.3.2. Material Type (Nickel, Lithium, Silver-Zinc, and Others): Trend and Forecast (US$ Million)

5.4. Power Modules: Trend and Forecast (US$ Million)

5.5. Thermoelectric Generators: Trend and Forecast (US$ Million)

5.6. Others: Trend and Forecast (US$ Million)

6. Space Power Supply Market Trend and Forecast by Application Type (2021-2026)

6.1. Segment's Analysis

6.2. Satellites: Trend and Forecast (US$ Million)

6.2.1. Satellite Type (LEO, MEO, and GEO): Trend and Forecast (US$ Million)

6.3. Launch Vehicles: Trend and Forecast (US$ Million)

6.3.1. Vehicle Type (Small & Medium-Lift and Heavy & Super Heavy-Lift): Trend and Forecast (US$ Million)

6.4. Space Exploration: Trend and Forecast (US$ Million)

6.4.1. Regional Trend and Forecast (US$ Million)

6.4.2. Type (Rovers and Others): Trend and Forecast (US$ Million)

7. Space Power Supply Market Trend and Forecast by Region (2021-2026)

7.1. Segment's Analysis

8. Strategic Growth Opportunities

8.1. Market Attractiveness Analysis

8.2. Emerging Trends

8.3. Growth Matrix Analysis

8.4. Strategic Implications

8.5. Key Success Factors (KSFs)

9. Company Profile of Key Players

  • Airborne
  • Airbus SE
  • AZUR SPACE Solar Power GmbH
  • DHV Technology
  • EaglePicher Technologies
  • GS Yuasa Corporation
  • Northrup Grumman Corporation
  • Saft Groupe S.A.
  • Sierra Nevada Corporation
  • SolAero Technologies, Inc.
  • Teledyne Technologies Incorporated

For more information about this report visit https://www.researchandmarkets.com/r/79a3jc


Contacts

ResearchAndMarkets.com
Laura Wood, Senior Press Manager
This email address is being protected from spambots. You need JavaScript enabled to view it.

For E.S.T Office Hours Call 1-917-300-0470
For U.S./CAN Toll Free Call 1-800-526-8630
For GMT Office Hours Call +353-1-416-8900

HOUSTON--(BUSINESS WIRE)--#CCO--S&B names Jeff Sipes as its Chief Commercial Officer effective August 2. In this newly created role, Sipes will have responsibility for the commercial development and strategy of the S&B family of companies.


“Jeff is a proven leader joining S&B at the right time,” said Brook Brookshire, Chief Executive Officer of S&B. “While we remain operationally and financially strong, Jeff brings a wealth of industry experience to navigate the ever-evolving engineering, procurement and construction (EPC) industry and help guide us into the future.”

Jeff Sipes joins S&B from Bechtel, where he served as Principal Vice President and Manager of Global Business Development focused on strategic planning, customer relationships and exploration of new global markets. He also served on Bechtel’s Operating Committee.

Sipes began his career with the engineering and construction firm Chicago Bridge & Iron Company (CB&I). Over his 30+ year career, Jeff has served in project management, business development and leadership roles globally with extensive experience in Latin America, the Middle East and Asia. He holds a bachelor’s degree in civil engineering from Texas Tech University. In 2010, he was elected to the Texas Tech Civil Engineering Academy and served as an ambassador for the university’s International Experience Program.

Reporting to Brookshire and J.D. Slaughter, President of S&B, Sipes will be responsible for commercial development and strategy across the S&B family of companies: S&B Engineers and Constructors, Ltd, S&B Infrastructure, S&B Plant Services, Ltd, S&B Fabrication Services and Ford, Bacon & Davis.

“Jeff’s strength to identify opportunities in new markets and emerging geographies and his commitment to develop the next generation of industry leaders will only enhance S&B’s ability to be the best client partner and employer in the industry,” said Slaughter.

About S&B family of companies

The S&B family of companies includes engineering, procurement and construction, infrastructure, fabrication and plant services leaders S&B Engineers and Constructors, Ltd, S&B Infrastructure, S&B Plant Services, Ltd, S&B Fabrication Services, Ford, Bacon & Davis, TAI Engineers and Bibb Architects, Engineers and Constructors. Together, they serve the oil and gas, power, renewables, marine and public sectors. Connect with us on LinkedIn.


Contacts

Media Contact:
Lindsay Burke, Director of Communications and Marketing
S&B Engineers and Constructors, Ltd.
This email address is being protected from spambots. You need JavaScript enabled to view it.
518.879.2101

BURLINGTON, Ontario--(BUSINESS WIRE)--$ANRG #Anaergia--Anaergia Inc. (“Anaergia” or the “Company”) (TSX: ANRG) announced today the acquisition of its indirect subsidiary, Rhode Island Bioenergy Facility, LLC (fka Orbit Energy Rhode Island, LLC), which owns the largest industrial anaerobic digester for food and other solid organic waste recycling in New England. This acquisition expands Anaergia’s footprint in the northeastern United States and its capacity to address increasing demand for organic waste recycling.


The Rhode Island Bioenergy Facility, as the project is called, can process over 100,000 tons of organic waste per year at its location in Johnston, Rhode Island. Such waste, that otherwise would have been landfilled or incinerated, is processed into clean energy, fertilizer, and water, while reducing greenhouse gases.

Anaergia intends to see the facility is upgraded with industry leading technology and other improvements that will optimize operations and financial performance in converting organic waste into carbon negative renewable natural gas. The financial impact of this development is in line with the expectations in Anaergia’s previously released financial forecasts.

We are very pleased to welcome Anaergia to Rhode Island,” said Rhode Island Commerce President Jesse Saglio. “This facility will not only help the state achieve its waste diversion goals, but also add new food-related jobs to our economy. Anaergia complements other food-related investments made recently in the state, and this plant helps provide security to the future growth and success of this important industry.”

Our acquisition of this facility extends Anaergia’s own-and-operate activities to the East Coast of the U.S. This facility enables Anaergia to invest in sustainable infrastructure that generates high tech jobs, serves the community, and expands our capacity to generate carbon negative fuel,” said Andrew Benedek, Anaergia’s Chairman and CEO.

About Anaergia

Anaergia was created to eliminate a major source of greenhouse gases (“GHGs”) by cost effectively turning organic waste into renewable natural gas (“RNG”), fertilizer and water, using proprietary technologies. With a proven track record from delivering world leading projects on four continents, Anaergia is uniquely positioned to provide end-to-end solutions for extracting organics from waste, implementing high efficiency anaerobic digestion, upgrading biogas, producing fertilizer and cleaning water. Our customers are in the Municipal Solid Waste, Municipal Wastewater, Agriculture, and Food Processing industries. In each of these markets Anaergia has built many successful plants including some of the largest in the world. Anaergia owns and operates some of the plants it builds, and it also operates plants that are owned by its customers.

For further information, please see www.anaergia.com or contact This email address is being protected from spambots. You need JavaScript enabled to view it. or Investor Relations at This email address is being protected from spambots. You need JavaScript enabled to view it..

Forward-Looking Statements

This news release may contain forward-looking information within the meaning of applicable securities legislation, which reflects the Company’s current expectations regarding future events. Forward-looking information is based on a number of assumptions and is subject to a number of risks and uncertainties, many of which are beyond the Company’s control. Actual results could differ materially from those projected herein. Anaergia does not undertake any obligation to update such forward-looking information, whether as a result of new information, future events or otherwise, except as expressly required under applicable securities laws.


Contacts

Anaergia Inc.
This email address is being protected from spambots. You need JavaScript enabled to view it.

CARY, N.C.--(BUSINESS WIRE)--#TMS--MercuryGate® International, Inc., (MercuryGate) the largest and rapidly growing transportation management system (TMS) provider, today announced it has been named to this year’s SupplyChainBrain list of 100 Great Supply Chain Partners.


The list is the result of a six-month online poll of supply chain professionals conducted by SupplyChainBrain. The call for nominations requires buyers and partners to nominate vendors and service providers whose solutions have made a significant impact on their efficiency, customer service and overall supply chain performance.

“This award is an exceptionally gratifying win for MercuryGate,” said MercuryGate President & CEO Joe Juliano. “Recognition is only made possible through a nomination by satisfied customers and partners. We are truly honored that our partner, RockFarm Supply Chain Solutions, nominated us for the significant impact we made for their overall performance and customer success.”

MercuryGate’s commitment to each of its supply chain partners and customers has doubled over the past year to support the issues of a disrupted supply chain that resulted from a global pandemic. MercuryGate continues to actively collaborate with its more than 70 strategic partners spanning technology providers, transportation service providers, resellers and consultants to address the challenges of today and every day. Through the company’s partner ecosystem, MercuryGate is the largest aggregator of digital freight solutions to address the industry’s ongoing challenge of finding capacity at reasonable rates.

Rockfarm Supply Chain Solutions started as a MercuryGate customer and quickly created a business model around MercuryGate solutions because of the value they gained as a customer and now as a partner.

“Addressing the monumental challenges of a disrupted supply chain with agile, evolutionary analytic and machine learning capabilities in all transportation modes while providing transformational solutions to the industry's rapidly evolving needs stood out for us as a partner of MercuryGate,” said Rockfarm Chief Commercial Officer Brad Stewart. “We are pleased they were selected for this award and look forward to our continued successes in the future.”

This year marks the 19th anniversary of the much-anticipated list of 100 Great Supply Chain Partners. SupplyChainBrain’s annual list recognizes a select group of companies whose customers recognize them for providing outstanding solutions and services.

“The field was highly competitive coming from all sectors of supply chain management,” said SupplyChainBrain publisher Brad Berger. “MercuryGate emerged as one of those highly valued suppliers and we’re excited to help inform the world of their accomplishment.”

About SupplyChainBrain:

Today’s most comprehensive supply chain management information resource is accessed year-round through a wide range of ever evolving multi-media formats by hundreds of thousands of the world’s most influential supply chain executives. In addition to addressing the fundamental principles of supply-chain management, SupplyChainBrain identifies the latest news, emerging trends, technologies and best practices, forward thinking ideas and cutting-edge solutions - and continues to write and report about these as they evolve and mature. https://www.supplychainbrain.com

About MercuryGate

MercuryGate provides powerful transportation management solutions proven to be a competitive advantage for today’s most successful shippers, 3PLs, freight forwarders, brokers, and carriers. MercuryGate’s solutions are unique in their native support of all modes of transportation on a single platform including Parcel, LTL, Truckload, Air, Ocean, Rail, and Intermodal. All modes may be executed in a fully autonomous solution that is even capable of automatically adapting to disruptions as they occur. Through the continued release of innovative, results-driven technology and a commitment to making customers successful, MercuryGate delivers exceptional value for TMS users through improved productivity and operational efficiency. MercuryGate offers business intelligence to reduce costs including the cost of delivery, improve transportation processes, increase customer satisfaction and drive growth. Find out why MercuryGate has set the industry standard for the most adaptable, comprehensive transportation solutions suite in the industry at: https://mercurygate.com or on Twitter at @MercuryGate.


Contacts

Michelle Perkins
This email address is being protected from spambots. You need JavaScript enabled to view it.

DUBLIN--(BUSINESS WIRE)--The "Carbon Dioxide Market Size, Share & Trends Analysis Report by Source (Ethyl Alcohol, Substitute Natural Gas), by Application (Food & Beverage, Medical), by Region and Segment Forecasts, 2021-2028" report has been added to ResearchAndMarkets.com's offering.


The global carbon dioxide market size is expected to reach USD 10.67 billion by 2028, registering a CAGR of 4.0%

The rise in usage of carbon dioxide in sectors, such as oil & gas for enhanced oil recovery, food & beverages and healthcare, is a key driving factor for the market.

Fluctuation in crude oil prices along with a rise in the number of matured oil & gas wells are resulting in oil & gas operators implementing various techniques to enhance the drilling efficiency of the existing wells. Furthermore, oil & gas operators are adopting carbon dioxide-based enhanced oil recovery techniques, which will boost the product demand in the future.

The COVID-19 pandemic has adversely affected the market growth owing to factors, such as strict social distancing norms and lockdowns in various countries around the world. This has resulted in a reduction in demand for oil & gas as well as the shutting down of industries, such as automobile, semiconductor and consumer electronics, which affected the demand for carbon dioxide from these end users.

Major global players in the CO2 market, such as Linde plc, Air Liquide and Air Products, Inc., account for a major share. Major companies utilize merger and acquisition strategies to enhance their industry share. For instance, Linde plc was formed by the merger of Linde AG and Praxair, which got completed in October 2018.

Carbon Dioxide Market Report Highlights

  • North America accounted for the largest revenue share in 2020 owing to the presence of several CO2-based EOR projects in the region and major food & beverages manufacturing companies
  • Ethyl Alcohol emerged as the largest source segment in 2020 owing to the production of high purity CO2 and due to comparatively lower cost of production than other sources
  • The food & beverages application segment led the market in 2020 with the largest revenue share owing to the utilization of CO2 in inert gas for packing fresh meat and vegetables, carbonated beverages manufacturing and freezing & chilling of food
  • Asia Pacific is expected to witness the fastest CAGR from 2021 to 2028 due to the rise in food & beverages manufacturing companies in APAC along with the focus on the implementation of CO2-based EOR in countries, such as China, India and Indonesia
  • The medical application segment is expected to witness the second-fastest CAGR over the forecast period owing to the rise in product utilization in pure form and gas mixtures for cryotherapy, cryopreservation, anesthesia and insufflation gas

Key Topics Covered:

Chapter 1 Methodology & Scope

Chapter 2 Executive Summary

2.1 Market Outlook

2.2 Segmental Outlook

2.3 Competitive Insights

Chapter 3 Market Variables, Trends & Scope

3.1 Market Lineage Outlook

3.1.1 Global Industrial Gases Market Outlook

3.2 Penetration & Growth Prospect Mapping

3.3 Industry Value Chain Analysis

3.3.1 Carbon Dioxide Source Trends

3.3.1.1 Procurement Best Practices

3.3.2 Carbon Dioxide: Sales Channel Analysis

3.3.3 Carbon Dioxide: Vendor Selection Criteria Analysis

3.3.4 Profit Margin Analysis

3.4 Technology Overview

3.4.1 Carbon Capture and Storage (CCS)

3.4.2 Technology Trends

3.5 Regulatory Framework

3.5.1 Standard & Compliances

3.5.2 Safety

3.6 Environmental Impact Analysis

3.7 Market Dynamics

3.7.1 Market Driver Analysis

3.7.1.1 Increasing use of carbon dioxide in enhanced oil recovery (EOR)

3.7.1.2 Increasing consumption of carbon dioxide in the medical industry

3.7.2 Market Restraint Analysis

3.7.2.1 Increasing carbon emissions & high cost of carbon capture & storage (CCS) technology

3.8 Trade Analysis

3.8.1 Major Importers, Key Country Analysis 2020

3.8.2 Major Exporters, Key Country Analysis 2020

3.9 Business Environment Analysis: Carbon Dioxide Market

3.9.1 Industry Analysis - Porter's

3.9.2 Pestel analysis

3.10 Major Liquefaction Plants

3.11 Carbon Pricing Initiatives

3.12 Carbon Pricing Emission Coverage & Tax Composition

3.12.1 Carbon Price Gaps In Different Sectors

3.12.2 Estimated Emission Coverage & Permit Price

3.12.3 Effective Carbon Prices

3.13 Impact of COVID-19 on Carbon Dioxide Market

Chapter 4 Global Carbon Dioxide Market: Source Estimates & Trend Analysis

4.1 Definition & Scope

4.2 Global Carbon Dioxide Market: Source Movement Analysis, 2020 & 2028

4.3 Market size & forecasts and trend analysis, 2016 to 2028 for the following:

4.3.1 Hydrogen

4.3.2 Ethyl Alcohol

4.3.3 Ethylene Oxide

4.3.4 Substitute Natural Gas

Chapter 5 Global Carbon Dioxide Market: Application Estimates & Trend Analysis

5.1 Definition & Scope

5.2 Global Carbon Dioxide Market: Application Movement Analysis, 2020 & 2028

5.3 Market size & forecasts and trend analysis, 2016 to 2028 for the following:

5.3.1 Food & Beverage

5.3.2 Oil & Gas

5.3.3 Medical

5.3.4 Rubber

5.3.5 Fire Fighting

Chapter 6 Global Carbon Dioxide Market: Regional Estimates & Trend Analysis

6.1 Definition & Scope

6.2 Global Carbon Dioxide Market: Regional Movement Analysis, 2020 & 2028

6.3 Global Carbon Dioxide Market: Regional Movement Analysis, 2016 to 2028

Chapter 7 Global Carbon Dioxide Market - Competitive Landscape

7.1 Key Global Players & Recent Market Developments & Their Impact On The Industry

7.2 Major Deals & Strategic Alliances Analysis

7.3 Vendor Landscape

7.3.1 Key Company Market Positioning Analysis, 2020

Chapter 8 Company Profiles

  • Air Liquide
  • Linde plc
  • Air Products and Chemicals, Inc.
  • Taiyo Nippon Sanso Corporation
  • Messer
  • SOL Group
  • Sicgil India Limited
  • Strandmollen A / S
  • ACAIL Gas
  • Gulf Cryo

For more information about this report visit https://www.researchandmarkets.com/r/gccvl9


Contacts

ResearchAndMarkets.com
Laura Wood, Senior Press Manager
This email address is being protected from spambots. You need JavaScript enabled to view it.

For E.S.T Office Hours Call 1-917-300-0470
For U.S./CAN Toll Free Call 1-800-526-8630
For GMT Office Hours Call +353-1-416-8900

SOMERSET, N.J.--(BUSINESS WIRE)--Catalent, Inc. (NYSE: CTLT), the leading global provider of advanced delivery technologies, development, and manufacturing solutions for drugs, biologics, cell and gene therapies, and consumer health products, announced that, effective July 1, 2021, 97% of its electricity usage across its global network is being procured from renewable energy sources such as wind, solar, hydroelectric, and biomass. Catalent will purchase renewable energy certificates for all of its sites operating in North America, South America and Europe, as well as the majority of its Asia-based facilities.


Catalent also recently signed a letter of commitment with the Science-Based Target initiative (SBTi), joining a growing list of companies setting actionable, science-based, greenhouse gas emission reduction targets to limit global warming. This commitment will include calculating and reducing direct and indirect emissions as the Company continues to evolve and grow.

“As a leader in the growing CDMO industry, we need to demonstrate our shared commitment, sense of urgency, and value in contributing to the responsibility and long-term sustainability of the entire biopharma sector. Sourcing the majority of our electricity from renewable sources will contribute to our overall greenhouse gas reduction efforts, which is a significant milestone towards doing our part and meeting our science-based target commitment, and I could not be prouder of Catalent’s progress over the last several years in terms of our environment, social and governance strategy,” said John Chiminski, Chair and Chief Executive Officer at Catalent.

To learn more about Catalent’s full Environment, Social and Governance (ESG) strategy, download the most recent Report at https://www.catalent.com/about-us/corporate-responsibility/ or request further information at This email address is being protected from spambots. You need JavaScript enabled to view it..

Notes for Editors

About Catalent, Inc.

Catalent, Inc. (NYSE: CTLT), an S&P 500® company, is the leading global provider of advanced delivery technologies, development, and manufacturing solutions for drugs, biologics, cell and gene therapies, and consumer health products. With over 85 years serving the industry, Catalent has proven expertise in bringing more customer products to market faster, enhancing product performance and ensuring reliable global clinical and commercial product supply. Catalent employs approximately 15,000 people, including around 2,400 scientists and technicians, at more than 45 facilities, and in fiscal year 2020 generated over $3 billion in annual revenue. Catalent is headquartered in Somerset, New Jersey. For more information, visit www.catalent.com.

MORE PRODUCTS. BETTER TREATMENTS. RELIABLY SUPPLIED.™

FORWARD-LOOKING STATEMENTS

This release contains both historical and forward-looking statements. All statements other than statements of historical fact, are, or may be deemed to be, forward-looking statements within the meaning of Section 27A of the Securities Act of 1933, as amended, and Section 21E of the Securities Exchange Act of 1934, as amended. These forward-looking statements generally can be identified by the use of statements that include phrases such as “believe,” “expect,” “anticipate,” “intend,” “estimate,” “plan,” “project,” “foresee,” “likely,” “may,” “will,” “would,” or other words or phrases with similar meanings. Similarly, statements that describe Catalent’s objectives, plans, or goals are, or may be, forward-looking statements, including statements concerning Catalent’s commitments to rely on renewable energy and its commitments to calculating and implementing science-based targets for GHG emissions. These statements are based on current expectations of future events. If underlying assumptions prove inaccurate or unknown risks or uncertainties materialize, actual results could vary materially from Catalent’s expectations and projections. Some of the factors that could cause actual results to differ include, but are not limited to, the following: the current or future effects of the COVID-19 pandemic on Catalent’s and its clients’ businesses; participation in a highly competitive market and increased competition that may adversely affect Catalent’s business; demand for its offerings, which depends in part on its customers’ research and development and the clinical and market success of their products; product and other liability risks that could adversely affect Catalent’s results of operations, financial condition, liquidity and cash flows; failure to comply with existing and future regulatory requirements; failure to provide quality offerings to customers could have an adverse effect on Catalent’s business and subject it to regulatory actions and costly litigation; problems providing the highly exacting and complex services or support required; global economic, political and regulatory risks to Catalent’s operations; inability to enhance existing or introduce new technology or service offerings in a timely manner; inadequate patents, copyrights, trademarks and other forms of intellectual property protections; fluctuations in the costs, availability, and suitability of the components of the products Catalent manufactures, including active pharmaceutical ingredients, excipients, purchased components and raw materials; changes in market access or healthcare reimbursement in the United States or internationally; fluctuations in the exchange rate of the U.S. dollar against other currencies, including as a result of the U.K.’s exit from the European Union; adverse tax legislative or regulatory initiatives or challenges or adjustments to Catalent’s tax positions; loss of key personnel; risks generally associated with information systems; inability to complete any future acquisitions or other transactions that may complement or expand its business or divest of non-strategic businesses or assets and difficulties in successfully integrating acquired businesses and realizing anticipated benefits of such acquisitions; risks associated with timely and successfully completing, and correctly anticipating the future demand predicted for, capital expansion projects at existing facilities, offerings and customers’ products that may infringe on the intellectual property rights of third parties; environmental, health and safety laws and regulations, which could increase costs and restrict operations; labor and employment laws and regulations or labor difficulties, which could increase costs or result in operational disruptions; additional cash contributions required to fund Catalent’s existing pension plans; substantial leverage that may limit its ability to raise additional capital to fund operations and react to changes in the economy or in the industry; exposure to interest-rate risk to the extent of its variable-rate debt preventing it from meeting its obligations under its indebtedness; the availability of renewable energy in quantities and at prices that are economically feasible for Catalent; and changes to environmental standards, guidance, or related technological capabilities that may render it more expensive or more difficult to reach environmental goals. For a more detailed discussion of these and other factors, see the information under the caption “Risk Factors” in Catalent’s Annual Report on Form 10-K for the fiscal year ended June 30, 2020, filed August 31, 2020. All forward-looking statements speak only as of the date of this release or as of the date they are made, and Catalent does not undertake to update any forward-looking statement as a result of new information or future events or developments except to the extent required by law.


Contacts

Media Contacts:

Chris Halling
+44 (0)7580 041073
This email address is being protected from spambots. You need JavaScript enabled to view it.

Richard Kerns
+44 (0) 161 728 5880
This email address is being protected from spambots. You need JavaScript enabled to view it.

Investor Contact:

Paul Surdez
+1 (732) 537-6325
This email address is being protected from spambots. You need JavaScript enabled to view it.

BRAWLEY, Calif.--(BUSINESS WIRE)--#bioenergy--California Ethanol + Power (CE+P) announced today that it is partnering with the Joint BioEnergy Institute (JBEI), a Bioenergy Research Center of the U.S. Department of Energy (DOE) to develop scalable next-generation renewable energy products using biomass from CE+P’s planned sugarcane ethanol facility in Imperial County, Calif.


In addition, CE+P Permitting Manager Nathan M. deBoom has been named a member of JBEI’s Advisory Committee, which is comprised of strategic advisors from across the research spectrum including representatives from national labs, academia, and industry.

The new partnership will jointly pursue research and grants to support new technologies and processes for breaking down byproducts of the planned sugarcane crop as a source for even lower-carbon energy products, including advanced cellulosic ethanol. In addition to JBEI, research will also be implemented by the Advanced Biofuels and Bioproducts Process Development Unit (ABPDU) of the Lawrence Berkeley National Lab (Berkeley Lab).

“We are excited and honored to partner with JBEI and ABPDU and look forward to working together to revolutionize the science of producing even lower carbon fuels,” said Ronald G. Blake Jr., Chief Financial Officer for CE+P. “We envision this work could create new opportunities for the entire Biofuel industry, and ultimately our operation as well by enhancing the output of our Sugar Valley Energy campus.”

"The world has not yet cracked the problem of cost-effective conversion of lignocellulosic biomass into higher value products, and we intend to do just that with CE+P as applied to sugarcane non-food waste streams,” said Blake Simmons, JBEI Chief Science & Technology Officer. “This is a great opportunity for JBEI and CE+P to demonstrate an affordable and scalable technology that could benefit the local community but also be applied more broadly to help meet the challenges of climate change."

Simmons added JBEI has developed a patent-pending approach that begins by treating biomass with a class of inexpensive solvents called alkanolamines. Alkanolamines are distillable, meaning that they can be efficiently recovered and reused in the same process. Initial lab tests have demonstrated that the alkanolamines release very high levels of sugars, as well as a separate stream of lignin. The system is run at low temperature and requires minimal energy input.

About California Ethanol + Power (CE+P)


CE+P is a development company that intends to develop, construct, operate and own numerous facilities that will convert locally grown sugarcane into Essential EthanolTM, a sustainable, renewable and extremely low carbon transportation fuel that will assist California in meeting its groundbreaking AB32 requirements. CE+P is committed to employing processes and equipment that are both commercially proven and financeable, while also meeting California’s stringent environmental regulations.

About JBEI

The Joint BioEnergy Institute (JBEI) is a U.S. Department of Energy (DOE) Bioenergy Research Center program combining the scientific talent, expertise, resources, and support of six national laboratories and six academic institutions. Inside JBEI’s Emeryville, CA laboratories, researchers are using the latest tools in molecular biology, chemical engineering, computational and robotic technologies to transform biomass into biofuels and bioproducts.

About ABPDU

The Advanced Biofuels and Bioproducts Process Development Unit’s (ABPDU) mission is to expedite the commercialization of advanced, next-generation biofuels and bioproducts by providing industry-scale test beds. The Department of Energy’s (DOE) Bioenergy Technologies Office established ABPDU as part of Lawrence Berkeley National Laboratory (Berkeley Lab) in 2011. Strategically located in the San Francisco Bay Area’s bio-innovation hub, and part of Berkeley Lab, ABPDU is uniquely situated to enable the local and national bioeconomy. ABPDU has access to cutting-edge national research organizations, academic centers of excellence, and major industries.

#biofuels #biomass #bioenergy #lowcarbonfuels #research #science #futureofenergy


Contacts

Barbara Caruso, 714/328-3273
This email address is being protected from spambots. You need JavaScript enabled to view it.

Phil Vandermost, 949/289-3632
This email address is being protected from spambots. You need JavaScript enabled to view it.

ARLINGTON, Va.--(BUSINESS WIRE)--#NSTA--Shell Oil Company and the National Science Teaching Association (NSTA) today announced the grand prize winners in the Shell Science Lab Regional Challenge. The competition encouraged K-12 teachers who have found innovative ways to deliver quality lab experiences with limited school and laboratory resources to share their approaches for a chance to win a school science lab makeover support package.


“We are extremely proud of this year’s grand prize winners. Their innovative approaches, creative ideas, and unwavering commitment to give their very best to their students—and to the community, as they engage and motivate the STEM leaders of tomorrow—is commendable and inspiring,” said Dr. Frazier Wilson, VP, Shell Oil Company Foundation Director, Workforce Development and Diversity Outreach. “We are so pleased to have the opportunity to partner with teachers to help in furthering quality science education in the classroom.”

To enter the Shell Science Lab Regional Challenge, K-12 science teachers located in select school districts near Shell assets were asked to describe their school’s current laboratory resources, explain why laboratory upgrade support is needed, and describe their approach to science education instruction utilizing their school’s current lab facilities. A panel of science educators then reviewed and selected the top entries.

“The Shell Science Regional Challenge grand prize winners are model educators for teachers, both in their home state and across the country,” said Dr. Elizabeth Allan, NSTA Retiring President. “We are proud to honor them for their hard work, originality, dedication to the art of science teaching, and commitment to their students’ academic achievement.”

2021 Shell Science Lab Regional Challenge Grand Prize Winners

Elementary School Level: Anne Marie Wotkyns, Kittridge School for Advanced Studies, Van Nuys, California

Anne Marie Wotkyns’ science teaching philosophy embraces the idea that all children have an innate curiosity and desire to investigate the world around them, and her role is to foster that curiosity and lead students to make discoveries through hands-on investigations and activities. In her science lab, Wotkyns instills confidence and fosters a passion for learning by having students work in cooperative groups, with each student responsible for different jobs or tasks. Winning the Shell Science Regional Lab Challenge award has made a big difference in her STEM lab and in the way her students engage with science. Wotkyns purchased items for when students return to class full-time, but she also provided her current remote-learning students an opportunity to engage in hands-on science by purchasing supplies to send home, making baggies containing eye droppers, hand lenses, rock samples, meter tapes, seeds, small pots, magnets, and other small items. These supplies have allowed students to be actively engaged while learning from home. Wotkyns made creative decisions to best use the kits for distance learning while she taught the lessons. Having appropriate equipment to fully participate in inquiry-based learning develops the scientist in each child, building enthusiasm and interest that sets the stage for future learning.

Middle School Level: Melissa Story, Clark Shaw Magnet School, Mobile, Alabama

Melissa Story’s approach to teaching science is allowing students to discover scientific concepts through inquiry. Students must be able to work with others, collaborate, and share ideas in the future job market. Learning with hands-on activities, using the science and engineering design process, and relating content to real-world experiences are all important aspects of her teaching strategies. This year has proven extremely difficult for these types of activities, but it has been a year that showed that this type of collaboration has still been so important to keep students connected and engaged. Story took over for the original teacher that received this award and made an extraordinary effort to get guidance and assistance regarding the grant. Story teaches two STEM classes daily. Her classes need equipment to help model and investigate the watershed and show how the water cycle is a global process through experimentation. One of the most exciting STEM activities students have done is designing, building, and testing/racing dragsters. This project gets the students involved in the engineering process on many different levels. Story would love to purchase the consumable materials needed for learners to design, build, and test their own dragsters and gain experience using equipment such as the drill press and band saw. The school would be able to use this equipment in a makerspace lab where students will design, create, and test their prototypes. Having this equipment will enhance Story’s teaching abilities, greatly impact students’ learning.

High School Level: Tyler Dufrene and Cecelia Gillam, Hahnville High School, Boutte, Louisiana

Tyler Dufrene and Cecelia Gillam teach science through demonstrations, lectures, discussions, simulations, field trips, inquiry-based labs, and real-world projects. This affords students the opportunity for active learning, intellectual engagement, creativity, and personal accountability. Their class is currently collaborating on The Thirst Project—a non-profit organization that aims to bring safe drinking water to communities around the world. Relating the topic back to classes, students study and design effective filters to develop fresh drinking water. Dufrene and Gillam used the NSTA Shell grant to purchase several water test kits and accessories for students to conduct real-world investigations. Students researched and created their own water filters to purify water in a low-cost, effective manner. Students also met with a Thirst Project Ambassador, who explained the water crisis and how it affects many impoverished communities throughout the world. Students learned of ways that they could make a difference and then took on such challenges by engaging in hands-on experiments. Throughout these investigations, students met several NGSS standards while incorporating all aspects of STEAM—students became the “scientists.” Winning the NSTA Shell grant helped generate greater awareness of STEM/STEAM locally, nationally, and around the world. Participating in the Thirst Project afforded students the opportunity to become globally aware citizens with an understanding of the environmental issues impacting the world. Many students voiced how this project helped them decide which career they want to pursue.

In addition to the school science lab makeover support package—valued at $10,000 (for the elementary and middle level winners) and $15,000 (for the high school level winner)—each grand prize winning teacher will receive an additional $5,000 of support to attend a future NSTA National Conference on Science Education.

In lieu of the in-person event that typically takes place annually at the NSTA National Conference, the grand prize winners and their principals were formally recognized for their achievement during a virtual award ceremony that took place in May.

For more information about the Challenge, visit the competition web site.

About NSTA

The National Science Teaching Association (NSTA) is a vibrant community of 40,000 science educators and professionals committed to best practices in teaching science and its impact on student learning. NSTA offers high quality science resources and continuous learning so that science educators grow professionally and excel in their career. For new and experienced teachers alike, the NSTA community offers the opportunity to network with like-minded peers at the national level, connect with mentors and leading researchers, and learn from the best in the field.

About Shell Oil Company

Shell Oil Company is an affiliate of the Royal Dutch Shell plc, a global group of energy and petrochemical companies with operations in more than 70 countries. In the U.S., Shell operates in 50 states and employs more than 20,000 people working to help tackle the challenges of the new energy future.


Contacts

Shell Oil Company Media Line 832-33-SHELL

Kate Falk, NSTA
(703) 312-9211
This email address is being protected from spambots. You need JavaScript enabled to view it.

IGNACIO, Colo.--(BUSINESS WIRE)--#energy--The Southern Ute Indian Tribe today became the newest member of Western States and Tribal Nations (WSTN) Natural Gas Initiative, expanding the organization’s sovereign tribal perspective and strengthening its voice to advocate for energy development that boosts rural economies, tribal self-determination and environmental improvement.


The Tribe’s decision to join WSTN bolsters the governance of the unique international initiative led by sovereign tribal nations, states and county governments. As the latest government to sign WSTN’s organizing Memorandum of Understanding, the Southern Ute Indian Tribe is entitled to appoint a representative to the Board of Directors.

The Southern Ute Indian Tribe is the third tribally-affiliated member of WSTN, joining the Ute Indian Tribe and BlackHawk Energy, a wholly owned Section 17 Federal Corporation of the sovereign Jicarilla Apache Nation established under a federal charter. The other government members are the states of New Mexico, Utah, Wyoming and Baja California, Mexico, as well as the western Colorado counties of Garfield, Mesa, Moffat and Rio Blanco.

“The Southern Ute Indian Tribe has a strong and successful legacy in energy and economic development. The Tribe understands the benefit of strong business and intergovernmental relationships to strengthen its self-determination and sovereignty,” Southern Ute Tribal Chairman Melvin J. Baker said. “The Tribe is excited for the opportunity to join Western States and Tribal Nations and have a seat on the board encompassing multiple tribes, states and counties focused on supporting rural economies while collaborating to provide energy transition solutions for the future.”

WSTN advocates for rural economic development, tribal self-determination and a cleaner environment by supporting the development of the markets and infrastructure necessary to export liquefied natural gas, sourced from western North American basins, to nations that want lower-emitting fuel options to power growing economies. In June, WSTN released a study showing that net lifecycle emissions reductions of 42%-55% were possible if U.S.-sourced LNG replaced coal for power generation in five Asian nations.

“The Ute Indian Tribe welcomes the Southern Ute Tribe to Western States and Tribal Nations. As co-founders of this unique organization, our mission has always been to attract more Native American voices to our effort to advance tribal self-determination through responsible development of our energy resources,” said Shaun Chapoose, Chairman of the Ute Tribal Business Committee.

He added: “As the original guardians of the environment, sovereign tribal nations are uniquely equipped to chart a course toward energy development that supports our continual environmental improvement. With the participation of the Southern Ute Tribe and the Jicarilla Apache Nation through their wholly owned Section 17 Federal Corporation, BlackHawk Energy, our collective voice is stronger and makes good on the vision we foresaw when we insisted that the name of the organization reflect more than a single tribal nation.”

“The addition of the Southern Ute Indian Tribe to WSTN is another landmark for our organization and its ability to provide a coherent, unifying direction for the energy and environmental future of the West,” WSTN President Andrew Browning said. “The Southern Ute Indian Tribe brings not only another sovereign tribal perspective, but a sophisticated approach toward doing business in a way that builds wealth for its people in harmony with the environment.”

“New Mexico welcomes the Southern Ute Indian Tribe to the coalition. We look forward to collaborating on economic opportunities for our region,” New Mexico Energy, Minerals and Natural Resources Department Cabinet Secretary Sarah Cottrell Propst said.

“We welcome the Southern Ute Tribe and look forward to working together to advance the interests of Western States and Tribal Nations for the benefit of our communities,” Glen Murrell, Executive Director of the Wyoming Energy Authority said.

About Western States and Tribal Nations

Western States and Tribal Nations is a unique, trans-national initiative led by state, county and sovereign tribal nation governments, focused on creating rural economic development, advancing tribal self-determination and reducing global emissions by exporting western North American natural gas to international markets that need lower-emitting fuels.


Contacts

Bryson Hull
P: 202-657-2855
This email address is being protected from spambots. You need JavaScript enabled to view it.

Offshore Source Logo

Offshore Source keeps you updated with relevant information concerning the Offshore Energy Sector.

Any views or opinions represented on this website belong solely to the author and do not represent those of the people, institutions or organizations that Offshore Source or collaborators may or may not have been associated with in a professional or personal capacity, unless explicitly stated.

Corporate Offices

Technology Systems Corporation
8502 SW Kansas Ave
Stuart, FL 34997

info@tscpublishing.com