Business Wire News

HOUSTON--(BUSINESS WIRE)--Archaea Energy Inc. (“Archaea,” “the Company,” or “we”) (NYSE: LFG), one of the largest producers of renewable natural gas (“RNG”) in the U.S., today announced financial and operating results for the three and nine months ended September 30, 2022.


FINANCIAL HIGHLIGHTS

  • Revenue of $105.0 million and net equity investment income of $2.9 million for the three months ended September 30, 2022 and revenue of $239.1 million and net equity investment income of $7.1 million for the nine months ended September 30, 2022.
  • Net loss1 of $24.2 million for the three months ended September 30, 2022 and $24.8 million for the nine months ended September 30, 2022.
  • Net loss per Class A Common Share (basic) of $0.18 for the three months ended September 30, 2022 and $0.15 for the nine months ended September 30, 2022.
  • Produced and sold 2.42 million MMBtu of RNG for the three months ended September 30, 2022 and 6.00 million MMBtu of RNG for the nine months ended September 30, 2022.2
  • Produced and sold 260 thousand MWh of electricity for the three months ended September 30, 2022 and 584 thousand MWh of electricity for the nine months ended September 30, 2022.2

PENDING MERGER

In October, the Company announced that it has agreed to be acquired by bp (NYSE: BP) for $26 per share in cash, or a total enterprise value of approximately $4.1 billion, including approximately $800 million of net debt. Subject to regulatory approvals and Archaea shareholder approval, the parties are targeting closing the transaction (“the Merger”) by the end of 2022. In light of the transaction, the Company will not be hosting an earnings conference call or webcast to discuss its financial results and the Company will not be providing guidance for the fourth quarter or fiscal year 2022.

SUMMARY AND REVIEW OF FINANCIAL RESULTS

The following results for the three months and nine months ended September 30, 2022 are presented on a consolidated basis.

($ in thousands)

Three Months Ended September 30, 2022


Nine Months Ended September 30, 2022

Revenue

$

104,993


$

239,109


Equity Investment Income, Net


2,945


7,067


Net Loss1


(24,235

)


(24,783

)


RNG Production Sold2 (MMBtu)


2,418,057


5,995,854


Electricity Production Sold2 (MWh)


259,960


584,346


RNG production sold for the three months and nine months ended September 30, 2022 was positively impacted by incremental production from the Assai and Soares RNG facilities which were completed in December 2021 and January 2022, respectively, and increased uptime, methane recovery, and RNG production from certain plant optimization initiatives. RNG production sold for the nine months ended September 30, 2022 was also negatively impacted by downtime at certain facilities related to winter weather and maintenance activities during the first quarter.

Electricity production sold for the three months and nine months ended September 30, 2022 was positively impacted by efficiency improvements across the Company’s asset portfolio and incremental production from the INGENCO3 power assets after the acquisition closed in July 2022. Electricity production sold for the nine months ended September 30, 2022 was also negatively impacted by winter seasonality in the first quarter.

Revenues for the three months and nine months ended September 30, 2022 were positively impacted by RNG production from Assai, incremental electricity production from the INGENCO power assets, and strong market pricing of Environmental Attributes4, natural gas, and electricity.

Net loss for the three months and nine months ended September 30, 2022 was primarily driven by increased general and administrative expense, higher cost of energy due to higher gas costs, electric utility costs, and employee costs, as well as higher royalties due to higher energy revenues, partially offset by strong market pricing of Environmental Attributes, natural gas, and electricity. Expenses for the three months ended September 30, 2022 included $10.7 million for non-recurring legal and professional fees and other non-recurring costs primarily associated with the Merger, the formation of Lightning Renewables, LLC, and the acquisition of INGENCO. Net loss for the three months ended September 30, 2022 was also driven by losses from changes in fair value of warrant derivatives, and net loss for the nine months ended September 30, 2022 was also partially offset by gains from changes in fair value of warrant derivatives.

ACCOUNTING TREATMENT OF LIGHTNING RENEWABLES, LLC

The Company has determined that Lightning Renewables, LLC is a variable interest entity (“VIE”) and the Company is the primary beneficiary; therefore, the Company consolidates Lightning Renewables, LLC. The ownership interests of Lighting Renewables, LLC not owned by the Company are reflected as nonredeemable noncontrolling interests.

LIQUIDITY AND CAPITAL INVESTMENTS

As of September 30, 2022, Archaea had cash and cash equivalents of $299.5 million including cash of $191.4 million of the Lightning Renewables, LLC VIE, restricted cash of $19.2 million, and $278.9 million of available borrowing capacity under the revolving credit facility after taking into consideration outstanding letters of credit.

Capital Investments

Total cash used in investing activities was $366.3 million for the three months ended September 30, 2022. Archaea spent $98.0 million on development activities and $267.5 million, net of cash acquired, primarily related to the acquisition of INGENCO and other landfill gas right assets. Development activities in the three months ended September 30, 2022 were related to supply chain purchases, deposits on long-lead equipment and subcomponents, and construction and optimization across the Company’s various plants and projects in development. The Company also made contributions to equity method investments totaling $2.8 million and received return of investment in equity method investments of $2.1 million.

Total cash used in investing activities was $499.9 million for the nine months ended September 30, 2022. Archaea spent $225.9 million on development activities and $274.6 million, net of cash acquired, primarily related to the acquisition of INGENCO and other landfill gas right assets. Development activities in the nine months ended September 30, 2022 were related to supply chain purchases, deposits on long-lead equipment and subcomponents, and construction and optimization across the Company’s various plants and projects in development. The Company also made contributions to equity method investments totaling $10.8 million and received return of investment in equity method investments of $9.5 million.

1. Unless otherwise specified, net income (loss) as shown herein is before net income (loss) attributable to both nonredeemable and redeemable noncontrolling interest. For information regarding net income (loss) attributable to Class A Common Stock, please see the Consolidated Statements of Operations included in this release.
2. Volumes produced and sold include production from the Company’s wholly-owned facilities and its proportionate share of production from its equity method investment facilities.
3. NextGen Power Holdings LLC and its subsidiaries.
4. Environmental Attributes refer to federal, state, and local government incentives in the United States, provided in the form of RINs, Renewable Energy Credits, Lower Carbon Fuel Standard credits, renewable thermal certificates, rebates, tax credits, and other incentives to end users, distributors, system integrators and manufacturers of renewable energy projects, that promote the use of renewable energy.

ABOUT ARCHAEA

Archaea Energy Inc. is one of the largest RNG producers in the U.S., with an industry-leading platform and expertise in developing, constructing, and operating RNG facilities to capture waste emissions and convert them into low carbon fuel. Archaea’s innovative, technology-driven approach is backed by significant gas processing expertise, enabling Archaea to deliver RNG projects that are expected to have higher uptime and efficiency, faster project timelines, and lower development costs. Archaea partners with landfill and farm owners to help them transform potential sources of emissions into RNG, transforming their facilities into renewable energy centers. Archaea’s differentiated commercial strategy is focused on long-term contracts that provide commercial partners a reliable, non-intermittent, sustainable decarbonizing solution to displace fossil fuels.

Additional information is available at www.archaeaenergy.com.

FORWARD-LOOKING STATEMENTS

This release contains certain statements that may include forward-looking statements within the meaning of Section 27A of the Securities Act of 1933, as amended, and Section 21E of the Securities Exchange Act of 1934, as amended. Statements that do not relate strictly to historical or current facts are forward-looking and usually identified by the use of words such as “anticipate,” “estimate,” “could,” “would,” “should,” “will,” “may,” “forecast,” “approximate,” “expect,” “project,” “intend,” “plan,” “believe” and other similar words. Forward looking statements are based on current expectations, estimates, projections, targets, opinions and/or beliefs of Archaea, and such statements involve known and unknown risks, uncertainties and other factors.

The risks and uncertainties that could cause those actual results to differ materially from those expressed or implied by these forward looking statements include, but are not limited to: (a) the risk that the pending merger may not be completed in a timely manner or at all, which may adversely affect Archaea’s business and the price of Archaea’s Class A Common Stock; (b) the failure to satisfy any of the conditions to the consummation of the pending merger, including the receipt of certain regulatory approvals and stockholder approval; (c) the occurrence of any event, change, or other circumstance or condition that could give rise to the termination of the merger agreement; and (d) other risks and uncertainties described in Archaea’s Annual Report on Form 10-K for the year ended December 31, 2021, including those under “Risk Factors” therein, Archaea’s Quarterly Report on Form 10-Q for the quarterly period ended September 30, 2022 and other documents filed or to be filed by Archaea with the Securities and Exchange Commission.

Forward-looking statements should not be relied upon as representing Archaea’s views as of any subsequent date. Archaea does not undertake any obligation to update forward-looking statements to reflect events or circumstances after the date they were made, whether as a result of new information, future events, or otherwise, except as may be required under applicable securities laws.

(Financial Tables and Supplementary Information Follow)

ARCHAEA ENERGY INC.

Consolidated Statements of Operations (Unaudited)


Three Months Ended September 30,


Nine Months Ended September 30,

(in thousands, except shares and per share


2022


2021


2022


2021


Revenues and Other Income


Energy revenue

$

98,377


$

10,916


$

222,528


$

13,975


Other revenue


3,894


865


8,322


4,588


Amortization of intangibles and below-market contracts


2,722


205


8,259


205


Total Revenues and Other Income

$

104,993


$

11,986


$

239,109


$

18,768


Equity Investment Income, Net


2,945


879


7,067


879


Cost of Sales


Cost of energy


63,253


9,478


138,531


12,625


Cost of other revenues


3,109


615


7,049


2,976


Depreciation, amortization and


16,972


3,142


43,191


4,077


Total Cost of Sales


83,334


13,235


188,771


19,678


General and administrative expenses


30,478


11,889


75,714


22,933


Operating Income (Loss)


(5,874

)


(12,259

)


(18,309

)


(22,964

)

Other Income (Expense)


Interest expense, net


(10,575

)


(1,586

)


(16,941

)


(1,606

)

Gain (loss) on warrants and derivative contracts


(7,605

)


(10,413

)


10,575


(10,413

)

Other income (expense)


(124

)


81


78


377


Total Other Income (Expense)


(18,304

)


(11,918

)


(6,288

)


(11,642

)

Income (Loss) Before Income


(24,178

)


(24,177

)


(24,597

)


(34,606

)

Income tax expense


57


186


Net Income (Loss)


(24,235

)


(24,177

)


(24,783

)


(34,606

)

Net income (loss) attributable to nonredeemable noncontrolling interests


(2,020

)


(335

)


(2,020

)


(589

)

Net income (loss) attributable to Legacy Archaea


(8,569

)


(18,744

)

Net income (loss) attributable to redeemable noncontrolling interests


(7,224

)


(8,262

)


(11,295

)


(8,262

)

Net Income (Loss) Attributable to Class A Common Stock

$

(14,991

)


$

(7,011

)


$

(11,468

)


$

(7,011

)

Net income (loss) per Class A common share:


Basic (1)

$

(0.18

)


$

(0.13

)


$

(0.15

)


$

(0.13

)

Diluted (1)

$

(0.18

)


$

(0.13

)


$

(0.18

)


$

(0.13

)

Weighted average shares of Class A Common Stock outstanding:


Basic (1)


81,044,814


52,847,195


76,034,987


52,847,195


Diluted (1)


81,044,814


52,847,195


78,542,786


52,847,195


(1) Class A Common Stock is outstanding beginning September 15, 2021 due to the reverse recapitalization transaction described in the Company’s Annual Report on Form 10-K for the year ended December 31, 2021.

ARCHAEA ENERGY INC.

Consolidated Balance Sheets (Unaudited)


(in thousands, except shares and per share data)

September 30, 2022


December 31, 2021

ASSETS


Current Assets


Cash and cash equivalents ($191,404 related to VIE)

$

299,467


$

77,860


Restricted cash


19,225


15,206


Accounts receivable, net ($40 related to VIE)


47,255


37,010


Inventory


19,084


9,164


Prepaid expenses and other current assets ($105 related to VIE)


34,956


21,225


Total Current Assets


419,987


160,465


Property, plant and equipment, net ($103,359 related to VIE)


596,112


350,583


Intangible assets, net ($217,117 related to VIE)


999,787


638,471


Goodwill


47,833


29,211


Equity method investments


260,111


262,738


Operating lease right-of-use assets


6,639


Other non-current assets


16,573


9,721


Total Assets

$

2,347,042


$

1,451,189


LIABILITIES AND EQUITY


Current Liabilities


Accounts payable - trade ($21,186 related to VIE)

$

31,777


$

11,096


Current portion of long-term debt, net


24,120


11,378


Current portion of operating lease liabilities


1,239


Accrued and other current liabilities ($632 related to VIE)


93,694


46,279


Total Current Liabilities


150,830


68,753


Long-term debt, net


887,824


331,396


Derivative liabilities


53,349


67,424


Below-market contracts


132,626


142,630


Asset retirement obligations


9,656


4,677


Long-term operating lease liabilities


5,657


Other long-term liabilities


2,553


5,316


Total Liabilities


1,242,495


620,196


Commitments and Contingencies


Redeemable Noncontrolling Interests


703,339


993,301


Equity


Stockholders’ Equity


Preferred stock, $0.0001 par value; 10,000,000 authorized; none issued and outstanding


Class A Common Stock, $0.0001 par value; 900,000,000 shares authorized; 81,592,637 shares issued and outstanding as of September 30, 2022 and 65,122,200 shares issued and outstanding as of December 31, 2021


8


7


Class B Common Stock, $0.0001 par value; 190,000,000 shares authorized; 39,052,668 shares issued and outstanding as of September 30, 2022 and 54,338,114 shares issued and outstanding as of December 31, 2021


4


5


Additional paid in capital


304,296


Accumulated deficit


(173,788

)


(162,320

)

Total Stockholders’ Equity


130,520


(162,308

)

Nonredeemable noncontrolling interests


270,688


Total Equity


401,208


(162,308

)

Total Liabilities, Redeemable Noncontrolling Interests and Equity

$

2,347,042


$

1,451,189


Parenthetical references reflect amounts as of September 30, 2022 for the Lightning Renewables, LLC VIE.


Contacts

ARCHAEA
Megan Light
This email address is being protected from spambots. You need JavaScript enabled to view it.
346-439-7589

Blake Schreiber
This email address is being protected from spambots. You need JavaScript enabled to view it.
346-440-1627

California clean energy company expands European footprint, boosts Italian energy independence

SAN JOSE, Calif., & IMOLA, Italy--(BUSINESS WIRE)--Bloom Energy (NYSE:BE) has partnered with Cefla, a leading Italian engineering, procurement and construction company, for multiple megawatts (MW) of Bloom’s solid oxide fuel cells, expected to be deployed through 2025. The partnership will expand Bloom’s footprint in Italy and aid in Italian companies’ transition from traditional combustion-based sources of energy to a fuel-cell based Energy Server that can efficiently meet critical energy needs.


The partnership between Bloom and Cefla builds on each company’s leadership in energy, enlarging the clean tech suite of offerings available for Italian companies. Cefla will deploy Bloom’s highly efficient Energy Servers, which can be configured to replace traditional combined heat and power (CHP) systems, to address the gas reduction requirement recently approved by European Union energy ministers. Bloom’s fuel-flexible technology, which can operate on natural gas, biogas or hydrogen, produces electricity without combustion and reduces carbon emissions compared to the grid with near zero harmful smog-forming particulate matter. Over the last 90 years, Cefla has honed its expertise in the design, construction and management of cogeneration plants and energy efficiency projects in both buildings and industrial applications.

“With the events of the past year, Europe’s business and political leaders know that they must focus on improving energy security,” said Tim Schweikert, Senior Managing Director of International Business Development, Bloom. “We believe that Cefla’s choice of Bloom’s technology positions Bloom as a solution for Europe’s new power savings mandate and an important next step in its eventual energy independence.”

“Our partnership with Bloom Energy is a source of great pride for us at Cefla and further strengthens our position as leaders of the Italian energy market,” said Gianmaria Balducci, president of Cefla. “It is an important source of inspiration to improve consistently and develop key innovations in the field of sustainability, continuing to invest in this sector with proposals in line with Green Deal policies and the energy transition. At a time when Europe is in dire need of overcoming its energy shortage, implementing the most efficient technologies is crucial, and fuel cells are unquestionably innovative, even more so as the absence of combustion helps reduce polluting emissions. Bloom Energy is our partner of choice to support us in the field of energy transition, a partner capable of promptly responding to new market requirements and environmental needs. We will work together towards future energy goals and climate challenges.”

This represents Bloom Energy’s second deal with a leading Italian company. Earlier this year, Bloom announced the installation of its Energy Servers as part of Ferrari’s decarbonization project.

In addition, Cefla has invited Bloom to exhibit in their booth at Ecomondo 2022, the leading green technology event for the Mediterranean basin, which will be held in Rimini, Italy from November 8 to 11, 2022. Added Schweikert, “With Ecomondo, Cefla is helping Bloom to introduce its technology to decision-makers in Europe and beyond.”

For more information about Bloom Energy’s decarbonization platform and the company’s commitment to a net-zero future, visit: https://www.bloomenergy.com/technology/powering-the-future/

Forward-Looking Statements

This press release contains certain forward-looking statements that are subject to the safe harbor provisions of the Private Securities Litigation Reform Act of 1995. Forward-looking statements generally relate to future events or our future financial or operating performance. In some cases, you can identify forward-looking statements because they contain words such as “anticipate,” “believe,” “could,” “estimate,” “expect,” “intend,” “may,” “should,” “will” and “would” or the negative of these words or similar terms or expressions that concern Bloom’s expectations, strategy, priorities, plans or intentions. These forward-looking statements include, but are not limited to, Bloom’s expectations regarding the collaboration with Cefla, including plans to install solid oxide fuel cells sites selected by Cefla, any expected benefits from the collaboration with Cefla, such as carbon emissions reductions, increased energy efficiency, or satisfying any clean energy or power savings requirements by the European Union or other regulatory agencies, and progress towards any net-zero emissions, decarbonization or energy independence goals. More information on potential risks and uncertainties that may impact Bloom’s business are set forth in Bloom’s periodic reports filed with the SEC, including its Annual Report on Form 10-K for the year ended December 31, 2021, filed with the SEC on February 25, 2022, and its Quarterly Reports on Form 10-Q for the quarters ended March 31, 2022 and June 30, 2022, filed with the SEC on May 6, 2022 and August 9, 2022, respectively, as well as subsequent reports filed with or furnished to the SEC from time to time. Bloom assumes no obligation to, and does not currently intend to, update any such forward-looking statements.

About Bloom Energy

Bloom Energy empowers businesses and communities to responsibly take charge of their energy. The company’s leading solid oxide platform for distributed generation of electricity and hydrogen is changing the future of energy. Fortune 100 companies around the world turn to Bloom Energy as a trusted partner to deliver lower carbon energy today and a net-zero future. For more information, visit www.bloomenergy.com.

About Cefla

Cefla is a leading Italian company in the design, construction and management of cogeneration plants and energy efficiency projects for civil and industrial applications. Founded in 1932, in Imola, Italy, it has designed and built technological systems for major Italian projects, including the Teatro alla Scala theater and several directional towers in Milan or the Uffizi Museum in Florence, in addition to supplying management for infrastructures, production lines and energy systems for top Italian industry players. Today, Cefla is a multi-business group consisting of 4 business units and large-scale production plants all over the world. Each business is a success story combining products, processes and innovations. They are all part of a shared quest for improvement in which partnerships and skills interact to generate excellence and ensure satisfaction for all customers and stakeholders. The core values of the Engineering Business Unit, with its long- standing experience and solid expertise in the construction and management of technological systems for the civil and industrial plant engineering sectors and highly efficient and sustainable energy production, are about improving the well-being and comfort of the places where people live, work and share leisure time. Technology to Enhance Your Wellbeing. For more information, visit https://www.cefla.com/en/business-unit/engineering/


Contacts

Bloom Energy Media Contact:
Virginia Citrano
This email address is being protected from spambots. You need JavaScript enabled to view it.

Bloom Energy Investor Relations:
Ed Vallejo
267.370.9717
This email address is being protected from spambots. You need JavaScript enabled to view it.

Cefla Media Contact:
Beatrice Brusa
This email address is being protected from spambots. You need JavaScript enabled to view it.

To jumpstart the holiday shopping season, Sendle is alleviating shipping sticker shock with this loonie deal, helping Canadian small businesses drive more sales during their busiest time of year

TORONTO--(BUSINESS WIRE)--#BCorp--Fifth paragraph, last sentence of release should read: Both existing and new Sendle customers everywhere in Canada can sign up at no cost. (instead of: Both existing and new Sendle customers everywhere in Canada (except Quebec) can sign up at no cost.) Also, the last sentence of the caption for the photo should read: Both existing and new Sendle customers everywhere in Canada can sign up at no cost. (instead of: Both existing and new Sendle customers everywhere in Canada (except Quebec) can sign up at no cost.)


The updated release reads:

OUTRAGEOUS SHIPPING COSTS PROMPT SENDLE TO BUCK THE TREND BY OFFERING $1 PARCEL DELIVERY FOR BLACK FRIDAY AND CYBER MONDAY

To jumpstart the holiday shopping season, Sendle is alleviating shipping sticker shock with this loonie deal, helping Canadian small businesses drive more sales during their busiest time of year

Sendle, Canada’s first 100% carbon-neutral, national shipping carrier and a Certified B Corporation, today launched a shipping promotion that enables small business customers to ship Black Friday and Cyber Monday parcels for $1. The offer aims to offset the high cost of shipping that leads nearly two-thirds of Canadians to abandon their online shopping carts at checkout. It also helps small businesses keep more of their hard-earned money. With record-setting inflation and ongoing pandemic recovery, small businesses simply can’t afford to continue paying unfair shipping rates—or pass those costs along to their customers.

“Black Friday marks the start of what is traditionally the busiest time of year for small businesses, and we want our customers to win big this season,” says Lauren Helstab, Sendle’s country manager for Canada. “With consumer expectations for free shipping at an all-time high, $1 shipping helps small businesses take on the retail giants and drive even more sales during this critical holiday shopping period. As a result, Sendle customers can retain more of their earnings and grow their business.”

Sendle debuted in Canada earlier this fall. Its mission is to level the playing field for small businesses to compete with bigger retailers by bringing more choice and competition to the Canadian shipping industry. With flat-fee shipping rates that are up to 88% lower than Canada Post, Sendle makes parcel delivery more affordable for Canadian small businesses and consumers alike. Sendle offers free pickups with no hidden fees, subscriptions, or minimums required, and provides customers with direct access to its world-class support team.

Moreover, Sendle taps existing shipping providers and fills their vehicles to make every trip as efficient as possible, reducing the environmental impact of shipping. The company, which has been 100% carbon neutral since its founding, then purchases carbon offsets for every single package it sends.

To qualify for the promotion, customers must book one shipment with Sendle on or before November 18. The offer is valid from 12:01 am ET on November 25, 2022 through 11:59 pm ET on November 30, 2022. Both existing and new Sendle customers everywhere in Canada can sign up at no cost.

About Sendle

Sendle is the first shipping carrier specifically designed to serve the needs of small eCommerce businesses. Sendle levels the playing field for small businesses by offering affordable, flat-rate shipping, with no hidden fees, subscriptions, or warehousing required. Merchants simply purchase a label and schedule a pickup from Sendle, and their package is picked up from their front door. Sendle is the first 100% carbon neutral shipping carrier in Australia, the US, and Canada, and a Certified B Corporation. The company was launched in Australia in 2014 and has headquarters in Sydney, Australia, Seattle, Washington, and Toronto, Canada.

Note to Media

Sendle images and b-roll are available for download through Google Drive.


Contacts

Media
Tonja Aldis
Boulevard Public Relations (for Sendle)
This email address is being protected from spambots. You need JavaScript enabled to view it.

Year-to-date revenue up 47% from the prior year

BURLINGTON, Ontario--(BUSINESS WIRE)--$ANRG #ANRG--Anaergia Inc. (“Anaergia” or the “Company“) (TSX: ANRG), a company that offers integrated waste-to-value solutions to reduce greenhouse gases by cost-effectively turning organic waste into renewable natural gas, fertilizer, and water, today announced its financial results for the three- and nine-month periods ended September 30, 2022. All financial results are reported in Canadian dollars unless otherwise stated.


Anaergia’s third quarter results show yet another healthy increase in revenues. Not yet reflected in our financial results is the performance of a number of our build-own-operate (“BOO”) renewable natural gas (“RNG”) facilities that are ramping up and those that will start operating by the end of this year.

During 2022, there have been multiple new regulatory initiatives introduced across North America and Europe that call for long-term RNG supply increases. While the pace of implementation of these initiatives is slower than anticipated, they are expected to drive growth opportunities for Anaergia.

Anaergia is continuing to see increasing market tailwinds since the Company’s initial public offering last year,” said Dr. Andrew Benedek, Chairman and CEO of Anaergia. “While moves towards net zero and saving the environment are gaining momentum worldwide, the added themes of energy security, and higher energy prices, each compound the favourable demand trends for our unique capabilities. The world is on a path to build an energy sector with net-zero emissions. This is an enormous global challenge that requires strong and credible policy actions from governments. While the pace of these actions will be somewhat unpredictable, Anaergia is uniquely positioned to act as policies materialize, with the ability to deploy commercially proven technologies quickly and at scale with a strong pipeline of new BOO projects.”

Q3 2022 Financial Results

Third Quarter financial highlights:

  • Revenues for the third quarter of 2022 (“Q3 2022”) rose 60% to $44.5 million from $27.7 million for the same period in the prior year and rose 47% to $122.2 million for the nine-month period ended September 30, 2022 (“YTD 2022”) from $83.2 million for the same period in the prior year. The increase was driven primarily by Capital Sales projects under execution in the Europe, Middle East and Africa (“EMEA”) market.
  • Gross profit percentage for Q3 2022 increased slightly to 23% from 21% for the same period in the prior year. The uptick in profitability in the quarter was primarily driven by higher revenues. For YTD 2022, the gross profit percentage declined to 21% from 23% for the same period in the prior year owing to project cost overruns earlier in the year.
  • Net income (loss) of ($0.7) million for Q3 2022 was driven by income tax expense and losses in equity-accounted investees. For YTD 2022, ($23.6) million of the ($36.8) million net loss was primarily from losses from changes in the fair value of derivatives (for example, in the value of the option to refinance debt of the Rialto Bioenergy Facility (“RBF”)).
  • Adjusted EBITDA of ($1.0) million for Q3 2022 was an improvement from the ($1.6 million) (adjusted) for the same period in the prior year. The change was mainly attributable to the increase in revenues in the quarter. For YTD 2022, Adjusted EBITDA of ($6.6) million was down from ($0.8) million for the same period in the prior year, mainly driven by lower gross margin and higher SG&A expenses as the Company continues to position itself for future growth.

Three months ended:

30-Sep-22


30-Sep-21
(Adjusted)


% Change

(In millions of Canadian dollars)


Revenue

44.5

27.7

60%

Gross profit

10.0

5.7

76%

Gross profit %

23%

21%


Income (loss) from operations

(2.5)

(6.7)


Net Income (loss)

(0.7)

(1.8)


Adjusted EBITDA1

(1.0)

(1.6)


Nine months ended:

30-Sep-22


30-Sep-21
(Adjusted)


% Change

(In millions of Canadian dollars)


Revenue

122.2

83.2

47%

Gross profit

25.4

19.4

31%

Gross profit %

21%

23%


Income (loss) from operations

(11.3)

(11.3)


Net Income (loss)

(36.8)

(6.0)


Adjusted EBITDA2

(6.6)

(0.8)


1 Adjusted EBITDA is a non-IFRS measure. See “Non-IFRS Financial Measures”.
2 Adjusted EBITDA is a non-IFRS measure. See “Non-IFRS Financial Measures”.


Statement of


Financial Position

30-Sep-22


31-Dec-21
(Adjusted)

(In millions of Canadian dollars)


Total Assets

914.1

693.4

Total Liabilities

557.5

370.0

Equity

356.6

323.4

For a more detailed discussion of Anaergia’s results for the three- and nine-month periods ended September 30, 2022, please see the Company’s financial statements and management’s discussion & analysis of financial condition and results of operations, which are available at https://www.anaergia.com/investor-relations and on the Company’s SEDAR page at www.sedar.com.

Fiscal 2022 and Fiscal 2023 Guidance Update

Relative to prior disclosure, Fiscal 2022 guidance for both Revenue and Adjusted EBITDA has been revised to reflect both the performance for the first nine months and tempered growth expectations for the remainder of the year. As YTD revenues are already approximately equal to Fiscal 2021 revenues, Management expects Fiscal 2022 to show healthy revenue growth of approximately 25% to 35% compared to Fiscal 2021, to between approximately $160 million and $170 million.

This is a reduction from previous Fiscal 2022 revenue guidance. The prior forecast assumed revenues would accelerate each quarter and be particularly high in Q4 2022, largely due to the contribution of BOO projects. Both the RBF and SoCal facilities were expected to be operating at close to full capacity with sales of RNG during the quarter, as were the majority of the BOOs in Italy. Revised outlook reflects a delay in the contribution of the RBF due to the delay in ramp up of feedstock supply to the facility as well as delayed completion of final registration under the federal RIN and LCFS programs which will allow the facility to commence planned sales of RNG. The commencement of such sales is not expected to occur until the end of the fourth quarter. In addition, the timing of capital sales and project execution in both North America and Europe have been behind previous estimates, largely due to client-driven delays that have slowed progression of certain projects.

Management expects Fiscal 2022 Adjusted EBITDA to be approximately ($10) million. The reduction from prior guidance is attributable to the lower expected revenue, and the erosion of gross margin due to cost inflation and higher SG&A as the business works to advance projects.

Management believes there are significant prospects for growth for the Company in Fiscal 2023 and in subsequent years. Nevertheless, with significant macro-economic changes, particularly in interest rates and natural gas pricing, as well as Company-specific matters, including but not limited to the construction and commissioning schedule for BOO projects, management has decided to withdraw the Company’s previously disclosed Fiscal 2023 guidance. Management intends to review key assumptions used to generate its guidance before providing any further updates.

For more information, including management’s assumptions relating to the foregoing guidance, please refer to the Company’s management’s discussion and analysis of financial condition and results of operations for the three- and nine-month periods ended September 30, 2022, which is available on SEDAR at www.sedar.com.

Non-IFRS Measures

This press release makes reference to certain non-IFRS measures. These measures are not recognized measures under IFRS and do not have a standardized meaning prescribed by IFRS and are therefore unlikely to be comparable to similar measures presented by other companies. Rather, these measures are provided as additional information to complement IFRS measures by providing further understanding of our results of operations from management’s perspective. Accordingly, these measures should not be considered in isolation or as a substitute for analysis of our financial information reported under IFRS. We use non-IFRS measures to provide investors with supplemental measures. Management also uses non-IFRS measures internally in order to facilitate operating performance comparisons from period to period, prepare annual operating budgets and assess our ability to meet our future debt service, capital expenditure and working capital requirements. Management believes these non-IFRS measures and industry metrics are important supplemental measures of operating performance because they eliminate items that have less bearing on operating performance and highlight trends in the core business that may not otherwise be apparent when relying solely on IFRS financial measures. Management believes such measures allow for assessment of our operating performance and financial condition on a basis that is more consistent and comparable between reporting periods. We also believe that securities analysts, investors and other interested parties frequently use non-IFRS measures in the evaluation of public companies.

Definitions of non-IFRS measures and industry metrics used in this press release are provided below. A reconciliation of the non-IFRS measures used in this press release to the most comparable IFRS measure can be found below under “Reconciliation of Non-IFRS Measures”.

Adjusted EBITDA” is defined as net earnings before finance costs, taxes and depreciation and amortization adjusted for our normalized proportionate interest in our BOO assets and one-time or non-recurring items, stock-based compensation expense, asset impairment charges and write downs, gains and losses for equity-accounted investees, foreign exchange gains or losses, restructuring costs, ERP customization and configuration costs, litigation and other claims settlements, gains and losses resulting from changes in certain balance sheet valuations (such as derivatives and warrants), acquisition costs and costs related to our initial public offering, including estimated incremental auditing and professional services costs incurred in connection with our initial public offering. For further details, refer to “Reconciliation of Non-IFRS Measures” below.

Conference Call and Webcast

A conference call to review the Company’s financial results will take place at 11:00 a.m. (ET) on Thursday, November [10], 2022. It will be hosted by Chairman and Chief Executive Officer, Andrew Benedek, Chief Operating Officer, Yaniv Scherson, Chief Financial Officer, Paula Myson, and Chief Development Officer Hani Kaissi. An accompanying slide presentation will be posted to the Investor Relations section of the Company’s website shortly before the call.

To participate on the call, please sign up to receive your personal event-joining details at the following pre-registration link:

To listen to the webcast live:

The webcast will be archived and available in the Investor Relations section of our website following the call.

About Anaergia

Anaergia was created to eliminate a major source of greenhouse gases by cost effectively turning organic waste into RNG, fertilizer and water, using proprietary technologies. With a proven track record from delivering world leading projects on four continents, Anaergia is uniquely positioned to provide end-to-end solutions for extracting organics from waste, implementing high efficiency anaerobic digestion, upgrading biogas, producing fertilizer and cleaning water. Our customers are in the municipal solid waste, municipal wastewater, agriculture, and food processing industries. In each of these markets Anaergia has built many successful plants including some of the largest in the world. Anaergia owns and operates some of the plants it builds, and it also operates plants that are owned by its customers.

For further information please see: www.anaergia.com

Forward-Looking Statements

This news release may contain forward-looking information within the meaning of applicable securities legislation, which reflects the Company’s current expectations regarding future events. Forward-looking information is based on a number of assumptions and is subject to a number of risks and uncertainties, many of which are beyond the Company’s control. Such risks and uncertainties include, but are not limited to, the factors discussed under “Risk Factors” in the Company’s annual information form dated March 28, 2022, for the fiscal year ended December 31, 2021. Actual results could differ materially from those projected herein. Anaergia does not undertake any obligation to update such forward-looking information, whether as a result of new information, future events or otherwise, except as expressly required under applicable securities laws.

Reconciliation of Non-IFRS Financial Measures

Three months ended:


30-Sep-22


30-Sep-21
(adjusted)

(In thousands of Canadian dollars)


Net income (loss)


(747)


(1,793)

Finance costs


170


(863)

Depreciation and amortization


884


855

Income tax expense


2,362


(2,394)

EBITDA


2,669


(4,195)


Share-based compensation expense


246


107

Change in fair value of equity investment


-


(2,346)

(Gain) loss on RBF embedded derivative


(807)


(306)

Remeasurement of previously held interest in Bioener


(3,364)


-

Provision for customer claim


1,158


780

Gain on debt restructuring


-


3,473

ERP customization and configuration costs


(456)


(341)

Project development write offs


329


922

Costs related to the Offering


-


1,247

Foreign exchange (gain) loss


(775)


(919)

Adjusted EBITDA


(1,000)


(1,578)


Nine months ended:


30-Sep-22


30-Sep-21
(adjusted)

(In thousands of Canadian dollars)


Net income (loss)


(36,790)


(5,961)

Finance costs


177


(1,224)

Depreciation and amortization


2,687


2,372

Income tax expense


5,912


(2,126)

EBITDA


(28,014)


(6,939)


Share-based compensation expense


827


405

Change in fair value of equity investment


-


(2,346)

(Gain) loss on RBF embedded derivative


19,000


(3,513)

Remeasurement of previously held interest in Bioener


(3,364)


-

Stock warrant valuation (gain) loss


-


(615)

Share of loss in equity accounted investees


-


914

Provision for customer claim


4,623


2,629

Gain on debt restructuring


-


3,473

ERP customization and configuration costs


(464)


244

Project development write offs


916


1,496

Costs related to the Offering


263


4,332

Foreign exchange (gain) loss


(487)


(816)

Adjusted EBITDA


(6,593)


(736)


Contacts

For media relations please contact: Melissa Bailey, Director, Marketing & Corporate Communications, This email address is being protected from spambots. You need JavaScript enabled to view it.
For investor relations please contact: This email address is being protected from spambots. You need JavaScript enabled to view it.

TULSA, Okla.--(BUSINESS WIRE)--Empire Petroleum (NYSE American: EP) (“Empire” or the “Company”), today announced that it will release its financial and operational results for the third quarter of 2022 after the market closes on Monday, November 14, 2022. An investor conference call to review its results will be held on Tuesday, November 15, 2022, at 12:00 p.m. Eastern (11:00 a.m. Central). The call will be hosted by Tommy Pritchard, the Company’s Chief Executive Officer, and Mike Morrisett, Empire’s President. Details for the conference call are as follows:


Date: Tuesday, November 15, 2022

Time: 12:00 p.m. Eastern (11:00 a.m. Central)

Telephone: 1-877-270-2148 (Toll free); 1-412-902-6510 (International); participants should ask to be joined into the Empire Petroleum Corporation call.

Webcast: https://event.choruscall.com/mediaframe/webcast.html?webcastid=foO19cFK

Replay: A webcast replay will be available on Empire’s website (www.empirepetroleumcorp.com) under "Investors Relations" on the "Events & Presentations" page following the call or via the webcast link listed above. The replay will be available through November 15, 2023.

About Empire Petroleum

Empire Petroleum Corporation is a publicly traded, Tulsa-based oil and gas company with current producing assets in Texas, Louisiana, North Dakota, Montana, and New Mexico. Management is focused on organic growth and targeted acquisitions of proved developed assets with synergies with its existing portfolio of wells. More information about Empire can be found at www.empirepetroleumcorp.com.

Safe Harbor Statement

This release contains forward-looking statements within the meaning of Section 27A of the Securities Act of 1933 and Section 21E of the Securities Exchange Act of 1934. Forward-looking statements involve a wide variety of risks and uncertainties, and include, without limitations, statements with respect to the Company’s estimates, strategy and prospects. Such statements are subject to certain risks and uncertainties which are disclosed in the Company’s reports filed with the SEC, including its Form 10-K for the fiscal year ended December 31, 2021, and its other filings with the SEC. Readers and investors are cautioned that the Company’s actual results may differ materially from those described in the forward-looking statements due to a number of factors, including, but not limited to, the Company’s ability to acquire productive oil and/or gas properties or to successfully drill and complete oil and/or gas wells on such properties, general economic conditions both domestically and abroad, and other risks and uncertainties related to the conduct of business by the Company.


Contacts

Empire Petroleum Corporation:
Tommy Pritchard, CEO
Mike Morrisett, President
539-444-8002
This email address is being protected from spambots. You need JavaScript enabled to view it.

Investor Relations:
Al Petrie Advisors
Wes Harris, Partner
713-300-6321
This email address is being protected from spambots. You need JavaScript enabled to view it.

DUBLIN--(BUSINESS WIRE)--The "Global Tar Sands Market By Technology (Cyclic Steam Stimulation, Steam Assisted Gravity Drainage), and By Region, Competition Forecast and Opportunities, 2027" report has been added to ResearchAndMarkets.com's offering.


The global tar sands market is anticipated to witness a steady CAGR in the forecast period, 2023-2027.

Growing energy requirements, especially from developing countries such as India, China, South Africa, and Brazil, due to rapid industrialization and the advent of novel technologies that can refine the heaviest and dirtiest of crude oil are the primary factors driving the demand for global tar sands market.

The rise in the number of aged wells and decreasing production from the existing oilfields are making the market players look for alternate sources to produce energy. Favorable government policies and regulations and the growing number of market players are further expected to bolster the global tar sands market growth in the coming years.

Rise in Production and Exploration of Unconventional Reserves Drives the Market Growth

Oil & gas are the major energy sources and are extensively used for power generation, transportation, and other end-use industries. Growing energy requirements, urbanization, globalization, and industrialization in the developing countries boost the investments in the production and exploration of oil and gas reserves.

Offshore hydrocarbons are some of the potential reserves that can fulfill the global energy requirements. With the decline in oil reserves, major oil and gas companies have shifted their efforts and focused on inventing new tools and techniques to extract tar sands from the reserves.

They are using modern techniques to extract tar sands as they are difficult to extract and require significant amounts of energy in extraction and processing. The fluctuating oil prices do not affect the global tar sands market. It is continuing to increase in the forecast period due to the active and upcoming projects that were sanctioned a long time ago.

The advent of new techniques and technologies in oil extraction and processing and the shift of market players towards unconventional reserves are expected to boost the global tar sands market growth in the forecast period.

Growing Energy Demand Favors the Market

According to the US Energy Information Administration, the global energy demand and the energy-related carbon emissions will continue to rise through 2050, with oil being the largest energy source. The global energy demand is expected to increase by 47% in the next 30 years, driven by economic and population growth, particularly in the developing countries of the Asia-pacific region.

The governments in developing countries are introducing laws and regulations to support the growth of the prominent industry verticals such as healthcare, automotive, oil and gas, power and manufacturing, and construction industry. The existing oil and gas reserves are depleting at a rapid rate which is making the market players extract from unconventional energy sources.

Tar sand extraction is such a complex process that requires huge amounts of finance and energy to produce oil. They are not present everywhere and are available only in some the countries like Canada. The rise in awareness about the oil extraction process from tar sands and the emergence of new market players are expected to propel the global tar sands market growth over the next five years.

Competitive Landscape

Company Profiles: Detailed analysis of the major companies present in global tar sands market.

  • Suncor Energy, Inc.
  • Royal Dutch Shell plc
  • Exxon Mobil Corporation
  • Petroleos de Venezuela, S.A. (PDVSA)
  • Eni S.p.A.
  • Canadian Oil Sands Limited
  • Alberta Oil Sands Inc.

Report Scope

Tar Sands Market, by Extraction Method:

  • Mining
  • In-Situ

Tar Sands Market, by Technology:

  • Cyclic Steam Stimulation
  • Steam Assisted Gravity Drainage

Tar Sands Market, by Region:

  • North America
  • South America
  • Middle East & Africa
  • Rest of World

For more information about this report visit https://www.researchandmarkets.com/r/38o9yv


Contacts

ResearchAndMarkets.com
Laura Wood, Senior Press Manager
This email address is being protected from spambots. You need JavaScript enabled to view it.
For E.S.T Office Hours Call 1-917-300-0470
For U.S./ CAN Toll Free Call 1-800-526-8630
For GMT Office Hours Call +353-1-416-8900

DULUTH, Minn.--(BUSINESS WIRE)--The Minnesota Public Utilities Commission today unanimously approved Minnesota Power’s 15-year Integrated Resource Plan (IRP), the regulatory roadmap for the company’s EnergyForward vision to provide 100% carbon-free energy by 2050 while maintaining safe, reliable and affordable electric serve to its customers.


Building on an extensive process that involved discussion with customers and stakeholders over the past two years, Minnesota Power, a utility division of ALLETE Inc. (NYSE:ALE), reached a joint agreement earlier this week with stakeholders that included clean energy organizations, labor groups, and the city of Cohasset and Itasca County, which are host communities to the company’s last remaining coal-fired power plant. The Commission approved all of the elements of the joint agreement.

“In early 2021, Minnesota Power set forth its vision for a carbon-free energy supply by 2050, and today’s decision by the Commission affirmed Minnesota Power’s state-leading efforts to shape a clean-energy future that benefits our customers, our communities, and the climate, while ensuring time to transition our employees,” said ALLETE Chair, President and CEO Bethany Owen. “Bringing all of these important stakeholders together has been a hallmark of Minnesota Power’s extensive process and is critical to a truly just transition that leaves no one behind. We’re grateful for the Commission’s approval and excited to get to work on this next phase of our collaborative and innovative energy transformation.”

Minnesota Power’s IRP lays out ambitious goals of reducing carbon emissions by 80% by 2035, and achieving more than 70% renewable energy in 2030. It calls for adding up to 400 megawatts of wind energy and 300 megawatts of regional solar energy. That’s nearly twice what the company proposed in its initial Integrated Resource Plan filing in Feb. 2021, which called for the addition of 200 megawatts of wind and 200 megawatts of solar. The IRP also includes a significant investment in energy storage to support the expansion of renewables on Minnesota Power’s system.

The IRP also charts a course to cease coal operations at the company’s Boswell Energy Center Unit 3 by 2030 and Boswell Unit 4 by 2035.

“Today’s outcome confirms MP’s thoughtful pace and path for transforming our fleet and reducing carbon, while keeping affordability, as well as reliability and resiliency of our system at the fore and maintaining a just transition for our employees and host communities,” said Minnesota Power Chief Operating Josh Skelton. “Our planning for a sustainable transformation has incorporated feedback from many diverse voices, while recognizing the rapid changes of an energy industry in transformation. We will leverage the opportunities now available with the recent passage of the Inflation Reduction Act and the Infrastructure Investment and Jobs Act that support lowering the cost of renewables and maintaining competitive rates for our customers.”

Additional consideration of other resource investments, including a previously approved natural gas power plant, and the Midcontinent Independent System Operator’s long-range transmission plan to strengthen the electric grid, will occur in future regulatory filings. Also approved today, the company will file its next IRP by March 1, 2025.

Minnesota Power submitted its 1,427-page IRP to the MPUC on Feb. 1, 2021 after a first of its kind stakeholder outreach process. An IRP is required of all investor-owned utilities, generation-and-transmission cooperatives and municipal power agencies. An IRP outlines how the company will meet the expected energy needs of its customers over the next 15 years with a safe, reliable and cost-effective supply of energy, and is an important tool for regulators who implement Minnesota’s energy policy.

Minnesota Power provides electric service within a 26,000-square-mile area in northeastern Minnesota, supporting comfort, security and quality of life for 145,000 customers, 14 municipalities and some of the largest industrial customers in the United States. More information can be found at www.mnpower.com. ALE-CORP

The statements contained in this release and statements that ALLETE may make orally in connection with this release that are not historical facts, are forward-looking statements. Actual results may differ materially from those projected in the forward-looking statements. These forward-looking statements involve risks and uncertainties and investors are directed to the risks discussed in documents filed by ALLETE with the Securities and Exchange Commission.


Contacts

Amy Rutledge
Director - Corporate Communications
Minnesota Power/ALLETE
218-723-7400
This email address is being protected from spambots. You need JavaScript enabled to view it.

New collaboration will study how electric vehicles, chargers and batteries can enhance energy reliability and build grid resiliency

SAN DIEGO--(BUSINESS WIRE)--San Diego Gas & Electric (SDG&E) and General Motors (GM) today announced an agreement to investigate the feasibility of integrating bidirectional Electric Vehicles (EVs) into the electric grid as a local energy resource. Following GM’s announcement of its newest business unit, GM Energy, the study will examine the hardware, software, processes and construction considerations necessary to accelerate wider adoption of Vehicle-to-Grid Integration (VGI) capabilities, which include:


  • Documenting best practices for Vehicle-to-Home or Building projects so that the benefits may be clearly communicated to customers.
  • Developing systems that help enable utilities and vehicle manufacturers to leverage cloud-based energy management platforms and distributed energy resources, such as EVs, to create a Virtual Power Plant. A Virtual Power Plant is a collection of energy resources that can be interconnected and operated together via cloud-based software.
  • Exploring the integration of EVs in microgrid environments to increase grid resiliency for communities. A microgrid is a smaller power grid that uses technology like energy storage or EV batteries to provide power to specific communities or facilities in the event of an outage.

“Vehicle-to-Grid technology can help transform our energy system and provide tangible, positive benefits to our customers in Southern California,” said SDG&E CEO Caroline Winn. “EVs can help us improve community and grid resiliency in the face of climate change as we work with the state and partners to meet our shared climate goals.”

Under the new agreement, GM and SDG&E will study three VGI capabilities: Vehicle-to-Home (V2H), Vehicle-to-Grid (V2G), and a Virtual Power Plant, which can leverage distributed energy resources such as EVs, batteries and chargers to help the grid meet demand.

“Through GM Energy, working with companies like SDG&E will play an important role in accelerating new technology and energy management solutions to market for customers,” said GM Vice President of EV Growth Operations Travis Hester. “As GM continues on its journey towards an all-electric future, expanding the capabilities of EVs represents a significant opportunity to help strengthen grid resiliency and mitigate the impact of disruptions.”

SDG&E and GM are signatories to the U.S. Department of Energy’s Vehicle-to-Everything (V2X) memorandum of understanding (MOU). The agreement is designed to bring together resources from DOE National Labs, state and local governments, utilities and private entities to unlock the potential of bidirectional charging to increase energy security, community resilience, and economic growth while supporting the nation’s electric system.

“Bidirectional charging holds tremendous potential for increasing the country’s energy security and grid reliability in addition to supporting economic opportunities for communities throughout the nation,” said U.S. Department of Energy Office of Technology Transitions Commercialization Executive Rima Oueid. “We are excited to see yet another V2X initiative undertaken by our MOU partners to accelerate adoption of this innovative technology.”

On average, cars are parked 95% of their useful life, according to research from University of California Los Angeles professor Donald Shoup. Per data from Veloz, California is home to 1.2 million EVs, the largest concentration in the nation. Starting in 2035, all new cars and passenger trucks sold in California are required to be zero-emissions.

SDG&E is an innovative San Diego-based energy company that provides clean, safe and reliable energy to better the lives of the people it serves in San Diego and southern Orange counties. The company is committed to creating a sustainable future by providing its electricity from renewable sources; modernizing energy infrastructure; accelerating the adoption of electric vehicles; supporting numerous non-profit partners; and, investing in innovative technologies to ensure the reliable operation of the region’s infrastructure for generations to come. SDG&E is a subsidiary of Sempra (NYSE: SRE). For more information, visit SDGEnews.com or connect with SDG&E on Twitter (@SDGE), Instagram (@SDGE) and Facebook.

General Motors (NYSE:GM) is a global company focused on advancing an all-electric future that is inclusive and accessible to all. At the heart of this strategy is the Ultium battery platform, which powers everything from mass-market to high-performance vehicles. General Motors, its subsidiaries and its joint venture entities sell vehicles under the Chevrolet, Buick, GMC, Cadillac, Baojun and Wuling brands. More information on the company and its subsidiaries, including OnStar, a global leader in vehicle safety and security services, can be found at https://www.gm.com.


Contacts

Krista Van Tassel
San Diego Gas & Electric
877-866-2066
This email address is being protected from spambots. You need JavaScript enabled to view it.
Twitter: @sdge

OMAHA, Neb.--(BUSINESS WIRE)--Valmont Industries, Inc. (NYSE: VMI), a global leader that provides vital infrastructure and advances agricultural productivity while driving innovation through technology, is pleased to announce that the Federal Aviation Administration (FAA) granted the company a nationwide Beyond Visual Line of Sight (BVLOS) waiver.


The BVLOS waiver gives Valmont the ability to fly their multi-hour capable unmanned drones for commercial inspections of utility lines across the nation at a moment’s notice, eliminating the need to wait for geographic approval from the FAA. In addition to the removal of the geographic restriction, the entire diverse fleet of Valmont’s unmanned aerial systems were included.

This nationwide waiver goes hand in hand with the primary goal of Valmont providing our customers more efficient and timely service through technology,” says Angi Chamberlain, vice president UAS Technology Services for Valmont. “Using drone technology allows us to reduce costs and provide an improved alternative to manned aviation.”

Using drone technology allows Valmont to collect high-resolution images and infrastructure performance data safely and quickly. It also opens the door to future waivers as the company moves toward a completely autonomous solution.

To our knowledge, we are one of the first five entities to receive this waiver arrangement,” explains Aaron Schapper, Valmont group president Infrastructure. “We see this as a clear endorsement from the FAA, acknowledging that Valmont has the right people, training, technology and a proven history for continuous advancement of operational innovation.”

About Valmont Industries, Inc.

For over 75 years, Valmont® has been a global leader in creating vital infrastructure and advancing agricultural productivity. Today, we remain committed to doing more with less by innovating through technology. Learn more about how we’re Conserving Resources. Improving Life.® at valmont.com.


Contacts

Angi Chamberlain, Valmont Industries, Inc.
This email address is being protected from spambots. You need JavaScript enabled to view it.

BRYN MAWR, Pa.--(BUSINESS WIRE)--Essential Utilities Inc. (NYSE: WTRG) today announced it has once again been named a Champion of Board Diversity by The Forum of Executive Women, recognized for paving the way for gender equity. This is the fourth time that Essential or its water subsidiary, Aqua, has received the award.


The Forum annually honors the top public companies in the Philadelphia region with at least 30% of their respective boards comprised of women. Essential was one of 35 companies from the Greater Philadelphia area celebrated at The Forum’s Leadership Breakfast on October 26.

We’re thrilled to once again be recognized as a Champion of Board Diversity, reflecting our ongoing commitment to embracing diversity and inclusion at all levels of our organization,” said Christopher Franklin, chairman and CEO of Essential Utilities. “Our focus on gender equality is intentional, as we know diverse perspectives make us stronger and allow us to better serve our customers. We’re proud to add this honor to our overarching ESG accomplishments.”

Previously, Aqua was recognized as a Champion of Board Diversity by the Forum of Executive Women in 2016, 2019 and 2021. Aqua was also recognized as a Winning ‘W’ Company by 2020 Women on Boards for having 20 percent or more of its board seats held by women, and Essential was recognized as a “3+” company by 50/50 Women on Boards this year, indicating at least three board seats held by women.

Founded in 1977, The Forum of Executive Women is a membership organization of nearly 600 senior female leaders in corporations, firms, not-for-profit organizations and the public sector working to expand the impact and power of women in the workplace throughout the region.

About Essential

Essential is one of the largest publicly traded water, wastewater and natural gas providers in the U.S., serving approximately 5.5 million people across 10 states under the Aqua and Peoples brands. Essential is committed to excellence in proactive infrastructure investment, regulatory expertise, operational efficiency and environmental stewardship. The company recognizes the importance water and natural gas play in everyday life and is proud to deliver safe, reliable services that contribute to the quality of life in the communities it serves. For more information, visit http://www.essential.co.

WTRGG


Contacts

Sarah Courtright
Communications Manager
Media Hotline: 1.877.325.3477
This email address is being protected from spambots. You need JavaScript enabled to view it.

Network Carbon Intensity energy (NCIe) metric introduced to evaluate network energy efficiency

SHARM EL-SHEIKH, Egypt--(BUSINESS WIRE)--A Huawei executive said Thursday information and communications technologies, or ICT, will enable the digitalization of industry, spark innovation and make other industries green.


The remarks were made at a session organized by the Global Innovation Hub (UGIH) of the United Nations Framework Convention on Climate Change (UNFCCC) at the ongoing 27th Conference of the Parties, or COP27, in Sharm El-Sheikh of Egypt.

Referring to what is known as the “enabling effect”, Philippe Wang, Huawei’s Executive Vice President for the Northern Africa region, said ICT is “making other industries greener”.

5G, Artificial Intelligence, data analytics, cloud computing – all these things will improve industrial processes in a way that cuts energy use, and lowers carbon emissions,” he said.

According to Philippe Wang, in the same way that ICT enables a smart streetlight to turn itself off when no one is around, 5G wireless base stations can automatically shut down when there is no data traffic, which saves energy.

Base stations need a power source and have antennas. For its part, Huawei has been replacing diesel generators with solar panels, which offer a cleaner source of electric power, in Nigeria and Angola. At the same time, the company has launched a green 5G antenna that covers an area of up to 500 meters area using half the transmission power. That cuts energy consumption by 30 percent.

Also speaking at the session on Thursday, Luis Neves, CEO, Global Enabling Sustainability Initiative (GeSI), stressed that digital should be at the core of the climate conversation.

If you bring a sustainability mindset together with digital, I think we can create a powerful machine to drive the sustainability agenda and accelerate the path for a world where 10 billion people can live a healthy life. And businesses should take both their carbon footprint and handprint into consideration,” he said.

To this end, members of the ITU-T, including Huawei, have proposed a standard for measuring network energy use. Known as the Network Carbon Intensity energy metric, the standard was approved by ITU-T on October 19 as the Recommendation ITU-T L.1333.

According to Nompilo Morafo, MTN Group Chief Sustainability & Corporate Affairs Officer, “sustainable, measurable action” holds the key to meeting net zero goals. “In this journey, the use of digital technologies offers particular potential to increase the generation of green energy and power efficiency of all industries,” she added.

The UNFCCC UGIH session, titled ICT for Green, addressed the ways in which transformative ICT technology could be utilized to enable the green development of a wide range of industries, facilitating the world’s path to net-zero emissions.

About Huawei

Founded in 1987, Huawei is a leading global provider of information and communications technology (ICT) infrastructure and smart devices. We have 195,000 employees and we operate in more than 170 countries and regions, serving more than three billion people around the world.

Our vision and mission is to bring digital to every person, home and organization for a fully connected, intelligent world. To this end, we will work towards ubiquitous connectivity and inclusive network access, laying the foundation for an intelligent world; provide diversified computing power where you need it, when you need it, to bring cloud and intelligence to all four corners of the earth; build digital platforms to help all industries and organizations become more agile, efficient, and dynamic; and redefine user experience with AI, making it smarter and more personalized for people in all aspects of their life, whether they're at home, on the go, in the office, having fun, or working out. For more information, please visit Huawei online at www.huawei.com or follow us on:

http://www.linkedin.com/company/Huawei
http://www.twitter.com/Huawei
http://www.facebook.com/Huawei
http://www.youtube.com/Huawei


Contacts

Huawei, Francis Yang, +86 13871384929, This email address is being protected from spambots. You need JavaScript enabled to view it.

Algoma and Furetank expand FureBear joint venture to construct four additional climate-friendly dual-fuel product tankers to trade in Northern Europe


ST. CATHARINES, Canada--(BUSINESS WIRE)--#yourmarinecarrierofchoice--Algoma Central Corporation (TSX: ALC) today announced that it has doubled its investment in the FureBear joint venture, and will construct four additional dual-fuel ice class 1A 17,999 DWT climate-friendly product tankers with their partner Furetank AB (“Furetank”) of Sweden, bringing the total investment to eight vessels. Algoma owns 50% of the joint venture.

“In our strategic plan, we set out to find sustainable areas to grow our business and deploy capital in the highest and best uses,” said Gregg Ruhl, President and CEO of Algoma. “This investment enables us to further diversify Algoma’s asset base and geographic trading zones in a segment we know well and with partners that share our values,” concluded Mr. Ruhl.

“The expansion of our FureBear investment with Algoma is exciting news,” said Lars Höglund, CEO of Furetank. “This is yet another endorsement of the environmental benefits and innovative design of our Vinga Series. I look forward to delivering on these benefits with our partner and working together to fulfill the need for modern and efficient tonnage in the markets we serve,” concluded Mr. Höglund.

Like the initial four vessel order, the additional ships will be constructed at China Merchants Jinling Shipyard in Yangzhou, China, with delivery expected between 2023 and 2025. Two of the four vessels had previously been ordered by Furetank in September and will be transferred to FureBear, and the other two vessels have been placed as new orders bringing the total vessels in the Vinga series to 17. Upon completion, all eight FureBear vessels will be entered into the Gothia Tanker Alliance, and will be operated by Furetank out of Gothenburg, Sweden.

The Vinga ships are designed with FKAB Marine Design and all have dual-fuel capability and run on LNG/LBG or gasoil and are also fully equipped for shore power. They are designed with a battery hybrid solution and several innovative features that reduce fuel and energy consumption, resulting in extensively lower emissions of CO2, sulphur oxide, nitrogen oxide and hazardous particles. The ships have scored the best Energy Efficiency Design Index or EEDI value in their segment globally, meaning that they are the most energy efficient vessels according to the International Maritime Organization (IMO).

About Algoma Central Corporation
Algoma owns and operates the largest fleet of dry and liquid bulk carriers operating on the Great Lakes - St. Lawrence Seaway, including self-unloading dry-bulk carriers, gearless dry-bulk carriers and product tankers. Since 2010 we have introduced 10 new build vessels to our domestic dry-bulk fleet, with two under construction and expected to arrive in 2024, making us the youngest, most efficient and environmentally sustainable fleet on the Great Lakes. Each new vessel reduces carbon emissions on average by 40% versus the ship replaced. Algoma also owns ocean self-unloading dry-bulk vessels operating in international markets and a 50% interest in NovaAlgoma, which owns and operates the world's largest fleet of pneumatic cement carriers and a global fleet of mini-bulk vessels serving regional markets. Algoma truly is Your Marine Carrier of Choice™. For more information about Algoma, visit the Company's website at www.algonet.com.

About Furetank
Furetank, based on Donsö in the Gothenburg archipelago, is a Swedish, family-owned shipping company active in tanker shipping since the early 1950’s. Furetank operates nine owned vessels and is a founding member of the Gothia Tanker Alliance; a market platform for small and intermediate product tankers, operating 40 vessels in European waters. Furetank’s motto is not a giant but a leader – continuously striving to adopt green solutions for the environment and climate. For more information, visit Furetank’s website at www.furetank.se.


Contacts

Gregg A. Ruhl
Algoma Central Corporation
President & CEO
905-687-7890

J. Wesley Newton
Algoma Central Corporation
E.V.P. Strategy & Business Development
905-687-7836

Lars Höglund
Furetank AB
CEO
46 (0) 705 74 96 41

BALI, Indonesia--(BUSINESS WIRE)--Pertamina Power Indonesia (Pertamina NRE), Keppel Infrastructure, through Keppel New Energy Pte. Ltd., and Chevron Corporation (NYSE: CVX), through Chevron New Energies International Pte. Ltd. (Chevron New Energies), have signed a Joint Study Agreement (JSA) to explore the development of selected green hydrogen and green ammonia projects using renewable energy located primarily in Sumatera, Indonesia.


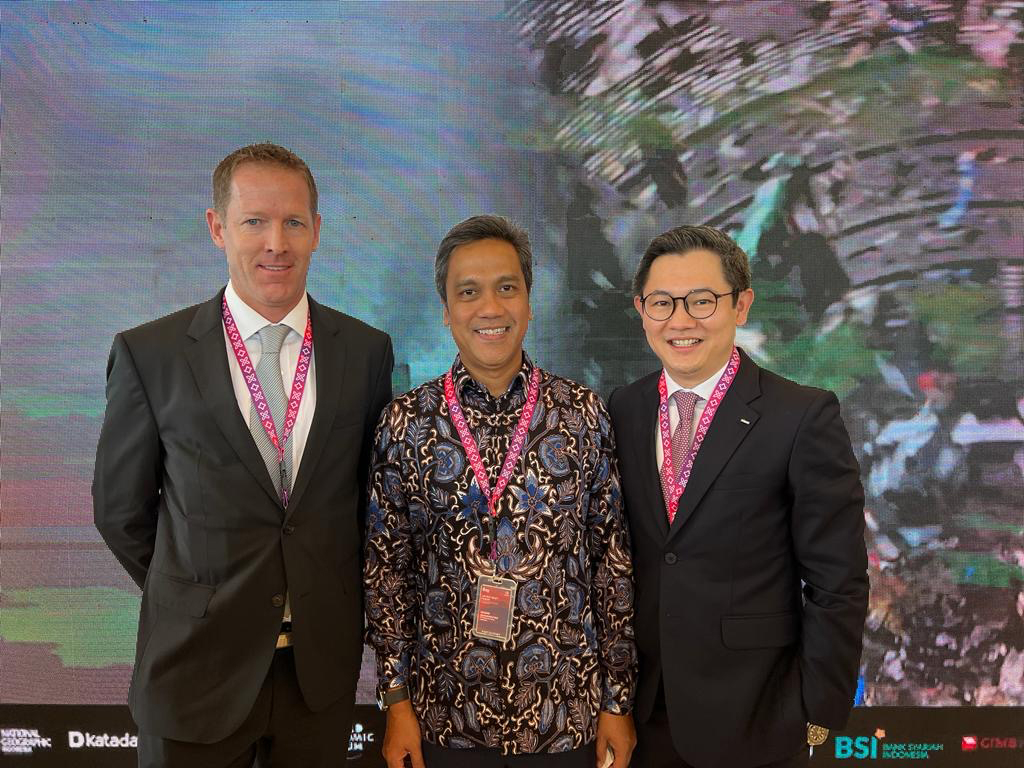
The signing of the JSA took place at the Business 20 (B20) Investment Forum held in conjunction with the B20 Summit in Bali. B20 is an official G20 engagement group that represents the global business community. Signing the JSA were CEO of Pertamina NRE, Dannif Danusaputro; Director of Keppel New Energy Pte., Ltd., Chua Yong Hwee, and Director of Chevron New Energies International, Pte. Ltd., Andrew S. Mingst. The signing was witnessed by the Coordinating Minister for Maritime Affairs and Investment, Luhut Pandjaitan; Minister of Investment of Indonesia & Head of BKPM, Bahlil Lahadalia; President Director & CEO, PT Pertamina (Persero), Nicke Widyawati; and Chief Executive Officer, Keppel Infrastructure, Cindy Lim.

The JSA intends to explore the feasibility of developing a green hydrogen facility, with a production capacity of at least 40,000 tonnes per annum, powered by 250-400 megawatts of geothermal energy in the initial phase. The hydrogen production facility could have the potential to scale up to 80,000-160,000 tonnes per annum, depending on the availability of geothermal energy as well as market demands.

The JSA aims to draw on the complementary strengths of Pertamina, the largest energy company in Indonesia; Keppel Infrastructure, a leading Singapore-based energy infrastructure solutions provider with a strong track record of developing and operating large scale energy and environmental infrastructure projects; and Chevron, a multinational energy corporation committed to providing affordable, reliable, ever-cleaner energy.

According to an International Energy Agency report, Indonesia, the world’s fourth most populous country, has a viable path to reaching its target of net zero emissions by 2060.1 Hydrogen and ammonia are expected to be important lower carbon fuels as part of this roadmap. Ammonia can also be used to transport hydrogen and potentially be used to replace bunker fuels as a lower carbon solution in the global maritime industry.

Indonesia accounts for approximately 40 percent of global geothermal resources, providing opportunities to utilize geothermal energy as a reliable and stable energy source to produce green ammonia or hydrogen.

Dannif Danusaputro, CEO of Pertamina NRE, said, “The development of green hydrogen and green ammonia holds a significant role in Indonesia’s Net Zero Emissions roadmap. And with its potential, we believe that Indonesia will also play a key role in green hydrogen production in Asia. We are very excited with this strategic collaboration as we know that Keppel and Chevron are reputable companies and have the same vision in energy transition as we do.”

Ms. Cindy Lim, CEO of Keppel Infrastructure, said, “Indonesia is a country with vast resources and enormous potential for renewable and low carbon energy. We are happy to partner with industry leaders, Pertamina and Chevron, to explore the first of its kind use of geothermal and other renewable energy to develop green hydrogen and green ammonia projects and support Indonesia’s energy transition efforts, as well as catalyze investments in green energy supply chain in the regions. In line with Keppel’s Vision 2030, which places sustainability at the core of its strategy, this collaboration will broaden Keppel Infrastructure’s geographical footprints to create and capture more value arising from the global commitment to net zero and its energy transition.”

Austin Knight, vice president of Hydrogen, Chevron New Energies, said, “We have a long history of working in Indonesia and with Pertamina, and a growing relationship with Keppel Infrastructure. We look forward to leveraging our collective strengths to study and evaluate lower carbon opportunities for the region. Chevron’s strength has always been solving big, complex energy challenges, and creating a lower carbon future is the opportunity that motivates us. As part of this effort, we must work together to identify new, innovative ways of producing and delivering ever-cleaner energy to a growing world.”

Keppel Corporation Limited, the parent company of Keppel Infrastructure, does not expect the abovementioned development to have any material impact on Keppel Corporation’s earnings per share and net tangible asset per share for the current financial year.

_________________________

1 https://www.iea.org/news/indonesia-s-push-to-reach-net-zero-emissions-can-help-power-a-new-phase-in-its-economic-development

About Pertamina NRE

PT Pertamina Power Indonesia (Pertamina NRE) is member of PT Pertamina (Persero), Indonesia’s largest energy company, comprised of four business entities: PT Pertamina Geothermal Energy (subsidiary), PT Jawa Satu Power (affiliate), PT Jawa Satu Regas (affiliate), and PT Industri Baterai Indonesia. Its business focuses on clean energy development. It is highly committed to support Indonesia’s net zero emission 2060 through energy transition and to implement ESG.

About Keppel Infrastructure

Keppel Infrastructure (KI) is a wholly-owned subsidiary of Keppel Corporation, a Singapore flagship multinational company providing solutions for sustainable urbanisation. KI provides solutions for some of the world’s most pressing challenges through its power & gas, environment and new energy businesses by leveraging its proprietary technology, strong technical expertise and proven operating capabilities.

KI has a track record of developing energy and environmental infrastructure end-to-end, including power generation assets, waste-to-energy (WTE) facilities, large-scale district cooling systems, as well as NEWater and desalination plants. In Singapore, it operates a 1,300-megawatt high efficiency gas-fired combined cycle power plant and a utility pipe rack and pipeline network in Jurong Island. It is also Singapore’s leading electricity retailer, and the first and largest district cooling systems developer and service provider. Globally, through Keppel Seghers, it is one of the leading WTE technology providers with more than 100 project references in 20 countries.

KI is expanding its presence, in Singapore and overseas, in areas such as power generation, waste management, district cooling, renewables and energy storage, electric vehicle charging infrastructure and other clean energy opportunities.

For more information, please visit www.kepinfra.com.

About Chevron

Chevron is one of the world’s leading integrated energy companies. We believe affordable, reliable, and ever-cleaner energy is essential to achieving a more prosperous and sustainable world. Chevron produces crude oil and natural gas; manufactures transportation fuels, lubricants, petrochemicals and additives; and develops technologies that enhance our business and the industry. We are focused on lowering the carbon intensity in our operations and growing lower carbon businesses along with our traditional business lines. For more information, please visit www.chevron.com.

CAUTIONARY STATEMENTS RELEVANT TO FORWARD-LOOKING INFORMATION FOR THE PURPOSE OF “SAFE HARBOR” PROVISIONS OF THE PRIVATE SECURITIES LITIGATION REFORM ACT OF 1995

This news release contains forward-looking statements relating to Chevron’s operations and energy transition plans that are based on management's current expectations, estimates and projections about the petroleum, chemicals and other energy-related industries. Words or phrases such as “anticipates,” “expects,” “intends,” “plans,” “targets,” “advances,” “commits,” “drives,” “aims,” “forecasts,” “projects,” “believes,” “approaches,” “seeks,” “schedules,” “estimates,” “positions,” “pursues,” “may,” “can,” “could,” “should,” “will,” “budgets,” “outlook,” “trends,” “guidance,” “focus,” “on track,” “goals,” “objectives,” “strategies,” “opportunities,” “poised,” “potential,” “ambitions,” “aspires” and similar expressions are intended to identify such forward-looking statements. These statements are not guarantees of future performance and are subject to certain risks, uncertainties and other factors, many of which are beyond the company’s control and are difficult to predict. Therefore, actual outcomes and results may differ materially from what is expressed or forecasted in such forward-looking statements. The reader should not place undue reliance on these forward-looking statements, which speak only as of the date of this news release. Unless legally required, Chevron undertakes no obligation to update publicly any forward-looking statements, whether as a result of new information, future events or otherwise.

Among the important factors that could cause actual results to differ materially from those in the forward-looking statements are: changing crude oil and natural gas prices and demand for the company’s products, and production curtailments due to market conditions; crude oil production quotas or other actions that might be imposed by the Organization of Petroleum Exporting Countries and other producing countries; technological advancements; changes to government policies in the countries in which the company operates; public health crises, such as pandemics (including coronavirus (COVID-19)) and epidemics, and any related government policies and actions; disruptions in the company’s global supply chain, including supply chain constraints and escalation of the cost of goods and services; changing economic, regulatory and political environments in the various countries in which the company operates; general domestic and international economic, market and political conditions, including the military conflict between Russia and Ukraine and the global response to such conflict; changing refining, marketing and chemicals margins; actions of competitors or regulators; timing of exploration expenses; timing of crude oil liftings; the competitiveness of alternate-energy sources or product substitutes; development of large carbon capture and offset markets; the results of operations and financial condition of the company’s suppliers, vendors, partners and equity affiliates, particularly during the COVID-19 pandemic; the inability or failure of the company’s joint-venture partners to fund their share of operations and development activities; the potential failure to achieve expected net production from existing and future crude oil and natural gas development projects; potential delays in the development, construction or start-up of planned projects; the potential disruption or interruption of the company’s operations due to war, accidents, political events, civil unrest, severe weather, cyber threats, terrorist acts, or other natural or human causes beyond the company’s control; the potential liability for remedial actions or assessments under existing or future environmental regulations and litigation; significant operational, investment or product changes undertaken or required by existing or future environmental statutes and regulations, including international agreements and national or regional legislation and regulatory measures to limit or reduce greenhouse gas emissions; the potential liability resulting from pending or future litigation; the company’s future acquisitions or dispositions of assets or shares or the delay or failure of such transactions to close based on required closing conditions; the potential for gains and losses from asset dispositions or impairments; government mandated sales, divestitures, recapitalizations, taxes and tax audits, tariffs, sanctions, changes in fiscal terms or restrictions on scope of company operations; foreign currency movements compared with the U.S. dollar; higher inflation and related impacts; material reductions in corporate liquidity and access to debt markets; the receipt of required Board authorizations to implement capital allocation strategies, including future stock repurchase programs and dividend payments; the effects of changed accounting rules under generally accepted accounting principles promulgated by rule-setting bodies; the company’s ability to identify and mitigate the risks and hazards inherent in operating in the global energy industry; and the factors set forth under the heading “Risk Factors” on pages 20 through 25 of the company’s 2021 Annual Report on Form 10-K and in subsequent filings with the U.S. Securities and Exchange Commission. Other unpredictable or unknown factors not discussed in this news release could also have material adverse effects on forward-looking statements.


Contacts

For Pertamina:

Mr. Dicky Septriadi
Corporate Secretary
Tel: 08111663456
Email: This email address is being protected from spambots. You need JavaScript enabled to view it.

For Keppel:

Media Relations
Mr. Ang Lai Lee
Deputy General Manager
Group Corporate Communications
Keppel Corporation Limited
Tel: (65) 6413 6427
Email: This email address is being protected from spambots. You need JavaScript enabled to view it.

For Chevron:

Mr. Creighton Welch
Communications Manager
Chevron New Energies
This email address is being protected from spambots. You need JavaScript enabled to view it.

For Keppel:

Investor Relations
Ms. Tang Yibing
Manager
Group Corporate Communications
Keppel Corporation Limited
Tel: (65) 6413 6474
Email: This email address is being protected from spambots. You need JavaScript enabled to view it.

For Chevron:

Ms. Ferita Damayanti
Corporate Affairs Manager
Chevron Indonesia Business Unit
This email address is being protected from spambots. You need JavaScript enabled to view it.

DUBLIN--(BUSINESS WIRE)--The "District Heating Market by Heat Source (Coal, Natural Gas, Renewables, Oil & Petroleum Products), Component (Boiler, Heat Exchanger), Plant Type (Boiler Plants, CHP), Application (Residential, Commercial, Industrial) and Region - Global Forecast to 2027" report has been added to ResearchAndMarkets.com's offering.


The global district heating market is estimated at USD 167.8 Billion in 2022 and is projected to reach USD 226.5 Billion by 2027, registering a CAGR of 6.2% during the forecast period. The rise in demand for district heating is also attributed to increasing demand for energy-efficient and cost-effective heating systems, growing urbanization and industrialization, increasing integration of renewable energy in district heating, advantages over individual in-building heating systems, and policy initiatives by governments and associations.

Renewables Heat Source: The segment expected to grow at the highest CAGR of district heating market by 2027

The renewable heat source segment is anticipated to record the highest CAGR of 8.8% during the forecast period. In terms of established and installed capacity, the district heat generated using natural gas is higher than the district heat produced utilizing renewables. However, the revenue generated by using renewables as a heat source is higher than that of natural gas due to the reasonable cost of renewables. These factors are expected to create lucrative opportunities for the growth of the district heating market for the renewable heat source segment during the forecast period.

Boiler Plant Type: To grow at the second highest CAGR of district heating market by 2027

The boiler plants segment is expected to witness the second highest CAGR of 5.7% during the forecast period. Boilers are more energy efficient than standard air-heating systems. This is because water is a much better thermal conductor than air; it warms up faster and retains heat for longer. Boilers also heat water for district heating more evenly and easily.

Commercial Application: Expected to grow at the second highest CAGR of district heating market by 2027

The commercial application segment is expected to experience the second-highest CAGR of 6.6% during the forecast period. The growth of the commercial application segment is mainly attributed to the increasing adoption of district heating in commercial buildings and the growing demand for energy-efficient devices. District heating provides increased occupant comfort and reduces cool air circulation while reducing the energy required to heat the space. While these systems can have a substantial initial investment compared to other options, they are beneficial in the long run with lower energy bills while achieving much higher levels of comfort and increasing staff morale. Similarly, heavy investments by the worldwide governments for the construction of commercial spaces such as institutes, offices, and retail stores are expected to promote the growth of the district heating market.

Market Dynamics

Drivers

  • Increasing Demand for Energy-Efficient and Cost-Effective Heating Systems
  • Growing Urbanization and Industrialization
  • Increasing Integration of Renewable Energy in District Heating
  • Advantages Over Individual In-Building Heating Systems
  • Rising Number of Policy Initiatives by Governments and Associations

Restraints

  • High Infrastructure and Maintenance Costs
  • Reduced Effectiveness in Small Heating Loads

Opportunities

  • Rising Demand for Energy-Efficient and Sustainable Heating Technologies
  • Increasing Integration of Multiple Energy Sources
  • Growing Technological Advancements and Digitalization
  • Rising Number of Initiatives Related to Clean Energy Production

Challenges

  • Need for Robust Transportation Equipment
  • Difficulty in Load Prediction and Better Utilization of Heating Systems

Key Topics Covered:

1 Introduction

2 Research Methodology

3 Executive Summary

4 Premium Insights

5 Market Overview

6 District Heating Market, by Component

7 District Heating Market, by Heat Source

8 District Heating Market, by Plant Type

9 District Heating Market, by Application

10 Geographic Analysis

11 Competitive Landscape

12 Company Profiles

13 Appendix

Companies Mentioned

  • Alfa Laval
  • Clearway Community Energy
  • Dall Energy
  • Danfoss
  • Engie
  • Enwave Energy
  • Fortum
  • Fvb Energy
  • General Electric
  • Goteborg Energi
  • Hafslund Eco
  • Helen Ltd
  • Kelag
  • Keppel Corporation
  • Logstor
  • Orsted
  • Ramboll Group
  • Savon Voima
  • Shinryo Corporation
  • Statkraft
  • Steag GmbH
  • Uniper Se
  • Vattenfall
  • Veolia
  • Vital Energy

For more information about this report visit https://www.researchandmarkets.com/r/bdrzea


Contacts

ResearchAndMarkets.com
Laura Wood, Senior Press Manager
This email address is being protected from spambots. You need JavaScript enabled to view it.
For E.S.T Office Hours Call 1-917-300-0470
For U.S./ CAN Toll Free Call 1-800-526-8630
For GMT Office Hours Call +353-1-416-8900

LONDON--(BUSINESS WIRE)--Astra Asset Management, a leading European alternative credit manager and private credit manager, has been selected as the exclusive financing partner to Harland & Wolff.


Listed on the London Stock Exchange (ticker: HARL), Harland & Wolff was established in 1861. It operates one of Europe’s largest dry docks in Belfast, Northern Ireland. Over its 161-year history, Harland & Wolff has been at the forefront of the UK’s offshore and maritime engineering industry. Some of its heritage works include the construction of HMS Britannia and the Myrina; the first UK-made supertanker.

Astra’s executive management team, led by its Founder and CIO, Anish Mathur, looks forward to supporting Harland & Wolff’s strategic growth plans and developing a strong synergistic partnership.

Furthermore, this partnership is expected to lead to job creation and apprenticeships in one of the UK’s key industrial sectors, as Harland & Wolff continues to focus on opportunities across five markets: commercial, cruise and ferry, defence, oil and gas and renewables.

“We are delighted to make this announcement and are thrilled to have been selected by Harland & Wolff,” remarked Astra CIO, Anish Mathur. “This is a business supporting one of the UK’s key strategic industries and we look forward to working with Harland & Wolff over the coming years. We support the management vision in building a world leading maritime and offshore engineering business.”

Commenting on the deal, Harland & Wolff group CEO John Wood, said: “We are delighted to enter into this new facility and partnership with Astra. This relationship will be incredibly useful to meet our capital expenditure and working capital obligations towards some key and large contracts that we have been negotiating over the last 18 months, due to come to fruition in the next couple of quarters. As a UK based private debt lender, Astra are intimately aware of local dynamics of shipbuilding, levelling-up and energy security and we look forward to working alongside Astra in the months and years to follow.”

About Harland & Wolff

Harland & Wolff is a wholly owned subsidiary of parent company InfraStrata plc, which now trades under the new name of Harland & Wolff Group Holdings plc. on the London Stock Exchange. A multisite fabrication company, it operates across five markets in the maritime and offshore industry, providing six services: technical services, fabrication and construction, decommissioning, repair and maintenance, in-service support and conversion.

About Astra Asset Management UK Limited

Founded in 2012, Astra Asset Management has grown to become one of Europe’s leading specialist credit asset managers. Astra manages a number of investment products within credit markets. The team focuses on non-vanilla credit strategies backed by mortgages and corporate debt across asset classes in Europe and the US.


Contacts

For more information, please contact:
Ken Brougher
+44 203 189 9700

KANSAS CITY, Mo.--(BUSINESS WIRE)--$CORR--CorEnergy Infrastructure Trust, Inc. (NYSE: CORR, CORRPrA) ("CorEnergy" or the "Company") today announced financial results for the third quarter, ended September 30, 2022.


Third Quarter 2022 and Recent Highlights

  • Reported Total Revenue of $33.0 million for the three months ended September 30, 2022.
  • Generated Net Loss of $15.5 million, inclusive of a $16.2 million impairment to goodwill, and Adjusted EBITDA (a non-GAAP financial measure) of $8.9 million.
  • Transported an average of 164,748 barrels per day, versus 159,202 barrels per day the previous quarter.
  • Began collecting rate increases at two Crimson subsidiaries.
  • Declared a third quarter 2022 Common Stock dividend of $0.05 per share and a 7.375% Series A Cumulative Redeemable Preferred Stock dividend of $0.4609375 per depositary share. Both dividends will be paid on November 30, 2022, to stockholders of record on November 16, 2022.

Management Commentary

“Our third quarter was characterized by steady performance from our predictable MoGas and Omega natural gas operations, where we are also evaluating expansion opportunities. We also reported improved volume on our Crimson assets as we continue to manage through disruptions in the global oil supply chain and operational issues with third-party infrastructure. We have initiated both cost efficiency measures and tariff increases on our California pipelines in response to this increased volatility, while maintaining our 2022 outlook calling for adjusted EBITDA of between $42.0 and $44.0 million,” said Dave Schulte, Chief Executive Officer.

“We are also advancing our work in the new carbon capture and sequestration market, where our California assets are well positioned as a critical linkage between large carbon emission sources and attractive storage reservoirs. CCS has emerged as a particular focus in California due to the California Air Resources Board making it a central pillar in its aggressive greenhouse gas reduction plans and economic incentives from government entities at both the federal and state levels that may be the best in the nation.”

Third Quarter Performance Summary

Third quarter financial highlights are as follows:


For the Three Months Ended


September 30, 2022


Per Share


Total

Basic

Diluted

Net Loss (Attributable to Common Stockholders)

$

(18,490,882

)

$

(1.17

)

$

(1.17

)

Net Cash Provided by Operating Activities

$

26,703,113


Adjusted Net Income1

$

1,096,465


Cash Available for Distribution (CAD)1

$

(1,006,756

)


Adjusted EBITDA2

$

8,882,866


Dividends Declared to Common Stockholders


$

0.05


1 Non-GAAP financial measure. Adjusted Net Income excludes special items of $405 thousand, which are transaction costs; however, CAD has not been so adjusted. Reconciliations of Adjusted Net Income and CAD, as presented, to Net Loss and Net Cash Provided by Operating Activities are included at the end of this press release. See Note 1 below for additional information.

2 Non-GAAP financial measure. Adjusted EBITDA excludes special items of $405 thousand, which are transaction costs. Reconciliation of Adjusted EBITDA, as presented, to Net Loss is included at the end of this press release. See Note 2 below for additional information.

Crimson Rate Increases

During the third quarter, Crimson filed for a tariff increase of 34.9% on its Southern California pipeline system and 10% on its KLM pipeline. Both of these tariff filings were protested by shippers and are proceeding through the CPUC process with resolution expected in second half of 2023. The Company commenced collecting a 10% tariff increase on both systems after filing, subject to refund, as allowed by the CPUC rules. The Company plans to file and begin collecting an additional 10% increase on its Southern California pipeline system in August 2023, for a total effective increase of 21%, which represents the anniversary date of the original filing for that system, assuming the rate case has not been resolved by that time. CorEnergy believes Crimson's cost-of-service fully justifies both requested increases.

Crimson filed for a Tariff increase of 10% increase on its SPB system, but withdrew it due to increased volumes and general volume variability on that line. The Company will continuously monitor its cost-of-service and will file a rate increase on this system if conditions warrant.

Business Development Activities

CorEnergy continues to seek opportunities for negotiated transactions that could expand the Company's market reach or REIT-qualifying revenue sources, including both traditional infrastructure and potential alternative uses for its rights of way. The Company intends to continue to prudently advance these opportunities within our existing footprint or to enhance scale and diversification; however there can be no assurances that any such opportunities will be consummated on terms that are acceptable or advantageous or at all.

Outlook

CorEnergy is maintaining its outlook for 2022:

  • Expected Adjusted EBITDA of $42.0-$44.0 million, (see Note 2 below for additional details);
  • Maintenance capital expenditures expected to be in the range of $8.0 million to $9.0 million in 2022 (quarterly maintenance costs are not expected to be uniform throughout the year due to project timing); and
  • The Company will continue to evaluate dividends, subject to Board approval, on a quarterly basis in line with current practices.

Dividend and Distribution Declarations

The Company currently expects to characterize at least some portion of its 2022 Common Stock and Preferred Stock dividends as Return of Capital for tax purposes.

Common Stock: A third quarter 2022 dividend of $0.05 per share was declared for CorEnergy's common stock. The dividend will be paid on November 30, 2022, to stockholders of record on November 16, 2022.

Preferred Stock: For the Company's 7.375% Series A Cumulative Redeemable Preferred Stock, a cash dividend of $0.4609375 per depositary share was declared for the third quarter. The preferred stock dividend, which equates to an annual dividend payment of $1.84375 per depositary share, will be paid on November 30, 2022, to stockholders of record on November 16, 2022.

Class A-1 Units: Pursuant to the terms of the Crimson transaction, the holders of Crimson Class A-1 Units will receive a cash distribution of $0.4609375 per unit for the third quarter based on the Company’s declared Series A Preferred dividend for the quarter.

Class A-2 and Class A-3 Units: Pursuant to the terms of the Crimson transaction, the holders of Crimson Class A-2 and Class A-3 Units will not receive a cash distribution for the third quarter, because no dividend was declared on the underlying Class B Common Stock for the quarter.

Third Quarter Results Call

CorEnergy will host a conference call on Thursday, November 10, 2022 at 10:00 a.m. Central Time to discuss its financial results. The call may also include discussion of Company developments, and forward-looking and other material information about business and financial matters. To join the call, dial +1-973-528-0016 and provide access code 977524 at least five minutes prior to the scheduled start time. The call will also be webcast in a listen-only format. A link to the webcast will be accessible at corenergy.reit.

A replay of the call will be available until 10:00 a.m. Central Time on December 9, 2022, by dialing +1-919-882-2331. The Conference ID is 46842. A webcast replay of the conference call will also be available on the Company’s website, corenergy.reit.

About CorEnergy Infrastructure Trust, Inc.

CorEnergy Infrastructure Trust, Inc. (NYSE: CORR, CORRPrA) is a real estate investment trust that owns and operates or leases regulated natural gas transmission and distribution lines and crude oil gathering, storage and transmission pipelines and associated rights-of-way. For more information, please visit corenergy.reit.

Forward-Looking Statements

With the exception of historical information, certain statements contained in this press release may include "forward-looking statements" within the meaning of Section 27A of the Securities Act of 1933 and Section 21E of the Securities Exchange Act of 1934, such as those pertaining to our guidance, pursuit of growth opportunities, anticipated transportation volumes, expected rate increases, planned capital expenditures, planned dividend payment levels, capital resources and liquidity, and results of operations and financial condition. You can identify forward-looking statements by use of words such as "will," "may," "should," "could," "believes," "expects," "anticipates," "estimates," "intends," "projects," "goals," "objectives," "targets," "predicts," "plans," "seeks," or similar expressions or other comparable terms or discussions of strategy, plans or intentions. Although CorEnergy believes that the expectations reflected in these forward-looking statements are reasonable, they do involve assumptions, risks and uncertainties, and these expectations may prove to be incorrect. Actual results could differ materially from those anticipated in these forward-looking statements as a result of a variety of factors, including, among others, changes in economic and business conditions; a decline in oil production levels; competitive and regulatory pressures; failure to realize the anticipated benefits of the Crimson transaction; the risk that CPUC approval is not obtained, is delayed or is subject to unanticipated conditions that could adversely affect CorEnergy or the expected benefits of the Crimson transaction; risks related to the uncertainty of the projected financial information with respect to Crimson; compliance with environmental, safety and other laws; our continued ability to access debt and equity markets and comply with existing debt covenants; risks associated with climate change; risks associated with changes in tax laws and our ability to continue to qualify as a REIT; and other factors discussed in CorEnergy’s reports that are filed with the Securities and Exchange Commission. You should not place undue reliance on these forward-looking statements, which speak only as of the date of this press release. Other than as required by law, CorEnergy does not assume a duty to update any forward-looking statement. In particular, any dividends paid in the future to our stockholders will depend on the actual performance of CorEnergy, its costs of leverage and other operating expenses and will be subject to the approval of CorEnergy’s Board of Directors and compliance with leverage covenants and other applicable requirements.

Notes

1 Management uses Adjusted Net Income as a measure of profitability and CAD as a measure of long-term sustainable performance. Adjusted Net Income and CAD are non-GAAP measures. Adjusted Net Income represents net income (loss) adjusted for loss on goodwill impairment, transaction-related costs, and gain on sale of equipment. CAD represents Adjusted Net Income adjusted for depreciation, amortization and ARO accretion (cash flows), stock-based compensation, and deferred tax expense less transaction-related costs, maintenance capital expenditures, preferred dividend requirements, and mandatory debt amortization. Reconciliations of Adjusted Net Income and CAD to Net Income (Loss) and Net Cash Provided By Operating Activities, the most directly comparable corresponding GAAP measures, are included in the additional financial information attached to this press release.

2 Management uses Adjusted EBITDA as a measure of operating performance. Adjusted EBITDA represents net income (loss) adjusted for items such as loss on impairment of goodwill, transaction-related costs, depreciation, amortization and ARO accretion expense, stock-based compensation, income tax expense, interest expense and gain on the sale of equipment. The reconciliation of Adjusted EBITDA to Net Income (Loss), the most directly comparable GAAP measure, is included in the additional financial information attached to this press release. Future period non-GAAP guidance includes adjustments for special items not indicative of our core operations, which may include, without limitation, items included in the additional financial information attached to this press release. Such adjustments may be affected by changes in ongoing assumptions and judgments, as well as nonrecurring, unusual or unanticipated charges, expenses or gains or other items that may not directly correlate to the underlying performance of our business operations. The exact amounts of these adjustments are not currently determinable but may be significant. It is therefore not practicable to provide the comparable GAAP measures or reconcile this future period non-GAAP guidance to the most comparable GAAP measures.

Consolidated Balance Sheets


September 30, 2022

December 31, 2021

Assets

(Unaudited)


Property and equipment, net of accumulated depreciation of $48,864,283 and $37,022,035, respectively (Crimson VIE*: $337,470,077, and $338,452,392, respectively)

$

438,249,633


$

441,430,193


Leased property, net of accumulated depreciation of $289,154 and $258,207, respectively


1,236,873


1,267,821


Financing notes and related accrued interest receivable, net of reserve of $600,000 and $600,000, respectively


904,743


1,036,660


Cash and cash equivalents (Crimson VIE: $3,125,706 and $1,870,000, respectively)


21,776,263


12,496,478


Accounts and other receivables (Crimson VIE: $7,654,757 and $11,291,749, respectively)


10,609,744


15,367,389


Due from affiliated companies (Crimson VIE: $94,994 and $676,825, respectively)


94,994


676,825


Deferred costs, net of accumulated amortization of $631,408 and $345,775, respectively


510,939


796,572


Inventory (Crimson VIE: $5,859,262 and $3,839,865, respectively)


6,004,037


3,953,523


Prepaid expenses and other assets (Crimson VIE: $3,946,389 and $5,004,566, respectively)


5,699,079


9,075,043


Operating right-of-use assets (Crimson VIE: $4,755,606 and $5,647,631, respectively)


5,082,028


6,075,939


Deferred tax asset, net


111,681


206,285


Goodwill


16,210,020


Total Assets

$

490,280,014


$

508,592,748


Liabilities and Equity


Secured credit facilities, net of deferred financing costs of $817,972 and $1,275,244, respectively

$

99,182,028


$

99,724,756


Unsecured convertible senior notes, net of discount and debt issuance costs of $1,890,895 and $2,384,170, respectively


116,159,105


115,665,830


Accounts payable and other accrued liabilities (Crimson VIE: $14,935,627 and $9,743,904, respectively)


19,596,670


17,036,064


Income tax payable


344,630


Due to affiliated companies (Crimson VIE: $276,428 and $648,316, respectively)


276,428


648,316


Operating lease liability (Crimson VIE: $4,653,594 and $5,647,036, respectively)


4,951,891


6,046,657


Unearned revenue (Crimson VIE: $205,790 and $199,405, respectively)


5,990,897


5,839,602


Total Liabilities

$

246,501,649


$

244,961,225


Equity


Series A Cumulative Redeemable Preferred Stock 7.375%, $129,525,675 liquidation preference ($2,500 per share, $0.001 par value); 10,000,000 authorized; 51,810 issued and outstanding at September 30, 2022 and December 31, 2021

$

129,525,675


$

129,525,675


Common stock, non-convertible, $0.001 par value; 15,176,911 and 14,893,184 shares issued and outstanding at September 30, 2022 and December 31, 2021, respectively (100,000,000 shares authorized)


15,177


14,893


Class B Common Stock, $0.001 par value; 683,761 shares issued and outstanding at September 30, 2022 and December 31, 2021, (11,896,100 shares authorized)


684


684


Additional paid-in capital


329,796,049


338,302,735


Retained deficit


(339,752,470

)


(327,157,636

)

Total CorEnergy Equity


119,585,115


140,686,351


Non-controlling interest (Crimson)


124,193,250


122,945,172


Total Equity


243,778,365


263,631,523


Total Liabilities and Equity

$

490,280,014


$

508,592,748


*Variable Interest Entity (VIE)


Consolidated Statements of Operations (Unaudited)


For the Three Months Ended


September 30, 2022

June 30, 2022

Revenue


Transportation and distribution

$

31,305,546


$

28,112,834


Pipeline loss allowance subsequent sales


1,477,251


3,074,436


Lease


111,725


30,825


Other


67,164


303,341


Total Revenue


32,961,686


31,521,436


Expenses


Transportation and distribution


17,647,673


14,263,677


Pipeline loss allowance subsequent sales cost of revenue


1,385,028


2,438,987


General and administrative


5,743,342


5,276,363


Depreciation, amortization and ARO accretion


4,028,800


3,992,314


Loss on impairment of goodwill


16,210,020


Total Expenses


45,014,863


25,971,341


Operating Income (loss)

$

(12,053,177

)

$

5,550,095


Other Income (expense)


Other income

$

76,050


$

136,023


Interest expense


(3,483,208

)


(3,342,906

)

Total Other Expense


(3,407,158

)


(3,206,883

)

Income (loss) before income taxes


(15,460,335

)


2,343,212


Taxes


Current tax expense


35,187


156,877


Deferred tax expense


6,182


16,209


Income tax expense, net


41,369


173,086


Net Income (loss)


(15,501,704

)


2,170,126


Less: Net income attributable to non-controlling interest


601,048


966,671


Net income (loss) attributable to CorEnergy

$

(16,102,752

)

$

1,203,455


Preferred stock dividends


2,388,130


2,388,130


Net loss attributable to Common Stockholders

$

(18,490,882

)

$

(1,184,675

)


Net Loss Per Common Share:


Basic

$

(1.17

)

$

(0.08

)

Diluted

$

(1.17

)

$

(0.08

)

Weighted Average Shares of Common Stock Outstanding:


Basic


15,773,469


15,673,703


Diluted


15,773,469


15,673,703


Dividends declared per common share

$

0.050


$

0.050


Consolidated Statements of Cash Flows (Unaudited)


For the Nine Months Ended


September 30, 2022

September 30, 2021

Operating Activities


Net loss

$

(8,966,821

)

$

(2,346,883

)

Adjustments to reconcile net loss to net cash provided by operating activities:


Deferred income tax, net


94,604


222,337


Depreciation, amortization and ARO accretion


11,997,781


10,337,639


Amortization of debt issuance costs


1,236,178


1,192,821


Goodwill impairment


16,210,020


Loss on impairment and disposal of leased property


5,811,779


Loss on termination of lease


165,644


Loss on extinguishment of debt


861,814


Gain on sale of equipment


(39,678

)


(16,508

)

Stock-based compensation


384,383


22,500


Changes in assets and liabilities:


Accounts and other receivables


2,715,207


702,251


Financing note accrued interest receivable


(8,780

)

Inventory


(2,050,514

)


(1,572,534

)

Prepaid expenses and other assets


4,296,890


(2,409,857

)

Due from affiliated companies, net


209,943


(188,578

)

Management fee payable


(971,626

)

Accounts payable and other accrued liabilities


1,213,961


1,361,746


Income tax liability


344,630


33,027


Operating lease liability


(1,094,766

)


(496,900

)

Unearned revenue


151,295


(439,106

)

Net cash provided by operating activities

$

26,703,113


$

12,260,786


Investing Activities


Acquisition of Crimson Midstream Holdings, net of cash acquired


(69,002,053

)

Acquisition of Corridor InfraTrust Management, net of cash acquired


952,487


Purchases of property and equipment


(7,759,603

)


(15,024,412

)

Proceeds from reimbursable projects


2,385,858


Proceeds from sale of property and equipment


55,075


97,210


Proceeds from insurance recovery


60,153


Principal payment on financing note receivable


131,917


113,595


Cash received from third parties for reimbursable projects


26,849


Net cash used in investing activities

$

(5,186,753

)

$

(82,776,171

)

Financing Activities


Debt financing costs


(2,735,922

)

Dividends paid on Series A preferred stock


(7,164,390

)


(7,007,474

)

Dividends paid on Common Stock


(1,644,549

)


(1,799,268

)

Distributions to non-controlling interest


(2,427,636

)


(1,446,901

)

Advances on revolving line of credit


9,000,000


19,000,000


Payments on revolving line of credit


(4,000,000

)


(16,000,000

)

Principal payments on Crimson secured credit facility


(6,000,000

)


(4,000,000

)

Net cash used in financing activities

$

(12,236,575

)

$

(13,989,565

)

Net change in Cash and Cash Equivalents


9,279,785


(84,504,950

)

Cash and Cash Equivalents at beginning of period


12,496,478


99,596,907


Cash and Cash Equivalents at end of period

$

21,776,263


$

15,091,957


Supplemental Disclosure of Cash Flow Information


Interest paid

$

8,802,697


$

10,206,280


Income taxes paid (net of refunds)


(12,055

)


(635,730

)


Non-Cash Investing Activities


In-kind consideration for the Grand Isle Gathering System provided as partial consideration for the Crimson Midstream Holdings acquisition

$


$

48,873,169


Crimson Credit Facility assumed and refinanced in connection with the Crimson Midstream Holdings acquisition


105,000,000


Equity consideration attributable to non-controlling interest holder in connection with the Crimson Midstream Holdings acquisition


116,205,762


Purchases of property, plant and equipment in accounts payable and other accrued liabilities


2,249,585


Series A preferred stock issued due to internalization transaction


4,245,112


Common Stock issued due to internalization transaction


7,096,153


Class B Common Stock issued due to internalization transaction


3,288,890


Non-Cash Financing Activities


Change in accounts payable and accrued expenses related to debt financing costs

$


$

235,198


Crimson A-2 Units dividends payment-in-kind


610,353


Reinvestment of Dividends Paid to Common Stockholders


601,184


Dividend equivalents accrued on RSUs


34,145


Non-GAAP Financial Measurements (Unaudited)

The following table presents a reconciliation of Net Income (Loss), as reported in the Consolidated Statements of Operations, to Adjusted Net Income and CAD:


For the Three Months Ended


September 30, 2022

June 30, 2022

Net Income (loss)

$

(15,501,704

)

$

2,170,126

Add:


Loss on goodwill impairment


16,210,020


Transaction costs


405,149


221,241

Less:


Gain on the sale of equipment


17,000


22,678

Adjusted Net Income, excluding special items

$

1,096,465


$

2,368,689

Add:


Depreciation, amortization and ARO accretion (Cash Flows)


4,440,858


4,404,174

Stock-based compensation


233,024


151,359

Deferred tax expense


6,182


16,209

Less:


Transaction costs


405,149


221,241

Maintenance capital expenditures


1,180,794


1,475,433

Preferred dividend requirements - Series A


2,388,130


2,388,130

Preferred dividend requirements - Non-controlling interest


809,212


809,212

Mandatory debt amortization


2,000,000


2,000,000

Cash Available for Distribution (CAD)

$

(1,006,756

)

$

46,415

The following table reconciles net cash provided by operating activities, as reported in the Consolidated Statements of Cash Flows to CAD:


For the Three Months Ended


September 30, 2022

June 30, 2022

Net cash provided by operating activities

$

8,051,926


$

10,070,603


Changes in working capital


(2,680,546

)


(3,351,413

)

Maintenance capital expenditures


(1,180,794

)


(1,475,433

)

Preferred dividend requirements


(2,388,130

)


(2,388,130

)

Preferred dividend requirements - non-controlling interest


(809,212

)


(809,212

)

Mandatory debt amortization included in financing activities


(2,000,000

)


(2,000,000

)

Cash Available for Distribution (CAD)

$

(1,006,756

)

$

46,415


Other Special Items:


Transaction costs

$

405,149


$

221,241


Other Cash Flow Information:


Net cash used in investing activities

$

(3,275,513

)

$

(857,208

)

Net cash used in financing activities


(752,405

)


(4,749,222

)


Contacts

CorEnergy Infrastructure Trust, Inc.
Investor Relations
Debbie Hagen or Matt Kreps
877-699-CORR (2677)
This email address is being protected from spambots. You need JavaScript enabled to view it.


Read full story here

A leading African mining company based in Democratic Republic of Congo will benefit from SES’s O3b high-throughput, low-latency connectivity delivered by Shevon

LUXEMBOURG--(BUSINESS WIRE)--A leading African mining company based in the DRC will be enjoying high-speed satellite-based connectivity services as part of a new agreement between Shevon and SES, the two companies announced today. The two-year agreement will see Shevon provide for the first time SES’s O3b Medium earth Orbit (MEO) high-throughput and low-latency connectivity services, enabling the DRC mining company to implement new services and applications that will improve workers’ safety, digitalise operations and maximise profitability through increased agility and automation. The new agreement reflects the strength and success of the existing long-term partnership between the two companies.


Craig Jennings, CEO of Shevon, said, “SES has been providing us geostationary satellite capacity for years and it has served us well. However, in recent years, we have seen the energy sector in this region growing and developing where the demand for reliable, high-throughput and low-latency services is more critical than ever. We are excited for our first MEO contract with SES and how the low-latency services will transform our business.”

Caroline Kamaitha, Vice President of Sales Africa at SES, said, “Digitalisation is helping the mining industry to evolve. High-throughput, low-latency connectivity and native integration with cloud platforms is enabling a new generation of more profitable operators, who can also boast high levels of oversight and compliance over their remote sites. At SES, we are proud to be helping to spearhead this change through our O3b MEO network – and through our upcoming O3b mPOWER service.”

Follow us on:

Twitter | Facebook | YouTube | LinkedIn | Instagram

Read our Blogs >
Visit the Media Gallery >

About SES

SES has a bold vision to deliver amazing experiences everywhere on earth by distributing the highest quality video content and providing seamless connectivity around the world. As the leader in global content connectivity solutions, SES operates the world’s only multi-orbit constellation of satellites with the unique combination of global coverage and high performance, including the commercially-proven, low-latency Medium Earth Orbit O3b system. By leveraging a vast and intelligent, cloud-enabled network, SES is able to deliver high-quality connectivity solutions anywhere on land, at sea or in the air, and is a trusted partner to the world’s leading telecommunications companies, mobile network operators, governments, connectivity and cloud service providers, broadcasters, video platform operators and content owners. SES’s video network carries ~8,000 channels and has an unparalleled reach of 366 million households, delivering managed media services for both linear and non-linear content. The company is listed on Paris and Luxembourg stock exchanges (Ticker: SESG). Further information is available at: www.ses.com.

About Shevon

Shevon, a leading Satellite communications provider to the Marine, Oil & Gas and Mining verticals knows that Satellite connectivity is critical to the future of mining, with the newest digital technologies bringing exponentially improved productivity, safer working conditions, lower operational costs and better utilization of existing assets to their client’s operations. Through our partnership with SES, Shevon is enabling the latest in digital innovations, delivering high throughput and low latency connectivity solutions coupled with advanced networking and LAN integration. Shevon “partners” with their clients to deliver value added advanced Satellite systems coupled with “mobility” in mining Mesh Networks, delivering the necessary connectivity for Cloud Services, Mobility and IT/OT convergence to a fully connected mine. Shevon, as a Gold Partner of SES Networks is ideally positioned to offer our customers a fully managed, truly end-to-end, business driven solution from where all major aspects of the solution can be delivered by Shevon’s capability in any market – Marine, Oil & Gas, Terrestrial and or combination. Further information is available at www.shevon.co.za


Contacts

Suzanne Ong
External Communications
Tel. +352 710 725 500
This email address is being protected from spambots. You need JavaScript enabled to view it.

Exeger’s Powerfoyle solar harvesting cell technology combined with Semtech’s LoRa Edge platform enable more efficient and sustainable IoT tracking applications.

CAMARILLO, Calif.--(BUSINESS WIRE)--#InternetofThings--Semtech Corporation (Nasdaq: SMTC), a leading global supplier of high performance analog and mixed-signal semiconductors and advanced algorithms, announces its collaboration with Exeger, a Swedish deep-tech company manufacturing fully customizable solar cells. Combining Semtech’s LoRa Edge™ asset management platform with Exeger’s Powerfoyle solar cell technology significantly extends the battery life of asset tracking and environmental sensing devices.


Semtech’s LoRa Edge scans GNSS satellites as well as Wi-Fi SSIDs and partitions the processing between IoT devices and the LoRa Cloud™ to determine location. The Cloud-based solver significantly reduces power consumption and increases battery life. Exeger’s Powerfoyle is uniquely flexible and durable and can be integrated seamlessly into any electronics device. The solar cell technology converts all forms of light to charge and power devices with clean, endless energy.

Coupling the benefits of Powerfoyle with the ultra-low power capabilities of Semtech’s LoRa® devices will provide IoT applications with an extended or even unlimited battery life,” said Dr. Oscar Hemberg, chief product integration officer at Exeger. “Together, we move one step closer to energy independence through more sustainable products powered with clean, endless energy.”

The patented Powerfoyle material integrates into IoT sensors with Semtech’s LoRa Edge chip-to-Cloud platform with the goal to create a new standard for environmentally friendly platforms for the IoT industry. Combining both technologies is expected to spur a world of new solar-powered tracking applications for geolocation use cases, including indoor and outdoor asset tracking, global supply chain logistics, agriculture, smart utilities, and smart cities.

LoRa devices enable smart IoT applications that help solve some of the biggest challenges facing our planet,” said Marc Pégulu, vice president and general manager for Semtech’s Wireless and Sensing Products Group. “Semtech and Exeger’s collaboration will enable manufacturers to develop IoT devices leveraging new energy harvesting technology for a smarter and more sustainable future.”

New IoT asset trackers will be showcased at EdgeTech+ 2022, Nov. 16 – 18, 2022, in Yokahama, Japan, in the LoRa Pavilion, booth A-H04. Register to attend the show here.

To learn more about Exeger’s Powerfoyle, please visit here.

Further information on Semtech’s LoRa Edge platform can be found here.

About Semtech’s LoRa® Platform

Semtech’s LoRa chip-to-Cloud platform is a globally adopted long range, low power solution for IoT applications, enabling the rapid development and deployment of long range, ultra-low power and cost efficient IoT networks, gateways, sensors, module products, and IoT services worldwide. Semtech’s LoRa technology provides the communication layer for the LoRaWAN® standard, which is maintained by the LoRa Alliance®, an open IoT alliance for Low Power Wide Area Network (LPWAN) applications that has been used to deploy IoT networks in over 173 countries. Semtech is a founding member of the LoRa Alliance and produces the “The WAN Network Show” podcast to connect massive IoT end users to operators of LoRaWAN networks around the world. With the proliferation of LoRa devices and the LoRaWAN standard, the LoRa Developer Portal is a technical support platform for IoT innovators to learn, connect, collaborate, and find resources to help accelerate product development efforts and expedite time to market. To learn more about how LoRa enables IoT and creates a more sustainable and smarter planet, visit Semtech’s LoRa site.

About Exeger

Exeger is a Swedish company with a unique solar cell technology that converts all forms of light into electrical energy. This material, Powerfoyle, is the world’s only fully customizable solar cell. With its superior design properties, it can be integrated seamlessly into any electronic device. Powerfoyle enhances every product it is integrated into with extended or even unlimited battery life, putting the power of cutting-edge solar cell technology directly in the hands of people. Exeger is leading the way to energy independence through more sustainable and user-friendly products – with the vision to touch the lives of a billion people by 2030. For more information, visit www.exeger.com and www.powerfoyle.com.

About Semtech

Semtech Corporation is a leading global supplier of high performance analog and mixed-signal semiconductors and advanced algorithms for infrastructure, high-end consumer and industrial equipment. Products are designed to benefit the engineering community as well as the global community. The Company is dedicated to reducing the impact it, and its products, have on the environment. Internal green programs seek to reduce waste through material and manufacturing control, use of green technology and designing for resource reduction. Publicly traded since 1967, Semtech is listed on the NASDAQ Global Select Market under the symbol SMTC. For more information, visit www.semtech.com.

Forward-Looking and Cautionary Statements

All statements contained herein that are not statements of historical fact, including statements that use the words “will,” “goal to,” “expected to,” “designed to” or other similar words or expressions, that describe Semtech Corporation’s or its management’s future plans, objectives or goals are “forward-looking statements” and are made pursuant to the Safe-Harbor provisions of the Private Securities Litigation Reform Act of 1995, as amended. Such forward-looking statements involve known and unknown risks, uncertainties and other factors that could cause the actual results of Semtech Corporation to be materially different from the historical results and/or from any future results or outcomes expressed or implied by such forward-looking statements. Such factors include, but are not limited to: the uncertainty surrounding the impact and duration of supply chain constraints and any associated disruptions; the uncertainty surrounding the impact and duration of the COVID-19 pandemic; export restrictions and laws affecting Semtech Corporation’s trade and investments including with respect to Huawei and certain of its affiliates and other entities identified by the U.S. government, and tariffs or the occurrence of trade wars; worldwide economic and political disruptions as a result of the current conflict between Russia and Ukraine; competitive changes in the marketplace including, but not limited to, the pace of growth or adoption rates of applicable products or technologies; downturns in the business cycle; and the additional risk factors set forth in Semtech Corporation’s Annual Report on Form 10-K filed with the Securities and Exchange Commission (www.sec.gov) on March 16, 2022 as such risk factors may be updated, amended or superseded from time to time by subsequent reports that Semtech Corporation files with the Securities and Exchange Commission. Semtech Corporation assumes no obligation to update any forward-looking statements in order to reflect events or circumstances that may arise after the date of this release, except as required by law.

Semtech, the Semtech logo and LoRa are registered trademarks or service marks, and LoRa Edge and LoRa Cloud, are trademarks or service marks, of Semtech Corporation or its affiliates.

SMTC-P


Contacts

Tam Nguyen
Semtech Corporation
This email address is being protected from spambots. You need JavaScript enabled to view it.

LONDON--(BUSINESS WIRE)--Reactive Technologies, a UK and Finland-based grid resilience technology company, today announced that it has strengthened its leadership team, appointing Duncan Burt as Chief Strategic Growth Officer.


Duncan was formerly Operations Director for the GB Electricity and Gas Transmission Grids and Chief Sustainability Officer for National Grid Group. In these roles, he oversaw the development of the British Power Grid as it became the fastest decarbonizing grid in the G20, saw the first coal-free operation of the GB electricity system, and set a strategy for zero carbon operation by 2025. Alongside this, Duncan worked closely with a range of TSOs across the globe in the run-up to COP26 in Glasgow, and was named one of the Global Top 100 Sustainability leaders by Sustainability Magazine.

As Chief Strategic Growth Officer, Duncan will join Reactive’s executive team to support the growth and development of new and existing services that are key to operating power grids with growing levels of renewable generation. These include the company’s first-of-its-kind inertia measurement system, Grid-Sonar, and a growing product offering that supports grid operators with the deep data and monitoring capabilities they need to support zero carbon grids.

“I am very proud to be joining Reactive Technologies at such a critical moment for climate change,” Duncan said. “I have worked closely with Reactive Technologies, winner of the BNEF 2022 Pioneer award, for many years and believe that the innovation, deep data, and technology that Reactive has developed will be key to creating secure, zero carbon grids across the globe.”

Commenting on the appointment, Marc Borrett, CEO said, “There is a pressing need to transition to secure, zero carbon grids, and our customers across the globe are asking us to help them deliver this at pace. Duncan brings with him a wealth of experience in how to deliver and operate low carbon grids that will be invaluable to our customers as they work with us to develop the next generation of high-performance tools for a grid increasingly powered by renewables.”

About Reactive Technologies

Reactive Technologies is a grid resilience technology company helping grid operators, electric utilities, and regulators transition to net zero and ensure resilient renewables-based power grids. Reactive’s products, including the first-of-its-kind Grid-Sonar technology, bring unprecedented transparency to grid operations by measuring grid inertia and other functions with a high degree of accuracy–a vast improvement over the projections and estimates they are replacing. Reactive has worked with some of the most advanced electric utilities in the world and consistently delivers accurate grid data that informs better planning, full utilization of electricity supplies, and cost savings while enabling an accelerated transition to clean energy. Reactive is backed by several of the world’s leading climate tech venture and management firms, including BGF, Breakthrough Energy Ventures, Eaton, and Accenture Ventures. Reactive Technologies is a 2022 Bloomberg New Energy Finance Pioneers winner.


Contacts

Redwood Climate Communications for Reactive Technologies
Josh Garrett
This email address is being protected from spambots. You need JavaScript enabled to view it.

The no-cost service offering connects customers directly to a trusted water emergency cleanup service following a water loss event in their home, speeding up mitigation, repair and significantly reducing damage and costs

PROVO, Utah--(BUSINESS WIRE)--Vivint Smart Home, Inc. (NYSE: VVNT), a leading smart home company, today announced Vivint Repair: Water Sensor Experience. This groundbreaking monitoring service will help significantly lower the costs of water emergencies for both customers and insurers by alerting sensor customers of a leak and enabling connections to a trusted water emergency cleanup service as soon as a water loss event is detected in their home.


The patent-pending, no-cost Water Sensor Experience will be available to Vivint customers in select states with Vivint Water Sensor installed in their homes. Once a water event is detected, Vivint will immediately send an automated email to the customer, notifying them of the water leak and providing them with a link to be connected with a trusted water emergency cleanup service.

“We’re excited to offer our customers access to critical water response services that have the potential to significantly reduce damage and loss costs, especially as speed to recognize and mitigate water damage is essential to reducing losses,” said Ron Davies, Chief Insurance Officer at Vivint. “This offering is the latest in our mission to rethink what traditional smart home protection looks like and leverage our existing technology to lower the risk of at-home emergencies for our customers.”

Vivint’s Water Sensor Experience offering is the latest in the company’s venture into Smart Insurance as it works to re-define protection for homeowners. Water damage is the number one cause of household loss, ​​impacting thousands of people per day, with the average home insurance claim for water damage costing over $11,000. Historically, insurance companies have found out about water claims after emergency mitigation activities occur and have had no influence on who homeowners engage with to assess and repair water damage. Providing homeowners with early guidance and a pathway for quick response by pre-vetted cleanup services significantly lowers the severity of loss and level of risk that is being transferred to an insurance company.

“We’re proud to continue to set the standard for what a smart home should be. Our smart home devices are unique as they not only notify people when an emergency may be occurring, they take additional steps to protect and prevent further damage,” said David Bywater, CEO at Vivint. “Vivint’s water emergency response service builds on this standard and takes our mission of protecting our customers one step further by helping them better prepare and respond to at-home emergencies.”

The service is now operational for existing Vivint customers in four states today including Texas, Louisiana, Georgia and Florida, and the company has plans to expand the service in the coming year.

About Vivint Smart Home

Vivint is a leading smart home company in the United States, delivering an integrated smart home system with in-home consultation, professional installation and support delivered by its Smart Home Pros, as well as 24-7 customer care and monitoring. Dedicated to redefining the home experience with intelligent products and services, Vivint serves over 1.9 million customers. For more information, visit https://www.vivint.com.

Note on Forward-Looking Statements

This press release contains forward-looking statements within the meaning of Section 21E of the Securities Exchange Act of 1934 and the Private Securities Litigation Reform Act of 1995, including statements regarding, among other things, the Company’s plans, strategies and prospects, both business and financial, including without limitation statements regarding, among other things, the Company’s plans and strategies around Smart Insurance, and the technical effectiveness and financial benefits to customers of the Water Emergency Mitigation Service. Generally, statements that are not historical facts, including statements concerning the Company’s possible or assumed future actions, business strategies, events or results of operations, are forward-looking statements. These statements may be preceded by, followed by or include the words “believes,” “estimates,” “expects,” “projects,” “forecasts,” “may,” “will,” “should,” “seeks,” “plans,” “scheduled,” “anticipates” or “intends” or similar expressions. Forward-looking statements are inherently subject to risks and uncertainties, some of which cannot be predicted or quantified. Forward-looking statements should not be read as a guarantee of future performance or results, and they will not necessarily be accurate indications of the times at, or by, which such performance or results will be achieved, if at all. These statements are based on current expectations and assumptions regarding future events and business performance as of the date of this press release, and they are subject to risks and uncertainties, including to those discussed in "Risk Factors" and elsewhere in the Company's most recent Annual Report on Form 10-K for the year ended December 31, 2021, which was filed on March 1, 2022, as such factors may be updated from time to time in the Company’s periodic filings with the SEC, that could cause actual performance or results to differ materially from those expressed in or suggested by the forward-looking statements. Although Vivint Smart Home believes that the expectations reflected in the forward-looking statements are reasonable, it cannot guarantee that the future results, levels of activity, performance or events and circumstances reflected in those statements will be achieved or will occur, and actual results could differ materially from those anticipated or implied in the forward-looking statements. Except as required by law, Vivint Smart Home does not undertake and expressly disclaims any obligation to publicly update or revise any forward-looking statement, whether as a result of new information, future developments or otherwise. You should read the documents Vivint Smart Home has filed with the SEC, including the Form 10-K/A and the Company’s other periodic filings, for more complete information about Vivint Smart Home. These documents are available on both the EDGAR section of the SEC's website at www.sec.gov and the Investor Relations section of Vivint’s website at www.vivint.com.


Contacts

Heidi Mendez
Vivint Public Relations
This email address is being protected from spambots. You need JavaScript enabled to view it.

Offshore Source Logo

Offshore Source keeps you updated with relevant information concerning the Offshore Energy Sector.

Any views or opinions represented on this website belong solely to the author and do not represent those of the people, institutions or organizations that Offshore Source or collaborators may or may not have been associated with in a professional or personal capacity, unless explicitly stated.

Corporate Offices

Technology Systems Corporation
8502 SW Kansas Ave
Stuart, FL 34997

info@tscpublishing.com