Business Wire News

LONG BEACH, Calif.--(BUSINESS WIRE)--California Resources Corporation (NYSE: CRC), an independent oil and natural gas company committed to energy transition in the sector, today reported third quarter 2022 operational and financial results.

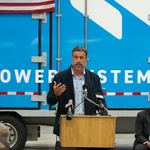
"CRC's strong financial performance, coupled with our consistent operational execution, allowed us to increase our fixed dividend by 66% and our Share Repurchase Program by an additional $200 million. Our disciplined capital allocation and shareholder return strategy demonstrate our continued commitment to our stakeholders. With these changes, CRC is on track to deliver nearly $1 billion in cumulative shareholder returns by year end 2023," said Mac McFarland, CRC’s President and Chief Executive Officer.

McFarland continued, "On the carbon management side, we continue to work with emitters, advance our permits, progress our Carbon TerraVault JV partnership and remain optimistic on our carbon management goals. CRC's carbon management strategy and energy transition efforts continue to be a unique differentiator and support our corporate objectives while delivering on our financial goals and sustainability targets."

Primary Highlights

  • Declared a quarterly dividend of $0.2825 per share of common stock, totaling ~$20 million payable on December 16, 2022 to shareholders of record on December 1, 2022, with subsequent quarterly dividends subject to final determination and Board approval
  • Increased the Share Repurchase Program by $200 million to $850 million from $650 million and extended the term of the program through December 31, 2023
  • Repurchased 1,921,181 common shares for $80 million during the third quarter of 2022; repurchased an aggregate 10,617,862 shares for $424 million since the inception of the Share Repurchase Program through October 31, 2022
  • Returned $286 million to shareholders throughout the first three quarters of 2022, ~5% more than the free cash flow1 generated during the same period
  • Presented three new reservoirs to Carbon TerraVault JV
  • Favorable ruling in Kern County EIR Litigation
  • Shifted a rig to the Huntington Beach field for a 6 to 8 well program prioritizing available permits on hand

Third Quarter 2022 Highlights

Financial

  • Reported net income of $426 million, or $5.58 per diluted share. When adjusted for items analysts typically exclude from estimates including mark-to-market adjustments and gains on asset divestitures, the Company’s adjusted net income1 was $111 million, or $1.45 per diluted share
  • Generated net cash provided by operating activities of $235 million, adjusted EBITDAX1 of $234 million and free cash flow1 of $128 million
  • Ended the quarter with $358 million of cash on hand, an undrawn credit facility and $819 million of liquidity2
  • Increased available credit under our Reserve Based Lending Credit Facility by $50 million in the quarter and $110 million year to date, bringing our aggregate commitments to over $600 million

Operations

  • Produced an average of 92,000 net barrels of oil equivalent per day (Boe/d), including 55,000 barrels of oil per day (Bo/d), with E&P capital expenditures of $100 million during the quarter
  • Operated three drilling rigs in the San Joaquin Basin and two drilling rigs in the Los Angeles Basin; drilled 36 wells (42 online in 3Q22)
  • Operated 33 maintenance rigs

2022 Guidance and Capital Program Update3

CRC's capital program is dynamic in response to oil market volatility while focusing on oil production and strong liquidity and maximizing free cash flow. During the third quarter of 2022, CRC successfully managed the current market inflationary pressures and is narrowing its 2022 total capital program to the range of $380 to $400 million. CRC entered the fourth quarter of 2022 with four drilling rigs and expects to average three drilling rigs for the remainder of the year in its Elk Hills, Buena Vista, Wilmington and Huntington Beach fields as CRC repositions for its 2023 program.

This level of expected spending is consistent with CRC's strategy of investing up to 50% of its operating cash flow back into CRC's oil and gas operations. Following entry into the Carbon TerraVault JV with Brookfield, CRC anticipates that a portion of the operating cash flow previously designated for advancing decarbonization and other emission reducing projects may become available for other corporate purposes, such as shareholder returns and other strategic opportunities (see the summary of our Business Strategy in Part I, Item 1 & 2 – Business and Properties in CRC's 2021 Annual Report and see Part I, Item 2 – Management’s Discussion and Analysis of Financial Condition and Results of Operations, Carbon TerraVault Joint Venture in the Form 10-Q for the quarter ended September 30, 2022 for additional details on Carbon TerraVault JV).

The delay in the Kern County EIR litigation (see Part I, Item 2 – Management’s Discussion and Analysis of Financial Condition and Results of Operations, Regulatory Update in the Form 10-Q for the quarter ended September 30, 2022 for additional details on Kern County EIR) led to a change in CRC's drilling program which favors a higher natural gas to oil ratio. Therefore, CRC's 2022 oil production guidance is expected to be negatively impacted by approximately 1 MBo/d from this change. CRC's 2022 total production guidance remains consistent with previous expectations in the range of 91 to 94 MBoe/d.

CRC is raising its operating cost guidance to $760 to $790 million from $725 to $755 million primarily due to higher natural gas and electricity prices as well as some inflation and the change in well mix.


CRC GUIDANCE3

Total

2022E


CMB

2022E


E&P, Corp. & Other

2022E

Net Total Production (MBoe/d)

94 - 91


94 - 91

Net Oil Production (MBbl/d)

58 - 53


58 - 53

Operating Costs ($ millions)

$760 - $790


$760 - $790

CMB Expenses4 ($ millions)

$10 - $20


$10 - $20


Adjusted General and Administrative Expenses1 ($ millions)

$195 - $210


$10 - $15


$185 - $195

Total Capital ($ millions)

$380 - $400


$20 - $30


$360 - $370

Drilling & Completions

$232 - $235


$232 - $235

Workovers

$36 - $38


$36 - $38

Facilities

$63 - $65


$63 - $65

Corporate & Other

$29 - $32


$29 - $32

CMB

$20 - $30


$20 - $30


Adjusted EBITDAX1 ($ millions)

$835 - $890


($20) - ($35)


$870 -- $910

Free Cash Flow1 ($ millions)

$325 - $370


($40) - ($65)


$390 - $410

Supply Chain and Cost Inflation

Operating and capital costs in the oil and natural gas industry are heavily influenced by commodity prices which are typically cyclical in nature. Typically, suppliers will negotiate increases for drilling and completion, oilfield services, equipment and materials as prices for energy-related commodities and raw materials (such as steel, metals and chemicals) increase. Recent worldwide and U.S. supply chain issues, together with rising commodity prices and tight labor markets in the U.S., have created cost inflation during 2022. Cost inflation may continue into 2023 if rising energy prices result in factory constraints, placing certain items such as directional drilling components and materials that have a high energy input intensity in short supply. CRC has taken measures to limit the effects of the inflationary market by entering into contracts for materials and services with terms of one to three years. CRC has also taken steps to build its on-hand supply stock for items frequently used in its operations to address possible supply chain disruptions. Despite these efforts, CRC has experienced significant increased costs thus far in 2022 and anticipates additional increases in the cost of goods and services and wages in the company's operations during the remainder of 2022. These increases will factor into CRC's operating and capital costs and could also negatively impact its results of operations and cash flows in 2023 and beyond.

Third Quarter 2022 E&P Operational Results

In November 2020, the SEC amended Regulation S-K to, among other things, provide companies with the option to discuss material changes to results of operations between the current and immediately preceding quarter. CRC has elected to discuss its results of operations on a sequential-quarter basis. CRC believes this approach provides more meaningful and useful information to measure its performance from the immediately preceding quarter. In accordance with this final rule, CRC is not required to include a comparison of the current quarter and the same prior-year quarter.

Total daily net production for the three months ended September 30, 2022, compared to the three months ended June 30, 2022 increased by approximately 1 MBoe/d, or 1%. This increase is predominately a result of CRC's production-sharing contracts (PSCs), which positively impacted its net oil production in the three months ended September 30, 2022 by approximately 2 MBoe/d, compared to the three months ended June 30, 2022. This increase was partially offset by natural decline.

During the third quarter of 2022, CRC operated an average of three drilling rigs in the San Joaquin Basin and two drilling rigs in the Los Angeles Basin. During the quarter, CRC drilled 36 net wells and brought online 42 wells. See Attachment 3 for further information on CRC's production results by basin and Attachment 5 for further information on CRC's drilling activity.

Third Quarter 2022 Financial Results


3rd Quarter


2nd Quarter

($ and shares in millions, except per share amounts)

2022


2022


Statements of Operations:


Revenues


Total operating revenues

$

1,125


$

747


Operating Expenses


Total operating expenses


536


473


Gain on asset divestitures


2


4


Operating Income

$

591


$

278


Net Income

$

426


$

190


Net income per share - basic

$

5.75


$

2.48


Net income per share - diluted

$

5.58


$

2.41


Adjusted net income1

$

111


$

89


Adjusted net income1 per share - diluted

$

1.45


$

1.13


Weighted-average common shares outstanding - basic


74.1


76.7


Weighted-average common shares outstanding - diluted


76.3


78.8


Adjusted EBITDAX1

$

234


$

204


Review of Third Quarter 2022 Financial Results

Realized oil prices, excluding the effects of cash settlements on CRC's commodity derivative contracts, decreased by $14.36 per barrel from $112.32 per barrel in the second quarter of 2022 to $97.96 per barrel in the third quarter of 2022. Realized oil prices were lower in the third quarter of 2022 compared to the second quarter of 2022 due to slowing global economic activity and ongoing releases from the U.S. Strategic Petroleum Reserve.

Realized oil prices, including the effects of cash settlements on CRC's commodity derivative contracts, decreased by $0.72 from $63.17 in the second quarter of 2022 to $62.45 in the third quarter of 2022. See Attachment 4 for further information on prices.

Adjusted EBITDAX1 for the third quarter of 2022 was $234 million. See table below for the Company's net cash provided by operating activities, capital investments and free cash flow1 during the same periods.

FREE CASH FLOW1


Management uses free cash flow, which is defined by us as net cash provided by operating activities less capital investments, as a measure of liquidity. The following table presents a reconciliation of our net cash provided by operating activities to free cash flow. We supplemented our non-GAAP measure of free cash flow with free cash flow of our exploration and production and corporate items (Free Cash Flow for E&P, Corporate & Other) which we believe is a useful measure for investors to understand the results of our core oil and gas business. We define Free Cash Flow for E&P, Corporate & Other as consolidated free cash flow less results attributable to our carbon management business (CMB).


3rd Quarter


2nd Quarter

($ millions)

2022


2022


Net cash provided by operating activities

$

235


$

181


Capital investments


(107

)


(98

)

Free cash flow1

$

128


$

83


E&P, corporate & other free cash flow1

$

139


$

98


CMB free cash flow1

$

(11

)


$

(15

)

The following table presents key operating data for CRC's oil and gas operations, on a per BOE basis, for the periods presented below. Energy operating costs consist of purchased natural gas used to generate electricity for CRC's operations and steam for its steamfloods, purchased electricity and internal costs to generate electricity used in CRC's operations. Gas processing costs include costs associated with compression, maintenance and other activities needed to run CRC's gas processing facilities at Elk Hills. Non-energy operating costs equal total operating costs less energy operating costs and gas processing costs. Purchased natural gas used to generate steam in CRC's steamfloods was reclassified from non-energy operating costs to energy operating costs beginning in the third quarter of 2022. All prior periods have been updated to conform to this presentation.

OPERATING COSTS PER BOE


The reporting of our PSCs creates a difference between reported operating costs, which are for the full field, and reported volumes, which are only our net share, inflating the per barrel operating costs. The following table presents operating costs after adjusting for the excess costs attributable to PSCs.


3rd Quarter


2nd Quarter

($ per Boe)

2022


2022

Energy operating costs

$

10.96


9.33


Gas processing costs


0.49


0.54


Non-energy operating costs


13.82


13.05


Operating costs

$

25.27


$

22.92


Excess costs attributable to PSCs


(2.16

)


(2.58

)

Operating costs, excluding effects of PSCs (a)

$

23.11


$

20.34


(a) Operating costs, excluding effects of PSCs is a non-GAAP measure.

Energy operating costs for the third quarter of 2022 were $93 million, or $10.96 per Boe, which was an increase of $16 million or 21% from $77 million, or $9.33 per Boe, for the second quarter of 2022. This increase was primarily a result of higher electricity and natural gas prices.

Non-energy operating costs for the third quarter of 2022 were $117 million, or $13.82 per Boe, which was an increase of $8 million or 7% from $109 million, or $13.05 per Boe, for the second quarter of 2022. This increase was primarily a result of increased downhole maintenance activity.

Kern County Environmental Impact Report

CalGEM is California's primary regulator of the oil and natural gas industry on private and state lands, with additional oversight from the State Lands Commission’s administration of state surface and mineral interests. CalGEM currently requires an operator to identify the manner in which the California Environmental Quality Act (CEQA) has been satisfied prior to issuing various state permits, typically through either an environmental review or an exemption by a state or local agency. In Kern County, this requirement has typically been satisfied by complying with the local oil and gas ordinance which was supported by an Environmental Impact Report (EIR) certified by the Kern County Board of Supervisors in 2015.

A group of petitioners challenged the EIR and on February 25, 2020, a California Appellate Court (the Court) issued a ruling that required Kern County to decertify the EIR and set aside the amended Zoning Ordinance. In response, Kern County prepared, circulated and certified a supplementary recirculated EIR (Supplemental EIR) to address the ruling from the Court and, in April 2021, resumed issuing local permits relying on the Supplemental EIR. However, on October 22, 2021, Kern County was ordered to cease reviewing and approving oil and gas permits until the trial court determined that the Zoning Ordinance complies with CEQA requirements. On May 26, 2022, a hearing was held in Kern County and the Court ruled that Kern County’s local permitting system must cease until the trial court verified that the noted deficiencies had been remedied and that the remedies satisfied the concerns raised by the Court. In October 2022, the trial court ruled that the Supplemental EIR was not decertified but ordered Kern County to address four discrete issues before suspension of the local permitting could be lifted, which, once resolved, would bring the Supplemental EIR into compliance with applicable laws. The four discrete issues included requirements for the removal of offsite legacy equipment to mitigate agricultural land use impacts, revising emission reduction requirements to address particulate matter, the establishment of a drinking water grant fund for disadvantaged communities in Kern County, and updating the local oil and gas ordinance to reflect these requirements. The Kern County Board of Supervisors approved these changes in August 2022. On October 12, 2022, Kern County submitted notice with the trial court of these changes and on November 2, 2022 the trial court lifted the order preventing reliance on the local permitting system. This ruling is subject to further appeal by the petitioners and there is still some potential for future disruptions to obtaining permits in Kern County until any such appeals are resolved.

Sustainability Update

In August 2022, CRC published its 2021 Sustainability Report. The report provides an overview of CRC’s continuous progress on its sustainability efforts in environmental, social and governance (ESG) performance as the company advances its commitment to the energy transition and decarbonization of local economies. Building off its 2020 Sustainability Update and 2021 Leadership Level Ranking of A- by CDP, CRC's 2021 Sustainability Report references Sustainability Accounting Standards Board (SASB), Global Reporting Initiative (GRI) and International Petroleum Industry Environmental Conservation Association (IPIECA) standards.

Highlights and achievements from CRC’s 2021 Sustainability Report include:

  • Announced 2045 Full-Scope Net Zero Goal and updated and expanded ESG goals on methane emissions, freshwater usage, community giving, diversity in leadership and linked ESG performance to executive pay
  • Hired first Chief Sustainability Officer
  • Established Project Management Office of Asset Retirement Obligations (ARO)
  • Advanced CRC's Carbon Management Business including its Carbon TerraVault carbon capture and storage (CCS) projects, and CalCapture CCS+ project
  • Continued to be a net supplier of both fresh water and electricity
  • Continued to rank among the safest companies in the United States; workforce achieved a better safety performance rating than many non-industrial sectors in 2021
  • Earned 26 National Safety Achievement Awards in each of its operating areas and company wide in 2021 for its performance

For more information about CRC’s sustainability efforts and to download the full length and summary versions of the 2021 Sustainability Report, please visit crc.com/esg.

Balance Sheet and Liquidity Update

CRC's aggregate commitment under the Revolving Credit Facility was $602 million as of September 30, 2022. The borrowing base for the Revolving Credit Facility is redetermined semi-annually and was reaffirmed at $1.2 billion on October 25, 2022.

As of September 30, 2022, CRC had liquidity of $819 million, which consisted of $358 million in unrestricted cash and $461 million of available borrowing capacity under its Revolving Credit Facility which is net of $141 million of letters of credit.

Acquisitions and Divestitures

During the three and nine months ended September 30, 2022, CRC recorded a net gain of $2 million and $60 million, respectively, related to the sale of certain Ventura basin assets and its Lost Hills transaction. The amount recognized in the three and nine months ended September 30, 2022 included $2 million and $6 million, respectively, of additional earn-out consideration on Ventura basin divestitures that occurred in the second half of 2021 and the first half of 2022. In addition, CRC also received $2 million to secure the performance of well abandonment obligations on divested properties which it expects to return to the purchaser once the work has been completed. As a result, CRC recorded a liability of $2 million included as accrued liabilities on its condensed consolidated balance sheet as of September 30, 2022. See Part II, Item 8 – Financial Statements and Supplementary Data, Note 3 Divestitures and Acquisitions in CRC's 2021 Annual Report for additional information on the Ventura basin transactions.

The closing of the sale of CRC's remaining assets in the Ventura basin is subject to final approval from the State Lands Commission, which CRC expects to receive prior to the end of the first quarter of 2023. These remaining assets, consisting of property, plant and equipment and associated asset retirement obligations, are classified as held for sale on CRC's condensed consolidated balance sheet as of September 30, 2022.

Shareholder Return Strategy

CRC continues to prioritize shareholder returns and dedicates a portion of its operating cash flow to shareholders. In light of this strategy, CRC's Board of Directors has increased its Share Repurchase Program by $200 million to $850 million and extended the program through December 31, 2023. Adjusting for this increase, there was approximately $426 million of capacity under CRC's Share Repurchase Program as of October 31, 2022.

During the third quarter of 2022, CRC repurchased 1.9 million shares of its common stock for $80 million. Since the inception of Share Repurchase Program through October 31, 2022, CRC has repurchased 10.6 million shares for $424 million at an average price of $39.89 per share, resulting in the repurchase of approximately 13% of the shares that CRC had at its emergence from bankruptcy.

On November 2, 2022, CRC's Board of Directors declared a quarterly cash dividend of $0.2825 per share of common stock. The dividend is payable to shareholders of record on December 1, 2022, and will be paid on December 16, 2022.

Through October 31, 2022, CRC has returned $476 million of cash to shareholders, including $52 million through quarterly dividends and $424 million through share repurchases.

Upcoming Investor Conference Participation

CRC's executives will be participating in the following events in November and December of 2022:

  • Furey Research Hidden Gems Conference on November 7 - 8, 2022, Virtual
  • Bank of America Securities Global Energy Conference on November 16 - 17 in Miami, FL
  • Goldman Sachs Carbonomics Conference on November 29 in London, UK
  • Capital One Securities Energy Conference on December 7 in Houston, TX
  • StoneX Financial Natural Resources Day on December 8 in New York, NY

CRC’s presentation materials will be available the day of the events on the Events and Presentations page in the Investor Relations section on www.crc.com.

Conference Call Details

To participate in the conference call scheduled for November 3, 2022, at 1:00 p.m. Eastern Time, please dial (877) 328-5505 (International calls please dial +1 (412) 317-5421) or access via webcast at www.crc.com 15 minutes prior to the scheduled start time to register. Participants may also pre-register for the conference call at to https://dpregister.com/sreg/10171364/f48809c260. A digital replay of the conference call will be archived for approximately 90 days and supplemental slides for the conference call will be available online in the Investor Relations section of www.crc.com.

1 See Attachment 2 for the non-GAAP financial measures of adjusted EBITDAX, operating costs per BOE (excluding effects of PSCs), adjusted net income (loss), adjusted net income (loss) per share - basic and diluted, free cash flow and free cash flow, after special items including reconciliations to their most directly comparable GAAP measure, where applicable. For the full year 2022 estimates of the non-GAAP measures of adjusted EBITDAX and free cash flow, including reconciliations to their most directly comparable GAAP measure, see Attachment 7.

2 Calculated as $358 million of available cash plus $602 million of capacity on CRC's Revolving Credit Facility less $141 million in outstanding letters of credit.

3 Current guidance assumes a 2022 Brent price of $99.75 per barrel of oil, NGL realizations as a percentage of Brent consistent with prior years and a NYMEX gas price of $6.47 per mcf. CRC's share of production under PSC contracts decreases when commodity prices rise and increases when prices fall.

4 CMB Expenses include start-up expenditures.


Contacts

Joanna Park (Investor Relations)
818-661-3731
This email address is being protected from spambots. You need JavaScript enabled to view it.

Richard Venn (Media)
818-661-6014
This email address is being protected from spambots. You need JavaScript enabled to view it.


Read full story here

Interactive workers compensation tool helps promote holistic recovery

HARTFORD, Conn.--(BUSINESS WIRE)--The Travelers Companies, Inc. (NYSE: TRV), the country’s largest workers compensation insurer, today announced the launch of Wysa for Return to Work – an app designed to promote the mental health of injured employees and facilitate a more holistic recovery. The app was created in partnership with Wysa, a provider of mental health support solutions driven by artificial intelligence.


“Factors unrelated to an individual’s injury, such as fear, unrealistic expectations, lack of sleep or minimal social support, can hinder the recovery process,” said Dr. Marcos Iglesias, Chief Medical Director at Travelers. “Helping injured employees bounce back requires an approach that addresses an individual’s physical and mental health challenges, and we’re pleased to offer another tool that supports the total well-being of our customers’ employees.”

According to Travelers workers compensation claim data, more than 40% of employees who have missed workdays due to injury have experienced a psychosocial barrier to recovery. The Wysa for Return to Work app helps users build mental resilience skills that can assist in overcoming those barriers. The app responds to what users communicate through a secure, anonymous, texting-style platform, and offers strategies that include cognitive behavioral techniques, guided meditation and breathing exercises.

The new app is accessible to injured employees who indicate one or more psychosocial barriers to their recovery during conversations with a Travelers nurse or claim professional. Early pilot results show that injured employees using Wysa for Return to Work have reduced the number of missed workdays by approximately one-third, compared to those not using the app.

Travelers utilizes a range of workers compensation services to help expedite recovery, including:

  • The Virtual Visit tool, which enables nurses and claim professionals to conduct real-time video chats with employers, medical providers and injured employees to discuss matters pertaining to the recovery process;
  • MyTravelers® for Injured Employees, a secure, web-based tool that helps individuals navigate the workers compensation claim process;
  • The Early Severity Predictor® model, which helps identify which injured employees are most at risk for chronic pain; and
  • The ConciergeCLAIM® Nurse program, which also helps injured employees with the workers compensation process through a one-on-one connection with a nurse.

For more information on workers compensation products and services from Travelers, visit Travelers.com.

About Travelers

The Travelers Companies, Inc. (NYSE: TRV) is a leading provider of property casualty insurance for auto, home and business. A component of the Dow Jones Industrial Average, Travelers has approximately 30,000 employees and generated revenues of approximately $35 billion in 2021. For more information, visit Travelers.com.


Contacts

Media:
Kate Thermansen, 860-954-1789
This email address is being protected from spambots. You need JavaScript enabled to view it.

LIBERTY LAKE, Wash.--(BUSINESS WIRE)--Itron, Inc. (NASDAQ:ITRI) announced today financial results for its third quarter ended Sept. 30, 2022. Key results for the quarter include (compared with the third quarter of 2021):


  • Revenue of $421 million, compared with $487 million;
  • Gross margin of 28.5%; compared with 27.7%;
  • GAAP net income of $4 million, compared with a loss of $(2) million;
  • GAAP diluted earnings per share (EPS) of $0.09, compared with a loss per share of $(0.04);
  • Non-GAAP diluted EPS of $0.23, compared with $0.21;
  • Adjusted EBITDA of $24 million, compared with $26 million;
  • Free cash flow of $11 million, consistent with prior year; and
  • Total backlog of $4.2 billion, compared with $3.4 billion.

"In the third quarter of 2022, we saw continued strong market demand and had another robust quarter of bookings, which pushed our total backlog to new record levels." said Tom Deitrich, Itron's president and chief executive officer. "However, semiconductor supply constraints continued to slow the conversion of backlog into revenue which limited our operating results."

Summary of Third Quarter Consolidated Financial Results
(All comparisons made are against the prior year period unless otherwise noted)

Revenue

Total third quarter revenue decreased 14% to $421 million, or 9%, excluding the impact of changes in foreign currency exchange rates. The decrease was primarily due to the strategic sale and exit of certain product lines in our Device Solutions business, along with the continued impact of component shortages on our Networked Solutions business limiting our ability to meet customer demand.

Device Solutions revenue declined 38%, Networked Solutions revenue decreased 2%, and Outcomes revenue decreased 5% primarily due to the continuing decline of our prepay business in EMEA.

Gross Margin

Consolidated company gross margin of 28.5% increased 80 basis points from the prior year, primarily due to favorable mix, partially offset by inefficiencies related to component shortages.

Operating Expenses and Operating Income (Loss)

GAAP operating expenses of $113 million decreased $18 million from the prior year primarily due to lower sales, general and administrative, and product development expenses. Non-GAAP operating expenses of $105 million decreased $13 million from the prior year primarily due to lower sales, general and administrative, and product development expenses.

GAAP operating income of $7 million was $3 million higher than the prior year primarily due to lower operating expenses, partially offset by lower gross profit. Non-GAAP operating income of $15 million was $2 million lower than prior year.

Net Income (Loss) and Earnings (Loss) per Share

Net income attributable to Itron, Inc. for the quarter was $4 million, or $0.09 per diluted share, compared with a loss of $(2) million, or $(0.04) per share in 2021. The increase was driven by higher GAAP operating income and lower interest and other expense.

Non-GAAP net income, which excludes certain charges including amortization of intangible assets, amortization of debt placement fees, debt extinguishment, restructuring, loss on sale of business, strategic initiatives, currency translation write-off, acquisition and integration, goodwill impairment, and the income tax effect of those adjustments, was $11 million, or $0.23 per diluted share, compared with $9 million, or $0.21 per diluted share, in 2021. The higher year-over-year results were primarily due to lower operating expenses and a lower effective tax rate.

Cash Flow

Net cash provided by operating activities was $15 million in the third quarter compared with $18 million in the same quarter of 2021. Free cash flow was $11 million in the third quarter consistent with prior year.

Other Measures

Total backlog was $4.2 billion and 12-month backlog was $1.6 billion, compared with $3.4 billion and $1.4 billion, respectively, in the prior year. Bookings in the quarter totaled $578 million.

Operational Insights and Q4 2022 Outlook

During the third quarter, we were hampered by unanticipated supplier decommitments, component deliveries below expectations, and the non-linear timing of key components arriving at our factories. While we were receiving more positive signals from suppliers, their deliveries did not meet the promised performance, resulting in lower-than-expected company results.

Recent discussions with key suppliers leave us cautiously optimistic about supply availability improving over time. However, we anticipate this volatile supply environment will continue in the fourth quarter. As a result, we are providing a Q4 2022 revenue and earnings outlook. Our expectations for the fourth quarter of 2022 are revenue in a range of $420 million to $460 million and non-GAAP EPS between $0.00 and $0.15.

Earnings Conference Call

Itron will host a conference call to discuss the financial results and guidance contained in this release at 10 a.m. EDT on Nov. 3, 2022. The call will be webcast in a listen-only mode. Webcast information and conference call materials will be made available 10 minutes before the start of the call and will be accessible on Itron’s website at http://investors.itron.com/events.cfm. A replay of the audio webcast will be made available at http://investors.itron.com/events.cfm. A telephone replay of the conference call will be available through Nov. 8, 2022. To access the telephone replay, dial 888-203-1112 or 719-457-0820 and enter passcode 6390616.

About Itron

Itron® enables utilities and cities to safely, securely and reliably deliver critical infrastructure services to communities in more than 100 countries. Our portfolio of smart networks, software, services, meters and sensors helps our customers better manage electricity, gas and water resources for the people they serve. By working with our customers to ensure their success, we help improve the quality of life, ensure the safety and promote the well-being of millions of people around the globe. Itron is dedicated to creating a more resourceful world. Join us: www.itron.com.

Itron® is a registered trademark of Itron, Inc. All third-party trademarks are property of their respective owners and any usage herein does not suggest or imply any relationship between Itron and the third party unless expressly stated.

Cautionary Note Regarding Forward Looking Statements

This release contains, and our officers and representatives may from time to time make, "forward-looking statements" within the meaning of the safe harbor provisions of the U.S. Private Securities Litigation Reform Act of 1995. Forward-looking statements are neither historical factors nor assurances of future performance. These statements are based on our expectations about, among others, revenues, operations, financial performance, earnings, liquidity, earnings per share, cash flows and restructuring activities including headcount reductions and other cost savings initiatives. This document reflects our current strategy, plans and expectations and is based on information currently available as of the date of this release. When we use words such as "expect", "intend", "anticipate", "believe", "plan", "goal", "seek", "project", "estimate", "future", "strategy", "objective", "may", "likely", "should", "will", "will continue", and similar expressions, including related to future periods, they are intended to identify forward-looking statements. Forward-looking statements rely on a number of assumptions and estimates. Although we believe the estimates and assumptions upon which these forward-looking statements are based are reasonable, any of these estimates or assumptions could prove to be inaccurate and the forward-looking statements based on these estimates and assumptions could be incorrect. Our operations involve risks and uncertainties, many of which are outside our control, and any one of which, or a combination of which, could materially affect our results of operations and whether the forward-looking statements ultimately prove to be correct. Actual results and trends in the future may differ materially from those suggested or implied by the forward-looking statements depending on a variety of factors. Therefore, you should not rely on any of these forward-looking statements. Some of the factors that we believe could affect our results include our ability to execute on our restructuring plans, our ability to achieve estimated cost savings, the rate and timing of customer demand for our products, rescheduling of current customer orders, changes in estimated liabilities for product warranties, adverse impacts of litigation, changes in laws and regulations, our dependence on new product development and intellectual property, future acquisitions, changes in estimates for stock-based and bonus compensation, increasing volatility in foreign exchange rates, international business risks, uncertainties caused by adverse economic conditions, including, without limitation those resulting from extraordinary events or circumstances such as the COVID-19 pandemic and other factors that are more fully described in Part I, Item 1A: Risk Factors included in our 2021 Annual Report and other reports on file with the Securities and Exchange Commission (SEC). We undertake no obligation to update or revise any forward-looking statement, whether written or oral.

Non-GAAP Financial Information

To supplement our consolidated financial statements, which are prepared in accordance with accounting principles generally accepted in the United States (GAAP), we use certain adjusted or non-GAAP financial measures, including non-GAAP operating expense, non-GAAP operating income, non-GAAP net income, non-GAAP diluted earnings per share (EPS), adjusted EBITDA, constant currency, and free cash flow. We provide these non-GAAP financial measures because we believe they provide greater transparency and represent supplemental information used by management in its financial and operational decision making. We exclude certain costs in our non-GAAP financial measures as we believe the net result is a measure of our core business. We believe these measures facilitate operating performance comparisons from period to period by eliminating potential differences caused by the existence and timing of certain expense items that would not otherwise be apparent on a GAAP basis. Non-GAAP performance measures should be considered in addition to, and not as a substitute for, results prepared in accordance with GAAP. We strongly encourage investors and shareholders to review our financial statements and publicly-filed reports in their entirety and not to rely on any single financial measure. Our non-GAAP financial measures may be different from those reported by other companies.

ITRON, INC.

CONSOLIDATED STATEMENTS OF OPERATIONS


(Unaudited, in thousands, except per share data)


Three Months Ended
September 30,

Nine Months Ended
September 30,


2022

2021

2022

2021

Revenues


Product revenues

$

347,791


$

410,947


$

1,107,499


$

1,265,470


Service revenues


73,069


76,002


220,574


230,465


Total revenues


420,860


486,949


1,328,073


1,495,935


Cost of revenues


Product cost of revenues


258,541


306,168


818,639


908,923


Service cost of revenues


42,257


45,818


128,043


135,130


Total cost of revenues


300,798


351,986


946,682


1,044,053


Gross profit


120,062


134,963


381,391


451,882


Operating expenses


Sales, general and administrative


63,446


71,838


212,724


221,974


Research and development


43,820


46,889


138,471


147,379


Amortization of intangible assets


6,413


8,944


19,451


26,914


Restructuring


(1,272

)


958


(11,097

)


(830

)

Loss on sale of business


767


2,171


3,182


28,274


Goodwill impairment


38,480


Total operating expenses


113,174


130,800


401,211


423,711


Operating income (loss)


6,888


4,163


(19,820

)


28,171


Other income (expense)


Interest income


801


352


1,367


1,326


Interest expense


(1,679

)


(2,628

)


(4,931

)


(27,107

)

Other income (expense), net


(1,065

)


(1,761

)


(3,140

)


(16,684

)

Total other income (expense)


(1,943

)


(4,037

)


(6,704

)


(42,465

)


Income (loss) before income taxes


4,945


126


(26,524

)


(14,294

)

Income tax provision


(473

)


(1,136

)


(4,973

)


(5,581

)

Net income (loss)


4,472


(1,010

)


(31,497

)


(19,875

)

Net income attributable to noncontrolling interests


355


859


447


2,514


Net income (loss) attributable to Itron, Inc.

$

4,117


$

(1,869

)

$

(31,944

)

$

(22,389

)


Net income (loss) per common share - Basic

$

0.09


$

(0.04

)

$

(0.71

)

$

(0.51

)

Net income (loss) per common share - Diluted

$

0.09


$

(0.04

)

$

(0.71

)

$

(0.51

)


Weighted average common shares outstanding - Basic


45,139


45,240


45,075


43,983


Weighted average common shares outstanding - Diluted


45,330


45,240


45,075


43,983


ITRON, INC.

SEGMENT INFORMATION


(Unaudited, in thousands)


Three Months Ended
September 30,

Nine Months Ended
September 30,


2022

2021

2022

2021

Product revenues


Device Solutions

$

92,893


$

149,830


$

334,212


$

480,808


Networked Solutions


240,498


242,527


731,358


736,397


Outcomes


14,400


18,590


41,929


48,265


Total Company

$

347,791


$

410,947


$

1,107,499


$

1,265,470


Service revenues


Device Solutions

$

1,110


$

2,404


$

4,166


$

7,174


Networked Solutions


29,374


31,971


86,796


91,473


Outcomes


42,585


41,627


129,612


131,818


Total Company

$

73,069


$

76,002


$

220,574


$

230,465


Total revenues


Device Solutions

$

94,003


$

152,234


$

338,378


$

487,982


Networked Solutions


269,872


274,498


818,154


827,870


Outcomes


56,985


60,217


171,541


180,083


Total Company

$

420,860


$

486,949


$

1,328,073


$

1,495,935


Gross profit


Device Solutions

$

14,805


$

22,480


$

50,489


$

85,228


Networked Solutions


81,895


89,915


263,155


298,627


Outcomes


23,362


22,568


67,747


68,027


Total Company

$

120,062


$

134,963


$

381,391


$

451,882


Operating income (loss)


Device Solutions

$

7,066


$

12,095


$

24,103


$

53,784


Networked Solutions


54,640


61,150


177,929


205,071


Outcomes


11,339


11,774


28,789


34,647


Corporate unallocated


(66,157

)


(80,856

)


(250,641

)


(265,331

)

Total Company

$

6,888


$

4,163


$

(19,820

)

$

28,171


ITRON, INC.

CONSOLIDATED BALANCE SHEETS


(Unaudited, in thousands)

September 30, 2022

December 31, 2021

ASSETS


Current assets


Cash and cash equivalents

$

215,413


$

162,579


Accounts receivable, net


266,669


298,459


Inventories


203,612


165,799


Other current assets


122,948


123,092


Total current assets


808,642


749,929


Property, plant, and equipment, net


138,768


163,184


Deferred tax assets, net


188,728


181,472


Other long-term assets


44,433


42,178


Operating lease right-of-use assets, net


54,814


65,523


Intangible assets, net


70,346


92,529


Goodwill


1,011,051


1,098,975


Total assets

$

2,316,782


$

2,393,790


LIABILITIES AND EQUITY


Current liabilities


Accounts payable

$

235,812


$

193,129


Other current liabilities


46,555


81,253


Wages and benefits payable


77,613


113,532


Taxes payable


13,663


12,208


Current portion of warranty


17,943


18,406


Unearned revenue


110,531


82,816


Total current liabilities


502,117


501,344


Long-term debt, net


451,947


450,228


Long-term warranty


7,515


13,616


Pension benefit obligation


71,111


87,863


Deferred tax liabilities, net


1,723


2,000


Operating lease liabilities


47,147


57,314


Other long-term obligations


118,049


138,666


Total liabilities


1,199,609


1,251,031


Equity


Common stock


1,783,193


1,779,775


Accumulated other comprehensive loss, net


(141,821

)


(148,098

)

Accumulated deficit


(547,544

)


(515,600

)

Total Itron, Inc. shareholders' equity


1,093,828


1,116,077


Noncontrolling interests


23,345


26,682


Total equity


1,117,173


1,142,759


Total liabilities and equity

$

2,316,782


$

2,393,790


ITRON, INC.

CONSOLIDATED STATEMENTS OF CASH FLOWS


(Unaudited, in thousands)

Nine Months Ended September 30,


2022

2021

Operating activities


Net loss

$

(31,497

)

$

(19,875

)

Adjustments to reconcile net loss to net cash provided by operating activities:


Depreciation and amortization of intangible assets


50,612


64,252


Non-cash operating lease expense


12,250


12,962


Stock-based compensation


17,416


18,251


Amortization of prepaid debt fees


2,610


17,383


Deferred taxes, net


(6,428

)


(5,170

)

Loss on sale of business


3,182


28,274


Loss on extinguishment of debt, net


10,000


Goodwill impairment


38,480


Restructuring, non-cash


(879

)


951


Other adjustments, net


2,148


3,720


Changes in operating assets and liabilities, net of acquisition and sale of business:


Accounts receivable


12,270


40,624


Inventories


(48,377

)


2,150


Other current assets


(15,907

)


26,072


Other long-term assets


(7,897

)


5,058


Accounts payable, other current liabilities, and taxes payable


42,550


(27,124

)

Wages and benefits payable


(30,877

)


14,110


Unearned revenue


32,151


(13,158

)

Warranty


(5,031

)


(5,969

)

Other operating, net


(29,246

)


(31,364

)

Net cash provided by operating activities


37,530


141,147


Investing activities


Net proceeds related to the sale of business


55,933


3,142


Acquisitions of property, plant, and equipment


(14,886

)


(27,781

)

Business acquisitions, net of cash and cash equivalents acquired


23


Other investing, net


2,424


2,820


Net cash provided by (used in) investing activities


43,494


(21,819

)


Financing activities


Proceeds from borrowings


460,000


Payments on debt


(946,094

)

Issuance of common stock


2,631


4,351


Proceeds from common stock offering


389,419


Proceeds from sale of warrants


45,349


Purchases of convertible note hedge contracts


(84,139

)

Repurchase of common stock


(16,972

)


Prepaid debt fees


(697

)


(12,021

)

Other financing, net


(4,358

)


6,327


Net cash used in financing activities


(19,396

)


(136,808

)


Effect of foreign exchange rate changes on cash and cash equivalents


(8,794

)


(762

)

Increase (decrease) in cash and cash equivalents


52,834


(18,242

)

Cash and cash equivalents at beginning of period


162,579


206,933


Cash and cash equivalents at end of period

$

215,413


$

188,691


About Non-GAAP Financial Measures

To supplement our consolidated financial statements, which are prepared in accordance with GAAP, we use certain non-GAAP financial measures, including non-GAAP operating expense, non-GAAP operating income, non-GAAP net income, non-GAAP diluted EPS, adjusted EBITDA, free cash flow, and constant currency. The presentation of this financial information is not intended to be considered in isolation or as a substitute for, or superior to, the financial information prepared and presented in accordance with GAAP, and other companies may define such measures differently. For a reconciliation of each non-GAAP measure to the most comparable financial measure prepared and presented in accordance with GAAP, please see the table captioned Reconciliations of Non-GAAP Financial Measures to the Most Directly Comparable GAAP Financial Measures.

We use these non-GAAP financial measures for financial and operational decision making and/or as a means for determining executive compensation. Management believes that these non-GAAP financial measures provide meaningful supplemental information regarding our performance and ability to service debt by excluding certain expenses that may not be indicative of our recurring core operating results. These non-GAAP financial measures facilitate management's internal comparisons to our historical performance, as well as comparisons to our competitors' operating results. Our executive compensation plans exclude non-cash charges related to amortization of intangibles and certain discrete cash and non-cash charges, such as acquisition and integration related expenses, loss on sale of business, strategic initiative expenses, Russian currency translation write-off, goodwill impairment, or restructuring charges. We believe that both management and investors benefit from referring to these non-GAAP financial measures in assessing our performance and when planning, forecasting and analyzing future periods. We believe these non-GAAP financial measures are useful to investors because they provide greater transparency with respect to key metrics used by management in its financial and operational decision making and because they are used by our institutional investors and the analyst community to analyze the health of our business.

Non-GAAP operating expenses and non-GAAP operating income – We define non-GAAP operating expenses as operating expenses excluding certain expenses related to the amortization of intangible assets, restructuring, loss on sale of business, strategic initiative, Russian currency translation write-off, goodwill impairment, and acquisition and integration. We define non-GAAP operating income as operating income excluding the expenses related to the amortization of intangible assets, restructuring, loss on sale of business, strategic initiative, Russian currency translation write-off, goodwill impairment, and acquisition and integration. Acquisition and integration related expenses include costs, which are incurred to affect and integrate business combinations, such as professional fees, certain employee retention and salaries related to integration, severances, contract terminations, travel costs related to knowledge transfer, system conversion costs, and asset impairment charges. We consider these non-GAAP financial measures to be useful metrics for management and investors because they exclude the effect of expenses that are related to acquisitions and restructuring projects. By excluding these expenses, we believe that it is easier for management and investors to compare our financial results over multiple periods and analyze trends in our operations. For example, in certain periods, expenses related to amortization of intangible assets may decrease, which would improve GAAP operating margins, yet the improvement in GAAP operating margins due to this lower expense is not necessarily reflective of an improvement in our core business. There are some limitations related to the use of non-GAAP operating expenses and non-GAAP operating income versus operating expenses and operating income calculated in accordance with GAAP. We compensate for these limitations by providing specific information about the GAAP amounts excluded from non-GAAP operating expense and non-GAAP operating income and evaluating non-GAAP operating expense and non-GAAP operating income together with GAAP operating expense and operating income.

Non-GAAP net income and non-GAAP diluted EPS – We define non-GAAP net income as net income (loss) attributable to Itron, Inc. excluding the expenses associated with amortization of intangible assets, amortization of debt placement fees, debt extinguishment, restructuring, loss on sale of business, strategic initiative, Russian currency translation write-off, acquisition and integration, goodwill impairment, and the tax effect of excluding these expenses.


Contacts

For additional information, contact:

Itron, Inc.
Kenneth P. Gianella
Vice President, Investor Relations
(669) 770-4643

David Means
Director, Investor Relations
(737) 242-8448


Read full story here

OMAHA, Neb.--(BUSINESS WIRE)--Valmont Industries, Inc. (NYSE: VMI), a global leader that provides vital infrastructure and advances agricultural productivity while driving innovation through technology, is partnering with Omaha Public Power District (OPPD) for its sustainability efforts as part of the district’s Power with Purpose (PwP) initiative.


PwP will add 400-600 megawatts (MW) of utility-scale solar and ~600 MW of natural gas generation, providing the needed generation capacity to power growing communities while also contributing to OPPD’s goal of net-zero carbon production by 2050.

Valmont has made remarkable strides to minimize our environmental impact in Omaha and around the world while creating increasingly efficient and sustainable solutions for our customers,” says Valmont group president Infrastructure, Aaron Schapper. “Conserving resources and improving life is our tagline and purpose here at Valmont and it’s at the forefront of all we do. OPPD’s recognition for our efforts are gratifying and appreciated.”

OPPD and Valmont Utility, a Valmont company, are working together to build transmission lines to connect the Turtle Creek Station in Sarpy County and Standing Bear Lake Station in Douglas County to the electric grid. Valmont is engineering 263 total structures with more than 2,200 structural components to support these lines. This project showcases design ingenuity and innovation, as well as customized manufacturing to complement the surrounding environment.

The solar and natural gas assets we’re building support OPPD's unwavering mission to provide affordable, reliable and environmentally sensitive energy services to customers,” says Lisa Olson, vice president of Public Affairs for OPPD. “We’re proud to lead the way we power the future in this ever-changing and evolving energy landscape.”

Valmont is no stranger to renewable energy as we’ve been developing reliable and sustainable infrastructure within the industry for over 40 years,” says Valmont Utility president Chris Colwell. “We offer industry-leading renewable energy solutions as part of our efforts to conserve resources in all aspects of our business. The OPPD project provides the ability to increase load growth, which requires grid resiliency for uninterrupted power. We are also addressing heightened demand for renewable energy sources and the need to support investments in the electrical grid. Through these efforts we are hardening the grid while softening climate impact through the strength of our utility structures.”

Schapper stated, “We continue to assess the environmental footprint of our manufacturing facilities, and I believe these actions reinforce our place as a leading provider for sustainable infrastructure and agriculture solutions as it relates to solar energy.”

Valmont has focused on sustainability for more than 75 years and elevated its efforts in recent years. For example, Valmont’s conservation efforts include reducing carbon emissions by more than 18,000 metric tons since 2018 and is currently beating their carbon emission target by 24%.

As part of the company’s carbon mitigation strategy, Valmont has continued to expand their global footprint providing renewable energy. Leveraging the strength of its worldwide presence, the company has added to its portfolio to provide solar energy through Valmont Solar and also through Ag Solar by Valley as a viable resource to power agricultural operations.

Read more about Power with Purpose at OPPDCommunityConnect.com and to learn more about the commitment to sustainability from Valmont, click here.

About Valmont Industries, Inc.

For over 75 years, Valmont® has been a global leader in creating vital infrastructure and advancing agricultural productivity. Today, we remain committed to doing more with less by innovating through technology. Learn more about how we’re Conserving Resources. Improving Life.® at valmont.com.

OPPD’s Mission

To provide affordable, reliable, and environmentally sensitive energy services to our customers.

For additional information on OPPD, please visit OPPD.com.


Contacts

Jennifer Kros-Dorfmeyer, Valmont Industries
This email address is being protected from spambots. You need JavaScript enabled to view it.

ALMATY, Kazakhstan--(BUSINESS WIRE)--The Eurasian Development Bank (EDB) held consultations with the Asian Development Bank (ADB) on cooperation in energy and infrastructure projects in Central Asia and Armenia. The EDB also discussed with Export-Import Bank of India (EXIM) the scope for using national currencies in international settlements.

Nikolai Podguzov, Chairman of the EDB Management Board, and Shixin Chen, Vice President of the ADB, met in Manila, Philippines, to discuss cooperation on the sidelines of the 45th Annual Meeting of the Association of Development Financing Institutions in Asia and the Pacific (ADFIAP).

Nikolai Podguzov highlighted the Bank's experience in implementing common projects with multilateral development institutions. The ADB operates in four of the six EDB member countries: Armenia, Kazakhstan, Kyrgyzstan and Tajikistan.

“We look forward to opportunities to work together with multilateral development banks to support infrastructure projects in Central Asia and Armenia. Given the ADB’s experience and expertise, and the EDB’s experience in working on significant infrastructure projects in cooperation with multilateral development institutions, we would like to propose that we participate in syndicated financing for energy and infrastructure projects,” said Nikolai Podguzov.

During the meeting, the ADB expressed interest in exploring further the implementation of the EDB’s key investment mega-projects such as the Eurasian Commodity Distribution Network and the Eurasian Transport Network, which includes the international North–South and Europe–Western China transport corridors.

The delegations noted that the financial institutions have similar targets for the next strategic period to promote the sustainable development of their member countries and to increase the share of ESG projects in their investment portfolios.

“Our institutions could cooperate in a number of areas that have a major impact on the development of the Eurasian countries. These include climate change and a green economy as well as fostering sustainable, balanced and inclusive growth and the development of entrepreneurship and the private sector. We believe that the priority areas for cooperation are the joint implementation of sustainable development projects in the fields of renewable energy, energy efficiency, infrastructure, and water management. Other significant activities include consultations, experience sharing and joint research,” Nikolai Podguzov added.

Separately, Nikolai Podguzov met Shri Ramesh, Deputy Managing Director of India EXIM Bank, on the sidelines of the ADFIAP meeting. The parties discussed the potential use of national currencies in international settlements as well as financial mechanisms to support exports and imports of the EDB’s member countries. Another item on the agenda was the research conducted by the two institutes and the possibility of launching joint studies.

Additional Information:

The Eurasian Development Bank (EDB) is an international financial institution investing in Eurasia. For more than 16 years, the Bank has worked to strengthen and expand economic ties and foster comprehensive development in its member countries. The EDB's charter capital totals US $7 billion. Its portfolio consists principally of projects with an integration effect in transport infrastructure, digital systems, green energy, agriculture, manufacturing, and mechanical engineering. The Bank adheres to the UN Sustainable Development Goals and ESG principles in its operations.


Contacts

The EDB Media Centre:
This email address is being protected from spambots. You need JavaScript enabled to view it.
www.eabr.org

Funding to expand operations for increased building efficiency and emissions reductions

NEW YORK--(BUSINESS WIRE)--Runwise, a leading building control company, today announced that it has raised $19 million in Series A funding, led by Fifth Wall with participation from several large real estate owners including Rudin Management, SOJA Ventures (The Swig Family / Halstead / Brown Harris Stevens), and The Strykers of Friedman Management and MCJ Collective, Derive Ventures, Helium-3, Silence VC, The Cannon Project as well as Waterman Ventures. Existing investors include Initialized Capital, Notation Capital, Susa Ventures and NextView Ventures. This round brings the total equity funding to $24 million.


Runwise was founded on the realization that antiquated building technology is responsible for over a third of wasted carbon emissions and that replacing inefficient and outdated technology would have a tremendous impact on the planet. Today, Runwise technology is installed in over 4,000 buildings with almost 400 customers – including many of the largest building owners and operators, such as Related, Blackstone, Lefrak, Equity Residential, Fairstead, and Douglas Elliman.

This investment will allow Runwise to continue expanding its operations and technology to buildings throughout the country, increasing building efficiency, lowering costs, and ultimately reducing fossil fuel emissions.

Last year, buildings retrofitted with Runwise’s technology saw on average a 20.1% reduction in fossil fuel emissions. This year, with the company’s continued growth, Runwise expects its technology will remove the equivalent of nearly 100,000 cars worth of carbon emissions off the road. In most buildings, the energy savings pays for the system in a handful of months.

“There is an aging building infrastructure crisis in the US. 45% of carbon emissions in most cities come from inefficient building operations, and almost all of these buildings are running on antiquated control infrastructure designed in the 1970s.” said Jeff Carleton, CEO of Runwise. “The smart property owners and managers have already realized that what’s good for the climate is now also good for their bottom line. This is why Runwise’s building control platform has already had a transformative impact on carbon emissions and affordability in 4,000+ buildings,” said Lee Hoffman, President of Runwise. “This new capital, combined with Fifth Wall’s large network of owners and operators, is going to help us bring the same levels of operational efficiency and carbon reduction to the rest of the 12 million buildings in the US,” said Mike Cook, Chief Growth Officer of Runwise.

“We’re thrilled to support Runwise and its goal of reducing carbon emissions produced by outdated building technology,” said Greg Smithies, Partner & Co-Head of Climate Tech at Fifth Wall. “Runwise is shining a light on building technology that most people take for granted, and we are proud to be a part of its growth.”

About Runwise: Runwise, formerly known as Heat Watch, is one of the nation's leading building control services. Runwise's mission is to enable buildings to run more efficiently using intelligent and easy-to-install wireless hardware and software. Runwise's service controls key building systems in thousands of buildings across 10 states.

About Fifth Wall: Founded in 2016, Fifth Wall, a Certified B Corporation, is the largest venture capital firm focused on technology for the global real estate industry. With approximately $3.2 billion in commitments and capital under management, Fifth Wall connects many of the world's largest owners and operators of real estate with the entrepreneurs who are redefining the future of the Built World. Fifth Wall is backed by a global mix of more than 100 strategic limited partners from more than 15 countries, including BNP Paribas Real Estate, British Land, CBRE, Cushman & Wakefield, Hilton, Host Hotels & Resorts, Ivanhoé Cambridge, Kimco Realty Corporation, Lennar, Lowe's Home Improvement, Marriott International, MetLife Investment Management, MGM Resorts, Related Companies, Starwood Capital, Toll Brothers and others. Fifth Wall believes this consortium represents one of the largest groups of potential partners in the global Built World ecosystem, which can result in transformational investments and collaborations with promising portfolio companies. For more information about Fifth Wall, its limited partners and portfolio, visit www.fifthwall.com.


Contacts

This email address is being protected from spambots. You need JavaScript enabled to view it.

The Women In Trucking Association honors Booster for its ongoing commitment to advancing diversity and expanding the employment of women in trucking

SAN MATEO, Calif.--(BUSINESS WIRE)--#DEIB--Booster®, a leading tech-driven mobile energy delivery company, is honored to announce that it has been recognized as a “Top Company for Women to Work For in Transportation” by the Women In Trucking (WIT) Association.


The annual WIT award honors companies that are focused on attracting and retaining women in the trucking industry, while also demonstrating a commitment to continually improving their work environments. This marks the second time Booster has been recognized for actively supporting gender diversity; the company was also honored in 2019.

“A company’s strengths lie in its ability to encourage diversity – across genders, perspectives, backgrounds and cultures – to build a welcoming and inclusive workplace,” said Booster CEO and founder Frank Mycroft. “We are honored by this award from Women in Trucking, but even more so, we are honored to be considered a place where women feel seen, heard and respected in what is a traditionally male-dominated field.”

The award comes on the heels of last month’s announcement that Booster was selected as a 2022 “Best Tech for Good” Finalist for leveraging technology to help their communities adapt, improve, and grow. Earlier this year, the company was named one of America's Best Startup Employers by Forbes in recognition of its commitment to maintaining a good reputation, investing in employee satisfaction, and pursuing steady growth.

WIT focused on several key criteria when selecting the companies for this year’s list, including: a corporate culture that fosters gender diversity; competitive compensation and benefits; flexible hours and work requirements; professional development opportunities and career advancement opportunities. Booster’s selection was validated by an industry-wide vote involving more than 22,000 professionals in transportation.

The award reflects Booster’s commitment to diversity; 16% of the company’s CDL drivers (which the company calls “Service Professionals,” or SPs) are women, double the industry average of 7.8%, according to Women in Trucking. ​​The company is also committed to internal mobility; as of today, 47% of its SPs have been promoted into higher-level positions.

All of Booster’s SPs are fuel-delivery licensed and certified. For aspiring drivers with CDLs interested in joining Booster’s team, Booster offers paid training as part of its apprenticeship program, and reimburses drivers for the cost of obtaining their tanker and hazmat endorsements.

For unlicensed new hires, the company offers a paid, in-house training program called CDL Academy to help trainees gain the necessary certifications while training to work as an SP. The program is currently offered in six markets – Boston; Nashville; Orange County, California; Portland, Oregon; the San Francisco Bay Area; and Seattle.

All SPs are considered full-time employees, and are offered competitive benefits including 401(k), 100% company-paid medical, dental and vision, and other benefits that include parenthood/fertility support, Modern Health mental health support, and early equity opportunities in the company.

“The ‘Top Companies for Women to Work For in Transportation' is a recognition program that acknowledges organizations who embrace gender diversity as part of their business strategy,” said Brian Everett, group publisher and editorial director of Redefining the Road, the official magazine of WIT. “Booster is among those who made the list in 2022, partially because we were impressed with the fact that 16% of Booster’s drivers are women and that their drivers can grow into manager or engineer roles. Promoting from within is key to their growth and success.”

Editor’s Notes

About Booster

Booster is a tech-driven mobile energy delivery company on a mission to fuel the energy transition. Headquartered in San Mateo, California, Booster delivers conventional and renewable fuels directly to fleet vehicles nationwide, lowering carbon emissions, reducing costs, and providing access to renewable fuels. At a time when the urgent desire to transition to a more sustainable energy future is far outpacing the development of infrastructure, Booster provides a critical solution for Amazon, Imperfect Foods, UPS, and hundreds of other customers — no filling stations, truck stops, or off-route trips required. For more information, visit boosterusa.com or connect with us on LinkedIn, Twitter, Facebook, and Instagram.


Contacts

Melina Vissat, Senior Director of Communications
This email address is being protected from spambots. You need JavaScript enabled to view it.

Grace Dearnley, Communications Manager
This email address is being protected from spambots. You need JavaScript enabled to view it.

Media Hotline: 408-560-7434

Highly-accelerated build schedule supports surging demand for novel IoT climate tech solutions

SCOTTS VALLEY, Calif.--(BUSINESS WIRE)--Ambient Photonics today celebrated the groundbreaking of its state-of-the-art, 43,000-square foot low-light solar cell manufacturing facility in Scotts Valley, California – one of the largest low-light indoor energy harvesting technology factories in the world. The company’s recent $48.5 million Series A funding and accelerated factory construction timeline position Ambient to serve the high demand for its novel technology. Ambient’s high power density solar cells enable connected device manufacturers to reduce the carbon footprint of their products by up to 80 percent by eliminating disposable batteries.


Ambient also recently opened its new headquarters in Scotts Valley and projects to employ over 100 full-time positions between the locations by this time next year.

“The legacy of battery waste in consumer electronics has become the barrier to achieving the dream of a connected, IoT world. Ambient’s technology addresses the growing environmental impact of disposable batteries head on,” said Ambient CEO Bates Marshall. “The Scotts Valley factory groundbreaking is a major milestone as we prove that both the U.S. and California can be leaders in the manufacturing of decarbonization technologies for the world.”

Ambient’s Fab 1 manufacturing facility in Scotts Valley will house the first-ever high-volume, fully-automated production line for low-light indoor solar cells utilizing state-of-the-art equipment from Manz AG, who also serves tech, automotive and e-mobility heavyweights across the globe. Ambient’s fully-automated production system leverages industrial printing processes to deposit its novel molecules on thin, durable glass substrates. Custom cells are swiftly deployable for integration into electronic devices at a price point for mass scale.

“Manz services the world’s largest manufacturing leaders, and Ambient’s investment in our highly-specialized production solutions proves their commitment to high-volume, high-quality production,” said Martin Drasch, CEO of Manz AG. “We are delighted to join Ambient in its journey of Smart Home and Internet of Things market innovation.”

“We are thrilled to welcome Ambient Photonics to Scotts Valley. Ambient brings quality jobs to Santa Cruz County with an appealing work-life balance – avoiding the stressful traffic jams and unnecessary air pollution that comes with a Silicon Valley commute,” said Scotts Valley Mayor Donna Lind. “Living sustainably is fundamental to the health and well-being of our community. Ambient’s work to reduce waste and carbon emissions in our everyday devices is something of which we can all be proud.”

Ambient expects to begin deliveries from the new factory to high-volume consumer electronics and IoT customers in the first half of next year. Connected device manufacturers partner with Ambient to not only improve product sustainability but also address Scope 3 emissions from their supply chains. With planned rooftop and parking canopy solar PV systems, Ambient’s manufacturing facility will also be powered by clean, renewable energy.

Ambient’s solar PV cells offer breakthrough energy density, able to harness photons from across the indoor ambient light spectrum and power a range of electronic devices. To learn more about endless power and energy harvesting for connected devices, download the Ambient Technology Brief here: ambientphotonics.com/technology.

About Ambient Photonics

California-based Ambient Photonics was founded in 2019 to bring low-light energy harvesting technology to mass scale. Ambient’s technology originally developed at the Warner Babcock Institute for Green Chemistry, and funded at inception by Cthulhu Ventures LLC, is backed by leading investors like Amazon’s Climate Pledge Fund, Ecosystem Integrity Fund (EIF), Tony Fadell’s Future Shape and I Squared Capital. The company’s low-light solar PV cells deliver ground-breaking power density from a broader spectrum of ambient light, inspiring a new era in connected device form and function. Ambient works with leading global smart home and IoT device manufacturers on embedded solar cells to deliver superior design possibilities, performance, sustainability and consumer convenience. Explore endless power at: ambientphotonics.com.


Contacts

Christine Bennett for Ambient Photonics
This email address is being protected from spambots. You need JavaScript enabled to view it. | +1 925.330.4783

New series improves conductivity and ease of processability

BOSTON--(BUSINESS WIRE)--Cabot Corporation (NYSE: CBT) today announced the launch of its new LITX® 93 series of conductive carbon additives (CCA) for use in lithium-ion batteries for electric vehicles (EV), energy storage applications and consumer electronics.


The market for lithium-ion batteries is expected to experience exponential growth due to the increasing consumption of rechargeable batteries and a rise in the adoption of EVs. This battery growth is expected to also fuel the demand for material components within batteries, including performance additives such as CCAs to support the rapid shift to EVs across the globe. CCAs are essential to build and sustain the conductive network of lithium-ion batteries for EVs, as they connect active materials within the electrode to enable an efficient and durable charge transfer, resulting in optimal electronic conductivity and lithium-ion diffusion.

The LITX 93 series can enable high energy density and high-rate charge-discharge performance for lithium-ion batteries due to their excellent dispersibility and conductive particle morphology. This series of conductive carbon products can be applied in both anode and cathode and is suitable for a variety of cathode active materials such as lithium iron phosphate (LFP), nickel cobalt manganese (NCM) and lithium cobalt oxide (LCO). Furthermore, the LITX93 series is offered in a versatile powder form, enabling battery manufacturers design flexibility for their end-use products.

“We are committed to leveraging the power of innovative chemistry and our strong R&D capabilities to deliver solutions that enable a more sustainable future for the rapidly growing battery market,” said Shen Yi, vice president and general manager for Battery Materials. “As we experience significant battery growth, it is ever more important that battery manufacturers have access to a reliable source of supply to bolster battery production. To ensure a reliable, local supply for our customers, the LITX 93 series will be manufactured throughout our global network, enabling us to support the demands of the market – today and in the future. We are proud to expand our comprehensive CCA product portfolio to help our customers meet their specific performance and cycle life requirements for lithium-ion battery applications.”

In addition to the LITX 93 series, Cabot offers the broadest portfolio of CCAs to enable the next generation of lithium-ion batteries, which include conductive carbons, carbon nanotubes (CNT), carbon nanostructures (CNS), and graphenes.

To learn more, visit cabotcorp.com/batteries.

ABOUT CABOT CORPORATION
Cabot Corporation (NYSE: CBT) is a global specialty chemicals and performance materials company headquartered in Boston, Massachusetts. The company is a leading provider of rubber and specialty carbons, engineered elastomer composites, inkjet colorants, masterbatches and conductive compounds, fumed silica and aerogel. For more information on Cabot, please visit the company’s website at cabotcorp.com.

Forward-Looking Statements
Safe Harbor Statement under the Private Securities Litigation Reform Act of 1995: Statements in this press release regarding Cabot's business that are not historical facts are forward looking statements that involve risks and uncertainties. These factors are discussed in the reports we file with the Securities and Exchange Commission (“SEC”), particularly under the heading “Risk Factors” in our annual report on Form 10-K and in our subsequent SEC filings filed with the SEC at www.sec.gov.


Contacts

Emily Moran
Corporate Communications
This email address is being protected from spambots. You need JavaScript enabled to view it.
(617) 460-4517

Steve Delahunt
Investor Relations
This email address is being protected from spambots. You need JavaScript enabled to view it.
(617) 342-6255

LOWELL, Ark.--(BUSINESS WIRE)--J.B. Hunt Transport Services, Inc. (NASDAQ: JBHT), one of the largest supply chain solutions providers in North America, today announced it ranked seventh on FreightWaves’ 2023 FreightTech 25 list recognizing the most innovative and disruptive companies in the transportation industry.


Innovation and creativity play an integral role in every aspect of our business,” said Shelley Simpson, president at J.B. Hunt. “As we continue to embrace the transformation of the transportation logistics industry, it is our focus to generate new opportunities and create value for our customers by leveraging the expertise of our people, our industry-leading technology, and our capacity to deliver.”

The 2023 FreightTech 25 were revealed during the F3: Future of Freight Festival on November 3, marking the fifth consecutive year J.B. Hunt has received the distinction. Companies selected for the FreightTech 25 are among those in the FreightTech 100, a list compiled by FreightWaves based on an external group of CEOs, leaders, and additional industry professionals. The FreightTech 25 are determined by a point system in which each panelist ranks the companies from 1 to 25, and those earning the highest points receive the honor. The full list is available on the FreightWaves website.

Over the last year, J.B. Hunt has made significant advancements that further its mission to create the most efficient transportation network in North America:

  • The company has made substantial investments in its technology platform, J.B. Hunt 360°® to expand reach and capability, enhance visibility of freight to more carriers, streamline the booking process and reduce or eliminate ineffective daily tasks.
  • J.B. Hunt expanded its drop-and-hook freight program J.B. Hunt 360box® with more than 13,000 trailers available. With its ability to turn loads faster, reduce empty miles and improve driver productivity, 360box continues to improve efficiency for shippers and carriers.
  • In March, J.B. Hunt announced it plans to grow its intermodal fleet to as many as 150,000 containers in the next three to five years as part of a joint initiative with BNSF Railway to relieve capacity constraints.
  • Since opening its first transloading service facility in November 2021, J.B. Hunt has launched three additional operations, expanding its transloading service footprint to encompass four of the largest ocean ports and the largest land port of entry into the U.S.
  • J.B. Hunt announced a long-term, strategic alliance with Waymo in January to complete the first fully autonomous transport in the upcoming years. The two launched an ongoing pilot in June to deliver goods for J.B. Hunt customer Wayfair, one of the world’s largest destinations for the home.

J.B. Hunt operates one of the largest company-owned fleets in North America with approximately 113,000 intermodal containers, 24,000 tractors and 41,000 trailers. The company’s J.B. Hunt 360 technology platform is an industry leader in digital freight matching and provides shippers with access to nearly one million trucks through qualified third-party carriers across the country.

About J.B. Hunt

J.B. Hunt Transport Services, Inc., a Fortune 500 and S&P 500 company, provides innovative supply chain solutions for a variety of customers throughout North America. Utilizing an integrated, multimodal approach, the company applies technology-driven methods to create the best solution for each customer, adding efficiency, flexibility, and value to their operations. J.B. Hunt services include intermodal, dedicated, refrigerated, truckload, less-than-truckload, flatbed, single source, last mile, and more. J.B. Hunt Transport Services, Inc. stock trades on NASDAQ under the ticker symbol JBHT and is a component of the Dow Jones Transportation Average. J.B. Hunt Transport, Inc. is a wholly owned subsidiary of JBHT. For more information, visit www.jbhunt.com.


Contacts

Brittnee Davie
Vice President - Marketing
479.419.3178
This email address is being protected from spambots. You need JavaScript enabled to view it.

 Companies Operating Across the State of Texas Recognized in the TxN 20 for Their Leadership in Conservation & Sustainability

AUSTIN, Texas--(BUSINESS WIRE)--#Conservation--Texan by Nature (TxN), a Texas-led conservation non-profit founded by former First Lady Laura Bush, today announced 20 honorees of the 4th annual Texan by Nature 20 (TxN 20) - an official ranking of companies with Texas operations that have made a demonstrative commitment to conservation.


The TxN 20 recognizes the best and most innovative work in conservation coming from business based and operating in Texas. As part of the TxN 20, Texan by Nature honors companies across 12 industries in the Lone Star State whose ingenuity cultivates impactful programs and forges new, beneficial paths in conservation. With 168 million acres of land and global leadership across multiple industries, Texas is fortunate to have industry leaders who see the value in partnering with conservation initiatives while also developing innovative, environmentally sustainable methods and processes within their business.

“We believe in building an environmentally sustainable future through actions, collaborations and innovative models in conservation,” said Joni Carswell, CEO & President of Texan by Nature. “It is an honor to celebrate the Texas-based industry leaders that share these values and demonstrate the benefits of pairing business resources with conservation efforts to impact the globe.”

A catalyst for thought leadership, innovative partnerships, and community-led solutions, Texan by Nature has been working with the Texas business community to implement Texas-led conservation practices. The TxN 20 provides not only recognition to honorees, but a catalogue of best practices and metrics to industry peers. The honoree’s commitment to conservation, their projects and programs, best practices, and lessons learned are examples and inspiration for us all.

“I’m thrilled to celebrate this year’s TxN 20! They are pioneers, collaborators, and changemakers. I encourage other companies to follow their example and engage in conservation. Together, we can set the standard for sustaining a prosperous economy, rich natural resources, and a secure future for the next generation,” said former First Lady and Texan by Nature Founder, Laura Bush.

To select the 2022 TxN 20, company data submissions were evaluated and independent research across 2,000+ of Texas’ publicly traded and private companies was conducted for 12 industry sectors. All companies were evaluated on key criteria through a 17-point scoring system to narrow down the list to the top 60 companies in Texas. Key scoring criteria included: stated commitment to conservation; reported metrics related to conservation; measured investment in conservation; reported Return on Conservation; positive conservation impact on land, water, wildlife, people, waste, energy, and more; and activities such as infrastructure, production and supply chain, employee engagement, and more. Each year, an esteemed selection committee of top industry leaders is formed to evaluate the top 60 companies and select the final honorees for the TxN 20.

2022 TxN 20 HONOREES INCLUDE:

  1. Austin Parks and Recreation Department
  2. Cap Metro
  3. CEMEX
  4. Cirrus Logic
  5. Comerica
  6. Darling Ingredients
  7. Dallas Fort Worth International Airport
  8. Farmer Brothers
  9. HOLT CAT
  10. IBM
  11. North American Development Bank
  12. NRG Energy
  13. Overland Partners
  14. Sanderson Farms
  15. Stantec
  16. Sysco
  17. Texas Health Resources
  18. Vistra Corp
  19. Vital Farms
  20. Yeti

To read more about each 2022 TxN 20 honoree, please visit: www.TxN20.org/2022-Honorees/

The TxN 20 2022 Selection Committee members included:

  • Rick Archer, Founding Principal – Overland Partners
  • Andrejs E. Avots-Avotins, MD, PhD, The Elizabeth & Drayton McLane, Jr. Chair in Health & Wellness Vice President of Medical Affairs – Baylor Scott & White Health – Temple
  • Lucia Athens, Chief Sustainability Officer – City of Austin
  • Tracee Bentley, President & CEO – Permian Strategic Partnership
  • Garrett Boone, Cofounder – The Container Store, Board – Green Space Dallas, Trinity Park Conservancy, Metro Dallas Homeless Alliance, Perot Museum
  • Stoney Burke, Founder/CEO, Aquia Group, TxN Advisory Council
  • Wayne Craig, Vice President & Director of Information Technology – Cactus Feeders
  • Edward Craner, Sr. Vice President – HOLT CAT
  • Matthew Crommett, Director – LH Capital, Inc, Lyda Hill Philanthropies
  • Michael Dorff, Communications and Public Affairs – Raytheon
  • Trey Dyer, Director of Land and Fixed Assets – The East Foundation
  • Smith Getterman, Director of Sustainability and Special Projects – Baylor University
  • Robert Horton, Vice President, Environmental Affairs & Sustainability – Dallas-Fort Worth International Airport, TxN Board
  • Devin Hotzel, Manager, Government Relations – Enbridge
  • Tyler Lowe, Director, Governmental Affairs – Vulcan Materials Company
  • Bob Malone, Chairman, President & CEO – Sonora Bank
  • Richard McDonald, Corporate Director, Environmental Affairs & Sustainability – H-E-B
  • Ashley Nelson, Director, ESG & Sustainability – Phillips 66
  • Julia Murphy, Deputy Chief Sustainability Officer – City of San Antonio Office of Sustainability
  • Angelica Rosales, Business Development – Sundt, TxN Advisory Council
  • VJ Smith, Manager, ESG and Stakeholder Engagement – Marathon Petroleum
  • Audrey Templeton, Enterprise Risk Manager – Molson Coors

Activating new investments, amplifying and accelerating innovations, and connecting partners to the resources they need to succeed, Texan by Nature offers select programs to help engage Texans in stewardship of the state’s rich land and diverse communities including the Conservation Wrangler program, TxN Certification, the Conservation Summit, Symposia series, the TxN 20, and select statewide initiatives. For more information on TxN partnerships and programs, or to learn how to get involved, please visit www.texanbynature.org.

ABOUT TxN:

Texan by Nature (TxN) brings conservation and business together to advance conservation - positively impacting natural resources, prosperity, and health across Texas and beyond. TxN partners deeply with conservation groups and business, acting as an accelerator for conservation groups and a strategic partner for business. Their projects and programs have impacted 7M+ people, 19.5M acres, and all of Texas' 254 counties over the last 2 years. Get involved and learn more at www.texanbynature.org and follow on Facebook @TexanbyNature, Twitter @TexanbyNature, and Instagram @texanbynature.


Contacts

Audrey Ponzio
This email address is being protected from spambots. You need JavaScript enabled to view it.
512-653-4640

Karina Araujo
This email address is being protected from spambots. You need JavaScript enabled to view it.
956-616-6869

TORONTO--(BUSINESS WIRE)--Greenland Resources Inc. (NEO: MOLY, FSE: M0LY) (“Greenland Resources” or the “Company”) is pleased to announce that on 30 November 2022, the Company plans to present at the EIT RawMaterials Innovation Hubs North and Baltic Sea Stakeholder Days in Helsinki, Finland, the Malmbjerg Molybdenum project located in central east Greenland. The event gathers mining companies, large industry suppliers, start-ups, and research institutes and calls for collaboration among the North and Baltic sea stakeholders to achieve a circular economy in the European Union Green Deal. The Raw Materials program can be found at EIT RawMaterials Innovation Hubs North and Baltic Sea Stakeholder Days.


The event is relevant because European Union (EU) suppliers will help Greenland Resources build a mine which is consistent with the new EU initiatives like the €300b EU Gateway that can help fund infrastructure needs for the EU circular economy. It also aligns with the recent 2022 State of the Union Address, where the EU President Ms. Ursula von der Leyen revealed plans to create the Critical Raw Materials Act as well as to increase the financial support for the European Raw Materials Fund.

Dr. Ruben Shiffman, Chairman, commented, “In addition to our efforts of raising funds through infrastructure support programs, we continue to talk capex with commercial and supranational banks, with the valued support of the European Raw Material Alliance. Furthermore, we continue to talk directly to molybdenum end users, roasters and potential strategic partners on selling our product on a long-term basis. In this way, EU steel and chemical companies will be able to get very clean high quality sustainable molybdenum from an EU associate country, produced with the highest ESG standards, and will be able to track every single pound of the molybdenum extracted in Greenland and comply with responsible sourcing policy”.

The European Institute of Innovation and Technology (EIT) RawMaterials, was initiated and funded by the European Union and has the overarching mandate to support securing the supply of critical and other strategically important raw materials to the European industry by driving innovation along the raw materials value chain. The European Raw Materials Alliance (ERMA), was launched by the European Commission in 2020 as part of an action plan aiming to reduce Europe’s raw materials’ dependency on third countries, diversifying supply from both primary and secondary sources and improving resource efficiency and circularity while promoting responsible sourcing worldwide. ERMA is managed by EIT RawMaterials. Greenland Resources is part of the investment portfolio of ERMA.

Qualified Person Statement

The news release has been reviewed and approved by Mr. Jim Steel, P.Geo., M.B.A. a Qualified Person as defined by Canadian Securities Administrators National Instrument 43-101 “Standards of Disclosure for Mineral Projects”.

About Greenland Resources Inc.

Greenland Resources is a Canadian public company with the Ontario Securities Commission as its principal regulator and is focused on the development of its 100% owned world-class Climax type pure molybdenum deposit located in central east Greenland. The Malmbjerg molybdenum project is an open pit operation with an environmentally friendly mine design focused on reduced CO2 emissions and water usage, low aquatic disturbance and low footprint due to modularized infrastructure with Proven and Probable Reserves of 245 million tonnes at 0.176% MoS2, for 571 million pounds of contained molybdenum metal. The Malmbjerg project benefits from a NI 43-101 Definitive Feasibility Study completed by Tetra Tech in 2022, which concluded an expected Base case after-tax IRR of 22.4%, NPV6% of US$1.17 billion (€1.02 billion) and a Levered pre-tax IRR of 40.4%, after tax IRR of 33.8% and payback of 2.4 years.

The project had a previous exploitation license granted in 2009. With offices in Toronto, the Company is led by a management team with an extensive track record in the mining industry and capital markets. For further details, please refer to our web site (www.greenlandresources.ca) and our Canadian regulatory filings on Greenland Resources’ profile at www.sedar.com

About Molybdenum and the European Union

Molybdenum is a critical metal used mainly in steel and chemicals that is needed in all technologies in the upcoming green energy transition (World Bank, 2020; IEA, 2021). When added to steel and cast iron, it enhances strength, hardenability, weldability, toughness, temperature strength, and corrosion resistance. Based on data from the International Molybdenum Association and the European Commission Steel Report, the world produced around 576 million pounds of molybdenum in 2021 where the European Union (“EU”) as the second largest steel producer in the world used approximately 25% of global molybdenum supply and has no domestic molybdenum production. To a greater degree, the EU steel dependent industries like the automotive, construction, and engineering, represent around 18% of the EU’s ≈ US$16 trillion GDP. Greenland Resources strategically located Malmbjerg molybdenum project has the potential to supply in and for the EU approximately 25 million pounds per year, of environmentally friendly molybdenum from a responsible EU Associate country, for decades to come. The high quality of the Malmbjerg ore, having low impurity content in phosphorus, tin, antimony, and arsenic, makes it an ideal source of molybdenum for the high-performance steel industry lead worldwide by Europe, specifically the Scandinavian countries and Germany.

Forward Looking Statements

CAUTIONARY NOTE REGARDING FORWARD LOOKING STATEMENTS

This news release contains "forward-looking information" (also referred to as "forward looking statements"), which relate to future events or future performance and reflect management’s current expectations and assumptions. Often, but not always, forward-looking statements can be identified by the use of words such as "plans", "hopes", "expects", "is expected", "budget", "scheduled", "estimates", "forecasts", "intends", "anticipates", or "believes" or variations (including negative variations) of such words and phrases, or state that certain actions, events or results "may", "could", "would", "might" or "will" be taken, occur or be achieved. Such forward-looking statements reflect management’s current beliefs and are based on assumptions made by and information currently available to the Company. All statements, other than statements of historical fact, are forward-looking statements or information. Forward-looking statements or information in this news release relate to, among other things: the Company’s objectives, goals or future plans, the Company’s upcoming involvement in conferences, discussions, and initiatives, results of discussions with stakeholders, future consumers, and other parties, statements, exploration results, potential mineralization, the estimation of mineral resources and reserves, and their valuation, exploration and mine development plans, timing of the commencement of operations and estimates of market conditions.

These forward-looking statements and information reflect the Company’s current views with respect to future events and are necessarily based upon a number of assumptions that, while considered reasonable by the Company, are inherently subject to significant operational, business, economic and regulatory uncertainties and contingencies. These assumptions include: current EU and other initiatives remaining in place into the future; expected demand for molybdenum in the EU and abroad; our mineral reserve estimates and the assumptions upon which they are based, including geotechnical and metallurgical characteristics of rock confirming to sampled results and metallurgical performance; tonnage of ore to be mined and processed; ore grades and recoveries; assumptions and discount rates being appropriately applied to the technical studies; estimated valuation and probability of success of the Company’s projects, including the Malmbjerg molybdenum project; prices for molybdenum remaining as estimated; currency exchange rates remaining as estimated; availability of funds for the Company’s projects; capital decommissioning and reclamation estimates; mineral reserve and resource estimates and the assumptions upon which they are based; prices for energy inputs, labour, materials, supplies and services (including transportation); no labour-related disruptions; no unplanned delays or interruptions in scheduled construction and production; all necessary permits, licenses and regulatory approvals are received in a timely manner; and the ability to comply with environmental, health and safety laws. The foregoing list of assumptions is not exhaustive.

The Company cautions the reader that forward-looking statements and information include known and unknown risks, uncertainties and other factors that may cause actual results and developments to differ materially from those expressed or implied by such forward-looking statements or information contained in this news release and the Company has made assumptions and estimates based on or related to many of these factors. Such factors include, without limitation: the projected demand for molybdenum both in the EU and elsewhere; the current initiatives and programs for resource development in the EU and abroad; the projected and actual effects of the COVID-19 coronavirus on the factors relevant to the business of the Corporation, including the effect on supply chains, labour market, currency and commodity prices and global and Canadian capital markets, fluctuations in molybdenum and commodity prices; fluctuations in prices for energy inputs, labour, materials, supplies and services (including transportation); fluctuations in currency markets (such as the Canadian dollar versus the U.S. dollar versus the Euro); operational risks and hazards inherent with the business of mining (including environmental accidents and hazards, industrial accidents, equipment breakdown, unusual or unexpected geological or structure formations, cave-ins, flooding and severe weather); inadequate insurance, or the inability to obtain insurance, to cover these risks and hazards; our ability to obtain all necessary permits, licenses and regulatory approvals in a timely manner; changes in laws, regulations and government practices in Greenland, including environmental, export and import laws and regulations; legal restrictions relating to mining; risks relating to expropriation; increased competition in the mining industry for equipment and qualified personnel; the availability of additional capital; title matters and the additional risks identified in our filings with Canadian securities regulators on SEDAR in Canada (available at www.sedar.com). Although the Company has attempted to identify important factors that could cause actual results to differ materially, there may be other factors that cause results not to be as anticipated, estimated, described or intended. Investors are cautioned against undue reliance on forward-looking statements or information.

These forward-looking statements are made as of the date hereof and, except as required by applicable securities regulations, the Company does not intend, and does not assume any obligation, to update the forward-looking information. Neither the NEO Exchange Inc. nor its regulation services provider accepts responsibility for the adequacy of this release. No stock exchange, securities commission or other regulatory authority has approved or disapproved the information contained herein.


Contacts

For further information please contact:

Ruben Shiffman, PhD Chairman, President
Keith Minty, P.Eng, MBA Engineering and Project Management
Jim Steel, P.Geo, MBA Exploration and Mining Geology
Nauja Bianco, M.Pol.Sci. Public and Community Relations
Gary Anstey Investor Relations
Eric Grossman, CPA, CGA Chief Financial Officer
Corporate office Suite 1410, 181 University Av. Toronto, Ontario, Canada M5H 3M7
Telephone +1 647 273 9913
Email This email address is being protected from spambots. You need JavaScript enabled to view it.
Web www.greenlandresources.ca

PASADENA, Calif.--(BUSINESS WIRE)--#DEI--Tetra Tech, Inc. (NASDAQ: TTEK), a leading provider of high-end consulting and engineering services, congratulates Preston Hopson, Tetra Tech General Counsel, on his selection as 2022 Diversity Counsel of the Year by the Association of Corporate Council (ACC) Southern California Chapter. The award recognizes Mr. Hopson’s leadership within the in-house legal community and his commitment and ability to improve the diversity of the legal profession in Southern California.

“On behalf of everyone at Tetra Tech, I am pleased to congratulate Mr. Hopson on this well-deserved recognition of his ongoing commitment to diversity, equity and inclusion,” said Dan Batrack, Tetra Tech Chairman and CEO. “Mr. Hopson has made an impact both in the legal community and within Tetra Tech. With his leadership, we have formalized and expanded our global Diversity, Equity, and Inclusion Program, which is led by and truly responsive to the diverse needs of employees across our global operations.”

Since joining Tetra Tech in 2018, Mr. Hopson helped launch Tetra Tech’s global Diversity, Equity, and Inclusion (DEI) Program as a founding member of our DEI Council. He is one of the founders and executive sponsor for Tetra Tech’s inaugural Employee Resource Group, BELIEVE (Black Employees Leading in Innovation, Enthusiasm, Vision, and Excellence). Tetra Tech and BELIEVE partnered with the National Society of Black Engineers to develop and increase the number of Black engineers and scientists who excel academically, succeed professionally, and positively impact the community.

Mr. Hopson also has a long history of supporting diverse representation in the legal community. He has served two terms on the ACC Southern California Chapter Board of Directors and actively participates in ACC diversity initiatives. He is a mentor for the Black General Counsel 2025 Project to prepare Black lawyers to become General Counsel of public companies. Mr. Hopson previously served on the executive board of African American Attorneys in Downtown Firms and the executive committee of the National Bar Association’s Young Lawyers Division. He also founded a program to introduce underrepresented Los Angeles high school students to the legal profession.

Mr. Hopson said, “I am honored to be included in the ranks of the accomplished recipients of the Diversity Counsel Award. I take my commitment to furthering diversity, equity, and inclusion and corporate social responsibility seriously, both within the legal community and at Tetra Tech. I am incredibly proud to continue to work with my Tetra Tech colleagues to advance important DEI initiatives not only in our workplaces, but also in the communities where we live and work across the world.”

As part of the Diversity Counsel award, Mr. Hopson has chosen the Legal Aid Foundation of Los Angeles to receive a $5,000 grant from ACC Southern California Chapter.

About Tetra Tech

Tetra Tech is a leading provider of high-end consulting and engineering services for projects worldwide. With 21,000 associates working together, Tetra Tech provides clear solutions to complex problems in water, environment, sustainable infrastructure, renewable energy, and international development. We are Leading with Science® to provide sustainable and resilient solutions for our clients. For more information about Tetra Tech, please visit tetratech.com or follow us on LinkedIn, Twitter, and Facebook.

Any statements made in this release that are not based on historical fact are forward-looking statements. Any forward-looking statements made in this release represent management’s best judgment as to what may occur in the future. However, Tetra Tech’s actual outcome and results are not guaranteed and are subject to certain risks, uncertainties and assumptions ("Future Factors"), and may differ materially from what is expressed. For a description of Future Factors that could cause actual results to differ materially from such forward-looking statements, see the discussion under the section "Risk Factors" included in the Company’s Form 10-K and Form 10-Q filings with the Securities and Exchange Commission.


Contacts

Jim Wu, Investor Relations
Charlie MacPherson, Media & Public Relations
(626) 470-2844

- The website builds upon Equinox Partners’ policy of voting against directors who have served for two or more years but hold less than two years of director’s fees in company stock.
- Equinox Partners anticipates the site will be used to advance the interest of shareholders in the gold mining sector.
- 21% of directors in junior gold miners’ index fail to meet this minimum ownership level.


STAMFORD, Conn.--(BUSINESS WIRE)--Equinox Partners Investment Management, LLC, (“Equinox Partners”) a long-term value investor, today announced the launch of www.directorswithoutstock.com to amplify its investment stewardship policy. Equinox Partners will vote against directors who have served for two or more years but hold less than two years of director’s fees in the company’s stock.

The site lists directors of gold and silver mining companies in the MVIS Global Junior Miners Index (MVGDXJTR) who fail the firm’s stewardship policy and includes the director’s photo, name, company, total shares owned, value of shares owned, annual compensation, ratio of value of shares to compensation, and years on board.

Key results that are showcased on the website include:

- Of the 95 gold and silver mining companies in the index with readily available public filings, there were 590 directors, of which 125, or 21%, that failed the Equinox Partners stewardship policy.
- Of those 125 that failed, 37 owned no stock at all.
- Of those 37 that owned no stock, the average board tenure was 8 years.
- By eliminating the two-year minimum tenure constraint, 311 directors, or 53%, would fail the Equinox Partners policy.

By adopting a clear, lower-bound for director share ownership, Equinox Partners is pushing back on the growing indifference of boards to non-executive director stock ownership and the decision of some companies to prohibit non-executive directors from owning stock all together. Equinox Partners believes financially aligned directors are more likely to prioritize returns on and of owners’ capital. In comparison, the Canadian E&P industry is an example of a similar capital-intensive industry that has incentivized more insider ownership and prioritized disciplined capital allocation.

“Directors who lack any meaningful financial alignment with shareholders are going to tend to things that aren’t in the financial best interest of shareholders,” said Sean Fieler, President and Chief Investment Officer of Equinox Partners. “It’s crazy that a director would not have meaningful ownership of the company they direct. Insider ownership amongst the gold miners is worsening, as passive investors push board turnover that does not always align with the interest of shareholders. We hope our policy and this new site can be a step in a different direction.”

---ENDS---

About Equinox Partners
Equinox Partners, headquartered in Connecticut is a long-term value investor with a large weighting in precious metals miners. Equinox Partners’ high conviction approach to fundamental investing involves a strong, active focus on corporate governance.

Equinox Partners Investment Management, LLC | Information as of 09.30.22 unless noted | SEC registration does not imply a certain level of skill or training

NOTE:

If a given Director would like to be removed from our list due to the purchase of their company's stock, we would be happy to remove them in the next iteration. Similarly, if a Director believes the publicly available data as presented could be amended or clarified, they should contact us immediately.

DISCLAIMER:

The information contained on this website is being provided by Equinox Partners for informational purposes only and is not a solicitation of proxies for any purpose. Nothing contained herein is intended to be or should be considered investment advice or a recommendation by Equinox Partners to buy or sell any security including, without limitation, any security issued by a company named herein.

Equinox Partners and certain related persons and other entities holds a financial interest in certain companies identified above as an equity investor. However, unless otherwise stated, neither Equinox Partners nor any of its partners, directors or officers, or any directors or officers of any of its subsidiaries, or any 10% or greater shareholder of Equinox Partners, has beneficial ownership of, or director or control over, more than 1% of the issued and outstanding equity securities of any of the companies identified above, or any other financial or other interest in those companies.

METHODOLOGY:

Metrics for each company have been taken from respective company’s most recent proxy statement through September 2022. Pricing as of 9.16.22. Values may be rounded. All values are in USD. Compensation ratio is calculated using the aforementioned data, and is defined by the total value of shares divided by annual compensation. Only companies found in the GDXJ index as of 09.01.22 have been included in the analysis. List only includes those directors appointed before 2020 and who fail the specified policy. Best efforts were made to include all public filings into the analysis. A small number of companies did not have publicly available ownership and/or compensation information. Equinox Partners Investment Management, LLC, will seek to update this list at least annually.


Contacts

Media Contact:
Thomas Conroy
Peregrine Communications
This email address is being protected from spambots. You need JavaScript enabled to view it.
+1 917 970 8667

Joint venture will create the largest polyvinylidene fluoride (PVDF) capacity for battery materials in the region. The total investment is estimated at around 850 million USD, partially funded by a grant to Solvay from the U.S. Department of Energy, for a total of 178 million USD.

BRUSSELS & BOSTON--(BUSINESS WIRE)--Solvay and Orbia today announced their entry into a joint venture framework agreement to create a partnership for the production of suspension-grade polyvinylidene fluoride (PVDF), creating the largest capacity in North America.

With more than half of U.S. car sales projected to be electric by 2030, demand for lithium-ion batteries and PVDF, a thermoplastic fluoropolymer used as a lithium-ion binder and separator coating, is revving up. The Solvay-Orbia joint venture would fill a significant supply gap and will build upon favorable regulatory conditions promoting regional production and material security.

Solvay, a global leader in PVDF, brings process technology and unparalleled global market know-how to this venture. With a vertically-integrated value chain and material holdings, Orbia’s Fluorinated Solutions business Koura and Polymer Solutions business Vestolit will supply hydrofluoric acid, vinyl chloride monomer (VCM) and chlorine respectively. In combination, Solvay’s Solef® PVDF innovations and Orbia’s raw material assets and production expertise will enable delivery of PVDF that optimizes energy storage efficiency by increasing battery energy density, safety and power.

“We are delighted to partner with Orbia on this exciting opportunity to expand our battery solutions into North America, with strong support by the U.S. Department of Energy,” said Ilham Kadri, CEO of Solvay. “This significant milestone in our electrification strategy enhances our global leadership and contributes to the establishment of the battery supply chain infrastructure in the United States. This decision follows our previously announced investment in Tavaux, France. These investments extend our ambition to grow global sales to the automotive market from €800 million in 2021 to over €3 billion by 2030.”

Said Sameer Bharadwaj, CEO of Orbia, “Our partnership with Solvay marks a key milestone for our business and our role in enabling the North American energy transition. Together with Solvay, Orbia’s unique position integrated into both the fluorine and vinyl chains helps us to bring a cost-competitive battery supply chain to the U.S. just as we maintain our commitment to developing sustainable solutions that can advance life globally. Along with our previously announced Department of Energy grant to produce LiPF6 electrolyte salts in North America, this investment will put us in a leadership position to provide a secure source for fluorinated lithium-ion battery additives as well as local jobs.”

The total investment is estimated to be around $850 million, and is expected to be funded in part by a grant awarded by the U.S. Department of Energy of $178 million to Solvay to build a facility in Augusta, Georgia. Solvay and Orbia intend to use two production sites, one for raw materials and the other for finished product, located in the southeastern United States. Both plants are expected to be fully operational by 2026. Commencement of the joint venture is subject to finalizing and entering into definitive agreements between the parties and satisfaction of customary conditions, including obtaining regulatory approvals.

About Solvay

Solvay is a science company whose technologies bring benefits to many aspects of daily life. With more than 21,000 employees in 63 countries, Solvay bonds people, ideas and elements to reinvent progress. The Group seeks to create sustainable shared value for all, notably through its Solvay One Planet roadmap crafted around three pillars: protecting the climate, preserving resources and fostering a better life. The Group’s innovative solutions contribute to safer, cleaner, and more sustainable products found in homes, food and consumer goods, planes, cars, batteries, smart devices, health care applications, water and air purification systems. Founded in 1863, Solvay today ranks among the world’s top three companies for the vast majority of its activities and delivered net sales of €10.1 billion in 2021. Solvay is listed on Euronext Brussels and Paris (SOLB). Learn more at solvay.com.

About Orbia

Orbia is a company driven by a shared purpose: to advance life around the world. Orbia operates in the Polymer Solutions (Vestolit and Alphagary), Building and Infrastructure (Wavin), Precision Agriculture (Netafim), Connectivity Solutions (Dura-Line) and Fluorinated Solutions (Koura) sectors. The five Orbia business groups have a collective focus on expanding access to health and wellness, reinventing the future of cities and homes, ensuring food and water security, connecting communities to information and accelerating a circular economy with basic and advanced materials, specialty products and innovative solutions. Orbia has a global team of over 23,000 employees, commercial activities in more than 110 countries and operations in over 50, with global headquarters in Boston, Mexico City, Amsterdam and Tel Aviv. The company generated $8.8 billion in revenue in 2021. Learn more at orbia.com.


Contacts

Media Contacts
Solvay
Nathalie van Ypersele
General Manager, Communications
+32 (0) 478 20 10 62
This email address is being protected from spambots. You need JavaScript enabled to view it.

Orbia
Kacy Karlen
Chief Communications Officer
1.865.410.3001
This email address is being protected from spambots. You need JavaScript enabled to view it.

Koura & Vestolit
Michelle Arias
Communications Director
1.562.559.3582
This email address is being protected from spambots. You need JavaScript enabled to view it.

Investor Contacts
Solvay
Jodi Allen
Head of Investor Relations
1.609.860.4608
This email address is being protected from spambots. You need JavaScript enabled to view it.

Orbia
Gerardo Lozoya Latapi
Investor Relations Director
+52 1 (55) 80199904
This email address is being protected from spambots. You need JavaScript enabled to view it.

Company working with Vermont-based GMP on additional units. 2 MWh energy storage system can be delivered where needed, offering unrivaled grid-support flexibility, disaster response, and energy storage benefits to GMP Customers

WATERBURY, Vt.--(BUSINESS WIRE)--Nomad Transportable Power Systems (“NOMAD”), a company founded by U.S.-based battery manufacturer KORE Power, has sold the industry’s first mobile energy storage unit to Green Mountain Power (GMP) in Vermont. The sale makes NOMAD first-to-market with a utility-scale transportable power solution, which was designed and built in Vermont and will deliver benefits for GMP customers.


NOMAD’s power systems can do everything fixed energy storage can do – like boosting reliability and making renewable energy dispatchable – while also providing mobility. They meet any application or project’s energy needs by bringing power where and when it’s needed most. Then, unlike a fixed storage asset, NOMAD’s systems can be re-deployed to meet other needs. NOMAD’s systems bring tremendous value to disaster recovery, on-demand grid support, and off-grid power applications.

Mari McClure, president and CEO of Green Mountain Power, said the Traveler offers a variety of applications and provides another important innovation to join GMP’s fleet of storage, increasing resilience and reliability, while lowering costs for customers.

“Green Mountain Power is bringing technologies to all of our customers that cut carbon and costs, and keep Vermonters powered up,” McClure said. “Mobile storage paired with our generation will allow us to power our NOMAD – which packs 2.0 MWh of capacity – with clean energy and deploy that power wherever it is needed.”

Jay Bellows, CEO of NOMAD, said transportable utility-scale storage is a gamechanger. “Our products are mobile, so they can deliver power in a range of applications and speed that stationary energy storage systems can’t match. Our team identified a need in the market, and using American innovation and New England ingenuity, we’ve been able to deliver a product that will bring benefits across the nation,” he said.

About Nomad Transportable Power Systems Inc.

Nomad Transportable Power Systems, Inc. (“NOMAD”), is a Delaware-based company formed by KORE Power in 2020 to provide the energy industry with a standardized mobile energy storage platform. NOMAD is the first entrant into the mobile lithium-ion energy storage space and combines its patent-pending, over-the-road storage units with a standardized docking platform capable of interconnection with any distribution or transmission utility. The NOMAD system was designed from the onset to provide its customers all the benefits of fixed site energy storage, while eliminating both the capital commitments and long-term obligations that traditional energy storage requires.


Contacts

David Jakubiak
This email address is being protected from spambots. You need JavaScript enabled to view it.
(708) 299-7733

Aleysha Newton
This email address is being protected from spambots. You need JavaScript enabled to view it.
(208) 758-9392

Company to Report Q3 2022 Results on November 14, 2022

BOSTON--(BUSINESS WIRE)--Advent Technologies Holdings, Inc. (NASDAQ: ADN) (“Advent” or the “Company”), an innovation-driven leader in the fuel cell and hydrogen technology space, today announced that it will release its financial results for the third quarter ended September 30, 2022 on Monday, November 14, 2022 and will host a conference call the same day at 9:00 AM ET to discuss its results.


To access the call please dial (888) 660-6182 from the United States, or (929) 203-0891 from outside the U.S. The conference call I.D. number is 3273042. Participants should dial in 5 to 10 minutes before the scheduled time.

A replay of the call can also be accessed via phone through November 28, 2022, by dialing (800) 770-2030 from the U.S., or (647) 362-9199 from outside the U.S. The conference I.D. number is 3273042.

About Advent Technologies Holdings, Inc.

Advent Technologies Holdings, Inc. is a U.S. corporation that develops, manufactures, and assembles complete fuel cell systems, and the critical components for fuel cells in the renewable energy sector. Advent is headquartered in Boston, Massachusetts, with offices in California, Greece, Denmark, Germany, and the Philippines. With more than 150 patents issued, pending and licensed for its fuel cell technology, Advent holds the IP for next-generation HT-PEM that enable various fuels to function at high temperatures under extreme conditions – offering a flexible “Any Fuel. Anywhere.” option for the automotive, aviation, defense, oil and gas, marine, and power generation sectors. For more information, visit www.advent.energy.

Cautionary Note Regarding Forward-Looking Statements

This press release includes forward-looking statements. These forward-looking statements generally can be identified by the use of words such as “anticipate,” “expect,” “plan,” “could,” “may,” “will,” “believe,” “estimate,” “forecast,” “goal,” “project,” and other words of similar meaning. Each forward-looking statement contained in this press release is subject to risks and uncertainties that could cause actual results to differ materially from those expressed or implied by such statement. Applicable risks and uncertainties include, among others, the Company’s ability to realize the benefits from the business combination; the Company’s ability to maintain the listing of the Company’s common stock on Nasdaq; future financial performance; public securities’ potential liquidity and trading; impact from the outcome of any known and unknown litigation; ability to forecast and maintain an adequate rate of revenue growth and appropriately plan its expenses; expectations regarding future expenditures; future mix of revenue and effect on gross margins; attraction and retention of qualified directors, officers, employees and key personnel; ability to compete effectively in a competitive industry; ability to protect and enhance our corporate reputation and brand; expectations concerning our relationships and actions with our technology partners and other third parties; impact from future regulatory, judicial and legislative changes to the industry; ability to locate and acquire complementary technologies or services and integrate those into the Company’s business; future arrangements with, or investments in, other entities or associations; and intense competition and competitive pressure from other companies worldwide in the industries in which the Company will operate; and the risks identified under the heading “Risk Factors” in our Annual Report on Form 10-K filed with the Securities and Exchange Commission on March 31, 2022, as well as the other information we file with the SEC. We caution investors not to place considerable reliance on the forward-looking statements contained in this press release. You are encouraged to read our filings with the SEC, available at www.sec.gov, for a discussion of these and other risks and uncertainties. The forward-looking statements in this press release speak only as of the date of this document, and we undertake no obligation to update or revise any of these statements. Our business is subject to substantial risks and uncertainties, including those referenced above. Investors, potential investors, and others should give careful consideration to these risks and uncertainties.


Contacts

Advent Technologies Holdings, Inc.

Naiem Hussain
This email address is being protected from spambots. You need JavaScript enabled to view it.

Chris Kaskavelis
This email address is being protected from spambots. You need JavaScript enabled to view it.

CHICAGO--(BUSINESS WIRE)--The Climate and Equitable Jobs Act (CEJA) sets ambitious goals for a cleaner and more equitable energy future that also creates jobs and contributes to a strong economy. To help achieve those goals, CEJA calls on ComEd to file a multi-year grid plan and to file new rates. ComEd today announced its intent to file, along with its grid plan, a four-year rate plan that closely aligns with the state’s goal of long-term investments to support clean energy and decarbonization in Illinois. ComEd intends to file these plans with the Illinois Commerce Commission (ICC) in January 2023.


“A strong, dynamic grid is essential to meeting the state’s ambitious clean energy and decarbonization goals to combat climate change, improve local air quality and lift up the communities that need it most,” said ComEd CEO Gil Quiniones. “These plans will provide the foundation for a grid that is resilient, flexible, and intelligent to withstand more frequent and severe weather due to climate change and enable technologies like solar, battery storage and fleets of electric vehicles.”

These plans will provide the ICC, customers and stakeholders insight and an opportunity to provide input into the delivery service investments and rates required over the period from 2024 through 2027 to support the delivery of clean, reliable and resilient electricity to its customers.

ComEd is delivering the highest levels of service in its history, providing families and businesses the reliable and resilient clean energy they need and deserve. In fact, ComEd’s reliability performance for the first nine months of 2022 was highest on record for any year in company history. This strong performance would not be possible if not for smart grid improvements that began in 2011. At the same time, ComEd’s rates are among the lowest in America. As of December 2021, the average residential rate was 21 percent below the average for the nation’s top 10 metro areas, and as a percentage of median income, ComEd’s residential electricity charges rank among the lowest in the nation.

ComEd is a unit of Chicago-based Exelon Corporation (NASDAQ: EXC), a Fortune 200 energy company with approximately 10 million electricity and natural gas customers – the largest number of customers in the U.S. ComEd powers the lives of more than 4 million customers across northern Illinois, or 70 percent of the state’s population. For more information visit ComEd.com and connect with the company on Facebook, Twitter, Instagram and YouTube


Contacts

ComEd Media Relations
312-394-3500

DALLAS--(BUSINESS WIRE)--Pioneer Natural Resources Company (NYSE:PXD) ("Pioneer" or "the Company") announced today the publication of its 2022 Climate Risk Report. The publication of this report highlights Pioneer’s progress toward integrating climate-related risks and opportunities into the Company’s governance structure, business strategy and planning process, and risk management practice. The 2022 report provides numerous positive updates since the inaugural publication in 2021, demonstrating the Company’s commitment to improving its environmental, social and governance metrics.


About Pioneer

Pioneer is a large independent oil and gas exploration and production company, headquartered in Dallas, Texas, with operations in the United States. For more information, visit Pioneer’s website at www.pxd.com.


Contacts

Investors
Tom Fitter – 972-969-1821
Greg Wright – 972-969-1770
Chris Leypoldt – 972-969-5834

Media and Public Affairs
Christina Voss – 972-969-5706

Following successful laboratory testing, company begins field testing stage

SWORDS, Ireland--(BUSINESS WIRE)--Trane Technologies (NYSE: TT), a global climate innovator, has surpassed U.S. Department of Energy (DOE) requirements for the Residential Cold Climate Heat Pump (CCHP) Challenge for high-efficiency heating in freezing temperatures. After outperforming in laboratory tests in extremely cold temperatures, the Trane® high-efficiency, cold climate heat pump will begin field trials this month.


“As a sustainability leader, we relentlessly innovate to develop high-efficiency heat pumps and other sustainable solutions that transition away from fossil fuels and reduce carbon emissions,” said Jason Bingham, president of Residential HVAC, Trane Technologies. “We’re excited to move to the next phase of the DOE challenge. As more and more homeowners choose sustainable solutions like heat pumps, we look forward to helping them take advantage of new clean energy tax credits and rebates available through the Inflation Reduction Act.”

When tested at the DOE’s lab, Trane’s CCHP prototype performed in temperatures as low as negative 23 degrees Fahrenheit, surpassing the mandatory negative 20 degrees Fahrenheit DOE requirement.

“When tested at the Oak Ridge National Lab Facility, our prototype pushed the limits of the testing with high performance even as temperatures moved beyond the trial scope. To stop this Trane unit, they had to manually cut the power,” said Katie Davis, vice president of engineering and technology, Residential HVAC, Trane Technologies. “We are excited to conduct field testing with this heat pump and keep families warm while supporting a more sustainable future. It’s hard to stop a Trane!”

Until this new technology is available, the company continues to offer the most efficient options available today including heat pumps, more environmentally minded furnaces, and the pairing of the two in dual fuel systems.

Through bold, industry-leading action, Trane Technologies is creating efficient and sustainable comfort solutions and advancing its 2030 Sustainability Commitments, including the company’s Gigaton Challenge – the largest validated science-based climate commitment related to product use emissions, which pledges to reduce one billion metric tons (one gigaton) of greenhouse gas emissions from customers’ carbon footprints by 2030.

About Trane Technologies

Trane Technologies is a global climate innovator. Through our strategic brands Trane® and Thermo King®, and our environmentally responsible portfolio of products and services, we bring efficient and sustainable climate solutions to buildings, homes, and transportation. Learn more at tranetechologies.com.

This news release includes “forward-looking statements” which are statements that are not historical facts, including statements that relate to our sustainability commitments and the impact of these commitments. These forward-looking statements are based on our current expectations and are subject to risks and uncertainties, which may cause actual results to differ materially from our current expectations. Such factors include, but are not limited to, our future financial performance and targets, including revenue, EPS and operating income; our business operations; demand for our products and services, including bookings and backlog; capital deployment, including the amount and timing of our dividends, our share repurchase program, including the amount of shares to be repurchased and the timing of such repurchases and our capital allocation strategy, including acquisitions, if any; our projected free cash flow and usage of such cash; our available liquidity; performance of the markets in which we operate; restructuring activity and cost savings associated with such activity; and our effective tax rate. Additional factors that could cause such differences can be found in our Form 10-K for the year ended December 31, 2021, as well as our subsequent reports on Form 10-Q and other SEC filings. We assume no obligation to update these forward-looking statements.


Contacts

Media Contact:
Shelby Hansen
+1-704-990-3835
This email address is being protected from spambots. You need JavaScript enabled to view it.

Investors Contact:
Zachary Nagle
+1-704-990-3913
This email address is being protected from spambots. You need JavaScript enabled to view it.

Offshore Source Logo

Offshore Source keeps you updated with relevant information concerning the Offshore Energy Sector.

Any views or opinions represented on this website belong solely to the author and do not represent those of the people, institutions or organizations that Offshore Source or collaborators may or may not have been associated with in a professional or personal capacity, unless explicitly stated.

Corporate Offices

Technology Systems Corporation
8502 SW Kansas Ave
Stuart, FL 34997

info@tscpublishing.com