Business Wire News

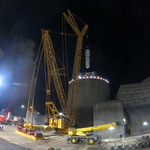
MT LAUREL, N.J.--(BUSINESS WIRE)--#cleanenergy--The Steam Generating Team (SGT), a joint venture between Framatome and United Engineers & Constructors, Inc. (United), has successfully completed the steam generator replacement project at the Tennessee Valley Authority (TVA) Watts Bar Unit 2 nuclear plant. The plant returned to full operations after all four original steam generators were replaced during the scheduled outage.


“This project, like many others performed by SGT, utilized our experienced team and proven processes customized for steam generator replacement,” said Art Lembo, President of SGT. “I’m especially proud of our team for completing this outage with zero recordable incidents and personnel exposure below ALARA goals, an accomplishment that speaks to SGT’s vigilance in industrial and radiological safety.”

Large component replacements are significant engineering and operational projects. To remove and replace the 67-foot, 360-ton steam generators through the reactor building, temporary openings in the reactor building dome, containment and steam generator enclosures were required. Precision measurements utilizing meticulous metrology practices, along with optimized 3D fit-up solutions and specialized machining enabled experts to precisely place the replacement steam generators back into the existing plant configuration.

“SGT’s performance in safely delivering this critical and technically complex project is a cornerstone in our commitment to support the long-term operations of our customers’ plants in North America,” said Catherine Cornand, senior executive vice president of the Installed Base Business Unit at Framatome.

“We are very happy to have performed a significant role for TVA in their investment in the life extension of the Watts Bar plant and its role in providing carbon-free, reliable power to the Tennessee Valley,” said Scott Reeder, Chief Executive Officer of United. “At United, our mission is to partner with our clients to deliver innovative and transformative infrastructure designed and built to meet the demands for today and for the future. As such, we are committed to continued support of nuclear technology as it takes its place in environmentally responsible carbon-free power supply.”

Steam generators serve as heat exchangers in pressurized water reactors. These components use the heat generated by the reactor to create steam that drives the turbines, which turns a generator and creates electricity.

SGT provides highly specialized heavy component replacement services and other major projects to the nuclear industry. Formed in 1991, SGT combines the knowledge of premier nuclear construction from United with Framatome’s world-leading supply of services, fuel, engineering and heavy components for nuclear power plants.

Operated by TVA in eastern Tennessee, Watts Bar Unit 2 produces 1,150 megawatts of continuous electricity, with the entire plant supplying enough power for 1.3 million homes daily.

About United
United Engineers & Constructors is an industry leading infrastructure engineering, procurement, construction and consulting company dedicated to improving lives by delivering the world’s most impactful solutions. Since 1905, we have served the power industry by providing comprehensive lifecycle services for the conventional generation, nuclear, transmission and distribution, renewable, and distributed energy markets. Together with our clients and partners, we are unified in our efforts to deliver innovative and transformative infrastructure designed and built to meet the demands of today and for the future. www.ueci.com

About Framatome
Framatome is an international leader in nuclear energy recognized for its innovative solutions and value added technologies for the global nuclear fleet. With worldwide expertise and a proven track record for reliability and performance, the company designs, services and installs components, fuel, and instrumentation and control systems for nuclear power plants. Its more than 14,000 employees work every day to help Framatome’s customers supply ever cleaner, safer and more economical low-carbon energy. Visit us at: www.framatome.com, and follow us on Twitter: @Framatome_ and LinkedIn: Framatome. Framatome is owned by the EDF Group (75.5%), Mitsubishi Heavy Industries (MHI – 19.5%) and Assystem (5%).


Contacts

United
This email address is being protected from spambots. You need JavaScript enabled to view it.

Framatome
This email address is being protected from spambots. You need JavaScript enabled to view it.

  • Third quarter 2022 GAAP earnings per share (EPS) of $1.86, Adjusted EPS (Non-GAAP) of $2.01
  • Increases quarterly dividend 7%, to $0.6125 per share, annualized to $2.45
  • Revises 2022 GAAP EPS guidance range to $3.33 to $3.43, revises Adjusted EPS (Non-GAAP) guidance range to $3.53 to $3.63 from $3.43 to $3.63

KANSAS CITY, Mo.--(BUSINESS WIRE)--Evergy, Inc. (NYSE: EVRG) today announced third quarter 2022 GAAP earnings of $428 million, or $1.86 per share, compared to GAAP earnings of $449 million, or $1.95 per share, for third quarter 2021.


Evergy’s third quarter 2022 adjusted earnings (non-GAAP) and adjusted earnings per share (non-GAAP) were $462 million and $2.01, respectively, compared to $452 million and $1.97, respectively, in third quarter 2021. Adjusted earnings (non-GAAP) and adjusted earnings per share (non-GAAP) are reconciled to GAAP earnings in the financial table included in this release.

Third quarter earnings were driven by higher weather-normalized demand, favorable weather, and higher transmission margin, partially offset by higher depreciation and amortization expense and higher interest expense.

"We finished the third quarter with solid results despite mounting challenges impacting our customers, our company and our communities – in particular, ongoing high inflation and increasing interest rates. Given results ahead of expectations driven by operational performance and warmer than normal weather, we are narrowing our 2022 adjusted earnings guidance range to $3.53 to $3.63 per share from $3.43 to $3.63 per share. We are also increasing our quarterly dividend by 7%, consistent with our stated targets," said David Campbell, Evergy President and Chief Executive Officer. "We'll make a strong push to the finish line in 2022 and drive ongoing execution as we continue to address these macroeconomic challenges in 2023."

Earnings Guidance

The Company revised its 2022 GAAP EPS guidance range to $3.33 to $3.43 from its original guidance of $3.37 to $3.57 and narrowed its 2022 adjusted EPS (Non-GAAP) guidance range to $3.53 to $3.63 from its original guidance of $3.43 to $3.63. Additionally, the Company reaffirmed its long-term adjusted EPS (Non-GAAP) annual growth target of 6% to 8% through 2025 from the $3.30 midpoint of the original 2021 adjusted EPS (Non-GAAP) guidance range. Adjusted EPS (non-GAAP) guidance is reconciled to GAAP EPS guidance in the financial table included in this release.

Dividend Declaration

The Board of Directors declared a dividend on the Company’s common stock of $0.6125 per share payable on December 20, 2022. The dividends are payable to shareholders of record as of November 18, 2022.

Earnings Conference Call

Evergy management will host a conference call Friday, November 4, with the investment community at 9:00 a.m. ET (8:00 a.m. CT). To view the webcast and presentation slides, please go to investors.evergy.com. To access via phone, investors and analysts will need to register using this link where they will be provided a phone number and access code.

Members of the media are invited to listen to the conference call and then contact Gina Penzig with any follow-up questions.

This earnings announcement, a package of detailed third-quarter financial information, the Company's quarterly report on Form 10-Q for the period ended September 30, 2022, and other filings the Company has made with the Securities and Exchange Commission are available on the Company's website at http://investors.evergy.com.

Adjusted Earnings (non-GAAP) and Adjusted Earnings Per Share (non-GAAP)

Effective in the third quarter of 2022, the calculation of adjusted earnings (non-GAAP) and adjusted EPS (non- GAAP) excludes the revenues collected from customers for the return on investment of the retired Sibley Station in the current period and the subsequent deferral of the cumulative amount of revenues collected since December 2018 for expected future refunds to customers. Management believes that this is a more representative measure of Evergy's recurring earnings, assists in the comparability of results and is consistent with how management reviews performance. Evergy's adjusted earnings (non-GAAP) and adjusted EPS (non-GAAP) for the three months ended and year to date September 30, 2021 have been recast, as applicable, to conform to the current year presentation.

In addition to net income attributable to Evergy, Inc. and diluted EPS, Evergy's management uses adjusted earnings (non-GAAP) and adjusted EPS (non-GAAP) to evaluate earnings and EPS without i.) the income or costs resulting from non-regulated energy marketing margins from the February 2021 winter weather event; ii.) gains or losses related to equity investments subject to a restriction on sale; iii.) the revenues collected from customers for the return on investment of the retired Sibley Station in the current period and the subsequent deferral of the cumulative amount of revenues collected since December 2018 for expected future refunds to customers; iv.) the estimated impairment loss on Sibley Unit 3; v.) the mark-to-market impacts of economic hedges related to Evergy Kansas Central's non-regulated 8% ownership share of Jeffrey Energy Center; and vi.) costs resulting from executive transition, severance and advisor expenses.

Adjusted earnings (non-GAAP) and adjusted EPS (non-GAAP) are intended to enhance an investor's overall understanding of results. Management believes that adjusted earnings (non-GAAP) provides a meaningful basis for evaluating Evergy's operations across periods because it excludes certain items that management does not believe are indicative of Evergy's ongoing performance or that can create period to period earnings volatility.

Adjusted earnings (non-GAAP) and adjusted EPS (non-GAAP) are used internally to measure performance against budget and in reports for management and the Evergy Board. Adjusted earnings (non-GAAP) and adjusted EPS (non-GAAP) are financial measures that are not calculated in accordance with GAAP and may not be comparable to other companies' presentations or more useful than the GAAP information provided elsewhere in this report.

The following tables provide a reconciliation between net income attributable to Evergy, Inc. and diluted earnings per common share as determined in accordance with GAAP and adjusted earnings (non-GAAP) and adjusted earnings per share (non-GAAP).

Evergy, Inc

Consolidated Earnings and Diluted Earnings Per Share

(Unaudited)


Earnings
(Loss)


Earnings
(Loss)
per
Diluted
Share


Earnings
(Loss)


Earnings
(Loss)
per
Diluted
Share

Three Months Ended September 30

2022


2021


(millions, except per share amounts)

Net income attributable to Evergy, Inc.

$

428.2


$

1.86


$

449.4


$

1.95


Non-GAAP reconciling items:


Non-regulated energy marketing margin related to February 2021 winter weather event, pre-tax(a)


2.1


0.01


Sibley Station return on investment, pre-tax(b)


44.4


0.19


(3.1

)


(0.01

)

Mark-to-market impact of JEC economic hedges, pre-tax(c)


(10.3

)


(0.04

)


Non-regulated energy marketing costs related to February 2021 winter weather event, pre-tax(d)


0.3


1.9


0.01


Executive transition costs, pre-tax(e)


0.7


3.3


0.02


Advisor expenses, pre-tax(g)


0.6


1.2


Estimated impairment loss on Sibley Unit 3, pre-tax(h)


6.0


0.03


Income tax benefit(j)


(9.7

)


(0.04

)


(0.3

)


Adjusted earnings (non-GAAP)

$

462.3


$

2.01


$

452.4


$

1.97


Earnings
(Loss)


Earnings
(Loss)
per

Diluted
Share


Earnings
(Loss)


Earnings
(Loss)
per
Diluted
Share

Year to Date September 30

2022


2021


(millions, except per share amounts)

Net income attributable to Evergy, Inc.

$

745.2


$

3.23


$

826.3


$

3.60


Non-GAAP reconciling items:


Non-regulated energy marketing margin related to February 2021 winter weather event, pre-tax(a)


2.1


0.01


(95.0

)


(0.42

)

Sibley Station return on investment, pre-tax(b)


38.2


0.17


(9.3

)


(0.04

)

Mark-to-market impact of JEC economic hedges, pre-tax(c)


(10.3

)


(0.04

)


Non-regulated energy marketing costs related to February 2021 winter weather event, pre-tax(d)


0.9


5.9


0.03


Executive transition costs, pre-tax(e)


0.7


10.6


0.05


Severance costs, pre-tax(f)


2.8


0.01


Advisor expenses, pre-tax(g)


3.1


0.01


8.4


0.04


Estimated impairment loss on Sibley Unit 3, pre-tax(h)


6.0


0.03


Restricted equity investment losses, pre-tax(i)


16.3


0.07


Income tax expense (benefit)(j)


(12.5

)


(0.05

)


18.4


0.08


Adjusted earnings (non-GAAP)

$

789.7


$

3.43


$

768.1


$

3.35


(a)


Reflects non-regulated energy marketing margins related to the February 2021 winter weather event and are included in operating revenues on the consolidated statements of comprehensive income.

(b)


Reflects revenues collected from customers for the return on investment of the retired Sibley Station in the current period and the subsequent deferral of the cumulative amount of revenues collected since December 2018 for expected future refunds to customers and are included in operating revenues on the consolidated statements of comprehensive income.

(c)


Reflects mark to market gains or losses related to forward contracts for natural gas and electricity entered into as economic hedges against fuel price volatility related to Evergy Kansas Central's non-regulated 8% ownership share of JEC and are included in operating revenues on the consolidated statements of comprehensive income.

(d)


Reflects non-regulated energy marketing incentive compensation costs related to the February 2021 winter weather event and are included in operating and maintenance expense on the consolidated statements of comprehensive income.

(e)


Reflects costs associated with executive transition including inducement bonuses, severance agreements and other transition expenses and are included in operating and maintenance expense on the consolidated statements of comprehensive income.

(f)


Reflects severance costs incurred associated with certain voluntary severance programs at the Evergy Companies and are included in operating and maintenance expense on the consolidated statements of comprehensive income.

(g)


Reflects advisor expenses incurred associated with strategic planning and are included in operating and maintenance expense on the consolidated statements of comprehensive income.

(h)


Reflects the estimated impairment loss on Sibley Unit 3 and is included in estimated impairment loss on Sibley Unit 3 on the consolidated statements of comprehensive income.

(i)


Reflects losses related to equity investments which were subject to a restriction on sale and are included in investment earnings (loss) on the consolidated statements of comprehensive income.

(j)


Reflects an income tax effect calculated at a statutory rate of approximately 22%, with the exception of certain non-deductible items.

GAAP to Non-GAAP Earnings Guidance


Original 2021
Earnings per
Diluted Share

Guidance

Original 2022

Earnings per

Diluted Share

Guidance

Revised 2022
Earnings per
Diluted Share

Guidance

GAAP EPS attributable to Evergy, Inc.

$3.14 - $3.34

$3.37 - $3.57

$3.33 - $3.43

Non-GAAP reconciling items:


Non-regulated energy marketing margin related to February 2021 winter weather event, pre-tax(a)

-


0.01

Sibley Station return on investment, pre-tax(b)

-


0.17

Mark-to-market impact on JEC economic hedges, pretax(c)

-


(0.04)

Executive transition cost, pre-tax(d)

0.03


-

Advisor expense, pre-tax(e)

0.05

0.01

0.01

Estimated impairment loss on Sibley Unit 3, pre-tax(f)

-


0.03

Restricted equity investment losses, pre-tax(g)

-

0.07

0.07

Income tax benefit(h)

(0.02)

(0.02)

(0.05)

Adjusted EPS (non-GAAP)

$3.20 - $3.40

$3.43 - $3.63

$3.53 - $3.63

(a)


Reflects non-regulated energy marketing margins related to the February 2021 winter weather event and are included in operating revenues on the consolidated statements of comprehensive income.

(b)


Reflects revenues collected from customers for the return on investment of the retired Sibley Station and the subsequent deferral of these revenues collected since December 2018 for expected future refunds to customers and are included in operating revenues on the consolidated statements of comprehensive income.

(c)


Reflects mark to market gains or losses related to forward contracts for natural gas and electricity entered into as economic hedges against fuel price volatility related to Evergy Kansas Central's non-regulated 8% ownership share of JEC and are included in operating revenues on the consolidated statements of comprehensive income.

(d)


Reflects costs associated with executive transition including inducement bonuses, severance agreements and other transition expenses and are included in operating and maintenance expense on the consolidated statements of comprehensive income.

(e)


Reflects advisor expenses incurred associated with strategic planning and are included in operating and maintenance expense on the consolidated statements of comprehensive income.

(f)


Reflects the estimated impairment loss on Sibley Unit 3 and is included in estimated impairment loss on Sibley Unit 3 on the consolidated statements of comprehensive income.

(g)


Reflects losses related to equity investments which were subject to a restriction on sale and are included in investment earnings (loss) on the consolidated statements of comprehensive income.

(h)


Reflects an income tax effect calculated at a statutory rate of approximately 22%, with the exception of certain non-deductible items.

About Evergy

Evergy, Inc. (NYSE: EVRG), serves 1.6 million customers in Kansas and Missouri. Evergy’s mission is to empower a better future. Our focus remains on producing, transmitting and delivering reliable, affordable, and sustainable energy for the benefit of our stakeholders. Today, about half of Evergy’s power comes from carbon-free sources, creating more reliable energy with less impact to the environment. We value innovation and adaptability to give our customers better ways to manage their energy use, to create a safe, diverse and inclusive workplace for our employees, and to add value for our investors. Headquartered in Kansas City, our employees are active members of the communities we serve.

For more information about Evergy, visit us at http://investors.evergy.com.

Forward Looking Statements

Statements made in this document that are not based on historical facts are forward-looking, may involve risks and uncertainties, and are intended to be as of the date when made. Forward-looking statements include, but are not limited to, statements relating to Evergy's strategic plan, including, without limitation, those related to earnings per share, dividend, operating and maintenance expense and capital investment goals; the outcome of legislative efforts and regulatory and legal proceedings; future energy demand; future power prices; plans with respect to existing and potential future generation resources; the availability and cost of generation resources and energy storage; target emissions reductions; and other matters relating to expected financial performance or affecting future operations. Forward-looking statements are often accompanied by forward-looking words such as “anticipates,” “believes,” “expects,” “estimates,” “forecasts,” “should,” “could,” “may,” “seeks,” “intends,” “proposed,” “projects,” “planned,” “target,” “outlook,” “remain confident,” “goal,” “will” or other words of similar meaning. Forward-looking statements involve risks, uncertainties and other factors that could cause actual results to differ materially from the forward-looking information.

In connection with the safe harbor provisions of the Private Securities Litigation Reform Act of 1995, Evergy, Inc., Evergy Kansas Central, Inc. and Evergy Metro, Inc. (collectively, the Evergy Companies) are providing a number of risks, uncertainties and other factors that could cause actual results to differ from the forward-looking information. These risks, uncertainties and other factors include, but are not limited to: economic and weather conditions and any impact on sales, prices and costs; changes in business strategy or operations; the impact of federal, state and local political, legislative, judicial and regulatory actions or developments, including deregulation, re-regulation, securitization and restructuring of the electric utility industry; decisions of regulators regarding, among other things, customer rates and the prudency of operational decisions such as capital expenditures and asset retirements; changes in applicable laws, regulations, rules, principles or practices, or the interpretations thereof, governing tax, accounting and environmental matters, including air and water quality and waste management and disposal; the impact of climate change, including increased frequency and severity of significant weather events and the extent to which counterparties are willing to do business with, finance the operations of or purchase energy from the Evergy Companies due to the fact that the Evergy Companies operate coal-fired generation; prices and availability of electricity and natural gas in wholesale markets; market perception of the energy industry and the Evergy Companies; the impact of the Coronavirus (COVID-19) pandemic on, among other things, sales, results of operations, financial condition, liquidity and cash flows, and also on operational issues, such as supply chain issues and the availability and ability of the Evergy Companies’ employees and suppliers to perform the functions that are necessary to operate the Evergy Companies; changes in the energy trading markets in which the Evergy Companies participate, including retroactive repricing of transactions by regional transmission organizations (RTO) and independent system operators; financial market conditions and performance, including changes in interest rates and credit spreads and in availability and cost of capital and the effects on derivatives and hedges, nuclear decommissioning trust and pension plan assets and costs; impairments of long-lived assets or goodwill; credit ratings; inflation rates; the transition to a replacement for the London Interbank Offered Rate (LIBOR) benchmark interest rate; effectiveness of risk management policies and procedures and the ability of counterparties to satisfy their contractual commitments; impact of physical and cybersecurity breaches, criminal activity, terrorist attacks, acts of war and other disruptions to the Evergy Companies’ facilities or information technology infrastructure or the facilities and infrastructure of third-party service providers on which the Evergy Companies rely; Impact of the Russian, Ukrainian conflict on the global energy market; ability to carry out marketing and sales plans; cost, availability, quality and timely provision of equipment, supplies, labor and fuel; ability to achieve generation goals and the occurrence and duration of planned and unplanned generation outages; delays and cost increases of generation, transmission, distribution or other projects; the Evergy Companies’ ability to manage their transmission and distribution development plans and transmission joint ventures; the inherent risks associated with the ownership and operation of a nuclear facility, including environmental, health, safety, regulatory and financial risks; workforce risks, including those related to the Evergy Companies’ ability to attract and retain qualified personnel, maintain satisfactory relationships with their labor unions and manage costs of, or changes in, wages, retirement, health care and other benefits; disruption, costs and uncertainties caused by or related to the actions of individuals or entities, such as activist shareholders or special interest groups, that seek to influence Evergy’s strategic plan, financial results or operations; the possibility that strategic initiatives, including mergers, acquisitions and divestitures, and long-term financial plans, may not create the value that they are expected to achieve in a timely manner or at all; difficulties in maintaining relationships with customers, employees, regulators or suppliers; and other risks and uncertainties.

This list of factors is not all-inclusive because it is not possible to predict all factors. You should also carefully consider the information contained in our other filings with the Securities and Exchange Commission (SEC). Additional risks and uncertainties are discussed in the Annual Report on Form 10-K for the year ended December 31, 2021, filed by the Evergy Companies with the SEC, and from time to time in current reports on Form 8-K and quarterly reports on Form 10-Q filed by the Evergy Companies with the SEC. Each forward-looking statement speaks only as of the date of the particular statement. The Evergy Companies undertake no obligation to publicly update or revise any forward-looking statement, whether as a result of new information, future events or otherwise, except as required by law.


Contacts

Investor Contact:
Pete Flynn
Director, Investor Relations
Phone: 816-652-1060
This email address is being protected from spambots. You need JavaScript enabled to view it.

Media Contact:
Gina Penzig
Manager, External Communications
Phone: 785-508-2410
This email address is being protected from spambots. You need JavaScript enabled to view it.
Media line: 888-613-0003

CONSTRUCT Business Operations Academy grads gained core competencies for job placement in energy, construction industries

CHICAGO--(BUSINESS WIRE)--ComEd today hosted community and workforce development partners for a graduation event honoring 36 new graduates of the 2022 CONSTRUCT Business Operations Academy program, which increases the pool of qualified minority candidates for entry-level administrative and project coordinator roles in the energy and construction industries.

The program, launched last year, is part of ComEd’s ongoing work to scale job training and education programs that will prepare communities for growing roles in the utility and construction industries.

“To ensure a pipeline of diverse, skilled and local talent that will power the clean energy transformation in Illinois, ComEd is deeply invested supporting and expanding job training and education programs,” said Louie Binswanger, SVP of governmental and regulatory affairs at ComEd. “Programs like the CONSTRUCT Business Operations Academy play a critical role as we work to connect more residents to skills training needed to take on jobs in energy and infrastructure. Congratulations to the graduates for completing this program which will prepare them for meaningful, well-paying careers in our field and a chance to impact their communities for the future.”

During the six-week program, participants learned the basics of business operations and project management, developed professional skills needed to succeed in an office environment, completed a capstone project with industry-specific case studies, and received job placement and support services from ComEd and its workforce agency partners. Participants who successfully completed the program received a $1,000 stipend and a Business Operations 101 certificate from St. Augustine College, as well as networking opportunities that can lead to key roles with local utility or construction companies.

“Participating in the ComEd Business Operations Academy has given me the confidence I need as I take next steps to pursue a career in project management,” said Jasmine Henderson-Dixon, a 2022 Business Operations Academy graduate and resident of Chicago’s Roseland community. “I am so grateful for the opportunity to learn through this 6-week program, which challenged me in the best way possible, and also gave me a chance to receive support and guidance form ComEd, my instructors, as well as my classmates. I’m proud of my accomplishments and look forward to next steps as I now feel I am ready to take the PMP exam.”

The program first launched in 2021 and prepared a cohort of primarily Black women for roles with ComEd’s administrative, project coordinator and customer service roles. The current graduating class is highly diverse, with nearly 90 percent minority graduates, and 21 total female participants in the graduating class. Participants represent communities across the entire region, with 27 zip codes represented in the class.

The Business Operations Academy training program is administered with support from several workforce agency partners, including Cara Collective, the Chicago Urban League, the Quad County Urban League, the YWCA Metropolitan Chicago and INTREN, which funds the program alongside ComEd.

“We are honored to partner with ComEd on their CONSTRUCT Business Operations Academy. Cara Collective’s mission is to build an inclusive economy by developing employment pathways,” said Kathleen St. Louis Caliento, President and CEO of Cara Collective. “Programs like CONSTRUCT help make those pathways a reality. Now, our job seekers are not only able to build an array of skillsets, they have the opportunity for gainful employment in the utilities and power industry.”

“INTREN is proud to have worked with CONSTRUCT for the last 10 years to support ComEd’s commitment to invite and train local, diverse candidates into the construction field,” said Matthew Turk, COO of INTREN. “Once again ComEd has creatively and boldly developed a new path forward, the Business Operations Academy, to introduce and train candidates for the backoffice and field work in the utility construction industry. We stand with ComEd in the goal to change lives and communities.”

ComEd's investments in training and recruitment help create a local talent pipeline that is prepared to meet future demands, as clean energy jobs are on the rise. Last year alone, the U.S. energy sector added more than 300,000 new jobs, outpacing overall U.S. employment growth (USEER 2022). Growth of the energy sector is expected to skyrocket thanks to significant federal investments that will help catalyze clean energy infrastructure development via the Inflation Reduction Act and the Infrastructure Investment and Jobs Act (IIJA).

ComEd offers a range of in-depth job training and apprenticeship style programs, including the CONSTRUCT Infrastructure Academy, Dawson Tech Overhead Electrical Line Workers training program – a partnership with the City Colleges of Chicago – and scholarship programs to support students in obtaining STEM degrees. As a result of its growing investment in career readiness and education across the region, ComEd’s job training and STEM education programs last year directly benefitted nearly 1,700 local residents.

For more on these career readiness programs, please visit www.comed.com/cleanenergyjobs.

# # #

ComEd is a unit of Chicago-based Exelon Corporation (NASDAQ: EXC), a Fortune 200 energy company with approximately 10 million electricity and natural gas customers – the largest number of customers in the U.S. ComEd powers the lives of more than 4 million customers across northern Illinois, or 70 percent of the state’s population. For more information visit ComEd.com, and connect with the company on Facebook, Twitter, Instagram and YouTube.


Contacts

ComEd
Media Relations
312-394-3500

WALTHAM, Mass.--(BUSINESS WIRE)--Global Partners LP (NYSE: GLP) (“Global” or the “Partnership”) today reported financial results for the third quarter ended September 30, 2022.


“We delivered strong third-quarter results, driven by growth across all three segments of our business,” said Eric Slifka, the Partnership’s President and Chief Executive Officer. “Our Gasoline Distribution and Station Operations (GDSO) segment continued to perform well in the third quarter, reflecting increased activity at our convenience stores as a result of our recent acquisitions and higher retail fuel margins year-over-year. In our Wholesale segment, we continued to effectively manage our fuel inventory amid sustained backwardation in the gasoline and distillates markets. Our Commercial segment saw a year-over-year increase in bunkering activity.

“During the third quarter we expanded our GDSO footprint in the mid-Atlantic with the acquisition of Tidewater Convenience, a transaction that included 15 retail fuel and convenience store locations in Virginia,” Slifka continued. “At the end of the quarter, our GDSO portfolio totaled 1,684 sites, including 356 company-operated locations. Our portfolio of company-operated locations has grown more than 20 percent year over year. The M&A pipeline remains very active across all areas of our business, and we continue to evaluate potential opportunities that align with our strategic growth objectives.”

Financial Highlights

Net income was $111.4 million, or $3.12 per diluted common limited partner unit, for the third quarter of 2022 compared with net income of $33.6 million, or $0.86 per diluted common limited partner unit, in the same period of 2021.

Earnings before interest, taxes, depreciation and amortization (EBITDA) was $168.2 million in the third quarter of 2022 compared with $79.4 million in the same period of 2021.

Adjusted EBITDA was $168.5 million in the third quarter of 2022 versus $79.2 million in the same period of 2021.

Distributable cash flow (DCF) was $128.0 million in the third quarter of 2022 compared with $49.7 million in the same period of 2021.

Gross profit in the third quarter of 2022 was $328.4 million compared with $203.1 million in the same period of 2021, driven primarily by the GDSO and Wholesale segments.

Combined product margin, which is gross profit adjusted for depreciation allocated to cost of sales, was $351.3 million in the third quarter of 2022 compared with $223.9 million in the same period of 2021.

Combined product margin, EBITDA, Adjusted EBITDA, and DCF are non-GAAP (Generally Accepted Accounting Principles) financial measures, which are explained in greater detail below under “Use of Non-GAAP Financial Measures.” Please refer to Financial Reconciliations included in this news release for reconciliations of these non-GAAP financial measures to their most directly comparable GAAP financial measures for the three and nine months ended September 30, 2022 and 2021.

GDSO segment product margin was $261.6 million in the third quarter of 2022 compared with $177.7 million in the same period of 2021. Product margin from gasoline distribution increased to $188.0 million from $112.4 million in the year earlier period, primarily due to higher fuel margins (cents per gallon) and an increase in volume sold due to recent acquisitions. Product margin from station operations increased to $73.6 million from $65.3 million in the third quarter of 2021, primarily due to recent acquisitions.

Wholesale segment product margin was $79.3 million in the third quarter of 2022 compared with $42.3 million in the same period of 2021. The increase was primarily driven by more favorable market conditions, largely in gasoline and distillates.

Commercial segment product margin was $10.4 million in the third quarter of 2022 compared with $3.9 million in the same period of 2021, reflecting an increase in bunkering activity.

Sales were $4.6 billion in the third quarter of 2022 compared with $3.3 billion in the same period of 2021. Wholesale segment sales were $2.5 billion in the third quarter of 2022 compared with $1.8 billion in the third quarter of 2021. GDSO segment sales were $1.8 billion in the third quarter of 2022 versus $1.3 billion in the same period of 2021. Commercial segment sales were $326.2 million in the third quarter of 2022 compared with $202.5 million in the same period of 2021.

Volume was 1.3 billion gallons in each of the third quarters of 2022 and 2021. Wholesale segment volume was 779.2 million gallons in the third quarter of 2022 compared with 813.4 million gallons in the same period of 2021. GDSO volume was 430.0 million gallons in the third quarter of 2022 compared with 416.8 million gallons in the same period of 2021. Commercial segment volume was 102.1 million gallons in the third quarter of 2022 compared with 101.2 million gallons in the same period of 2021.

Recent Developments

  • Global expanded its footprint in the mid-Atlantic region with the acquisition of Tidewater Convenience, Inc. The purchase included 15 gas stations and convenience store locations in Southeast Virginia.
  • Global announced a quarterly cash distribution of $0.6250 per unit, or $2.50 per unit on an annualized basis, on all of its outstanding common units for the period from July 1, 2022 to September 30, 2022. The distribution will be paid November 14, 2022 to unitholders of record as of the close of business on November 8, 2022.

Business Outlook

“We have executed well through the first nine months of the year and begin the final quarter of 2022 with strong operational and financial momentum,” Slifka said. “While economic uncertainty associated with the inflationary environment merits a level of caution, we remain focused on leveraging our supply, marketing and terminalling assets to drive profitable growth across our businesses.”

Financial Results Conference Call

Management will review the Partnership’s third-quarter 2022 financial results in a teleconference call for analysts and investors today.

Time:

10:00 a.m. ET

Dial-in numbers:

(877) 709-8155 (U.S. and Canada)

(201) 689-8881 (International)

Please plan to dial in to the call at least 10 minutes prior to the start time. The call also will be webcast live and archived on Global Partners’ website, https://ir.globalp.com.

Use of Non-GAAP Financial Measures

Product Margin

Global Partners views product margin as an important performance measure of the core profitability of its operations. The Partnership reviews product margin monthly for consistency and trend analysis. Global Partners defines product margin as product sales minus product costs. Product sales primarily include sales of unbranded and branded gasoline, distillates, residual oil, renewable fuels and crude oil, as well as convenience store and prepared food sales, gasoline station rental income and revenue generated from logistics activities when the Partnership engages in the storage, transloading and shipment of products owned by others. Product costs include the cost of acquiring products and all associated costs including shipping and handling costs to bring such products to the point of sale as well as product costs related to convenience store items and costs associated with logistics activities. The Partnership also looks at product margin on a per unit basis (product margin divided by volume). Product margin is a non-GAAP financial measure used by management and external users of the Partnership’s consolidated financial statements to assess its business. Product margin should not be considered an alternative to net income, operating income, cash flow from operations, or any other measure of financial performance presented in accordance with GAAP. In addition, product margin may not be comparable to product margin or a similarly titled measure of other companies.

EBITDA and Adjusted EBITDA

EBITDA and Adjusted EBITDA are non-GAAP financial measures used as supplemental financial measures by management and may be used by external users of Global Partners’ consolidated financial statements, such as investors, commercial banks and research analysts, to assess the Partnership’s:

  • compliance with certain financial covenants included in its debt agreements;
  • financial performance without regard to financing methods, capital structure, income taxes or historical cost basis;
  • ability to generate cash sufficient to pay interest on its indebtedness and to make distributions to its partners;
  • operating performance and return on invested capital as compared to those of other companies in the wholesale, marketing, storing and distribution of refined petroleum products, gasoline blendstocks, renewable fuels, crude oil and propane, and in the gasoline stations and convenience stores business, without regard to financing methods and capital structure; and
  • viability of acquisitions and capital expenditure projects and the overall rates of return of alternative investment opportunities.

Adjusted EBITDA is EBITDA further adjusted for gains or losses on the sale and disposition of assets and goodwill and long-lived asset impairment charges. EBITDA and Adjusted EBITDA should not be considered as alternatives to net income, operating income, cash flow from operating activities or any other measure of financial performance or liquidity presented in accordance with GAAP. EBITDA and Adjusted EBITDA exclude some, but not all, items that affect net income, and these measures may vary among other companies. Therefore, EBITDA and Adjusted EBITDA may not be comparable to similarly titled measures of other companies.

Distributable Cash Flow

Distributable cash flow is an important non-GAAP financial measure for the Partnership’s limited partners since it serves as an indicator of success in providing a cash return on their investment. Distributable cash flow as defined by the Partnership’s partnership agreement is net income plus depreciation and amortization minus maintenance capital expenditures, as well as adjustments to eliminate items approved by the audit committee of the board of directors of the Partnership’s general partner that are extraordinary or non-recurring in nature and that would otherwise increase distributable cash flow.

Distributable cash flow as used in our partnership agreement also determines our ability to make cash distributions on our incentive distribution rights. The investment community also uses a distributable cash flow metric similar to the metric used in our partnership agreement with respect to publicly traded partnerships to indicate whether or not such partnerships have generated sufficient earnings on a current or historic level that can sustain distributions on preferred or common units or support an increase in quarterly cash distributions on common units. Our partnership agreement does not permit adjustments for certain non-cash items, such as net losses on the sale and disposition of assets and goodwill and long-lived asset impairment charges.

Distributable cash flow should not be considered as an alternative to net income, operating income, cash flow from operations, or any other measure of financial performance presented in accordance with GAAP. In addition, distributable cash flow may not be comparable to distributable cash flow or similarly titled measures of other companies.

About Global Partners LP

With approximately 1,700 locations primarily in the Northeast, Global Partners is one of the region’s largest independent owners, suppliers and operators of gasoline stations and convenience stores. Global also owns, controls or has access to one of the largest terminal networks in New England and New York, through which it distributes gasoline, distillates, residual oil and renewable fuels to wholesalers, retailers and commercial customers. In addition, Global engages in the transportation of petroleum products and renewable fuels by rail from the mid-continental U.S. and Canada. Global, a master limited partnership, trades on the New York Stock Exchange under the ticker symbol “GLP.” For additional information, visit www.globalp.com.

Forward-looking Statements

Certain statements and information in this press release may constitute “forward-looking statements.” The words “believe,” “expect,” “anticipate,” “plan,” “intend,” “foresee,” “should,” “would,” “could” or other similar expressions are intended to identify forward-looking statements, which are generally not historical in nature, although not all forward-looking statements contain such identifying words. These forward-looking statements are based on Global’s current expectations and beliefs concerning future developments and their potential effect on the Partnership. While management believes that these forward-looking statements are reasonable as and when made, there can be no assurance that future developments affecting the Partnership will be those that it anticipates. Forward-looking statements involve significant risks and uncertainties (some of which are beyond the Partnership’s control) including, without limitation, the impact and duration of the COVID-19 pandemic and its impact on our counterparties, our customers and our operations and other assumptions that could cause actual results to differ materially from the Partnership's historical experience and present expectations or projections. We believe these assumptions are reasonable given currently available information. Our assumptions and future performance are subject to a wide range of business risks, uncertainties and factors, which are described in our filings with the Securities and Exchange Commission (SEC).

For additional information regarding known material factors that could cause actual results to differ from the Partnership’s projected results, please see Global’s filings with the SEC, including its Annual Report on Form 10-K, Quarterly Reports on Form 10-Q and Current Reports on Form 8-K.

Readers are cautioned not to place undue reliance on forward-looking statements, which speak only as of the date hereof. Global undertakes no obligation to publicly update or revise any forward-looking statements after the date they are made, whether as a result of new information, future events or otherwise.

 
GLOBAL PARTNERS LP
CONSOLIDATED STATEMENTS OF OPERATIONS
(In thousands, except per unit data)
(Unaudited)
 
Three Months Ended Nine Months Ended
September 30, September 30,

2022


2021


2022


2021

Sales $

4,626,747


$

3,323,910


$

14,450,935


$

9,156,382


Cost of sales

4,298,368


3,120,852


13,634,842


8,630,247


Gross profit

328,379


203,058


816,093


526,135


Costs and operating expenses:
Selling, general and administrative expenses

65,123


54,674


182,274


155,029


Operating expenses

119,549


92,151


327,307


260,848


Amortization expense

2,118


2,742


6,734


8,138


Net gain on sale and disposition of assets

292


(192

)

(81,468

)

(675

)

Long-lived asset impairment

-


-


-


188


Total costs and operating expenses

187,082


149,375


434,847


423,528


Operating income

141,297


53,683


381,246


102,607


Interest expense

(19,047

)

(19,660

)

(61,577

)

(60,339

)

 
Income before income tax expense

122,250


34,023


319,669


42,268


Income tax expense

(10,811

)

(386

)

(14,938

)

(789

)

 
Net income

111,439


33,637


304,731


41,479


Less: General partner's interest in net income, including
incentive distribution rights

2,027


993


5,370


2,581


Less: Preferred limited partner interest in net income

3,463


3,463


10,389


8,746


Net income attributable to common limited partners $

105,949


$

29,181


$

288,972


$

30,152


Basic net income per common limited partner unit (1) $

3.12


$

0.86


$

8.52


$

0.89


Diluted net income per common limited partner unit (1) $

3.12


$

0.86


$

8.48


$

0.88


Basic weighted average common limited partner units outstanding

33,917


33,897


33,932


33,934


Diluted weighted average common limited partner units outstanding

34,008


34,087


34,058


34,225


(1) Under the Partnership's partnership agreement, for any quarterly period, the incentive distribution rights ("IDRs") participate in net income only to the extent of the amount of cash distributions actually declared, thereby excluding the IDRs from participating in the Partnership's undistributed net income or losses. Accordingly, the Partnership's undistributed net income or losses is assumed to be allocated to the common unitholders and to the General Partner's general partner interest. Net income attributable to common limited partners is divided by the weighted average common units outstanding in computing the net income per limited partner unit.

 
GLOBAL PARTNERS LP
CONSOLIDATED BALANCE SHEETS
(In thousands)
(Unaudited)
 
September 30, December 31,

2022

2021

Assets
Current assets:
Cash and cash equivalents $

15,486

$

10,849

Accounts receivable, net

430,081

411,194

Accounts receivable - affiliates

3,470

1,139

Inventories

427,731

509,517

Brokerage margin deposits

28,581

33,658

Derivative assets

21,758

11,652

Prepaid expenses and other current assets

73,994

87,076

Total current assets

1,001,101

1,065,085

 
Property and equipment, net

1,217,006

1,099,348

Right of use assets, net

287,691

280,284

Intangible assets, net

28,972

26,014

Goodwill

410,826

328,135

Other assets

29,666

32,299

 
Total assets $

2,975,262

$

2,831,165


Liabilities and partners' equity
Current liabilities:
Accounts payable $

549,464

$

353,296

Working capital revolving credit facility - current portion

-

204,700

Lease liability - current portion

64,245

62,352

Environmental liabilities - current portion

4,582

4,642

Trustee taxes payable

38,344

44,223

Accrued expenses and other current liabilities

144,181

138,733

Derivative liabilities

24,425

31,654

Total current liabilities

825,241

839,600

 
Working capital revolving credit facility - less current portion

-

150,000

Revolving credit facility

99,000

43,400

Senior notes

740,589

739,310

Long-term lease liability - less current portion

231,704

228,203

Environmental liabilities - less current portion

62,749

48,163

Financing obligations

142,526

144,444

Deferred tax liabilities

65,199

56,817

Other long-term liabilities

58,794

53,461

Total liabilities

2,225,802

2,303,398

 
Partners' equity

749,460

527,767

 
Total liabilities and partners' equity $

2,975,262

$

2,831,165

 
GLOBAL PARTNERS LP
FINANCIAL RECONCILIATIONS
(In thousands)
(Unaudited)
 

Three Months Ended


Nine Months Ended

September 30,


September 30,

2022


2021


2022


2021

Reconciliation of gross profit to product margin
Wholesale segment:
Gasoline and gasoline blendstocks $

54,260


$

22,458


$

93,009


$

62,379


Other oils and related products

25,716


22,625


130,690


54,580


Crude oil

(646

)

(2,814

)

(6,706

)

(10,662

)

Total

79,330


42,269


216,993


106,297


Gasoline Distribution and Station Operations segment:
Gasoline distribution

187,994


112,446


432,732


294,001


Station operations

73,614


65,269


200,719


176,567


Total

261,608


177,715


633,451


470,568


Commercial segment

10,389


3,916


31,042


10,807


Combined product margin

351,327


223,900


881,486


587,672


Depreciation allocated to cost of sales

(22,948

)

(20,842

)

(65,393

)

(61,537

)

Gross profit $

328,379


$

203,058


$

816,093


$

526,135


Reconciliation of net income to EBITDA and Adjusted EBITDA
Net income $

111,439


$

33,637


$

304,731


$

41,479


Depreciation and amortization

26,920


25,692


78,572


76,172


Interest expense

19,047


19,660


61,577


60,339


Income tax expense

10,811


386


14,938


789


EBITDA (1)

168,217


79,375


459,818


178,779


Net loss (gain) on sale and disposition of assets

292


(192

)

(81,468

)

(675

)

Long-lived asset impairment

-


-


-


188


Adjusted EBITDA (1) $

168,509


$

79,183


$

378,350


$

178,292


Reconciliation of net cash provided by operating activities to EBITDA and Adjusted EBITDA
Net cash provided by operating activities $

191,713


$

152,615


$

576,906


$

99,057


Net changes in operating assets and liabilities and certain non-cash items

(53,354

)

(93,286

)

(193,603

)

18,594


Interest expense

19,047


19,660


61,577


60,339


Income tax expense

10,811


386


14,938


789


EBITDA (1)

168,217


79,375


459,818


178,779


Net loss (gain) on sale and disposition of assets

292


(192

)

(81,468

)

(675

)

Long-lived asset impairment

-


-


-


188


Adjusted EBITDA (1) $

168,509


$

79,183


$

378,350


$

178,292


Reconciliation of net income to distributable cash flow
Net income $

111,439


$

33,637


$

304,731


$

41,479


Depreciation and amortization

26,920


25,692


78,572


76,172


Amortization of deferred financing fees

1,347


1,211


4,084


3,810


Amortization of routine bank refinancing fees

(1,138

)

(1,002

)

(3,457

)

(3,052

)

Maintenance capital expenditures

(10,548

)

(9,841

)

(27,844

)

(28,135

)

Distributable cash flow (1)(2)(3)

128,020


49,697


356,086


90,274


Distributions to preferred unitholders (4)

(3,463

)

(3,463

)

(10,389

)

(8,746

)

Distributable cash flow after distributions to preferred unitholders $

124,557


$

46,234


$

345,697


$

81,528


Reconciliation of net cash provided by operating activities to distributable cash flow
Net cash provided by operating activities $

191,713


$

152,615


$

576,906


$

99,057


Net changes in operating assets and liabilities and certain non-cash items

(53,354

)

(93,286

)

(193,603

)

18,594


Amortization of deferred financing fees

1,347


1,211


4,084


3,810


Amortization of routine bank refinancing fees

(1,138

)

(1,002

)

(3,457

)

(3,052

)

Maintenance capital expenditures

(10,548

)

(9,841

)

(27,844

)

(28,135

)

Distributable cash flow (1)(2)(3)

128,020


49,697


356,086


90,274


Distributions to preferred unitholders (4)

(3,463

)

(3,463

)

(10,389

)

(8,746

)

Distributable cash flow after distributions to preferred unitholders $

124,557


$

46,234


$

345,697


$

81,528


(1) EBITDA, Adjusted EBITDA and distributable cash flow for each of the three and nine months ended September 30, 2021 include a $3.1 million expense for compensation resulting from the retirement of the Partnership's former chief financial officer in August of 2021. EBITDA, Adjusted EBITDA and distributable cash flow for the nine months ended September 30, 2021 include a $6.6 million expense for compensation and benefits resulting from the passing of the Partnership's general counsel in May of 2021. This expense relates to contractual commitments including the acceleration of grants previously awarded as well as a discretionary award in recognition of service.
(2) As defined by the Partnership's partnership agreement, distributable cash flow is not adjusted for certain non-cash items, such as net losses on the sale and disposition of assets and goodwill and long-lived asset impairment charges.
(3) Distributable cash flow for the nine months ended September 30, 2022 includes a net gain on sale and disposition of assets of $81.5 million, primarily related to the sale of the Partnership's terminal in Revere, Massachusetts in June of 2022. The respective net (loss) gain on sale and disposition of assets for the three months ended September 30, 2022 and for each of the three and nine months ended September 30, 2021 was immaterial.
(4) Distributions to preferred unitholders represent the distributions payable to the Series A preferred unitholders and the Series B preferred unitholders earned during the period. Distributions on the Series A preferred units and the Series B preferred units are cumulative and payable quarterly in arrears on February 15, May 15, August 15 and November 15 of each year.


Contacts

Gregory B. Hanson
Chief Financial Officer
Global Partners LP
(781) 894-8800

Sean T. Geary
Chief Legal Officer and Secretary
Global Partners LP
(781) 894-8800

HOUSTON--(BUSINESS WIRE)--Aris Water Solutions, Inc. (NYSE: ARIS) (“Aris” or the “Company”) today announced that its Board of Directors declared a dividend on its Class A common stock for the fourth quarter of 2022 of $0.09 per share. In conjunction with the dividend payment, a distribution of $0.09 per unit will be paid to unit holders of Solaris Midstream Holdings, LLC. The dividend will be paid on November 30, 2022 to holders of record of the Company’s Class A common stock as of the close of business on November 17, 2022. The distribution to unit holders of Solaris Midstream Holdings, LLC will be subject to the same payment and record dates.


About Aris Water Solutions, Inc.

Aris Water Solutions, Inc. is a leading, growth-oriented environmental infrastructure and solutions company that directly helps its customers reduce their water and carbon footprints. Aris delivers full-cycle water handling and recycling solutions that increase the sustainability of energy company operations. Its integrated pipelines and related infrastructure create long-term value by delivering high-capacity, comprehensive produced water management, recycling and supply solutions to operators in the core areas of the Permian Basin. For more information about the Company, visit www.ariswater.com.

Forward-Looking Statements

This press release contains forward-looking statements within the meaning of Section 27A of the Securities Act of 1933, as amended and Section 21E of the Securities Exchange Act of 1934, as amended. Examples of forward-looking statements include, but are not limited to, those regarding payments of dividends, and our implied cash flow or liquidity. In some cases, you can identify forward-looking statements by terminology such as “estimate,” “expect,” “intend,” “plan,” “believe,” “forecast,” “may,” “could” and variations of such words or similar expressions. The payment of any future dividends will be at the discretion of our board of directors. Our board of directors may elect to declare cash dividends depending on, among other things, our financial condition, results of operations, projections, liquidity, earnings, legal requirements, and restrictions in our debt. We have not adopted a written dividend policy. Forward-looking statements are based on our current expectations and assumptions regarding our business, the economy and other future conditions. Because forward-looking statements relate to the future, by their nature, they are subject to inherent uncertainties, risks and changes in circumstances that are difficult to predict. As a result, our actual results may differ materially from those contemplated by the forward-looking statements. Factors that could cause our actual results to differ materially from the results contemplated by such forward-looking statements include but are not limited to the risk factors discussed or referenced in our filings made from time to time with the SEC. Readers are cautioned not to place undue reliance on forward-looking statements, which speak only as of the date hereof. Factors or events that could cause our actual results to differ may emerge from time to time, and it is not possible for us to predict all of them. We undertake no obligation to update or revise any forward-looking statement, whether as a result of new information, future developments or otherwise, except as may be required by law.


Contacts

David Tuerff
Senior Vice President, Finance & Investor Relations
832-803-0367
This email address is being protected from spambots. You need JavaScript enabled to view it.

WIXOM, Mich.--(BUSINESS WIRE)--XL Fleet Corp. (NYSE: XL) (“XL Fleet” or the “Company”), a provider of subscription-based services that make it easy for homeowners and small businesses to own and maintain rooftop solar and battery storage, today announced that it will change its corporate name to Spruce Power Holding Corporation, effective November 14, 2022. The Company will be known as Spruce Power. Additionally, the Company will change its NYSE ticker symbol from “XL” to “SPRU” at the open of market trading on Monday, November 14, 2022.


“We are excited to execute on the next stage of our new corporate strategy with the official change of our company name,” said Eric Tech, current Chief Executive Officer of XL Fleet. “Renaming our company to Spruce Power reflects our new focus on the residential solar and energy services market. Most importantly, it positions us to build upon the strong brand recognition that Spruce has earned in the residential solar market since 2018.”

“Transitioning the Spruce Power name to our new public platform is an exciting achievement for our company,” added Christian Fong, President of Spruce Power. “Our new platform affords us the resources needed to elevate our company’s mission to a next level, and this change is only the beginning.” It is expected that Mr. Fong will be named CEO of the combined companies in the first quarter of 2023.

The Company’s common stock will continue to be listed on the NYSE. There is no action required by the Company’s current shareholders with respect to the company name or ticker symbol change. The Company’s CUSIP will change in connection with the name change.

About Spruce Power (formerly known as XL Fleet)

XL Fleet, who today announced the name change to Spruce Power, provides subscription-based services that make it easy for homeowners and small businesses to own and maintain rooftop solar and battery storage. Our as-a-service model allows consumers to access new technology without making a significant upfront investment or incurring maintenance costs. Our company has more than 52,000 subscribers across the United States. For additional information, please visit www.sprucepower.com.

Forward Looking Statements

Certain statements in this press release may constitute “forward-looking statements” within the meaning of the federal securities laws. Forward-looking statements generally are accompanied by words such as “believe,” “may,” “will,” “estimate,” “continue,” “anticipate,” “intend,” “expect,” “should,” “would,” “plan,” “predict,” “potential,” “seem,” “seek,” “future,” “outlook,” and similar expressions that predict or indicate future events or trends or that are not statements of historical matters. These statements are based on various assumptions, whether or not identified in this press release, and on the current expectations of management and are not predictions of actual performance. Forward-looking statements are subject to a number of risks and uncertainties that could cause actual results to differ materially from the forward-looking statements, including but not limited to: expectations regarding the growth of the solar industry, home electrification, electric vehicles and distributed energy resources; the ability to successfully integrate the Spruce Power acquisition; the ability of XL Fleet to implement its plans, forecasts and other expectations with respect to Spruce Power’s business and realize the expected benefits of the acquisition; the ability to identify and complete future acquisitions; the ability to develop and market new products and services; the effects of pending and future legislation; the highly competitive nature of the Company’s business and markets; the ability to execute on and consummate business plans in anticipated time frames; litigation, complaints, product liability claims and/or adverse publicity; cost increases or shortages in the components or chassis necessary to support the Company’s products and services; the introduction of new technologies; the impact of the COVID-19 pandemic on the Company’s business, results of operations, financial condition, regulatory compliance and customer experience; the potential loss of certain significant customers; privacy and data protection laws, privacy or data breaches, or the loss of data; general economic, financial, legal, political and business conditions and changes in domestic and foreign markets; the inability to convert its sales opportunity pipeline into binding orders; risks related to the rollout of the Company’s business and the timing of expected business milestones, including the ongoing global microchip shortage and limited availability of chassis from vehicle OEMs and our reliance on our suppliers; the effects of competition on the Company’s future business; the availability of capital; and the other risks discussed under the heading “Risk Factors” in the Company’s Annual Report on Form 10-K filed on March 31, 2022, subsequent Quarterly Reports on Form 10-Q and other documents that the Company files with the SEC in the future. If any of these risks materialize or our assumptions prove incorrect, actual results could differ materially from the results implied by these forward-looking statements. These forward-looking statements speak only as of the date hereof and the Company specifically disclaims any obligation to update these forward-looking statements.


Contacts

XL Fleet Investors:
This email address is being protected from spambots. You need JavaScript enabled to view it.

XL Fleet Media:
This email address is being protected from spambots. You need JavaScript enabled to view it.

DEERFIELD, Ill.--(BUSINESS WIRE)--CF Industries Holdings, Inc. (NYSE: CF) today announced that the Company will present at the following conferences in November:

  • Morgan Stanley Global Chemicals, Agriculture, and Packaging Conference at 11:00 am ET on Wednesday, November 9, 2022;
  • Credit Suisse 10th Annual Global Industrials Conference at 11:45 am ET on Wednesday, November 30, 2022.

Investors who wish to access the live conference webcasts should visit the Investor Relations section of the company’s website at www.cfindustries.com. A replay of the webcasts will be available on the CF Industries Holdings, Inc. website for 180 days following the events.

About CF Industries Holdings, Inc.

At CF Industries, our mission is to provide clean energy to feed and fuel the world sustainably. With our employees focused on safe and reliable operations, environmental stewardship, and disciplined capital and corporate management, we are on a path to decarbonize our ammonia production network – the world’s largest – to enable green and blue hydrogen and nitrogen products for energy, fertilizer, emissions abatement and other industrial activities. Our manufacturing complexes in the United States, Canada, and the United Kingdom, an unparalleled storage, transportation and distribution network in North America, and logistics capabilities enabling a global reach underpin our strategy to leverage our unique capabilities to accelerate the world’s transition to clean energy. CF Industries routinely posts investor announcements and additional information on the Company’s website at www.cfindustries.com and encourages those interested in the Company to check there frequently.


Contacts

Media
Chris Close
Director, Corporate Communications
847-405-2542 – This email address is being protected from spambots. You need JavaScript enabled to view it.

Investors
Martin Jarosick
Vice President, Treasury and Investor Relations
847-405-2045 – This email address is being protected from spambots. You need JavaScript enabled to view it.

WILLISTON, Vt.--(BUSINESS WIRE)--iSun, Inc. (NASDAQ: ISUN) (the “Company”, or “iSun”), a leading solar energy and clean mobility infrastructure company with 50 years of experience accelerating the adoption of innovative electrical technologies, today announced that it will issue third quarter 2022 results before the market opens on Tuesday, November 15, 2022.


A conference call to discuss the results will take place at 8:30 AM ET. To participate in the call, please dial 1-888-506-0062 (domestic) or 1-973-528-0011 (international), using conference ID 141389.

The live webcast can be accessed through the Company’s Investor Relations website at investors.isunenergy.com.

A webcast replay of the call will be available at the same location beginning approximately one hour after the call’s completion. A telephonic replay will be available through November 29, 2022, and can be accessed by dialing 1-877-481-4010 (domestic) or 1-919-882-2331 (international), using conference code 47018.

About iSun Inc.

Since 1972, iSun has accelerated the adoption of proven, life-improving innovations in electrification technology. iSun has been the trusted electrical contractor to Fortune 500 companies for decades and has installed clean rooms, fiber optic cables, flight simulators, and over 400 megawatts of solar systems. The Company currently provides a comprehensive suite of solar services across residential, commercial, industrial & municipal, and utility scale projects and provides solar electric vehicle charging solutions for both grid-tied and battery backed solar EV charging systems. iSun believes that the transition to clean, renewable solar energy is the most important investment to make today and is focused on profitable growth opportunities. Please visit http://www.isunenergy.com for additional information.


Contacts

For more information:
Investor Relations
This email address is being protected from spambots. You need JavaScript enabled to view it.

BOSTON--(BUSINESS WIRE)--Advent Technologies Holdings, Inc. (NASDAQ: ADN) (“Advent” or the “Company”), an innovation-driven leader in the fuel cell and hydrogen technology space, proudly announces that Von McConnell has agreed to join its board of directors.


Mr. McConnell has nearly forty years of executive experience in the telecommunications sector, including approximately twenty years working for Sprint Corporation (now T-Mobile), where his positions included serving as the Chief Operating Officer and Executive Director of Operations for Sprint’s 4G business unit. Furthermore, Mr. McConnell has also served as Sprint’s Executive Director of Advanced Labs & Innovation, where he was responsible for research and development, systems and network design, engineering, product evaluation, customer trials, and quality certification for all wireless systems and products. He is currently the founder and president of the TM Group, a successful technology consulting firm which has been engaged in venture capital acquisitions, 5G network rollouts, Division 1 university artificial intelligence programs, and other cutting edge technological commitments. Mr. McConnell is responsible for dozens of patent innovations.

I am excited to welcome Von, who has decades of experience working with cutting-edge technology, to Advent’s board of directors,” said Dr. Vasilis Gregoriou, Advent’s Chief Executive Officer and Chairman. “We look forward to leveraging his experience and relationships in two global telecommunications corporations as Advent looks to unlock the next step of its own growth.”

Mr. McConnell stated: “During my career, I have seen technology, specifically cell phones, emerge from the fringes of science fiction to mainstream adoption to being ubiquitous. I believe that Advent’s fuel cell technology has the same potential. Where clean, carbon-free energy seemed an impossible pursuit just a few years ago, Advent’s state-of-the-art, cutting-edge MEAs and fuel cells are ready to deliver on that promise as a mainstream solution to the world’s carbon crisis. I am honored to join the board and can’t wait to help Advent develop its IPCEI Green HiPo project and see it enter into long-lasting, mutually beneficial corporate partnerships deploying its fuel cells around the world.”

Mr. McConnell will assume the remainder of Katrina Fritz’s Class I term as director. Ms. Fritz resigned from the Advent board on May 27, 2022. Mr. McConnell qualifies as an independent director under the definition established in the NASDAQ listing rules.

About Advent Technologies Holdings, Inc.

Advent Technologies Holdings, Inc. is a U.S. corporation that develops, manufactures, and assembles complete fuel cell systems as well as supplying customers with critical components for fuel cells in the renewable energy sector. Advent is headquartered in Boston, Massachusetts, with offices in California, Greece, Denmark, Germany, and the Philippines. With more than 150 patents issued, pending, and/or licensed for fuel cell technology, Advent holds the IP for next-generation HT-PEM that enables various fuels to function at high temperatures and under extreme conditions – offering a flexible “Any Fuel. Anywhere.” option for the automotive, aviation, defense, oil and gas, marine, and power generation sectors. For more information, visit www.advent.energy.

Cautionary Note Regarding Forward-Looking Statements

This press release includes forward-looking statements. These forward-looking statements generally can be identified by the use of words such as “anticipate,” “expect,” “plan,” “could,” “may,” “will,” “believe,” “estimate,” “forecast,” “goal,” “project,” and other words of similar meaning. Each forward-looking statement contained in this press release is subject to risks and uncertainties that could cause actual results to differ materially from those expressed or implied by such statement. Applicable risks and uncertainties include, among others, the Company’s ability to maintain the listing of the Company’s common stock on Nasdaq; future financial performance; public securities’ potential liquidity and trading; impact from the outcome of any known and unknown litigation; ability to forecast and maintain an adequate rate of revenue growth and appropriately plan its expenses; expectations regarding future expenditures; future mix of revenue and effect on gross margins; attraction and retention of qualified directors, officers, employees and key personnel; ability to compete effectively in a competitive industry; ability to protect and enhance Advent’s corporate reputation and brand; expectations concerning its relationships and actions with technology partners and other third parties; impact from future regulatory, judicial and legislative changes to the industry; ability to locate and acquire complementary technologies or services and integrate those into the Company’s business; future arrangements with, or investments in, other entities or associations; and intense competition and competitive pressure from other companies worldwide in the industries in which the Company will operate; and the risks identified under the heading “Risk Factors” in Advent’s Annual Report on Form 10-K filed with the Securities and Exchange Commission (“SEC”) on March 31, 2022, as well as the other information filed with the SEC. Investors are cautioned not to place considerable reliance on the forward-looking statements contained in this press release. You are encouraged to read Advent’s filings with the SEC, available at www.sec.gov, for a discussion of these and other risks and uncertainties. The forward-looking statements in this press release speak only as of the date of this document, and the Company undertakes no obligation to update or revise any of these statements. Advent’s business is subject to substantial risks and uncertainties, including those referenced above. Investors, potential investors, and others should give careful consideration to these risks and uncertainties.


Contacts

Michael Trontzos
Advent Technologies Holdings, Inc.
This email address is being protected from spambots. You need JavaScript enabled to view it.

HOUSTON--(BUSINESS WIRE)--Magnolia Oil & Gas Corporation (NYSE: MGY) (“Magnolia” or the “Company”), today announced the pricing of the previously announced underwritten block trade of 7,500,000 shares of the Company’s Class A common stock (the “Class A Common Stock”) by certain affiliates of EnerVest, Ltd. (the “Selling Stockholders”) resulting in total gross proceeds of $183 million (the “Offering”). The Offering is expected to close on or about November 8, 2022, subject to customary closing conditions. The Company will not sell any shares of its Class A Common Stock in the Offering or receive any proceeds from the Offering.


In connection with the Offering, the Company has agreed to purchase from the Selling Stockholders 2,000,000 shares of the Company’s Class B common stock at a price per share equal to the price per share at which the underwriter purchases shares of the Company’s Class A Common Stock in the Offering (the “Class B Common Stock Purchase”). The Offering is not conditioned upon the completion of the Class B Common Stock Purchase, but the Class B Common Stock Purchase is conditioned upon the completion of the Offering.

Following the closing of the Offering and Class B Common Stock Purchase, the Selling Stockholders will own 8,296,077 Class A and 21,826,805 Class B shares of the Company, or approximately 14% of the total outstanding shares of the Company.

J.P. Morgan is acting as the sole book-running manager for the Offering. The Offering is being made pursuant to an effective shelf registration statement, which has been filed with the Securities and Exchange Commission (the “SEC”) and became effective August 30, 2018. The Offering will be made only by means of a preliminary prospectus supplement and the accompanying base prospectus, copies of which may be obtained on the SEC’s website at www.sec.gov. Alternatively, J.P. Morgan will arrange to send you the preliminary prospectus supplement and related base prospectus if you request them by contacting: J.P. Morgan Securities LLC, c/o Broadridge Financial Solutions, 1155 Long Island Avenue, Edgewood, NY 11717, telephone: 1-866-803-9204, or by email at This email address is being protected from spambots. You need JavaScript enabled to view it..

This press release is neither an offer to sell nor a solicitation of an offer to buy any securities, nor shall there be any sale of any such securities in any state or jurisdiction in which such offer, solicitation or sale would be unlawful prior to registration or qualification under the securities laws of any such state or jurisdiction.

About Magnolia Oil & Gas Corporation

Magnolia (MGY) is a publicly traded oil and gas exploration and production company with operations primarily in South Texas in the core of the Eagle Ford Shale and Austin Chalk formations. Magnolia focuses on generating value for shareholders through steady production growth, strong pre-tax margins, and free cash flow. For more information, visit www.magnoliaoilgas.com.

Forward-Looking Statements

The information in this press release includes forward-looking statements within the meaning of Section 27A of the Securities Act of 1933, as amended, and Section 21E of the Securities Exchange Act of 1934, as amended. All statements, other than statements of historical fact included in this press release, including, without limitation, statements regarding the Offering and the Class B Common Stock Purchase, Magnolia’s future financial position, business strategy, budgets, projected revenues, projected costs and plans and objectives of management for future operations are forward-looking statements. When used in this press release, the words “could,” “should,” “will,” “may,” “believe,” “anticipate,” “intend,” “estimate,” “expect,” “project,” the negative of such terms and other similar expressions are intended to identify forward-looking statements, although not all forward-looking statements contain such identifying words. These forward-looking statements are based on management’s current expectations and assumptions about future events and are based on currently available information as to the outcome and timing of future events. Except as otherwise required by applicable law, Magnolia disclaims any duty to update any forward-looking statements, all of which are expressly qualified by the statements in this section, to reflect events or circumstances after the date of this press release. Magnolia cautions you that these forward-looking statements are subject to all of the risks and uncertainties, most of which are difficult to predict and many of which are beyond the control of Magnolia, incident to the development, production, gathering and sale of oil, natural gas and natural gas liquids (“NGLs”). In addition, Magnolia cautions you that the forward-looking statements contained in this press release are subject to the following factors: (i) the economic effects of the COVID-19 pandemic and actions taken by federal, state and local governments and other third parties in response to the pandemic; (ii) legislative, regulatory or policy changes, including those following the change in presidential administrations; (iii) the market prices of oil, natural gas and NGLs, and other products or services; (iv) the supply and demand for oil, natural gas, NGLs and other products or services, including impacts of actions taken by the Organization of the Petroleum Exporting Countries and other state-controlled oil companies; (v) production and reserve levels; (vi) geopolitical and business conditions in key regions of the world; (vii) drilling risks; (viii) economic and competitive conditions; (ix) the availability of capital resources; (x) capital expenditures and other contractual obligations; (xi) weather conditions; (xii) inflation rates; (xiii) the availability of goods and services; (xiv) cyber attacks; (xv) occurrence of property acquisitions or divestitures; (xvi) the integration of acquisitions; (xvii) general market, political and economic conditions, including as a result of COVID-19 and the political environment of oil-producing regions, including uncertainty or instability resulting from civil disorder, an outbreak or escalation of armed hostilities or acts of war or terrorism; and (xviii) the securities or capital markets and related risks such as general credit, liquidity, market and interest-rate risks. Should one or more of the risks or uncertainties described in this press release occur, or should underlying assumptions prove incorrect, actual results and plans could differ materially from those expressed in any forward-looking statements. Additional information concerning these and other factors that may impact the operations and projections discussed herein can be found in Magnolia’s filings with the SEC, including its Annual Report on Form 10-K for the fiscal year ended December 31, 2021. Magnolia’s SEC filings are available publicly on the SEC’s website at www.sec.gov.


Contacts

Investors
Brian Corales
(713) 842-9036
This email address is being protected from spambots. You need JavaScript enabled to view it.

Media
Art Pike
(713) 842-9057
This email address is being protected from spambots. You need JavaScript enabled to view it.

MADISON, Wis.--(BUSINESS WIRE)--MGE Energy, Inc. (Nasdaq: MGEE) today issued its third-quarter 2022 financial update presentation.


The update is available on MGE Energy's website at:

mgeenergy.com/financialupdate

About MGE Energy

MGE Energy is a public utility holding company. Its principal subsidiary, Madison Gas and Electric, generates and distributes electricity to 159,000 customers in Dane County, Wis., and purchases and distributes natural gas to 169,000 customers in seven south-central and western Wisconsin counties. MGE's roots in the Madison area date back more than 150 years.


Contacts

Investor relations contacts

Steve B. Schultz
Corporate Communications Manager
608-252-7219 | This email address is being protected from spambots. You need JavaScript enabled to view it.

Ken Frassetto
Director Shareholder Services and Treasury Management
608-252-4723 | This email address is being protected from spambots. You need JavaScript enabled to view it.

Bright eliminates barriers to rooftop solar adoption by removing cost and friction via a modern fintech platform

MEXICO CITY--(BUSINESS WIRE)--#LeoDiCaprio--Bright, the leading residential solar developer and financier in Mexico, announced today its entry into the commercial and industrial sector as it scales its offer to target a market representing >70% of the country's electric consumption. The company has executed its first portfolio of industrial projects with clients such as Grupo ABX, Muebles Jorman, Ladesa and Mariscal Moda Hombre, and is targeting an additional 50 MW of industrial deployments in the coming years. To capitalize the opportunity, Bright has also closed a round of growth equity from its long-time partner MGM Innova, with participation from actor and environmentalist Leonardo DiCaprio, bringing the total capital raised to >$50mm USD.


After clarity on the support by the federal government for distributed (rooftop) solar, hundreds of businesses have turned to the renewable alternative to alleviate or eliminate their rising commodity and electricity prices. “As a result, we’ve partnered with leading industrial solar installers to develop the most competitive and reliable solar financing product for the industry,” said Jonah Greenberger, CEO and co-founder at Bright. “Through creative financial structures, Bright now allows commercial and industrial clients to switch to solar at no upfront cost and a fixed price while generating immediate fiscal and operational savings of up to 30%.”

Bright tackles this challenge by partnering with local installers and providing the workflow automation and financing layer to enable scale and exponentially more customers.

“I’m proud to be an early investor in Bright, a company that was a pioneer in the early days of residential solar in Latin America and today is the largest distributed solar generation company in Mexico,” said Leonardo DiCaprio.

Through this platform, Bright is also able to provide access to low cost development bank funding via its partnership with the Interamerican Development Bank, which was put in place as a first of a kind deal in Mexico in 2015. As a result of this collaboration, IDB expects to deploy millions in solar across LatAm in the coming years. According to the International Energy Agency, energy demand in the region is expected to increase by 50 percent by 2030 because of increased private transport and land use changes, requiring estimated global investments of up to $1.5 trillion. Bright is here to accelerate this.

About Bright

Bright is Mexico’s #1 distributed generation solar provider (think Sunrun for the developing world, starting in Mexico). Bright provides a distributed solar operating system that enables thousands to offer cheaper electricity to homes at no upfront cost, working with an expansive network of project financiers, local installers, and local distributors to satisfy the resulting demand. Bright’s first market is Mexico, which has more sun, higher electricity rates, and lower labor costs than the US. Bright's investors include First Round Capital, Y Combinator, Leonardo DiCaprio, Daniel Servitje, the founders of Sunrun and Tesla, and other top Silicon Valley firms.

For more information or to see if you qualify for solar visit thinkbright.mx.


Contacts

This email address is being protected from spambots. You need JavaScript enabled to view it.

OAKLAND, Calif.--(BUSINESS WIRE)--Primergy Solar Management, LLC (‘Primergy’), a leading developer, owner and operator of utility scale solar, distributed solar and energy storage, announced that it has submitted its initial permit application to La Plata County, Colorado for the proposed 155 MWac Hesperus Solar Project.


The proposed project is located eight miles from Durango and is expected to deliver enough zero-emission electricity to power up to 56,000 homes annually. The site design has evolved through important feedback from the State of Colorado, La Plata County, and various stakeholders. The permitting process timeline will be dictated by La Plata County and will include multiple open houses and public comment periods. The initial permit application addresses some early community questions and comments shared with Primergy prior to the filing.

“This is the first step in our journey to bring solar energy to the community around Hesperus, and we are grateful for the feedback we have already received from community members, La Plata County, and the State of Colorado,” said Kathryn Meyer, Director of Development at Primergy. “We look forward to working with our partners, landowners, and neighbors throughout the permitting process, and as we continue to develop and grow meaningful partnerships together.”

The Hesperus Solar Project is proposed to be located on approximately 1,900 acres in La Plata County on the Western Slope. The project includes 1,600 acres of private property, and 320 state-owned acres located on Fort Lewis College’s Old Fort at Hesperus Campus. The College and Primergy have entered into a solar energy planning lease to evaluate the suitability of those 320 acres for hosting a portion of the project.

When developing solar projects, Primergy’s approach includes complete ecosystem management, collaborative partnerships and equitable stakeholder engagement. An extensive archaeological survey, as well as aquatic, biological, geotechnical and geohazard surveys have been completed to ensure lasting community benefits.

Hesperus Solar is expected to generate $37 million in tax revenues over its lifespan. It will create more than 250 construction jobs and three permanent jobs. If approved, it is expected to be operational as soon as the end of 2025.

Primergy has 690MW of solar and 380MW of storage currently under construction and many projects under operation. The company also has several additional gigawatts of solar and storage expected to come online over the next three years as well as an active development pipeline for 2026 and beyond.

For more information about Primergy, please visit www.primergysolar.com and for more information about the Hesperus Solar Project, please visit primergysolar.com/our-projects/Hesperus.

About Primergy

Primergy is a developer, owner and operator focused on both distributed and utility scale solar PV and battery storage projects in North America with portfolios of nearly 10 GW of solar and battery energy storage projects in development, construction and operations in 17 different states. Primergy features a diverse and talented team with decades of experience in renewables project development, financing, construction and operations. Primergy is a portfolio company of Quinbrook Infrastructure Partners and represents Quinbrook’s principal solar and solar plus energy storage investment platform in North America.


Contacts

Bryson Hull for Primergy
202-657-2855
This email address is being protected from spambots. You need JavaScript enabled to view it.

Safe and sustainable energy storage solution is first utility-scale deployment for BWP

WILSONVILLE, Ore.--(BUSINESS WIRE)--ESS Inc. (“ESS”) (NYSE: GWH), a leading manufacturer of long-duration iron flow batteries for commercial and utility-scale energy storage applications, and Burbank Water and Power (BWP) in California have entered into an agreement for ESS to deliver BWP’s first utility-scale battery storage project. Under the agreement, a 75 kW / 500kWh ESS Energy Warehouse™ will be installed and connected to a 265 kW solar array on the BWP EcoCampus.


The iron flow battery will support the increased use of renewable power and allow excess renewable energy to be stored and used as baseload energy for Burbank, improving the resilience and reliability of the grid. ESS iron flow battery technology is safe and non-toxic, offers a 25-year lifespan without capacity degradation, and is manufactured in the United States using domestically sourced, earth-abundant materials.

“ESS is pleased to partner with Burbank Water and Power to deploy the first long-duration energy storage project in the city,” said Hugh McDermott, ESS SVP of Business Development and Sales. “BWP is demonstrating the central role that energy storage will play in a decarbonized grid – supporting increasing amounts of renewable energy and enhancing operational resilience. We look forward to working with them to achieve their ambitious climate goals.”

“BWP is already using small-scale battery technology at our substations, but we see the value in adding considerably more storage to the network. This initiative will be the largest battery installed in Burbank, providing enough renewable power for 300 homes annually,” says Mandip Samra, Assistant General Manager for Power Supply at BWP. “The project is a big step forward to help meet our goal of having a greenhouse gas-free power supply by 2040 and providing energy storage for Burbank now and for decades to come.”

Long-duration energy storage will play a critical role in achieving California’s ambitious decarbonization goal: 100% zero-emission electricity by 2045. The California Energy Storage Alliance (CESA) estimates that the state will need nearly one gigawatt-hour (1000 MWh) of long-duration storage by 2030 to integrate intermittent renewable energy and optimize assets for a cleaner, more affordable and reliable grid.

The ESS Energy Warehouse™ is expected to be installed in Burbank by December 2023.

About ESS, Inc.
At ESS (NYSE: GWH), our mission is to accelerate global decarbonization by providing safe, sustainable, long-duration energy storage that powers people, communities and businesses with clean, renewable energy anytime and anywhere it’s needed. As more renewable energy is added to the grid, long-duration energy storage is essential to providing the reliability and resiliency we need when the sun is not shining, and the wind is not blowing.

Our technology uses earth-abundant iron, salt and water to deliver environmentally safe solutions capable of providing up to 12 hours of flexible energy capacity for commercial and utility-scale energy storage applications. Established in 2011, ESS Inc. enables project developers, independent power producers, utilities and other large energy users to deploy reliable, sustainable long-duration energy storage solutions. For more information visit www.essinc.com.

About BWP
BWP is a community-owned utility that provides reliable, affordable, and sustainable water and electric services to more than 55,000 residential and business customers in the City of Burbank, California. BWP has been operating for over 100 years, including nine years as an APPA RP3 Diamond level provider.

Forward-Looking Statements
This communication contains certain forward-looking statements regarding ESS and its management team’s expectations, hopes, beliefs, or intentions regarding the future. The words “estimate,” “expect,” “will” and similar expressions may identify forward-looking statements, but the absence of these words does not mean that a statement is not forward-looking. Examples of forward-looking statements include, among others, statements regarding the Company’s ability to execute on orders and the Company’s relationships with third parties. These forward-looking statements are based on ESS' current expectations and beliefs concerning future developments. Many factors could cause actual future events to differ materially. Except as required by law, ESS is not undertaking any obligation to update or revise any forward-looking statements whether as a result of new information, future events or otherwise.


Contacts

ESS Contacts
Investors:
Erik Bylin
This email address is being protected from spambots. You need JavaScript enabled to view it.

Media:
Morgan Pitts
503.568.0755
This email address is being protected from spambots. You need JavaScript enabled to view it.

BWP Media Contact
Jeannine Edwards
Assistant General Manager
Sustainability, Marketing and Strategy
818.238.3856
This email address is being protected from spambots. You need JavaScript enabled to view it.

Navigating Near-term Challenges in the Operating Environment

GrafTech’s Facility in Monterrey, Mexico Remains Temporarily Suspended

BROOKLYN HEIGHTS, Ohio--(BUSINESS WIRE)--GrafTech International Ltd. (NYSE: EAF) ("GrafTech" or the "Company") today announced financial results for the quarter and nine months ended September 30, 2022.


Third Quarter 2022 Highlights

  • Net income of $93 million
  • Earnings per share ("EPS")(1) of $0.36 and adjusted EPS(1)(2) of $0.37
  • Adjusted EBITDA(2) of $129 million, for a 42% adjusted EBITDA margin(3)
  • Sales volume of 36 thousand metric tons ("MT")
  • Production volume of 38 thousand MT
  • Cash flow from operating activities of $68 million

CEO Comments

"Third quarter results fell short of our expectations, reflecting near-term challenges in the operating environment," said Marcel Kessler, Chief Executive Officer and President. “Ongoing geopolitical tensions and global economic uncertainty have softened near-term demand for steel and, therefore, graphite electrodes. This, combined with the current inflationary environment and the impact of the suspension of our operations in Mexico, led to declines in our key operating and financial metrics for the quarter."

"I am proud of our team as they are working tirelessly to navigate the current market uncertainties, while pursuing all options to ensure our operations in Mexico can resume as promptly as possible," said Mr. Kessler. "In addition, we are aligning operating and capital expenditures with the current environment as we remain committed to maintaining a strong balance sheet. We are confident that these actions, supported by an industry-leading position and our sustainable competitive advantages, will optimally position GrafTech to benefit from the long-term growth of the graphite electrode market and to deliver future shareholder value."

Third Quarter 2022 Financial Performance


(dollars in thousands, except per share amounts)


Nine Months Ended
September 30,


Q3 2022

Q2 2022

Q3 2021


2022

2021

Net sales

$

303,840

$

363,646

$

347,348


$

1,033,731

$

982,495

Net income

$

93,451

$

114,997

$

119,886


$

332,631

$

246,850

EPS(1)

$

0.36

$

0.44

$

0.45


$

1.28

$

0.92

Cash flow from operating activities

$

68,166

$

60,123

$

134,256


$

274,605

$

343,011


Adjusted net income(2)

$

93,883

$

115,102

$

119,038


$

334,905

$

333,405

Adjusted EPS(1)(2)

$

0.37

$

0.44

$

0.45


$

1.29

$

1.25

Adjusted EBITDA(2)

$

128,567

$

158,196

$

172,175


$

456,363

$

487,123

Adjusted free cash flow(4)

$

52,233

$

47,630

$

125,145


$

229,767

$

369,303

Net sales for the third quarter of 2022 were $304 million, a decrease of 13% compared to $347 million in the third quarter of 2021. The decrease primarily reflected lower sales volume, including the impact of approximately four thousand MT of customer orders, predominately related to short-term agreements and spot sales ("non-LTA"), that could not be shipped due to the suspension of our operations in Monterrey, Mexico. A shift in the mix of our business to non-LTA volume from volume derived from our take-or-pay agreements that had initial terms of three-to-five years ("LTA") also contributed to the decline in net sales. These factors were partially offset by improved pricing on non-LTA volume.

Net income for the third quarter of 2022 was $93 million, or $0.36 per share, compared to $120 million, or $0.45 per share, in the third quarter of 2021. Adjusted EBITDA(2) was $129 million in the third quarter of 2022, compared to $172 million in the third quarter of 2021, with the decline primarily reflecting lower sales volume and higher costs. We estimate that the suspension of our operations in Monterrey, Mexico had a negative impact of approximately $13 million on adjusted EBITDA in the third quarter of 2022, primarily reflecting the foregone sales volume. Adjusted EBITDA margin(3) was 42% for the third quarter of 2022.

In the third quarter of 2022, cash flow from operating activities was $68 million and adjusted free cash flow(4) was $52 million, with both measures decreasing compared to the same period in 2021 reflecting higher working capital and lower net income. For the third quarter of 2022, 41% of adjusted EBITDA(2) was converted to adjusted free cash flow(5).

Operational and Commercial Update


Key operating metrics


Nine Months Ended
September 30,


(in thousands, except percentages)

Q3 2022

Q2 2022

Q3 2021


2022


2021

Sales volume (MT)(6)

35.7


42.3


43.4


121.3


123.1


Production volume (MT)(7)

37.7


43.9


39.5


127.7


119.0


Total production capacity (MT)(8)(9)

55.0


58.0


55.0


171.0


171.0


Total capacity utilization(9)(10)

69

%

76

%

72

%


75

%


70

%

Production capacity excluding St. Marys (MT)(8)(11)

48.0


51.0


48.0


150.0


150.0


Capacity utilization excluding St. Marys(10)(11)

79

%

86

%

82

%


85

%


79

%

GrafTech reported sales volume of 36 thousand MT in the third quarter of 2022, a decrease of 18% compared to the third quarter of 2021, consisting of 23 thousand MT of LTA volume and 13 thousand MT of non-LTA volume.

For the third quarter of 2022, the weighted-average realized price for our LTA volume was $9,400 per MT. For our non-LTA volume, the weighted-average realized price for graphite electrodes delivered and recognized in revenue in the third quarter of 2022 was $6,000 per MT, an increase of approximately 30% compared to the third quarter of 2021 and consistent with the weighted-average non-LTA price for the first six months of 2022.

Production volume was 38 thousand MT in the third quarter of 2022, a decrease of 5% compared to the third quarter of 2021. Annual planned maintenance work at our two European facilities occurred in the third quarter of both years.

Steel market capacity utilization rates have been as follows:


Q3 2022

Q2 2022

Q3 2021

Global (ex-China) capacity utilization rate(12)

64

%

69

%

71

%

U.S. capacity utilization rate(13)

78

%

81

%

84

%

The table of estimated shipments of graphite electrodes under existing LTAs has been updated as follows to reflect our current expectations(14)(15):


2022


2023


2024

Estimated LTA volume (in thousands of MT)


88-92


26-33


12-15

Estimated LTA revenue (in millions)


$830-$870


$225-$285


$130-$165(16)

Update on Operations in Monterrey, Mexico

On September 15, 2022, inspectors from the State Attorney’s Office for the Secretary of Environment of the State of Nuevo León, Mexico issued a temporary suspension notice for our operations located in Monterrey, Mexico, as described in our Current Report on Form 8-K furnished on September 16, 2022. Currently, production operations in Monterrey remain shut down while certain activities, including movement of existing inventory, are permitted to continue.

While we are complying with the suspension notice, we strongly disagree with the course of action taken by the state authorities and will continue to seek resolution, including a restart of our Monterrey production operations. As we work to resolve this matter as promptly as possible, we are pursuing all available legal remedies, as well as engaging in dialogue with the respective state and local authorities involved in these matters. However, at this time, we are not able to assess how long production operations at our Monterrey facility will remain suspended.

Our facility in Monterrey has been operating since 1959, has over 550 employees and represents approximately 60 thousand MT of annual production capacity, or 30% of our total annual production capacity excluding St. Marys. Monterrey's operations can produce a broad portfolio of products, including various sizes of graphite electrodes and pins, and is currently our only site that produces the pin stock utilized for all of our graphite electrodes.

As such, we are pursuing several alternatives with respect to production and sourcing of pin stock as well as other mitigation activities to minimize the impact on our business and our customers if the Monterrey suspension continues for the foreseeable future. These include a potential restart of our St. Marys, Pennsylvania facility, where the scope of production is currently limited to graphitizing and machining of electrodes and pins(11). We anticipate these mitigation activities will take the first half of 2023 to fully implement, and we cannot provide any assurance that such measures will be effective in limiting the impact of the suspension.

Until operations in Monterrey are resumed or mitigation activities are successfully implemented, our ability to fulfill customer orders will be significantly impacted. Specific to the fourth quarter of 2022, after considering current pin stock inventory, we estimate the suspension will impact approximately 10 thousand MT to 12 thousand MT of such customer orders.

Capital Structure and Capital Allocation

As of September 30, 2022, GrafTech had cash and cash equivalents of $109 million and total debt of approximately $921 million. Maintaining a prudent and disciplined capital allocation strategy remains a priority for the Company. In the third quarter of 2022, we retained all of our free cash flow to increase the Company's liquidity position in order to support financial flexibility as we manage through near-term challenges, including the suspension of our operations in Monterrey. In the first half of the year, we repaid $110 million of our long-term debt and repurchased 6.7 million shares of our common stock for an aggregate of $60 million. We continue to expect full-year capital expenditures to be in the range of $70 million to $80 million in 2022.

Outlook

The current environment for the steel industry remains volatile with key markets, such as Europe, continuing to experience weakening demand as broader macroeconomic conditions deteriorate. Steel industry trends have also softened somewhat in the U.S., although the market remains comparatively healthy and more stable. As a result, we expect graphite electrode demand to remain soft in the fourth quarter of 2022 and into 2023 reflecting market dynamics, which continue to be dictated by geopolitical conflict and economic uncertainty.

At the same time, as is the case for nearly all industries, costs remain elevated for raw materials, energy and logistics. Due to the current inflationary environment, we anticipate sequential cost increases to continue in the fourth quarter of 2022.

In addition to the efforts to resolve the situation involving our Monterrey, Mexico facility, we are aligning operating and capital expenditures with the current environment as we remain committed to maintaining a strong balance sheet. Longer term, we remain confident that the steel industry’s accelerating efforts to decarbonize will lead to increased adoption of the electric arc furnace method of steelmaking, driving long-term demand for graphite electrodes. The actions we are taking will optimally position GrafTech to benefit from that long-term growth. In addition, our vertical integration into petroleum needle coke production via our Seadrift facility is a critical differentiator from our competitors and foundational for our ability to reliably deliver high-quality graphite electrodes.

Conference Call Information

In connection with this earnings release, you are invited to listen to our earnings call being held on November 4, 2022 at 10:00 a.m. (EDT). The webcast and accompanying slide presentation will be available on our investor relations website at: http://ir.graftech.com. The earnings call dial-in number is +1 (888) 396-8049 toll-free in North America or +1 (416) 764-8646 for overseas calls, conference ID: 84245557. Archived replays of the conference call and webcast will be made available on our investor relations website at: http://ir.graftech.com. GrafTech also makes its complete financial reports that have been filed with the Securities and Exchange Commission ("SEC") and other information available at: www.GrafTech.com. The information on our website is not part of this release or any report we file or furnish to the SEC.

About GrafTech

GrafTech International Ltd. is a leading manufacturer of high-quality graphite electrode products essential to the production of electric arc furnace steel and other ferrous and non-ferrous metals. The Company has a competitive portfolio of low-cost, ultra-high power graphite electrode manufacturing facilities, including three of the highest capacity facilities in the world. We are the only large-scale graphite electrode producer that is substantially vertically integrated into petroleum needle coke, a key raw material for graphite electrode manufacturing. This unique position provides us with competitive advantages in product quality and cost.

________________________

(1)

EPS represents diluted earnings per share. Adjusted EPS represents diluted adjusted earnings per share.

(2)

A non-GAAP financial measure, see below for more information and a reconciliation of EBITDA, adjusted EBITDA and adjusted net income to net income, and adjusted EPS to EPS, the most directly comparable financial measures calculated and presented in accordance with accounting principles generally accepted in the United States of America ("GAAP").

(3)

Adjusted EBITDA margin is calculated as adjusted EBITDA divided by net sales (Q3 2022 adjusted EBITDA of $128.6 million/Q3 2022 net sales of $303.8 million).

(4)

A non-GAAP financial measure, see below for more information and a reconciliation of adjusted free cash flow and free cash flow to cash flow from operating activities, the most directly comparable financial measure calculated and presented in accordance with GAAP.

(5)

Adjusted free cash flow conversion is calculated as adjusted free cash flow divided by adjusted EBITDA (Q3 2022 adjusted free cash flow of $52.2 million/Q3 2022 adjusted EBITDA of $128.6 million).

(6)

Sales volume reflects only graphite electrodes manufactured by us.

(7)

Production volume reflects graphite electrodes we produced during the period.

(8)

Production capacity reflects expected maximum production volume during the period depending on product mix and expected maintenance outage. Actual production may vary.

(9)

Includes graphite electrode facilities in Calais, France; Monterrey, Mexico; Pamplona, Spain; and St. Marys, Pennsylvania.

(10)

Capacity utilization reflects production volume as a percentage of production capacity.

(11)

Our St. Marys, Pennsylvania facility graphitizes a limited number of electrodes and pins sourced from our Monterrey, Mexico facility.

(12)

Source: World Steel Association, Metal Expert and GrafTech analysis, as of October 2022.

(13)

Source: American Iron and Steel Institute, as of October 2022.

(14)

As it relates to the conflict between Ukraine and Russia, we have provided force majeure notices with respect to certain impacted LTAs. Certain of our LTA counterparties have challenged the force majeure notices, but we will continue to enforce our contractual rights. In the event of a force majeure, the LTAs provide our counterparties with the right to terminate the LTA if the force majeure event continues for more than six months after the delivery of the force majeure notice, with no continuing obligations of either party. The estimates of LTA revenue as set forth in the table above reflects (i) our current view of the validity of such force majeure notices and (ii) our current expectations of termination fees from our customers who have failed to meet certain obligations under their LTAs.

(15)

The estimates set forth in this table reflect our current expectations regarding the shift of LTA revenue out of 2022 into 2023, primarily due to the suspension of our operations in Monterrey, Mexico.

(16)

Includes expected termination fees from a few customers that have failed to meet certain obligations under their LTAs.

Cautionary Note Regarding Forward-Looking Statements

This press release and related discussions may contain forward-looking statements within the meaning of the safe harbor provisions of the U.S. Private Securities Litigation Reform Act of 1995. Forward-looking statements reflect our current views with respect to, among other things, financial projections, plans and objectives of management for future operations, and future economic performance. Examples of forward-looking statements include, among others, statements we make regarding future estimated revenues and volumes derived from our LTAs, future pricing of non-LTAs, anticipated levels of capital expenditures, and guidance relating to earnings per share and adjusted EBITDA. You can identify these forward-looking statements by the use of forward-looking words such as “will,” “may,” “plan,” “estimate,” “project,” “believe,” “anticipate,” “expect,” “foresee,” “intend,” “should,” “would,” “could,” “target,” “goal,” “continue to,” “positioned to,” “are confident,” or the negative versions of those words or other comparable words. Any forward-looking statements contained in this press release are based upon our historical performance and on our current plans, estimates and expectations considering information currently available to us. The inclusion of this forward-looking information should not be regarded as a representation by us that the future plans, estimates, or expectations contemplated by us will be achieved. Our expectations and targets are not predictions of actual performance and historically our performance has deviated, often significantly, from our expectations and targets. These forward-looking statements are subject to various risks and uncertainties and assumptions relating to our operations, financial results, financial condition, business, prospects, growth strategy and liquidity. Accordingly, there are or will be important factors that could cause our actual results to differ materially from those indicated in these statements. We believe that these factors include, but are not limited to: the ultimate impact the COVID-19 pandemic has on our business, results of operations, financial condition and cash flows, including the duration and spread of any variants, the duration and scope of related government orders and restrictions, the impact on our employees, and the disruptions and inefficiencies in our supply chain; the ultimate impact the conflict between Russia and Ukraine has on our business, results of operations, financial condition and cash flows, including the duration and scope of such conflict, its impact on disruptions and inefficiencies in our supply chain and our ability to procure certain raw materials; the possibility that we may be unable to implement our business strategies, including our ability to secure and maintain longer-term customer contracts, in an effective manner; the cyclical nature of our business and the selling prices of our products, which may decline in the future, may lead to periods of reduced profitability and net losses in the future; the impact of inflation and our ability to mitigate the effect on our costs; the risks and uncertainties associated with litigation, arbitration, and like disputes, including disputes related to contractual commitments; the possibility that global graphite electrode overcapacity may adversely affect graphite electrode prices; our dependence on the global steel industry generally and the electric arc furnace steel industry in particular; the sensitivity of our business and operating results to economic conditions, including any recession, and the possibility others may not be able to fulfill their obligations to us in a timely fashion or at all; the competitiveness of the graphite electrode industry; our dependence on the supply of raw materials, including decant oil, petroleum needle coke, and energy, and disruptions in supply chains for these materials; our manufacturing operations are subject to hazards; changes in, or more stringent enforcement of, health, safety and environmental regulations applicable to our manufacturing operations and facilities; the legal, compliance, economic, social and political risks associated with our substantial operations in multiple countries; the possibility that fluctuation of foreign currency exchange rates could materially harm our financial results; the possibility that our results of operations could deteriorate if our manufacturing operations were substantially disrupted for an extended period, including as a result of equipment failure, climate change, regulatory issues, natural disasters, public health crises, such as the COVID-19 pandemic, political crises or other catastrophic events, including the suspension of our operations located in Monterrey, Mexico and our ability to resume operations in Monterrey; our dependence on third parties for certain construction, maintenance, engineering, transportation, warehousing and logistics services; the possibility that we are unable to recruit or retain key management and plant operating personnel or successfully negotiate with the representatives of our employees, including labor unions; the sensitivity of goodwill on our balance sheet to changes in the market; the possibility that we are subject to information technology systems failures, cybersecurity attacks, network disruptions and breaches of data security; our dependence on protecting our intellectual property and the possibility that third parties may claim that our products or processes infringe their intellectual property rights; the possibility that our indebtedness could limit our financial and operating activities or that our cash flows may not be sufficient to service our indebtedness; the possibility that restrictive covenants in our financing agreements could restrict or limit our operations; the fact that borrowings under certain of our existing financing agreements subject us to interest rate risk; the possibility that disruptions in the capital and credit markets could adversely affect our results of operations, cash flows and financial condition, or those of our customers and suppliers; the possibility that the market price of our common stock could be negatively affected by sales of substantial amounts of our common stock in the public markets, including by Brookfield Asset Management Inc. and its affiliates ("Brookfield"); the possibility that we may not pay cash dividends on our common stock in the future; and the fact that our stockholders have the right to engage or invest in the same or similar businesses as us.

These factors should not be construed as exhaustive and should be read in conjunction with the Risk Factors and other cautionary statements that are included in our most recent Annual Report on Form 10-K and other filings with the SEC. The forward-looking statements made in this press release relate only to events as of the date on which the statements are made. Except as required by law, we do not undertake any obligation to publicly update or review any forward-looking statement, whether as a result of new information, future developments or otherwise.

Non‑GAAP Financial Measures

In addition to providing results that are determined in accordance with GAAP, we have provided certain financial measures that are not in accordance with GAAP. EBITDA, adjusted EBITDA, adjusted EBITDA margin, adjusted net income, adjusted EPS, free cash flow, adjusted free cash flow, and adjusted free cash flow conversion are non-GAAP financial measures.

We define EBITDA, a non‑GAAP financial measure, as net income or loss plus interest expense, minus interest income, plus income taxes and depreciation and amortization. We define adjusted EBITDA as EBITDA plus any pension and other post-employment benefit ("OPEB") plan expenses, adjustments for public offerings and related expenses, non‑cash gains or losses from foreign currency remeasurement of non‑operating assets and liabilities in our foreign subsidiaries where the functional currency is the U.


Contacts

Michael Dillon
216-676-2000
This email address is being protected from spambots. You need JavaScript enabled to view it.


Read full story here

NEW YORK--(BUSINESS WIRE)--Volta Inc. ("Volta" or "the Company") (NYSE: VLTA) today announced that the Company will host its third quarter 2022 earnings conference call on Monday, November 14, 2022, at 5:00 p.m. (Eastern Time).


Interested investors and other parties can listen to the live conference call webcast by logging onto the Investor Relations section of the Company's website at https://investors.voltacharging.com.

The conference call can be accessed live over the phone by dialing + 1-888-999-6281 (domestic) or + 1-848-280-6550 (international). A telephonic replay will be available approximately two hours after the call by dialing +1-844-512-2921 or, for international callers, +1-412-317-6671. The PIN for the replay is 11152525. The replay will be available until 11:59 p.m. Eastern Time on November 28, 2022.

About Volta Inc.

Volta Inc. (NYSE: VLTA) is an industry-leading electric vehicle ("EV") charging and media company. Volta's unique network of charging stations powers vehicles and drives business growth while accelerating a clean energy future. Volta delivers value to site partners, brands, and consumers by installing charging stations that feature large-format digital advertising screens located steps away from the entrances of popular commercial locations. Retailers can attract and influence foot traffic, advertisers can precisely target audiences, and EV drivers can charge their vehicles seamlessly as they go about their daily routines. Volta's extensive network leverages its proprietary PredictEV™ platform, which uses sophisticated behavioral science and machine learning technology to help commercial property owners, cities, and electric utilities plan EV infrastructure intelligently, efficiently, and equitably. To learn more, visit www.voltacharging.com.

Forward-Looking Statements

This press release contains certain forward-looking statements within the meaning of federal securities laws. These forward-looking statements generally are identified by words such as “anticipate,” “believe,” “estimate,” “expect,” “future,” “intend,” “may,” “opportunity,” “plan,” “potential,” “project,” “should,” “strategy,” “will,” “would,” and similar expressions. Forward-looking statements are predictions, projections and other statements about future events that are based on current expectations and assumptions and, as a result, are subject to risks and uncertainties. Many factors could cause actual future events to differ materially from the forward-looking statements in this press release, including but not limited to the factors, risks and uncertainties included in our Annual Report on Form 10-K for the fiscal year ended December 31, 2021 and our Quarterly Reports on Form 10-Q for the quarterly periods ended March 31, 2022 and June 30, 2022, as such factors may be updated from time to time in our other filings with the Securities and Exchange Commission (the "SEC"), accessible on the SEC’s website at www.sec.gov and the Investor Relations section of our website at www.voltacharging.com. These filings identify and address other important risks and uncertainties that could cause actual events and results to differ materially from those contained in the forward-looking statements. Forward-looking statements speak only as of the date they are made. Readers are cautioned not to put undue reliance on forward-looking statements, and, except as required by law, we assume no obligation and do not intend to update or revise these forward-looking statements, whether as a result of new information, future events, or otherwise.


Contacts

Investors: This email address is being protected from spambots. You need JavaScript enabled to view it.
Media: This email address is being protected from spambots. You need JavaScript enabled to view it.

THOUSAND OAKS, Calif.--(BUSINESS WIRE)--All amounts are in U.S. Dollars unless otherwise indicated:


THIRD QUARTER 2022 HIGHLIGHTS

  • Adjusted EBITDA(1) was $6.9 million in the third quarter of 2022 compared to $1.7 million in the third quarter of 2021, an increase of 296%. The increase was primarily due to an increase in production of 77% and an increase in average prices of 43%, partially offset by higher realized losses from commodity contracts in the third quarter of 2022
  • Net income for the third quarter of 2022 was $9.3 million compared to net income of $0.6 million for the third quarter of 2021 due to increases in average prices and production and an unrealized gain on commodity contracts of $4.6 million in the third quarter of 2022
  • Revenue, net of royalties was $9.9 million in the third quarter of 2022 compared to $3.9 million for the third quarter of 2021, which was an increase of 152%, as average prices increased by 43% and production increased by 77%
  • Average netback from operations(2) for the third quarter of 2022 was $55.16/boe, an increase of 54% from the prior year third quarter due to higher prices in 2022. Average netback including commodity contracts(2) for the third quarter of 2022 was $49.69 per boe, an increase of 84% from the prior year third quarter
  • Average production for the third quarter of 2022 was 1,702 BOEPD, an increase of 77% compared to third quarter 2021 production of 960 BOEPD. This increase is due to production from the Barnes 7-3H well and the Barnes 8-4H well
  • Production and operating expenses per barrel averaged $7.77 per BOE in the third quarter of 2022 compared to $8.40 per BOE in the second quarter of 2021, a decrease of 8%. The decrease was due to increased production which reduced the per barrel fixed costs partially offset by higher production taxes due to an increase in prices
  • In October 2022, the credit facility was redetermined and the borrowing base was increased from $20 million to $25 million. After the redetermination, the Company has $8.8 million of available borrowing capacity
  1. Adjusted EBITDA is considered a non-GAAP measure. Refer to the section entitled “Non-GAAP Measures” of this earnings release.
  2. Netback from operations and netback including commodity contracts are considered non-GAAP ratios. Refer to the section entitled “Non-GAAP Measures” of this earnings release.

KEI’s President and Chief Executive Officer, Wolf Regener commented:

“We are pleased that the Company generated third quarter 2022 adjusted EBITDA(1) of $6.9 million which was an increase of almost 300% from the prior year quarter. The Barnes 7-3H well and the Barnes 8-4H well, the first two wells in our 2022 drilling program, continue to exceed management’s type curve.

We are excited that we will bring three wells into production during the fourth quarter. The Company has just completed drilling the Glenn 16-3H well, which is the fifth well in our 2022 drilling program. The Emery 17-2H and Brock 9-3H wells have already been drilled. Completion operations on the Emery 17-2H well have begun, with production expected later in November. The completion operations on the Brock 9-3H well and the Glenn 16-3H well will be done concurrently immediately after the Emery 17-2H well with production expected in December.

Average production for the third quarter of 2022 was 1,702 BOEPD, an increase of 77% compared to third quarter 2021 production of 960 BOEPD due to new production from the Barnes 7-3H well and the Barnes 8-4H well.

Adjusted EBITDA(1) was $6.9 million for the third quarter of 2022 compared to $1.7 million for the prior year third quarter, an increase of 296%. The increase was primarily due to an increase in average prices of 43% and an increase in production of 77%, partially offset by higher realized losses from commodity contracts in the third quarter of 2022.

Net income in the third quarter of 2022 was $9.3 million, compared to a net income of $0.6 million in the third quarter of 2021. The increases were due to higher production and higher average prices and an unrealized gain on commodity contracts of $4.6 million in the third quarter of 2022.

Netback from operations(2) increased to $55.16 per BOE in the third quarter of 2022 compared to $35.87 per BOE in the third quarter of 2021, an increase of 54%. Netback including commodity contracts(2) for the third quarter of 2022 was $49.69 per BOE, an increase of 84% from the prior year third quarter. The 2022 increases compared to the same periods in the prior year were due to the increase in average prices.

Net revenue was $9.9 million in the third quarter of 2022 compared to $3.9 million for third quarter of 2021, which was an increase of 152% due to higher prices and higher production.

Operating expenses averaged $7.77 per BOE in the third quarter of 2022 compared to $8.40 per BOE in the third quarter of 2021, a decrease of 8%. The decrease was due to increased production which reduced the per barrel fixed costs partially offset by higher production taxes due to an increase in prices.

In October 2022, the credit facility with BOK Financial was redetermined and the borrowing base was increased from $20 million to $25 million. After the redetermination, the Company now has $8.8 million of available borrowing capacity.”


Third Quarter


First Nine Months


2022


2021


%


2022


2021


%


Net Income (Loss):


$ Thousands

$9,299


$608


1,429


$13,850


$(1,338)


-

$ per common share

$0.26


$0.03


767


$0.39


$(0.06)


-

assuming dilution


Capital Expenditures

$4,940


$47


10,411%


$19,913


$137


14,435


Average Production (Boepd)

1,702


960


77%


1,563


991


58%

Average Price per Barrel

$80.89


$56.49


43%


$84.19


$50.58


66%

Average Netback from operations(2) per Barrel

$55.16


$35.87


54%


$57.05


$31.45


81%

Average Netback including commodity contracts(2) per Barrel

$49.69


$27.04


84%


$48.50


$25.08


93%


September
2022


June
2022


December
2021


Cash and Cash Equivalents

$ 4,878


$ 2,889


$ 7,316


Working Capital

$ 2,839


$(2,030)


$ 3,823


(1)  

Adjusted EBITDA is considered a non-GAAP measure. Refer to the section entitled “Non-GAAP Measures” of this earnings release.

(2)  

Netback from operations and netback including commodity contracts are considered non-GAAP ratios. Refer to the section entitled “Non-GAAP Measures” of this earnings release.

Third Quarter 2022 versus Third Quarter 2021

Oil and gas gross revenues totaled $12.7 million in the third quarter of 2022 versus $5.0 million in the third quarter of 2021. Oil revenues increased $6.7 million or 162% to $10.8 million as average oil prices increased by $23.91 per barrel or 34% to $93.52 and oil production increased by 95% to 1,252 boepd. Natural gas revenues increased by $0.7 or 219% to $1.0 million as natural gas prices increased $6.12/mcf or 149% and average natural gas production increased by 238 mcfpd or 28%. Natural gas liquids (NGLs) revenues increased $0.3 million or 55% as NGL prices increased 3% to $35.33/boe and NGL production increased by 91 boepd or 51%.

Average third quarter 2022 production per day increased 742 boepd or 77% from the third quarter of 2021. The increase was due to new production from the Barnes 7-3H well and the Barnes 8-4H well.

Production and operating expenses increased to $1.2 million in the third quarter of 2022, an increase of 64%. Operating expenses averaged $7.77 per BOE for the third quarter of 2022 compared to $8.40 per BOE for the same period in 2021. The decrease was due to increased production which reduced the per barrel fixed costs partially offset by higher production taxes due to an increase in prices.

Depletion and depreciation expense increased $1.0 million or 113% due to increased production and a higher PP&E balance after the reversal of previous impairment in the fourth quarter of 2021.

General and administrative expenses increased $0.3 million or 39% in the third quarter of 2022 due to due to increases in payroll costs and director fees in 2022 and additional non-recurring professional costs related to the share consolidation process.

Interest expense increased by 19% in the third quarter of 2022 compared to the same period in the prior year due to higher interest rates partially offset by principal payments on the credit which reduced the outstanding loan balance.

Finance income increased by $4.6 million in the third quarter of 2022 compared to the third quarter of 2021 due to realized gains on commodity contracts in the third quarter of 2022.

FIRST NINE MONTHS 2022 HIGHLIGHTS

  • Adjusted EBITDA(1) was $18.3 million in the first nine months of 2022 compared to $4.7 million in the first nine months of 2021, an increase of 288%. The increase was primarily due to an increase in average prices of 66% and an increase in production of 58%, partially offset by higher realized losses from commodity contracts in the first nine months of 2022
  • Net income for the first nine months of 2022 was $13.9 million compared to net loss of $1.3 million for the third quarter of 2021 due to increases in average prices and production and an unrealized gain on commodity contracts of $1.6 million in the first nine months of 2022
  • Revenue, net of royalties was $27.8 million in the first nine months of 2022 compared to $10.7 million for first nine months of 2021, an increase of 160%, due to an increase in average production and average prices
  • Average netback from operations(2) for the first nine months of 2022 was $57.05/boe, an increase of 81% from the prior year period due to higher prices in 2022. Netback including commodity contracts(2) for the first nine months of 2022 was $48.50/boe which was 93% higher than the prior year period
  • Average production for the first nine months of 2022 was 1,563 BOEPD, an increase of 58% compared to first nine months 2021 production of 991 BOEPD. This increase is due to production from the Barnes 7-3H well and the Barnes 8-4H well
  • Production and operating expenses per barrel averaged $8.17 per BOE in the both the first nine months of 2022 and 2021 as the decrease from increased production which reduced the per barrel fixed costs was offset by higher production taxes due to an increase in prices
  1. Adjusted EBITDA is considered a non-GAAP measure. Refer to the section entitled “Non-GAAP Measures” of this earnings release.
  2. Netback from operations and netback including commodity contracts are considered non-GAAP ratios. Refer to the section entitled “Non-GAAP Measures” of this earnings release.

First Nine Months of 2022 versus First Nine Months of 2021

Oil and gas gross revenues totaled $35.9 million in the first nine months of 2022 versus $13.7 million in the first nine months of 2021, an increase of 163%. Oil revenues were $31.3 million in the first nine months of 2022 versus $11.5 million in the same period of 2021, an increase of 172% as average oil prices increased 60% to $100.91 a barrel and oil production increased by 69% to 1,137 boepd. Natural gas revenues increased $1.3 million or 157% due to an average natural gas price increase of 106% and a 25% increase in natural gas production. NGL revenue increased $1.1 million or 86% due to an average NGL price increase of 33% and an increase in NGL production of 40% in the first nine months of 2022 compared to the comparable prior year period.

Average production per day for the first nine months of 2022 increased 58% from the prior year comparable period. The increase was due to new production from the Barnes 7-3H well and the Barnes 8-4H well.

Production and operating expenses increased to $3.5 million or 58% in the first nine months of 2022 compared to the prior year period. Production and operating expenses per barrel averaged $8.17 per BOE in the both the first nine months of 2022 and 2021 as the decrease from increased production which reduced the per barrel fixed costs was offset by higher production taxes due to an increase in prices.

Depletion and depreciation expense increased $2.4 million due to increased production and a higher PP&E balance after the reversal of previous impairment in the fourth quarter of 2021.

General and administrative expenses increased $0.4 million or 17% in the first nine months of 2022 due to due to increases in payroll costs and director fees in 2022 and additional non-recurring professional costs related to the share consolidation process.

Finance income increased by $1.6 million due to unrealized gains on financial commodity contracts recorded in 2022.

Finance expense decreased $1.0 million in the first nine months of 2022 due to an unrealized loss on commodity contracts of $3.0 million in 2021 partially offset by higher realized losses on commodity contracts which increased by $2.0 million compared to the prior year period.

KOLIBRI GLOBAL ENERGY INC.

CONDENSED CONSOLIDATED STATEMENTS OF FINANCIAL POSITION

(Unaudited, Expressed in Thousands of United States Dollars)

($000 except as noted)

September 30
2022

December 31
2021


Current Assets

Cash and cash equivalents

$

4,878


$

7,316


Trade and other receivables


4,233


1,999


Other current assets


1,407


587


10,518


9,902


Non-current assets

Property, plant and equipment


162,116


147,114


Total Assets

$

172,634


$

157,016


Current Liabilities

Trade and other payables

$

6,883


$

3,145


Current portion of loans and borrowings


-


1,000


Lease payable


26


43


Fair value of commodity contracts


770


1,891


7,679


6,079


Non-current liabilities


Loans and borrowings


15,855


15,866


Asset retirement obligations


1,617


1,398


Fair value of commodity contracts


99


585


Lease payable


27


17,598


17,849


Equity

Share capital


296,221


296,060


Contributed surplus


23,206


22,948


Deficit


(172,070

)


(185,920

)

Total Equity


147,357


133,088


Total Equity and Liabilities

$

172,634


$

157,016


KOLIBRI GLOBAL ENERGY INC.

CONDENSED CONSOLIDATED STATEMENTS OF OPERATIONS AND COMPREHENSIVE INCOME (LOSS)

(Unaudited, expressed in Thousands of United States dollars, except per share amounts)

($000 except as noted)


Third Quarter

First Nine Months


2022

2021

2022

2021


Oil and natural gas revenue, net

$

9,851


$

3,909


$

27,826


$

10,717


Other income


16


1


45


2


9,867


3,910


27,871


10,719


Production and operating expenses


1,216


742


3,487


2,209


Depletion and depreciation expense


1,860


874


5,086


2,679


General and administrative expenses


905


650


2,435


2,075


Stock based compensation


75


-


232


-


Gain on forgiven loan


-


-


-


(303

)


4,056


2,266


11,240


6,660


Finance income


4,648


-


1,611


-


Finance expense


(1,160

)


(1,036

)


(4,392

)


(5,397

)


Net income (loss)


9,299


608


13,850


(1,338

)

Net income (loss) per share

$

0.26


$

0.03


$

0.39


$

(0.06

)

KOLIBRI GLOBAL ENERGY INC.

THIRD QUARTER 2022

(Unaudited, expressed in Thousands of United States dollars, except as noted)


Third Quarter


First Nine Months


2022


2021


2022


2021

Oil revenue before royalties


$

10,773


4,104


31,317


11,528


Gas revenue before royalties


1,020


320


2,161


842


NGL revenue before royalties


873


564


2,443


1,314


Oil and Gas gross revenue


12,666


4,988


35,921


13,684


Adjusted EBITDA(1)


6,874


1,737


18,258


4,711


Additions to property, plant & equipment


4,940


47


19,913


137


Statistics:


3rd Quarter


First Nine Months


2022


2021


2022


2021

Average oil production (Bopd)


1,252


641


1,137


671


Average natural gas production (mcf/d)


1,083


845


1,093


877


Average NGL production (Boepd)


269


178


244


174


Average production (Boepd)


1,702


960


1,563


991


Average oil price ($/bbl)


$

93.52


$

69.61


$

100.91


$

62.96


Average natural gas price ($/mcf)


$

10.24


$

4.12


$

7.24


$

3.52


Average NGL price ($/bbl)


$

35.33


$

34.36


$

36.63


$

27.61


Average price (Boe)


$

80.89


$

56.49


$

84.19


$

50.58


Royalties (Boe)


17.96


12.22


18.97


10.96


Operating expenses (Boe)


7.77


8.40


8.17


8.17


Netback from operations(2) (Boe)


$

55.16


$

35.87


$

57.05


$

31.45


Price impact from commodity contracts(3) (Boe)


(5.47


)


(8.83


)


(8.55


)


(6.37


)

Netback including commodity contracts(2) (Boe)


$

49.69


$

27.04


$

48.50


$

25.08


(1)


Adjusted EBITDA is considered a non-GAAP measure. Refer to the section entitled “Non-GAAP Measures” of this earnings release.

(2)


Netback from operations and netback including commodity contracts are considered non-GAAP ratios. Refer to the section entitled “Non-GAAP Measures” of this earnings release.

(3)


Price impact from commodity contracts includes the positive or negative adjustment to the average price per barrel that the Company realized from its commodity contracts.

The information outlined above is extracted from and should be read in conjunction with the Company's unaudited financial statements for the three and nine months ended September 30, 2022 and the related management's discussion and analysis thereof, copies of which are available under the Company's profile at www.sedar.com.

NON-GAAP MEASURES

Netback from operations, netback including commodity contracts and adjusted EBITDA (collectively, the "Company’s Non-GAAP Measures") are not measures or ratios recognized under Canadian generally accepted accounting principles ("GAAP") and do not have any standardized meanings prescribed by IFRS. Management of the Company believes that such measures and ratios are relevant for evaluating returns on each of the Company's projects as well as the performance of the enterprise as a whole. The Company's Non-GAAP Measures may differ from similar computations as reported by other similar organizations and, accordingly, may not be comparable to similar non-GAAP measures and ratios as reported by such organizations. The Company’s Non-GAAP Measures should not be construed as alternatives to net income, cash flows related to operating activities, working capital or other financial measures and ratios determined in accordance with IFRS, as an indicator of the Company's performance.

An explanation of how the Company’s Non-GAAP Measures provide useful information to an investor and the purposes for which the Company’s management uses the Non-GAAP Measures is set out in the management's discussion and analysis under the heading “Non-GAAP Measures” which is available under the Company's profile at www.sedar.com and is incorporated by reference into this earnings release.

The following is the reconciliation of the non-GAAP ratio netback from operations to net income (loss) from continuing operations, which the Company considers to be the most directly comparable financial measure that is disclosed in the Company’s financial statements:

(US $000)

Three months ended
September 30,

Nine months ended
September 30,

2022

2021


2022

2021

Net income (loss)

9,299

608

13,850

(1,338)


Adjustments:

Finance income

(4,648)

-

(1,611)

-

Finance expense

1,160

1,036

4,392

5,397

Stock based compensation

75

-

232

-

General and administrative expenses

905

650

2,435

2,075

Depletion, depreciation and amortization

1,860

874

5,086

2,679

Impairment of PP&E

-

-

-

-

Other income

(16)

(1)

(45)

(303)

Operating netback

8,635

3,168

24,339

8,510


Netback from operations per BOE

55.16

35.87

57.05

31.45

Adjusted EBITDA is calculated as net income before interest, taxes, depletion and depreciation and other non-cash and non-operating gains and losses. The Company considers this a key measure as it demonstrates its ability to generate cash from operations necessary for future growth excluding non-cash items, gains and losses that are not part of the normal operations of the company and financing costs. The following is the reconciliation of the non-GAAP measure adjusted EBITDA:

(US $000)


Three months ended
September 30,

Nine months ended
September 30,


2022

2021

2022

2021

Net income (loss)


9,299

608


13,850

(1,338)

Depletion and depreciation


1,860

874


5,086

2,679

Accretion


8

6


20

19

Interest expense


281

237


718

700

Unrealized (gain) loss on commodity contracts


(4,648)

11


(1,608)

2,953

Share based compensation


75

-


232

-

Interest income


-

-

(3)

-

Other income


(16)

(1)

(45)

(305)

Foreign currency (gain) loss


15

2

8

3


Adjusted EBITDA


6,874

1,737

18,258

4,711

CAUTIONARY STATEMENTS

In this news release and the Company’s other public disclosure:

  1. The Company's natural gas production is reported in thousands of cubic feet ("Mcfs"). The Company also uses references to barrels ("Bbls") and barrels of oil equivalent ("Boes") to reflect natural gas liquids and oil production and sales. Boes may be misleading, particularly if used in isolation. A Boe conversion ratio of 6 Mcf:1 Bbl is based on an energy equivalency conversion method primarily applicable at the burner tip and does not represent a value equivalency at the wellhead. Given that the value ratio based on the current price of crude oil as compared to natural gas is significantly different from the energy equivalency of 6:1, utilizing a conversion on a 6:1 basis may be misleading as an indication of value.
  2. Discounted and undiscounted net present value of future net revenues attributable to reserves do not represent fair market value.
  3. Possible reserves are those additional reserves that are less certain to be recovered than probable reserves. There is a 10% probability that the quantities actually recovered will equal or exceed the sum of proved plus probable plus possible reserves.
  4. The Company discloses peak and 30-day initial production rates and other short-term production rates. Readers are cautioned that such production rates are preliminary in nature and are not necessarily indicative of long-term performance or of ultimate recovery.

Caution Regarding Forward-Looking Information

This release contains forward-looking information including information regarding the proposed timing and expected results of exploratory and development work including production from the Company's Tishomingo field, Oklahoma acreage, expectations regarding cash flow, the Company’s reserves based loan facility, including scheduled repayments, expected hedging levels and the Company’s strategy and objectives. The use of any of the words “target”, “plans”, "anticipate", "continue", "estimate", "expect", "may", "will", "project", "should", "believe" and similar expressions are intended to identify forward-looking statements.

Such forward-looking information is based on management’s expectations and assumptions, including that the Company's geologic and reservoir models and analysis will be validated, that indications of early results are reasonably accurate predictors of the prospectiveness of the shale intervals, that previous exploration results are indicative of future results and success, that expected production from future wells can be achieved as modeled and that declines will match the modeling, that future well production rates will be improved over existing wells, that rates of return as modeled can be achieved, that recoveries are consistent with management’s expectations, that additional wells are actually drilled and completed, that design and performance improvements will reduce development time and expense and improve productivity, that discoveries will prove to be economic, that anticipated results and estimated costs will be consistent with managements’ expectations, that all required permits and approvals and the necessary labor and equipment will be obtained, provided or available, as applicable, on terms that are acceptable to the Company, when required, that no unforeseen delays, unexpected geological or other effects, equipment failures, permitting delays or labor or contract disputes are encountered, that the development plans of the Company and its co-venturers will not change, that the demand for oil and gas will be sustained, that the Company will continue to be able to access sufficient capital through financings, credit facilities, farm-ins or other participation arrangements to maintain its projects, that the Company will continue in compliance with the covenants under its reserves-based loan facility and that the borrowing base will not be reduced, that funds will be available from the Company’s reserves based loan facility when required to fund planned operations, that the Company will not be adversely affected by changing government policies and regulations, social instability or other political, economic or diplomatic developments in the countries in which it operates and that global economic conditions will not deteriorate in a manner that has an adverse impact on the Company's business and its ability to advance its business strategy.


Contacts

For further information, contact:
Wolf E. Regener, President and Chief Executive Officer +1 (805) 484-3613
Email: This email address is being protected from spambots. You need JavaScript enabled to view it.
Website: www.kolibrienergy.com


Read full story here

DUBLIN--(BUSINESS WIRE)--The "Diesel Engine Lubricants Market - Global Outlook & Forecast 2022-2027" report has been added to ResearchAndMarkets.com's offering.


Diesel engine lubricants are used in heavy machines, construction equipment, commercial vehicles, agricultural machines & equipment, and others. The continued requirement of lubricants in these end-use applications for effective and efficient performance drives the demand for diesel engine lubricants.

Increasing demand for heavy vehicles and construction equipment will drive the growth of diesel engine lubricants globally. The demand for commercial vehicles in India, China, Brazil, South Korea, Argentina, Mexico, and South Africa is growing because of rapid development in the automotive and infrastructure industry. This has created a healthy environment for the diesel engine lubricants market growth.

MARKET TRENDS

a) Infrastructure development in emerging economies due to subsidies offered by local governments for industrial development and FDIs. This increases the demand for heavy equipment, ultimately increasing lubricants' demand.

b) Diesel engines are used in heavy and light commercial vehicles, passenger cars, heavy construction equipment, warehousing machines & equipment, railway and marine transportation, and others. However, the use of diesel engines is decreasing in passenger cars due to environmental regulations and emission control rules. However, commercial and heavy equipment still require diesel engines to operate efficiently.

c) Diesel engines offer higher fuel efficiency and torque compared to petrol engines. The various characteristics of diesel engines help them deliver higher performance and fuel efficiency. Diesel engines have more torque than petrol engines due to the higher compression ratio in diesel engines; combustion speed is high, length of stroke is more, use of turbocharger and calorific value of diesel is more.

d) The US, China, India, South Korea, Brazil, the UK, Germany, Canada, and Saudi Arabia developed rapidly regarding infrastructure. These projects increased the demand for construction equipment, such as loaders, excavators, and dumpers. There is infrastructure development in emerging economies due to subsidies offered by local governments for industrial development and FDIs. This increases the demand for heavy equipment, ultimately increasing lubricants demand.

Market Dynamics

Market Opportunities & Trends

  • Higher Efficiency and Increased Power Output Than Petrol Engines
  • Rapid Infrastructure Development
  • Increasing Demand for Commercial Vehicles in Emerging Economies

Market Growth Enablers

  • Increasing Demand for Bio-Diesel as Fuel
  • Significant Growth in Power Generation Sector

Market Restraints

  • Pollution Aspects of Diesel Engine
  • Increased Adoption of Electric and Hybrid Vehicles

Trade Scenario in Overall Lubricants Market

The global diesel engine lubricants market is highly influenced by the supply and demand scenario of the overall lubricants. Lubricants garner a significant demand share of around 20% to 25% in the general industry. Factors such as increased commercial vehicle requirements, considerable demand for lower viscosity oils, and growth in construction activities are projected to drive the diesel engine lubricants market during the forecast period.

MARKET SEGMENTS

Segmentation by Oil Type

  • Mineral Oil
  • Synthetic Oil

Segmentation by End Use

  • Automotive & Transportation
  • Heavy Industrial
  • Power Generation
  • Others

Segmentation by Geography

  • APAC
  • China
  • India
  • Japan
  • Indonesia
  • South Korea
  • North America
  • US
  • Canada
  • Europe
  • Germany
  • Russia
  • Italy
  • Spain
  • France
  • Latin America
  • Mexico
  • Brazil
  • Argentina
  • Middle East & Africa
  • Iran
  • UAE
  • Saudi Arabia
  • South Africa

Key Vendors

  • Castrol Limited
  • Chevron Corporation
  • ExxonMobil Corporation
  • Shell PLC
  • TotalEnergies

Other Prominent Vendors

  • Bharat Petroleum Corporation Limited (BPCL)
  • BP PLC
  • FUCHS
  • Gazpromneft - Lubricants Ltd
  • GS Caltex Corporation
  • Gulf Oil International limited
  • Hindustan Petroleum Corporation Limited (HPCL)
  • Idemitsu Kosan Co., Ltd.
  • Indian Oil Corporation Limited (IOCL)
  • Kuwait Dana Lubes Company
  • Liqui Moly
  • Motul
  • Pennzoil
  • Petro Canada Lubricants
  • Petroliam Nasional Berhad (PETRONAS)
  • Philips 66
  • Ravensberger Schmierstoffvertrieb GmbH (Ravenol)
  • Repsol
  • Sinopec
  • Valvoline Inc.

KEY QUESTIONS ANSWERED:

1. How big is the global diesel engine lubricants market in revenue?

2. What is the growth rate of the diesel engine lubricants market?

3. What are the key driving factors for the growth of the diesel engine lubricants market?

4. Who are the major vendors in the global diesel engine lubricants market?

5. Which region accounted for the largest diesel engine lubricants market share?

Key Topics Covered:

1 Research Methodology

2 Research Objectives

3 Research Process

4 Scope & Coverage

5 Report Assumptions & Caveats

6 Market at a Glance

7 Premium Insights

8 Introduction

9 Market Opportunities & Trends

10 Market Growth Enablers

11 Market Restraints

12 Market Landscape

13 End-User

14 Oil Type

15 Geography

16 APAC

17 North America

18 Europe

19 Latin America

20 Middle East & Africa

21 Competitive Landscape

22 Key Company Profiles

23 Other Prominent Vendors

24 Report Summary

25 Quantitative Summary

26 Geography

27 Appendix

Companies Mentioned

For more information about this report visit https://www.researchandmarkets.com/r/z1alkv


Contacts

ResearchAndMarkets.com
Laura Wood, Senior Press Manager
This email address is being protected from spambots. You need JavaScript enabled to view it.
For E.S.T Office Hours Call 1-917-300-0470
For U.S./ CAN Toll Free Call 1-800-526-8630
For GMT Office Hours Call +353-1-416-8900

  • The pilot is the result of the synergy between Enel and Brenmiller, applied for the first time in the world at the Santa Barbara power plant in Tuscany, Italy
  • The technology allows energy to be stored as heat and makes the power plant more flexible, thanks to Brenmiller’s innovative solution, with room to expand the decarbonization of industrial heating demand

ROME & CAVRIGLIA, Italy--(BUSINESS WIRE)--$BNRG--The Enel Group and Brenmiller Energy Ltd. ("Brenmiller", "Brenmiller Energy”; TASE: BNRG, Nasdaq: BNRG), inaugurated today an innovative, sustainable energy storage system in Santa Barbara, Tuscany, in the municipality of Cavriglia (province of Arezzo), in the presence of the President of the Region of Tuscany Eugenio Giani, the Mayor of Cavriglia Leonardo Degl’Innocenti o Sanni, Ambassador-Designate of Israel to Italy Alon Bar, Head of Enel Green Power and Thermal Generation at Enel Salvatore Bernabei, Chief Innovability® Officer of Enel Ernesto Ciorra and Chairman and CEO of Brenmiller Energy, Avi Brenmiller.


The goal of this Thermal Energy Storage (“TES”) project is to build an innovative thermal storage system in Santa Barbara, which is completely sustainable and capable of accelerating the energy transition. The integration of the TES system with the existing power plant enables Enel and Brenmiller to test the technology in the field, in challenging operating conditions and on a large scale. The system offers reduced power plant start-up times and greater speed in load variations, which are necessary performance requirements to enable the efficient use of renewable energy. The system can be used to store excess energy produced from renewable sources in the form of heat to offer decarbonization services to industrial customers and to integrate long-term storage solutions with renewable plants.

Brenmiller Energy developed the technology in Israel and supplied the storage system; Enel integrated the system with its Santa Barbara power plant and helped to validate its performance in a real environment.

The TES technology utilizes a two-stage charge and discharge process to provide thermal energy. During the charging phase, steam produced by the Santa Barbara facility passes through pipes to heat adjacent crushed rocks; during the discharging phase, the accumulated heat is released to heat pressurized water and generate steam for electricity. This first-of-its-kind TES system can store up to 24MWh of clean heat at a temperature of about 550°C for five hours, providing critical resiliency to the power plant.

“Flexibility and adequacy are two fundamental components of an efficient and reliable electricity system, which can be supplied more and more efficiently by storage,” said Salvatore Bernabei, Head of Enel Green Power and Thermal Generation at Enel. "This trial allows us to validate a family of innovative and sustainable technologies in the segment of long-term storage, which will allow for an ever greater integration of renewables into the grid."

“This solution makes renewables more reliable, flexible and resilient and can be used to decarbonize sectors that need heat at high temperatures,” said Ernesto Ciorra, Director of Innovability® of Enel. “Furthermore, it does not involve any use of rare materials and can be made using stones available in every part of the planet, so it is scalable in a sustainable way everywhere. We thank the colleagues of the Tel Aviv hub for having found it and our Italian colleagues for having implemented it, thanks also to the financial support deriving from the collaboration between the Italian and Israeli governments.”

Our TES system at Enel’s Santa Barbara power plant in Tuscany is the first-ever system of its kind to provide utility-scale thermal energy storage and offers commercial and industrial users a viable path towards decarbonization,” said Avi Brenmiller, Chairman and CEO of Brenmiller Energy. “The TES also makes it possible to add additional renewables to the grid with greater reliability. We believe the success of this moment reflects the types of innovative collaborations needed to transition the global economy away from its heavy, albeit lessening, dependence on fossil fuels, and towards a 100% clean, flexible, and affordable energy grid.”

Eugenio Giani, President of the Region of Tuscany, said: “This inauguration confirms that Tuscany has a central role for energy, both for production and for innovation. Welcoming sustainability today means doing good for the environment, attracting investments and creating value, which is why we are particularly happy with Enel's choice to test here in Santa Barbara, which has always been a land of work and ingenuity, new technologies that can be applied on a scale. world. Tuscany is already one of the most virtuous Italian regions with over 50% of self-produced energy from renewable sources and an important research and innovation fabric, today we take a new step into the future with the hope that it will be a further contribution to overcome the energy crisis."

"Today we are celebrating a successful Italian-Israeli cooperation experience thanks to which Italy will benefit from an innovative made-in-Israel solution for energy storage," said the Ambassador-Designate of Israel in Italy, Alon Bar. "A technology that stands out in the international search for clean energy solutions to face the current global energy crisis. The Brenmiller Energy-Enel partnership takes the form of a continuation of the commitment made by the Israeli Embassy in promoting the collaboration protocol between the Israel Innovation Authority and Enel signed in 2015. This makes us particularly happy and enthusiastic in continuing to help these companies to thrive."

The collaboration between Enel and Brenmiller came about as part of an Italian-Israeli collaboration protocol aimed at accelerating cooperation between Israeli companies and large Italian industries. The project was partly financed by the Israeli Innovation Authority, which supported Brenmiller with 1 million euros in financing.

About Enel

Enel, which celebrates its 60th anniversary this year, is a multinational power company and a leading integrated player in the global power and renewables markets. At global level, it is the largest renewable private player, the foremost network operator by number of end users and the biggest retail operator by customer base. The Group is the worldwide demand response leader and the largest European utility by ordinary EBITDA [1]. Enel is present in 30 countries worldwide, producing energy with around 92 GW of total capacity. Enel Grids, the Group’s global business line dedicated to the management of the electricity distribution service worldwide, delivers electricity through a network of around 2.3 million kilometers to more than 75 million end users. The Group brings energy to around 70 million homes and businesses. Enel’s renewables arm Enel Green Power has a total capacity of around 55 GW and a generation mix that includes wind, solar, geothermal, and hydroelectric power, as well as energy storage facilities, installed in Europe, the Americas, Africa, Asia, and Oceania. Enel X Global Retail, Enel's global business line active in the areas of energy supply and efficiency, has a total capacity of around 7.9 GW of demand response managed globally and has installed 62 MW of behind-the-meter storage capacity. In addition, Enel X Way is the Group’s new company fully dedicated to electric mobility, managing more than 380,000 public and private EV charging points worldwide, both directly and through interoperability agreements. [1] Enel’s leadership in the different categories is defined by comparison with competitors’ FY 2021 data. Publicly owned operators are not included.

About Brenmiller Energy Ltd.

Brenmiller Energy delivers scalable thermal energy storage solutions and services that allow customers to cost-effectively decarbonize their operations. Its patented bGen thermal storage technology enables the use of renewable energy resources, as well as waste heat, to heat crushed rocks to very high temperatures. They can then store this heat for minutes, hours, or even days before using it for industrial and power generation processes. With bGen, organizations have a way to use electricity, biomass and waste heat to generate the clean steam, hot water and hot air they need to mold plastic, process food and beverages, produce paper, manufacture chemicals and pharmaceuticals or drive steam turbines without burning fossil fuels. For more information visit the company’s website at https://bren-energy.com/ and follow the company on Twitter and LinkedIn.

Cautionary Note Regarding Forward-Looking Statements

This press release contains "forward-looking statements" within the meaning of the safe harbor provisions of the Private Securities Litigation Reform Act of 1995 and other federal securities laws. Statements that are not statements of historical fact may be deemed to be forward-looking statements. For example, the Company is using forward-looking statements in this press release when it discusses the potential benefits and capabilities of the Company’s TES system, the goals of the TES project in Santa Barbara, the sustainable qualities and capabilities of the TES system, including the possibility to store excess energy so that it is available when needed as well as to add additional renewables to the grid with greater reliability, and that the TES can become a powerful enabler for the electrification of industrial thermal consumption. Without limiting the generality of the foregoing, words such as "plan," "project," "potential," "seek," "may," "will," "expect," "believe," "anticipate," "intend," "could," "estimate" or "continue" are intended to identify forward-looking statements. Readers are cautioned that certain important factors may affect the Company's actual results and could cause such results to differ materially from any forward-looking statements that may be made in this press release. Factors that may affect the Company's results include, but are not limited to, the Company’s planned level of revenues and capital expenditures, the demand for and market acceptance of our products, impact of competitive products and prices, product development, commercialization or technological difficulties, the success or failure of negotiations and trade, legal, social and economic risks and the risks associated with the adequacy of existing cash resources. The forward-looking statements contained or implied in this press release are subject to other risks and uncertainties, many of which are beyond the control of the Company, including those set forth in the Risk Factors section of the Company's prospectus dated May 24, 2022 filed with the U.S. Securities and Exchange Commission ("SEC"), which is available on the SEC's website, www.sec.gov. The Company undertakes no obligation to update these statements for revisions or changes after the date of this release, except as required by law.


Contacts

Enel
Global News Media
T +39 06 8305 5699
This email address is being protected from spambots. You need JavaScript enabled to view it.
enel.com

Brenmiller Energy
Media for Brenmiller
Tori Bentkover
This email address is being protected from spambots. You need JavaScript enabled to view it.

Investor Relations for Brenmiller
Chase Jacobson
This email address is being protected from spambots. You need JavaScript enabled to view it.

DUBLIN--(BUSINESS WIRE)--The "Maritime Safety System Global Market Report 2022" report has been added to ResearchAndMarkets.com's offering.


The global maritime safety system market is expected to grow from $17.66 billion in 2021 to $18.40 billion in 2022 at a compound annual growth rate (CAGR) of 4.19%. The marine safety system market is expected to grow to $24.62 billion in 2026 at a compound annual growth rate (CAGR) of 7.56%.

The main types of systems include ship security reporting system, automatic identification system (AIS), global maritime distress safety system (GMDSS), long range tracking and identification (LRIT) system, vessel monitoring and management system, other systems (automated manifest system (AMS), and automated mutual assistance vessel rescue system (AMVER). Security reporting system refers to electric systems used to prevent or abate potential risks in ships by taking less hazardous processes programs to reduce injuries and property loss. The maritime safety systems are used for loss prevention and detection, security management, counter piracy, coastal monitoring, safety of ship, pollution prevention and response (PPR) management. They used by government institutions, oil & gas, marine & construction, shipping & transportation, cargos & containers, other end-users.

Asia-Pacific was the largest region in the maritime safety system market in 2021 and is also expected to be the fastest-growing region in the forecast period. The regions covered in the maritime safety system market report are Asia-Pacific, Western Europe, Eastern Europe, North America, South America, Middle East and Africa.

The growing maritime trade and transportation are expected to propel the maritime safety system market. The increased well-being of consumers leads to increased production. The lower emissions on long voyages, maritime trade, and transportation assist producers in remaining competitive. The volume of products moved on a single trip is greater, making sea transport more cost-effective and environmentally friendly than other methods of shipping goods over long distances. For instance, In April 2019, a report published by the Organisation for Economic Co-operation and Development projected a significant increase in a variety of ocean economic activities by 2030. According to estimates, the worldwide value generated by ocean-based industries could double from $1.5 trillion in 2010 to $ 3 trillion in 2030. Therefore, the rising maritime trade and transportation will drive the maritime safety system.

Technology developments such as AI, IoT are a key trend gaining popularity in the maritime safety system market. For a long time, the key technology of marine safety and systems has remained unchanged. However, the rising number of accidents, terrorism, and other components is now subject to many changes created within maritime safety and security by involving AI, IoT, Big Data, digital route management, innovative defense technology, integrated control systems, and others.

For instance, In December 2020, Iridium Communications, satellite communications company, has introduced its GMDSS service that is embedded with a strong network of 66 cross-linked Low Earth Orbit (LEO) satellites which provide low latency, high-quality, and real-time voice and data connections across the entire system, including seas and polar regions.

Markets Covered:

1) By System: Ship Security Reporting System; Automatic Identification System (AIS); Global Maritime Distress Safety System (GMDSS); Long Range Tracking and Identification (LRIT) System; Vessel Monitoring and Management System; Other Systems

2) By Application: Loss prevention and detection; Security management; Counter piracy; Coastal monitoring; Safety of ship; Pollution Prevention and Response (PPR) management

3) By End User: Government Institutions; Oil & Gas; Marine & construction; Shipping & Transportation; Cargos & containers; Other End-Users

Key Topics Covered:

1. Executive Summary

2. Maritime Safety System Market Characteristics

3. Maritime Safety System Market Trends And Strategies

4. Impact Of COVID-19 On Maritime Safety System

5. Maritime Safety System Market Size And Growth

6. Maritime Safety System Market Segmentation

7. Maritime Safety System Market Regional And Country Analysis

8. Asia-Pacific Maritime Safety System Market

9. China Maritime Safety System Market

10. India Maritime Safety System Market

11. Japan Maritime Safety System Market

12. Australia Maritime Safety System Market

13. Indonesia Maritime Safety System Market

14. South Korea Maritime Safety System Market

15. Western Europe Maritime Safety System Market

16. UK Maritime Safety System Market

17. Germany Maritime Safety System Market

18. France Maritime Safety System Market

19. Eastern Europe Maritime Safety System Market

20. Russia Maritime Safety System Market

21. North America Maritime Safety System Market

22. USA Maritime Safety System Market

23. South America Maritime Safety System Market

24. Brazil Maritime Safety System Market

25. Middle East Maritime Safety System Market

26. Africa Maritime Safety System Market

27. Maritime Safety System Market Competitive Landscape And Company Profiles

28. Key Mergers And Acquisitions In The Maritime Safety System Market

29. Maritime Safety System Market Future Outlook and Potential Analysis

30. Appendix

Companies Mentioned

  • Raytheon Anschutz
  • Honeywell
  • Elbit Systems
  • Saab Group
  • OSI Maritime Systems

For more information about this report visit https://www.researchandmarkets.com/r/o29o9y


Contacts

ResearchAndMarkets.com
Laura Wood, Senior Press Manager
This email address is being protected from spambots. You need JavaScript enabled to view it.
For E.S.T Office Hours Call 1-917-300-0470
For U.S./ CAN Toll Free Call 1-800-526-8630
For GMT Office Hours Call +353-1-416-8900

Offshore Source Logo

Offshore Source keeps you updated with relevant information concerning the Offshore Energy Sector.

Any views or opinions represented on this website belong solely to the author and do not represent those of the people, institutions or organizations that Offshore Source or collaborators may or may not have been associated with in a professional or personal capacity, unless explicitly stated.

Corporate Offices

Technology Systems Corporation
8502 SW Kansas Ave
Stuart, FL 34997

info@tscpublishing.com