Business Wire News

  • Patent approved for Encino’s mobile continuous emissions monitoring units for measuring methane intensity and other elements
  • Mobile units provide for rapid deployment of high-definition, intelligent visual gas monitoring cameras to remote locations
  • Portability makes real-time continuous emissions monitoring economical for Energy, Landfill, Real Estate, Municipalities, Agricultural and other industrial applications

HOUSTON--(BUSINESS WIRE)--Encino Environmental Services, LLC (“Encino”), a leader in emissions performance testing, detection, quantification, and analytics for the Energy sector and other industries, today announced that the U.S. Patent and Trademark Office has approved Encino’s patent application and issued a new patent, further strengthening the company’s intellectual property position and value proposition.


The patent covers Encino’s proprietary technology for providing a visual Continuous Emissions Monitoring System (CEMS) on a mobile platform with an extendable mast that may be mounted to a vehicle or a trailer. Encino’s mobile CEMS capability is the backbone behind the Company’s EmVision™ service offering, which provides for rapid mobilization of accurate continuous emissions monitoring, including methane intensity, flare monitoring & efficiency and flame detection. Additionally, the extendable mast makes on-site deployment in the field fast and simple, without the time and expense of securing fixed camera units at a well site, pipeline location, or production facility.

Encino’s proprietary technology is applicable to remote locations where Energy production and storage, Landfills, and Agricultural operations are typically situated. Mobility also provides a significant cost savings to clients seeking high-quality, real-time visual analysis of their methane emissions profiles by making hyperspectral and multi-spectral imaging technology portable, so it can be mobilized economically to multiple locations.

“This patent demonstrates Encino’s commitment to helping the Energy sector produce cleaner energy using innovative technology,” said Scott McCurdy, Encino’s CEO. “Demand for high-quality, transparent methane emissions monitoring, detection, and analysis solutions is increasing rapidly. Clients using our proprietary mobile continuous monitoring units can dispatch high-definition continuous emissions monitoring cameras to sites quickly and easily, allowing them to use fewer units for meeting tactical compliance requirements and strategic ESG initiatives field-wide.

McCurdy continued, “We have deployed mobile units for nearly twenty clients over the past eighteen months, including upstream and midstream oil and gas operations, oilfield services and landfill operations. This patent validates the uniqueness and innovation of our product offering. We are investing aggressively to grow our fleet and meet accelerating demand from both new and existing clients.”

Encino’s CEMS program, combined with its emissions testing, leak detection and repair, satellite emissions monitoring and emissions reduction products make Encino one of the broadest providers of emissions solutions in the industry. When utilized together, these technologies help Encino clients leverage data from their compliance programs and continuous monitoring initiatives to develop accurate and actionable emissions profiles and a truer picture of their carbon intensity.

Williams, one of the nation’s largest midstream energy companies and an investor in Encino Environmental Services, has been successfully using the Encino technology in its field operations over the past 12 months. “The mobile CEMS systems have provided us with the highest quality visual emissions data, allowing us to quickly make decisions and take action that further reduces our emissions,” said Mark Gebbia, Williams Vice President, Environmental, Regulatory and Permitting and Encino board member. “The CEMS camera data combined with Encino engine testing and leak detection services gives us multiple sources of emissions data, ensuring a complete emissions profile that we can use in pursuit of our climate goals.”

The foundation of Encino’s analytics is trusted, accurate data having a verifiable audit trail, which is required for making tangible and meaningful operational improvements, reducing risk, capitalizing on certified gas markets and differentiating with investors for accessing capital on favorable terms.

About Encino Environmental Services

Formed in 2010 and headquartered in Houston, Texas, Encino Environmental Services, LLC is an emissions performance testing and monitoring firm that specializes in environmental consulting, combustion analysis, LDAR (leak detection and repair), CEMS (continuous emissions monitoring systems), Satellite methane emissions monitoring and advanced environmental data platforms for the measurement and minimization of emissions to support regulatory compliance and ESG strategies and objectives. The Company operates across the U.S. covering all major oil and gas basins and select international markets. Additional information can be found at www.encinoenviron.com.


Contacts

Encino Environmental Services, LLC
Taylor Hennigan
VP Business Development & Marketing
This email address is being protected from spambots. You need JavaScript enabled to view it.

DUBLIN--(BUSINESS WIRE)--The "U.A.E. Diesel Generator Set Market Size and Share Analysis by Power Rating (15-75 kVA, 76-375 kVA, 376-750 kVA, 751-1,000 kVA, Above 1,000 kVA), Application (Commercial, Industrial, Residential) - Industry Forecast to 2030" report has been added to ResearchAndMarkets.com's offering.


From $143.6 million in 2021, the U.A.E. diesel generator set market is likely to observe a compound annual growth rate of 4.0% throughout 2021-2030 and reach $204.5 million, according to this market research report. The considerable advance is credited to the increasing requirement for backup and prime sources of power, chiefly in residential spaces, retail outlets, hotels, hospitals, and other commercial spaces. The industry is also driven by the high demand for diesel gensets with medium and high power ratings from the mining, construction, energy & power, manufacturing, and oil & gas sectors.

The 376-750 kVA category had the largest share, of more than 40%, of the U.A.E. diesel generator set market in 2021. This is credited to the increasing installation of these gensets in shops, healthcare centers, hospitality units, and industrial facilities as a backup electricity source.

The largest revenue share, of 40%, in the U.A.E. diesel generator set market, was held by the industrial category in 2021, and it is likely to showcase significant growth in the years to come. The booming industrial development across the nation, driven by government efforts to lessen their reliance on oil & gas, is driving the sales of diesel generator sets.

The U.A.E. is also observing a growing usage of data centers by hyperscale cloud providers and businesses across other sectors looking to exploit the national and global data consumption. The government has also driven the need for cloud-based facilities in the nation. Additionally, with the quick development of technologies such as IoT, big data, edge computing, and 5G connectivity, extra space for data has become essential in the U.A.E.

The requirement for fuel-efficient DG sets is rising among construction businesses, oil & gas firms, and other enterprises in the nation. To content the surging need, U.A.E. diesel generator set market players are introducing innovative products, entering into partnerships, and allotting resources and funds to establish or develop their supply chains.

The U.A.E. has hosted numerous international events in the recent past, for example, the Abu Dhabi International Book Fair, which brought together more than 1,000 exhibitors from 50 nations; it was organized in 2022. Furthermore, in 2019, the AFC Asian Cup was held, witnessing the participation of 24 teams. Likewise, the Special Olympics World Games were held in Abu Dhabi and attended by around 7,500 athletes. Further, Expo 2020, which was one of the biggest recent events in Dubai, was held in 2021.

Market Dynamics

Trends

  • Launch of advanced diesel gensets

Drivers

  • Increasing number of data centers
  • Rising number of infrastructure projects
  • Surging population and rapid urbanization
  • Impact Analysis of Drivers on Market Forecast

Restraints

  • Adoption of alternative, clean-energy power sources

Company Profiles

  • Cummins Inc.
  • Kohler Co.
  • Kubota Corporation
  • Atlas Copco AB
  • Mitsubishi Heavy Industries Ltd.
  • Generac Holdings Inc.
  • Rolls-Royce plc
  • Caterpillar Inc.
  • Doosan Enerbility Co. Ltd.
  • Wacker Neuson Group
  • Aksa Power Generation FZE
  • Jubaili Bros

For more information about this report visit https://www.researchandmarkets.com/r/68s2d7


Contacts

ResearchAndMarkets.com
Laura Wood, Senior Press Manager
This email address is being protected from spambots. You need JavaScript enabled to view it.
For E.S.T Office Hours Call 1-917-300-0470
For U.S./ CAN Toll Free Call 1-800-526-8630
For GMT Office Hours Call +353-1-416-8900

Historic Partnership Supports Poland’s Energy Goals with Proven Reactor Technology

CRANBERRY TOWNSHIP, Pa.--(BUSINESS WIRE)--The Polish government announced today that it has selected Westinghouse Electric Company’s AP1000® nuclear reactor technology to advance the country’s clean and secure energy future.


Poland’s Council of Ministers formally approved a resolution selecting Westinghouse to be the technology supplier for the Polish government’s six to nine GWe nuclear program. This program will start with three reactors at the Lubiatowo-Kopalino site in northern Poland.

U.S. Ambassador to Poland Mark Brzezinski welcomed the announcement by the Government of Poland.

“I am grateful for the leadership that Prime Minister (Mateusz) Morawiecki showed by overseeing the selection of Westinghouse for this historic project. Today, Poland is investing in a clean and secure energy future for all of the Polish people,” said Ambassador Brzezinski.

“This is an historic day for Poland and for Westinghouse. We are honored to partner with the Polish government on the launch of a new era of energy security, one that will bring reliable, affordable carbon-free electricity and economic benefits to the people of Poland,” said Patrick Fragman, Westinghouse President and CEO. “This project will create thousands of jobs during construction and for many decades of operation of the plants.”

Westinghouse announced in September Memoranda of Understanding with 22 additional companies in Poland for cooperation on construction of AP1000 reactors in Poland and at other potential projects in Central Europe. Westinghouse has committed to establishing a major engineering center and is planning various additional industrial investments to support training and development of Poland’s nuclear power talents and workforce. Westinghouse contemplates engaging on a broad scale both the U.S. and European supply chains on this exceptional project, in order to build a fleet of AP1000 reactors in the region.

The AP1000 nuclear reactor is the only operating Generation III+ reactor with fully passive safety systems, modular construction design and has the smallest footprint per MWe on the market. In addition to two AP1000 units being completed at the Vogtle site in the United States, four AP1000 units are currently setting operational performance records in China with four additional units under construction. Westinghouse AP1000 technology also has been selected for two additional units in China, nine units in Ukraine, and is under consideration at multiple other sites in Central and Eastern Europe, the United Kingdom, and in the United States.

###

Westinghouse Electric Company is shaping the future of carbon-free energy by providing safe, innovative nuclear and other clean power technologies globally. Westinghouse supplied the world’s first commercial pressurized water reactor in 1957 and the company’s technology is the basis for nearly one-half of the world's operating nuclear plants. Over 135 years of innovation makes Westinghouse the preferred partner for advanced technologies covering the complete nuclear energy life cycle. For more information, visit www.westinghousenuclear.com and follow us on Facebook, LinkedIn and Twitter.


Contacts

This email address is being protected from spambots. You need JavaScript enabled to view it.

ATHENS, Greece--(BUSINESS WIRE)--Danaos Corporation (NYSE: DAC), one of the world’s largest independent owners of containerships, announced today that it will release its results for the third quarter ended September 30, 2022, after the close of the market in New York on Monday, November 7, 2022.

The Company’s management team will host a conference call to discuss the results on Tuesday, November 8, 2022 at 9:00 A.M. ET.

Conference Call Details:

Participants should dial into the call 10 minutes before the scheduled time using the following numbers:

U.S. Toll Free Dial-in: 1 844 802 2437
U.K. Toll Free Dial-in: 0 800 279 9489
Standard International Dial-in: +44 (0) 2075 441 375

Please indicate to the operator that you wish to join the Danaos Corporation earnings call.

A telephonic replay of the conference call will be available until November 15, 2022 by dialing 1 877 344 7529 (US Toll Free Dial In) or 1-412-317-0088 (Standard International Dial In) and using 3987980# as your access code.

Audio Webcast:

A live audio webcast of the conference call will be available through the Danaos Corporation website (www.danaos.com). Participants of the live audio webcast should register on the website approximately 10 minutes prior to the start of the webcast. An archived version of the audio webcast will be available on the website within 48 hours of the completion of the call.

About Danaos Corporation

Danaos Corporation is one of the largest independent owners of modern, large-size containerships. Our current fleet of 71 containerships aggregating 436,589 TEUs and 6 under construction containerships aggregating 46,200 TEUs ranks Danaos among the largest containership charter owners in the world based on total TEU capacity. Our fleet is chartered to many of the world's largest liner companies on fixed-rate charters. Our long track record of success is predicated on our efficient and rigorous operational standards and environmental controls. Danaos Corporation's shares trade on the New York Stock Exchange under the symbol "DAC".

Visit our website at www.danaos.com


Contacts

Evangelos Chatzis
Chief Financial Officer
Danaos Corporation
Athens, Greece
Tel: +30 210 419 6480
E-Mail: This email address is being protected from spambots. You need JavaScript enabled to view it.

Iraklis Prokopakis
Senior Vice President & Chief Operating Officer
Danaos Corporation
Athens, Greece
Tel. +30 210 419 6400
E-Mail: This email address is being protected from spambots. You need JavaScript enabled to view it.

Investor Relations and Financial Media:
Rose & Company
New York
Tel. 212-359-2228
E-Mail: This email address is being protected from spambots. You need JavaScript enabled to view it.

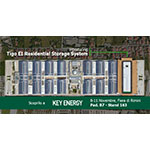
With a pilot installation in Italy and phased release in select European countries, the Tigo Energy Intelligence (EI) Residential Solar Solution will be unveiled at the Key Energy conference in Italy.

MONTEVARCHI, Italy--(BUSINESS WIRE)--Tigo Energy, Inc., the solar industry’s leading Flex MLPE (Module Level Power Electronics) supplier, will unveil the Tigo EI Residential Solar Solution for the European market at the Key Energy conference in Rimini, Italy. Starting with rollouts in Czechia, Germany, and Italy, the new solar-plus-storage platform is designed to ensure faster and simpler design, installation, and service, while providing EU installers with flexibility and more efficient energy management. Solar installers and PV professionals are invited to attend the official unveiling of the EI Residential Solar Solution at Key Energy in booth (B7.163) on November 9th at 11:30 am.


The Tigo EI Residential Solar Solution for the European market consists of Tigo TS4 Flex MLPE products, a new line of single-phase and three-phase inverters, modular DC-coupled energy storage components, and the Tigo EI Link, which acts as the communications hub and central connection point for all grid, inverter, PV, and battery connections. Through module-level monitoring, energy data from the EI Residential Storage System is processed by Tigo Energy Intelligence software, allowing installers to monitor and manage their fleet of customer systems with a few mouse clicks. Tigo customers in the EU will also benefit from industry-leading warranties and a skilled, multilingual support team to ensure that installers are never on their own with Tigo products.

“The Tigo EI Residential system again confirms Tigo as a dynamic company that evolves with the market,” said Cinzia Bardiani, marketing manager at Coenergia. “Tigo products have always been reliable and given installers great flexibility; this all-in-one platform is particularly compelling because it makes communication between the components of the entire system seamless. I am also thrilled to have Tigo as the single point of contact–for the entire system–for everything from design and installation support to warranty matters.”

The Tuscany-based solar installation company, Cecconi snc, and Coenergia, a PV distributor with a fifteen-year presence in the Italian market, deployed the first EI Residential system in Italy. The system includes 15kW of solar generation and 12kWh of energy storage.

“To stay close to my customers for service and upgrades, I must have a dependable system that expedites operations and tracks performance at the module level, and Tigo delivers exactly that with the EI solar-plus-storage setup,” said Massimo Cecconi, technical manager and CEO at Cecconi snc. “Tigo’s stackable configuration and flexible handling made the installation of this system brilliantly simple. I particularly like the pre-cabled EI Link box because it centralizes all connections in a single place and a clear connection diagram on the safety lid. Tigo thinks of the powerful combination of the end customer and the installer.”

Key Energy attendees will have access to Tigo executives and technical experts, including the installer who completed the first EI Residential installation in Italy. Following the conference, several roadshow events around Italy during November and December will showcase the Tigo residential solar-plus-storage solution. Roadshow dates and locations will be announced at the conference.

“With the EI Residential Solar Solution, Tigo now offers the European market a complete home energy solution that delivers the unique added value for which our products are known, with the simplicity that empowers our installer partners,” said Mirko Bindi, senior vice president of sales EMEA and MD Europe at Tigo Energy. “I am particularly happy about working with the teams at Coenergia and Cecconi to deploy this first system in Europe. Both are outstanding partners who make valuable contributions to the entire solar value chain for Tigo in Europe, especially the end customers we all share.”

To learn more about Tigo EI Residential Solar Solution and the Tigo Flex MLPE product family, please visit Tigo at Key Energy (Quartiere Fieristico di Rimini, Italy, Pavilion B7, Booth 163) from November 8th to 11th, 2022. For access to product information and collateral that will be available at the show, visit the Tigo at Key Energy Resource Page. And for a more in-depth discussion, schedule an appointment with a Tigo representative ahead of time here.

About Coenergia

Coenergia is an important distribution company based in Italy, specialized in renewable energy products, including photovoltaic, storage systems, electric charging stations, solar systems (thermic-thermodynamic) and air conditioning. Since the beginning, the company has always granted to customers a wide range of products allowing them to choose the best solution according to any specific requirement.

About Tigo Energy

Tigo Energy, the worldwide leader in Flex MLPE (Module Level Power Electronics), designs innovative solar power conversion and storage products that provide customers more choice and flexibility. The Tigo TS4 platform increases solar production, decreases operating costs, and enhances safety. When combined with the Tigo Energy Intelligence (EI) platform, it delivers module, system, and fleet-level insights to maximize solar performance and minimize operating costs. The Tigo EI Residential Solar Solution, a flexible solar-plus-storage solution for home installations, rounds out the Company’s portfolio of solar energy technology. Tigo was founded in Silicon Valley in 2007 to accelerate the adoption of solar energy, and its global team supports customers whose systems reliably produce gigawatt hours of safe solar energy on seven continents. Find us online at www.tigoenergy.com.


Contacts

Gilberto Lembo
EMEA Marketing Manager at Tigo Energy
This email address is being protected from spambots. You need JavaScript enabled to view it.

HOUSTON--(BUSINESS WIRE)--$TELL #LNG--Tellurian Inc. (Tellurian or the Company) (NYSE American: TELL) ended the third quarter with a 25% increase in net natural gas production and a 32% increase in natural gas sales, as compared to the second quarter of 2022.


President and CEO Octávio Simões said, “Tellurian continues to increase our domestic natural gas production by adding to our footprint, having now a total of 22,420 net acres, interests in 131 producing wells located in the Haynesville Shale, and more than 300 drillable locations*. In addition, Bechtel is continuing construction on the Driftwood terminal, and Tellurian is fully engaged in our efforts to secure strategic equity partners. The underlying market fundamentals strongly support our strategy of seeking the differential value between domestic and international natural gas prices for our shareholders.”

Upstream segment results


Three Months Ended
September 30, 2022

Three Months Ended
September 30, 2021

Net production

11.4 Bcf**

3.9 Bcf

Revenue

$81.1 million

$15.6 million

Operating profit

$40.1 million

$3.5 million

Adjusted EBITDA***

$69.5 million

$10.9 million

*

Inventory of reserve locations as of September 1, 2022 (using August 31, 2022 NYMEX strip pricing and as prepared by Netherland, Sewell & Associates in accordance with the definitions and guidelines set forth in the 2018 Petroleum Resources Management System (PRMS).


**

Billion cubic feet of natural gas


***

Non-GAAP measure – see the end of this press release for a definition and a reconciliation to the most comparable GAAP measure.

Consolidated financial results

Tellurian reported a net loss of approximately $14.2 million, or $0.03 per share (basic and diluted), for the three months ended September 30, 2022, compared to a net loss of $15.9 million, or $0.04 per share (basic and diluted), in the third quarter of 2021.

Tellurian ended the third quarter of 2022 with approximately $1.4 billion in total assets, including approximately $607.5 million of cash and cash equivalents.

About Tellurian Inc.

Tellurian intends to create value for shareholders by building a low-cost, global natural gas business, profitably delivering natural gas to customers worldwide. Tellurian is developing a portfolio of natural gas production, LNG marketing and trading, and infrastructure that includes an ~ 27.6 mtpa LNG export facility and an associated pipeline. Tellurian is based in Houston, Texas, and its common stock is listed on the NYSE American under the symbol “TELL”.

For more information, please visit www.tellurianinc.com. Follow us on Twitter at twitter.com/TellurianLNG

Tellurian will post a video by Executive Chairman Charif Souki on its website at www.tellurianinc.com/news-and-presentations at 10 am Central on November 2, 2022.

CAUTIONARY INFORMATION ABOUT FORWARD-LOOKING STATEMENTS

This press release contains forward-looking statements within the meaning of U.S. federal securities laws. The words “anticipate,” “assume,” “believe,” “budget,” “estimate,” “expect,” “forecast,” “initial,” “intend,” “may,” “plan,” “potential,” “project,” “proposed,” “should,” “will,” “would,” and similar expressions are intended to identify forward-looking statements. Forward-looking statements herein relate to, among other things, the capacity, timing, and other aspects of the Driftwood LNG project, drilling locations, the benefits of Tellurian’s business model, and construction and financing activities. These statements involve a number of known and unknown risks, which may cause actual results to differ materially from expectations expressed or implied in the forward-looking statements. These risks include the matters discussed in Item 1A of Part I of the Annual Report on Form 10-K of Tellurian for the fiscal year ended December 31, 2021, filed by Tellurian with the Securities and Exchange Commission (the SEC) on February 23, 2022, and other Tellurian filings with the SEC, all of which are incorporated by reference herein. The forward-looking statements in this press release speak as of the date of this release. Although Tellurian may from time to time voluntarily update its prior forward-looking statements, it disclaims any commitment to do so except as required by securities laws.

Explanation and Reconciliation of Non-GAAP Financial Measures

The Company reports its financial results in accordance with accounting principles generally accepted in the United States of America (“GAAP”). However, management believes that upstream segment Adjusted EBITDA may provide financial statement users with additional meaningful comparisons between current results, the results of the Company’s peers and of prior periods.

Upstream segment Adjusted EBITDA excludes certain charges or expenditures. Upstream segment Adjusted EBITDA is a supplemental measure of performance and should not be viewed as a substitute for any GAAP measure.

Management presents Upstream segment Adjusted EBITDA because (i) it is consistent with the manner in which the Company’s position and performance are measured relative to the position and performance of its peers and (ii) it is more comparable to earnings estimates provided by securities analysts.

(In thousands, unaudited)


Three Months Ended
September 30,


Nine Months Ended
September 30,


2022


2021


2022


2021


Upstream segment Adjusted EBITDA:


Upstream segment operating profit (loss)


Add back:


$

40,071


$

3,491


$

83,170


$

(4,542

)

Depreciation, depletion and amortization


12,762


3,635


22,441


8,419


Allocated corporate general and administrative


16,709


3,766


31,155


10,925


Upstream segment Adjusted EBITDA


$

69,542


$

10,892


$

136,766


$

14,802


Contacts

Media:
Joi Lecznar
EVP Public and Government Affairs
Phone +1.832.962.4044
This email address is being protected from spambots. You need JavaScript enabled to view it.

Investors:
Matt Phillips
Vice President, Investor Relations
Phone +1.832.320.9331
This email address is being protected from spambots. You need JavaScript enabled to view it.


EDINBURGH, Scotland--(BUSINESS WIRE)--One of Japan’s biggest companies is teaming up with Scottish offshore wind developer, Flotation Energy.

Tokyo Electric Power Company (TEPCO) is Japan’s largest electricity utility; and one of the largest in the world. Its subsidiary, TEPCO Renewable Power, has a generating capacity of 9.9 GW of renewable energy in Japan. This is TEPCOs first major venture into offshore wind markets in the UK and overseas. Flotation Energy will become part of the TEPCO Group.

Flotation Energy is headquartered in Edinburgh, Scotland. The Flotation team is well known for pioneering floating offshore wind and energy transition projects. Its founders Allan MacAskill and Lord Nicol Stephen developed Kincardine, the world’s largest floating windfarm. The company is growing quickly, with the focus on delivering more than 12 GW of commercial scale fixed and floating offshore wind farms and has plans to expand into many more key markets. Flotation Energy is already a Joint Venture Partner in the UK Round 4 Morecambe Project; and White Cross 100 MW floating project in the Celtic Sea.

With TEPCO’s experience and its resources, Flotation Energy is in an even stronger position to help decarbonise countries around the globe.

Renewable energy is central to supporting the UK’s ambitions to lead the world in combatting climate change, reducing our reliance on fossil fuels and embracing a future where renewable energy powers our homes and businesses. This new venture will be at the heart of this energy transiton.

Lord Nicol Stephen, CEO & Co-founder of Flotation Energy, said:

This is a very exciting development for Flotation Energy and recognises the strength and success of our world class team. We have pioneered the growth of floating wind across the globe and have a very significant pipeline of projects in the UK, Ireland, and Asia Pacific.

This new partnership between Scotland and Japan represents a major commitment by TEPCO. It will allow us to move forward quickly with our existing projects and to kick start new opportunities right around the world. Climate change is the biggest challenge facing our planet. A future of clean, green renewable energy has always been our goal.”

Masashi Nagasawa, TEPCO Renewable Power President said:

“We are very pleased and heartened to partner with Flotation Energy, which shares our mission to "deliver clean renewable energy and create a carbon neutral society" as we work together to further develop both companies.

“Flotation Energy’s experience and knowledge of the world's biggest floating offshore wind development and their global network will vastly accelerate the development of our offshore wind business both domestically and internationally.

“Through our collaboration, we will realise our management philosophy of, “Harnessing the Natural Resources to Energy, and further Society” on a global scale.”

ENDS

Notes to Editors:

Flotation Energy is based Edinburgh, Scotland, and has been a significant contributor to building a strong offshore wind industry in the UK and beyond. Flotation Energy has a growing project pipeline of offshore wind projects with more than 12 GW in the UK, Ireland, Taiwan, Japan and Australia; and plans to expand into many more key markets. The expertise of the Flotation Energy team lies in the project and engineering management of large infrastructure projects. Flotation Energy have developed their own projects but also recognise the benefits of collaboration and working in partnership with other developers to deliver proven, cost-effective solutions.

TEPCO Renewable Power (TEPCO RP) is a wholly owned subsidiary of Tokyo Electric Power Company Holdings, Incorporated ("TEPCO Holdings "), the largest power company in Japan. In April 2020, TEPCO RP took its first steps as a company dedicated solely to the renewable energy generation business, the operation of which it assumed from TEPCO Holdings. For many years, TEPCO RP has used a firm business model that covers everything from the planning and construction to the operation & maintenance of hydroelectric and wind power generation facilities. The total capacity of the company's hydroelectric, wind, and solar power facilities is approximately 9.9 giga-watts, and our technical prowess has enabled us to maintain the largest amount of facilities in Japan. In order to seize the significant business opportunities inherent in the global trend towards decarbonization and meet the growing need for CO2-free energy, we aim to significantly expand our renewable generation portfolio globally and contribute to the creation of a clean and sustainable, decarbonized society by harnessing earth's natural resources to the best of our ability in order to provide a stable supply of electricity at low cost.

ENDS


Contacts

Please direct all media enquiries to:
Kirstine Wood
Communications Manager
Flotation Energy Ltd
Mobile: +44 (0) 7775 697 702
Email: This email address is being protected from spambots. You need JavaScript enabled to view it.

  • Reports Q3 Revenue Growth of 43% to $1.36 Billion, Driven by Strong Demand for Services and Addition of HydroChemPSC
  • Delivers Q3 Net Income of $135.8 Million, EPS of $2.50 and Adjusted EPS of $2.43
  • Achieves Q3 Adjusted EBITDA Growth of 67% to $308.6 Million
  • Revises 2022 Adjusted EBITDA and Adjusted Free Cash Flow Guidance
  • Announces CEO Succession Plan in Separate News Release Today 

NORWELL, Mass.--(BUSINESS WIRE)--Clean Harbors, Inc. (“Clean Harbors”) (NYSE: CLH), the leading provider of environmental and industrial services throughout North America, today announced financial results for the third quarter ended September 30, 2022.


“In the third quarter, favorable market dynamics combined with the quality of our offerings drove continued broad-based demand for our comprehensive suite of environmental services and sustainable products,” said Alan S. McKim, Chairman, President and Chief Executive Officer. “We extended our strong 2022 performance with a revenue increase of 43%, growth in Adjusted EBITDA of 67% and a corresponding improvement in Adjusted EBITDA margins of 310 basis points to 22.6%. Our positive results were driven by profitable growth contributions from both of our operating segments. Most importantly, our safety performance in the quarter and year to date was the best in our history with a Total Recordable Incident Rate (TRIR) of just 0.74 through nine months – far below our annual goal of less than 1.0.”

Third-Quarter Results

Revenues increased 43% to $1.36 billion from $951.5 million in the same period of 2021. Income from operations nearly doubled to $209.1 million from $104.8 million in the third quarter of 2021.

Net income was $135.8 million, or $2.50 per diluted share. This compared with net income of $65.4 million, or $1.20 per diluted share, for the same period in 2021. Adjusted for certain items in both periods, adjusted net income was $132.4 million, or $2.43 per diluted share, for the third quarter of 2022, compared with adjusted net income of $62.2 million, or $1.14 per diluted share, for the same period of 2021. (See reconciliation tables below).

Adjusted EBITDA (see description below) increased 67% to $308.6 million from $185.1 million in the same period of 2021.

Q3 2022 Segment Review

Environmental Services (ES) revenues increased 46% year-over-year, and Adjusted EBITDA in the segment rose 57%. Our profitable growth was driven by the October 2021 acquisition of HydroChemPSC (HPC), robust volumes of high-value waste streams, pricing initiatives to combat inflation and strong utilization of people and equipment across all our service businesses,” McKim said. “Utilization of our incinerator network was a healthy 86% in the quarter, up from 82% a year ago. Average incineration pricing rose 10% from a year ago, reflecting price increases and the impact of higher-value waste streams. Landfill volumes increased 38% as we continued to capture more remediation and waste projects. On the strength of sizeable summer activity, our Industrial Services business performed well in the quarter. Safety-Kleen Environmental revenue grew 23% as its core service offerings remained in demand, particularly in the automotive service vertical. Field Services delivered a 29% increase in revenue through the addition of HPC’s utilities business and a variety of local emergency response projects throughout our network. In addition to higher revenue, ES also benefitted from cost-control initiatives and operational efficiencies, resulting in segment EBITDA margin improving 170 basis points from a year ago.

Safety-Kleen Sustainability Solutions (SKSS) delivered record quarterly results as revenues grew 34% in the third quarter, and Adjusted EBITDA climbed 46% from a year ago,” McKim said. “Demand for our base oil was high in Q3 and our network of re-refineries ran well, including the new Georgia plant we acquired in June. We also achieved growth across all of our recycling services offered in this segment including oil filter collection and antifreeze recycling. Waste oil collections remained strong at 62 million gallons. Since its formation less than two years ago, our SKSS team has proven adept at actively managing the front end of our re-refining spread to maximize profitability. The SKSS segment achieved its record performance in the quarter despite the fact that our blended volumes were severely limited by supply chain disruptions resulting from an industrywide additive shortage. The additive industry is beginning to recover, and we expect our blended volumes to increase in 2023 as that remains part of our long-term growth strategy for this segment.”

Business Outlook and Financial Guidance

“Looking ahead, we expect to close out 2022 with a strong fourth-quarter performance,” McKim said. “Within Environmental Services, we continue to see a record backlog of waste and healthy demand for our network of disposal and recycling assets. We anticipate a solid finish to the year through a combination of base business and project work. Our service businesses are all entering the final quarter of the year with good momentum. We are continuing to hire as rapidly as possible across our Environmental Services segment to facilitate additional growth while also reducing our third-party spend.

“Within SKSS, the record results we are achieving this year demonstrate how well we are managing both ends of our re-refining spread,” McKim said. “We are seeing growing interest in our sustainable products, including our recently launched KLEEN+ brand, as customers seek ESG friendly solutions. We are confident that the inherent value of our base oil will increase in the years ahead. On the front end of our re-refining spread, we are continuing to collect the volumes needed for our plants at better rates due to the long-term market impact of IMO 2020, the internal changes we made to the organization, and continuous improvements in our systems and transportation.

“Given our year-to-date performance, we are raising our annual Adjusted EBITDA guidance to more than $1 billion, which reflects the acceleration of demand for our environmentally focused services and products. Our revenue is growing more rapidly than we had expected, which is driving higher than anticipated working capital needs. In addition, we are carrying a higher level of critical inventories to ensure we stay ahead of global supply chain shortages. Therefore, we are reducing our adjusted free cash flow guidance to reflect the timing of working capital from those two factors. With the ongoing backdrop of high inflation and interest rate hikes, we are continuing to execute on our strategies for pricing, cost mitigation and operational efficiencies to drive further margin improvement. We anticipate leveraging the strengths of both operating segments to achieve record top- and bottom-line results in 2022,” McKim concluded.

Based on its year-to-date performance and current market conditions, Clean Harbors is revising its 2022 Adjusted EBITDA and adjusted free cash flow guidance. For the year, the Company now expects:

  • Adjusted EBITDA in the range of $1.010 billion to $1.030 billion, or a midpoint of $1.020 billion. This range is based on anticipated GAAP net income in the range of $387 million to $410 million; and
  • Adjusted free cash flow in the range of $260 million to $290 million, or a midpoint of $275 million. This range is based on anticipated net cash from operating activities in the range of $585 million to $635 million.

Non-GAAP Results

Clean Harbors reports Adjusted EBITDA, which is a non-GAAP financial measure and should not be considered as an alternative to net income or other measurements under generally accepted accounting principles (GAAP), but viewed only as a supplement to those measurements. Adjusted EBITDA is not calculated identically by all companies, and therefore the Company’s measurement of Adjusted EBITDA may not be comparable to similarly titled measures reported by other companies. Clean Harbors believes that Adjusted EBITDA provides additional useful information to investors since the Company’s loan covenants are based upon levels of Adjusted EBITDA achieved and management routinely evaluates the performance of its businesses based upon levels of Adjusted EBITDA. The Company defines Adjusted EBITDA in accordance with its existing revolving credit agreement, as described in the following reconciliation showing the differences between reported net income and Adjusted EBITDA for the three and nine months ended September 30, 2022 and 2021 (in thousands, except percentages):


For the Three Months Ended


For the Nine Months Ended


September 30, 2022


September 30, 2021


September 30, 2022


September 30, 2021

Net income

$

135,799


$

65,443


$

329,270


$

154,254


Accretion of environmental liabilities


3,246


2,799


9,599


8,625


Stock-based compensation


7,828


6,001


20,375


12,786


Depreciation and amortization


88,394


71,451


260,560


215,206


Other (income) expense, net


(104

)


(199

)


(2,073

)


2,509


Gain on sale of business


(8,864

)


Interest expense, net of interest income


28,081


17,984


79,354


53,953


Provision for income taxes


45,311


21,605


109,663


54,973


Adjusted EBITDA

$

308,555


$

185,084


$

797,884


$

502,306


Adjusted EBITDA Margin


22.6

%


19.5

%


20.5

%


18.7

%

This press release includes a discussion of net income and earnings per share adjusted for the impacts of tax-related valuation allowances and other items as identified in the reconciliations provided below. The Company believes that discussion of these additional non-GAAP measures provides investors with meaningful comparisons of current results to prior periods’ results by excluding items that the Company does not believe reflect its fundamental business performance. The following shows the difference between net income and adjusted net income, and the difference between earnings per share and adjusted earnings per share, for the three and nine months ended September 30, 2022 and 2021 (in thousands, except per share amounts):


For the Three Months Ended


For the Nine Months Ended


September 30, 2022


September 30, 2021


September 30, 2022


September 30, 2021

Adjusted net income


Net income

$

135,799


$

65,443


$

329,270


$

154,254


Gain on sale of business


(8,864

)


Tax-related valuation allowances and other


(3,399

)


(3,228

)


(9,494

)


(3,221

)

Adjusted net income

$

132,400


$

62,215


$

310,912


$

151,033


Adjusted earnings per share


Earnings per share

$

2.50


$

1.20


$

6.04


$

2.81


Gain on sale of business


(0.16

)


Tax-related valuation allowances and other


(0.07

)


(0.06

)


(0.18

)


(0.06

)

Adjusted earnings per share

$

2.43


$

1.14


$

5.70


$

2.75


Adjusted Free Cash Flow Reconciliation

Clean Harbors reports adjusted free cash flow, which it considers to be a measurement of liquidity that provides useful information to investors about its ability to generate cash. The Company defines adjusted free cash flow as net cash from operating activities excluding cash impacts of items derived from non-operating activities, less additions to property, plant and equipment plus proceeds from sale and disposal of fixed assets. The Company excludes cash impacts of items derived from non-operating activities such as taxes paid in connection with divestitures. Adjusted free cash flow should not be considered an alternative to net cash from operating activities or other measurements under GAAP. Adjusted free cash flow is not calculated identically by all companies, and therefore the Company’s measurement of adjusted free cash flow may not be comparable to similarly titled measures reported by other companies.

An itemized reconciliation between net cash from operating activities and adjusted free cash flow is as follows for the three and nine months ended September 30, 2022 and 2021 (in thousands):


For the Three Months Ended


For the Nine Months Ended


September 30, 2022


September 30, 2021


September 30, 2022


September 30, 2021

Adjusted free cash flow


Net cash from operating activities

$

225,572


$

102,794


$

357,542


$

368,226


Additions to property, plant and equipment


(96,505

)


(54,666

)


(244,547

)


(146,654

)

Proceeds from sale and disposal of fixed assets


2,095


12,945


5,118


16,424


Adjusted free cash flow

$

131,162


$

61,073


$

118,113


$

237,996


Adjusted EBITDA Guidance Reconciliation

An itemized reconciliation between projected GAAP net income and projected Adjusted EBITDA is as follows (in millions):


For the Year Ending

December 31, 2022

Projected GAAP net income

$387

to

$410

Adjustments:


Accretion of environmental liabilities

13

to

12

Stock-based compensation

26

to

29

Depreciation and amortization

345

to

335

Gain on sale of business

(9)

to

(9)

Interest expense, net

115

to

113

Provision for income taxes

133

to

140

Projected Adjusted EBITDA

$1,010

to

$1,030

Adjusted Free Cash Flow Guidance Reconciliation

An itemized reconciliation between projected net cash from operating activities and projected adjusted free cash flow is as follows (in millions):


For the Year Ending

December 31, 2022

Projected net cash from operating activities

$

585


to

$

635


Additions to property, plant and equipment


(330

)

to


(350

)

Proceeds from sale and disposal of fixed assets


5


to


5


Projected adjusted free cash flow

$

260


to

$

290


Conference Call Information

Clean Harbors will conduct a conference call for investors today at 9:00 a.m. (ET) to discuss the information contained in this press release. During the call, management will discuss Clean Harbors’ financial results, business outlook and growth strategy. Investors who wish to listen to the webcast and view the accompanying slides should visit the Investor Relations section of the Company’s website at www.cleanharbors.com. The live call also can be accessed by dialing 201.689.8881 or 877.709.8155 prior to the start time. If you are unable to listen to the live conference call, the webcast will be archived on the Company’s website.

About Clean Harbors

Clean Harbors (NYSE: CLH) is North America’s leading provider of environmental and industrial services. The Company serves a diverse customer base, including a majority of Fortune 500 companies. Its customer base spans a number of industries, including chemical, energy and manufacturing, as well as numerous government agencies. These customers rely on Clean Harbors to deliver a broad range of services such as end-to-end hazardous waste management, emergency spill response, industrial cleaning and maintenance, and recycling services. Through its Safety-Kleen subsidiary, Clean Harbors also is North America’s largest re-refiner and recycler of used oil and a leading provider of parts washers and environmental services to commercial, industrial and automotive customers. Founded in 1980 and based in Massachusetts, Clean Harbors operates in the United States, Canada, Mexico, Puerto Rico and India. For more information, visit www.cleanharbors.com.

Safe Harbor Statement

Any statements contained herein that are not historical facts are forward-looking statements within the meaning of the Private Securities Litigation Reform Act of 1995. These forward-looking statements are generally identifiable by use of the words “believes,” “expects,” “intends,” “anticipates,” “plans to,” “seeks,” “should,” “estimates,” “projects,” “may,” “likely,” or similar expressions. Such statements may include, but are not limited to, statements about future financial and operating results, and other statements that are not historical facts. Such statements are based upon the beliefs and expectations of Clean Harbors’ management as of this date only and are subject to certain risks and uncertainties that could cause actual results to differ materially, including, without limitation, those items identified as “Risk Factors” in Clean Harbors’ most recently filed Form 10-K and Form 10-Q. Forward-looking statements are neither historical facts nor assurances of future performance. Therefore, readers are cautioned not to place undue reliance on these forward-looking statements. Clean Harbors undertakes no obligation to revise or publicly release the results of any revision to these forward-looking statements other than through its filings with the Securities and Exchange Commission, which may be viewed in the “Investors” section of Clean Harbors’ website at www.cleanharbors.com.

CLEAN HARBORS, INC. AND SUBSIDIARIES

UNAUDITED CONSOLIDATED STATEMENTS OF OPERATIONS

(in thousands, except per share amounts)


For the Three Months Ended


For the Nine Months Ended


September 30, 2022


September 30, 2021


September 30, 2022


September 30, 2021

Revenues

$

1,363,086


$

951,479


$

3,888,507


$

2,686,085


Cost of revenues: (exclusive of items shown separately below)


910,648


639,232


2,652,506


1,817,654


Selling, general and administrative expenses


151,711


133,164


458,492


378,911


Accretion of environmental liabilities


3,246


2,799


9,599


8,625


Depreciation and amortization


88,394


71,451


260,560


215,206


Income from operations


209,087


104,833


507,350


265,689


Other income (expense), net


104


199


2,073


(2,509

)

Gain on sale of business


8,864


Interest expense, net


(28,081

)


(17,984

)


(79,354

)


(53,953

)

Income before provision for income taxes


181,110


87,048


438,933


209,227


Provision for income taxes


45,311


21,605


109,663


54,973


Net income

$

135,799


$

65,443


$

329,270


$

154,254


Earnings per share:


Basic

$

2.51


$

1.20


$

6.07


$

2.83


Diluted

$

2.50


$

1.20


$

6.04


$

2.81


Shares used to compute earnings per share - Basic


54,111


54,411


54,278


54,553


Shares used to compute earnings per share - Diluted


54,381


54,707


54,542


54,862


CLEAN HARBORS, INC. AND SUBSIDIARIES

UNAUDITED CONDENSED CONSOLIDATED BALANCE SHEETS

(in thousands)


September 30, 2022


December 31, 2021

Current assets:


Cash and cash equivalents

$

449,023


$

452,575

Short-term marketable securities


65,034


81,724

Accounts receivable, net


1,026,226


792,734

Unbilled accounts receivable


134,742


94,963

Inventories and supplies


294,220


250,692

Prepaid expenses and other current assets


71,846


68,483

Total current assets


2,041,091


1,741,171

Property, plant and equipment, net


1,923,675


1,863,175

Other assets:


Operating lease right-of-use assets


161,668


161,797

Goodwill


1,246,327


1,227,042

Permits and other intangibles, net


621,834


644,912

Other


78,032


15,602

Total other assets


2,107,861


2,049,353

Total assets

$

6,072,627


$

5,653,699


Current liabilities:


Current portion of long-term debt

$

17,535


$

17,535

Accounts payable


416,913


359,866

Deferred revenue


93,425


83,749

Accrued expenses and other current liabilities


405,257


391,414

Current portion of closure, post-closure and remedial liabilities


36,904


25,136

Current portion of operating lease liabilities


47,879


47,614

Total current liabilities


1,017,913


925,314

Other liabilities:


Closure and post-closure liabilities, less current portion


89,399


87,088

Remedial liabilities, less current portion


97,737


98,752

Long-term debt, less current portion


2,507,946


2,517,024

Operating lease liabilities, less current portion


116,607


117,991

Deferred tax liabilities


326,842


314,853

Other long-term liabilities


78,602


78,790

Total other liabilities


3,217,133


3,214,498

Total stockholders’ equity, net


1,837,581


1,513,887

Total liabilities and stockholders’ equity

$

6,072,627


$

5,653,699

CLEAN HARBORS, INC. AND SUBSIDIARIES

UNAUDITED CONSOLIDATED STATEMENTS OF CASH FLOWS

(in thousands)


For the Nine Months Ended


September 30, 2022


September 30, 2021

Cash flows from operating activities:


Net income

$

329,270


$

154,254


Adjustments to reconcile net income to net cash from operating activities:


Depreciation and amortization


260,560


215,206


Allowance for doubtful accounts


6,684


7,186


Amortization of deferred financing costs and debt discount


4,734


2,718


Accretion of environmental liabilities


9,599


8,625


Changes in environmental liability estimates


2,105


341


Deferred income taxes


2,226


5,202


Other (income) expense, net


(2,073

)


2,509


Stock-based compensation


20,375


12,786


Gain on sale of business


(8,864

)


Environmental expenditures


(9,720

)


(12,223

)

Changes in assets and liabilities, net of acquisitions:


Accounts receivable and unbilled accounts receivable


(293,562

)


(113,601

)

Inventories and supplies


(44,324

)


(12,882

)

Other current and non-current assets


(12,600

)


(10,785

)

Accounts payable


52,979


86,974


Other current and long-term liabilities


40,153


21,916


Net cash from operating activities


357,542


368,226


Cash flows used in investing activities:


Additions to property, plant and equipment


(244,547

)


(146,654

)

Proceeds from sale and disposal of fixed assets


5,118


16,424


Acquisitions, net of cash acquired


(73,568

)


(22,819

)

Proceeds from sale of business, net of transaction costs


16,811


Additions to intangible assets including costs to obtain or renew permits


(1,094

)


(2,659

)

Proceeds from sale of available-for-sale securities


51,736


83,226


Purchases of available-for-sale securities


(36,418

)


(96,785

)

Net cash used in investing activities


(281,962

)


(169,267

)

Cash flows used in financing activities:


Change in uncashed checks


887


(4,323

)

Tax payments related to withholdings on vested restricted stock


(6,214

)


(7,383

)

Repurchases of common stock


(44,182

)


(48,409

)

Deferred financing costs paid


(410

)


(150

)

Payments on finance leases


(9,538

)


(5,845

)

Principal payments on debt


(13,152

)


(5,652

)

Net cash used in financing activities


(72,609

)


(71,762

)

Effect of exchange rate change on cash


(6,523

)


365


(Decrease) increase in cash and cash equivalents


(3,552

)


127,562


Cash and cash equivalents, beginning of period


452,575


519,101


Cash and cash equivalents, end of period

$

449,023


$

646,663


Supplemental information:

Cash payments for interest and income taxes:

Interest paid

$

86,407

$

61,807

Income taxes paid, net of refunds

53,183

48,202

Non-cash investing activities:


Property, plant and equipment accrued

23,726

11,561

Remedial liability assumed in acquisition of property, plant and equipment

8,092

ROU assets obtained in exchange for operating lease liabilities

39,899

18,528

ROU assets obtained in exchange for finance lease liabilities

11,263

18,704

Supplemental Segment Data (in thousands)


For the Three Months Ended

Revenue

September 30, 2022


September 30, 2021


Third-party revenues


Intersegment revenues, net


Direct revenues


Third-party revenues


Intersegment revenues, net


Direct revenues

Environmental Services

$

1,080,032


$

6,452


$

1,086,484


$

743,831


$

1,802


$

745,633

Safety-Kleen Sustainability Solutions


282,771


(6,452

)


276,319


207,589


(1,802

)


205,787

Corporate Items


283


283


59


59

Total

$

1,363,086


$


$

1,363,086


$

951,479


$


$

951,479


For the Nine Months Ended

Revenue

September 30, 2022


September 30, 2021


Third-party revenues


Intersegment revenues, net


Direct Revenues


Third-party revenues


Intersegment revenues, net


Direct revenues

Environmental Services

$

3,105,336


$

19,336


$

3,124,672


$

2,119,856


$

4,476


$

2,124,332

Safety-Kleen Sustainability Solutions


782,737


(19,336

)


763,401


566,012


(4,476

)


561,536

Corporate Items


434


434


217


217

Total

$

3,888,507


$


$

3,888,507


$

2,686,085


$


$

2,686,085


Contacts

Michael L. Battles
EVP and Chief Financial Officer
Clean Harbors, Inc.
781.792.5100
This email address is being protected from spambots. You need JavaScript enabled to view it.

Jim Buckley
SVP Investor Relations
Clean Harbors, Inc.
781.792.5100
This email address is being protected from spambots. You need JavaScript enabled to view it.


Read full story here

Manufacturing capacity grows from controlled production to high volume hydrogen electrolyzer manufacturing

NEWARK, Del.--(BUSINESS WIRE)--Bloom Energy Corporation (NYSE: BE), today, inaugurated its high volume commercial electrolyzer line at the company’s Newark facility, increasing the company’s generating capacity of electrolyzers to two gigawatts. The award-winning technology is the most energy-efficient design to produce clean hydrogen to date.


In the last decade, the facility has produced over 1 gigawatt (GW) of resilient, sustainable, and cost-effective fuel cell-based Energy Servers. The Bloom Electrolyzer relies on the same, commercially proven solid oxide technology platform used to produce electricity, so streamlining existing manufacturing for higher volume electrolyzer output allows Bloom to best meet the needs of the market.

The technology’s significant capabilities for hydrogen production are being demonstrated in partnerships with Xcel Energy and Idaho National Labs to harness nuclear and steam power, and will be demonstrated with LSB Industries, Inc. to decarbonize industrial and agricultural sectors. Internationally, the technology is in use in South Korea.

“Through the domestic production of technologies like Bloom Energy’s electrolyzer, we are making strides towards American energy independence, as well as a sustainable clean hydrogen market, which is critical for decarbonizing hard-to-abate industries like fertilizer, steel, cement, and aviation,” said Sharelynn Moore, Executive Vice President and Chief Business Development and Marketing Officer, Bloom Energy. “Our employees work every day to overcome one of humanity’s greatest challenges, and today’s inauguration celebrates their strength and ability to transform a successful manufacturing plant into a world class facility committed to a secure, net-zero energy future.”

The Bloom Electrolyzer supports a trajectory for hydrogen to become economically accessible by producing hydrogen up to 45 percent more efficiently than PEM and alkaline electrolyzers when combined with external heat. By operating at high temperatures, Bloom’s electrolyzer consumes 15 percent less electricity than other electrolyzer technologies when electricity is the sole input source. This allows for the Bloom Electrolyzer to be deployed across a broad variety of commercial hydrogen applications, using multiple energy sources, including intermittent renewable energy and excess heat at manufacturing facilities and businesses.

Electrolyzer production demonstrates the growing momentum for American clean energy manufacturing following the passage of the Inflation Reduction Act (IRA) earlier this year, which supports technologies and financial mechanisms that will make the United States’ transition to clean energy a reality.

In addition to its work on the east coast, Bloom Energy marked the expansion of its growing American manufacturing footprint this July, with the grand opening of its new state-of-the-art, 164,000 square foot, multi-gigawatt facility in Fremont, California. This facility represents a $200 million investment and is expected to create more than 400 additional clean energy jobs by year-end, bringing Bloom’s California headcount to nearly 2,000 in addition to its 715 Delaware employees.

Forward-Looking Statements

This press release contains certain forward-looking statements that are subject to the safe harbor provisions of the Private Securities Litigation Reform Act of 1995. Forward-looking statements generally relate to future events or our future financial or operating performance. In some cases, you can identify forward-looking statements because they contain words such as “anticipate,” “believe,” “could,” “estimate,” “expect,” “intend,” “may,” “should,” “will” and “would” or the negative of these words or similar terms or expressions that concern Bloom’s expectations, strategy, priorities, plans or intentions. These forward-looking statements include, but are not limited to, Bloom’s expectations regarding the efficiency of the Bloom Electrolyzer, the timing, quantity and type of applications for deployment of the Bloom Electrolyzer. More information on potential risks and uncertainties that may impact Bloom’s business are set forth in Bloom’s periodic reports filed with the SEC, including its Annual Report on Form 10-K for the year ended December 31, 2021, filed with the SEC on February 25, 2022, and its Quarterly Reports on Form 10-Q for the quarters ended March 31, 2022 and June 30, 2022, filed with the SEC on May 6, 2022 and August 9, 2022, respectively, as well as subsequent reports filed with or furnished to the SEC from time to time. Bloom assumes no obligation to, and does not currently intend to, update any such forward-looking statements.

About Bloom Energy

Bloom Energy empowers businesses and communities to responsibly take charge of their energy. The company’s leading solid oxide platform for distributed generation of electricity and hydrogen is changing the future of energy. Fortune 100 companies around the world turn to Bloom Energy as a trusted partner to deliver lower carbon energy today and a net-zero future. For more information, visit www.bloomenergy.com.


Contacts

Media Relations:
This email address is being protected from spambots. You need JavaScript enabled to view it.

EDEN PRAIRIE, Minn.--(BUSINESS WIRE)--$CHRW #CHRobinson--C.H. Robinson Worldwide, Inc. (“C.H. Robinson”) (Nasdaq: CHRW) today reported financial results for the quarter ended September 30, 2022.


Third Quarter Key Metrics:

  • Gross profits increased 5.0% to $880.7 million and adjusted gross profits(1) increased 5.1% to $887.2 million
  • Income from operations decreased 7.5% to $287.6 million
  • Adjusted operating margin(1) decreased 440 basis points to 32.4%
  • Diluted earnings per share (EPS) decreased 3.8% to $1.78
  • Cash generated by operations improved by $699.0 million to $625.5 million

(1) Adjusted gross profits and adjusted operating margin are non-GAAP financial measures. The same factors described in this release that impacted these non-GAAP measures also impacted the comparable GAAP measures. Refer to page 11 for further discussion and a GAAP to Non-GAAP reconciliation.

"On our second quarter earnings call in late July, I talked about a deceleration in demand that we expected to see in the second half of 2022 in three large verticals for freight, including weakness in the retail market and further slowing in the housing market. We’re now seeing those expectations play out, with slowing freight demand and price declines in the freight forwarding and surface transportation markets," said Bob Biesterfeld, President and Chief Executive Officer of C.H. Robinson. "Throughout the changes in the freight cycle, we have maintained our focus on continuing to improve the customer and carrier experience and scaling our digital processes and operating model to foster sustainable, profitable growth."

"Today, we believe that we are entering a time of slower economic growth where freight markets will continue to cool from their peaks and will operate more reliably and at more normalized rates, with fewer disruptions. These changes in market conditions, coupled with many successful endeavors on our digital roadmap directed at scaling our model to be more efficient, are allowing us to take actions to structurally reduce our overall cost structure," stated Biesterfeld.

"Compared to our third quarter operating expenses, the actions we’re currently taking are expected to generate $175 million of gross cost savings on an annualized basis by the fourth quarter of 2023. Inflation, other headwinds such as annual pay increases and tailwinds such as lower incentive compensation are expected to result in net cost headwinds of $25 million in 2023 that we expect will partially offset the gross savings, resulting in net annualized cost reductions of $150 million by the fourth quarter of next year."

Biesterfeld added, "We also continue to identify opportunities to accelerate our enterprise-wide digital and product strategy. To drive greater impact and speed of execution, Arun Rajan has been promoted to the role of Chief Operating Officer. Since joining C.H. Robinson in 2021, Arun has been a critical contributor to, and strategic leader of, our digital and product strategy. Arun is helping us think and act differently as we accelerate our pace of digital transformation and scale our operating model. In his new role, in addition to leading the product organization, Arun will have expanded direct responsibility for the technology and marketing organizations. Bringing these three critical functions together under a single vision and leadership structure will allow us to integrate these functions more deeply into single-threaded teams and put the needs of our customers and carriers at the center of our organizational design and ensure that we are positioned well to meet their needs while accelerating the impacts across the business units of C.H. Robinson. Arun's teams will work directly with the business unit presidents to operationalize these efforts."

Summary of Third Quarter Results Compared to the Third Quarter of 2021

  • Total revenues decreased 4.0% to $6.0 billion, driven primarily by lower ocean and air pricing, partially offset by higher pricing in less-than-truckload ("LTL") and truckload.
  • Gross profits increased 5.0% to $880.7 million. Adjusted gross profits increased 5.1% to $887.2 million, primarily driven by higher adjusted gross profit per transaction in truckload, partially offset by the lower adjusted gross profit per transaction in ocean.
  • Operating expenses increased 12.4% to $599.6 million. Personnel expenses increased 9.4% to $437.5 million, primarily due to higher average employee headcount, which increased 13.0%. Selling, general and administrative ("SG&A") expenses of $162.0 million increased 21.3%, primarily due to increased legal settlements, higher purchased and contracted services and increased travel expenses.
  • Income from operations totaled $287.6 million, down 7.5% due to the increase in operating expenses, partially offset by the increase in adjusted gross profits. Adjusted operating margin of 32.4% declined 440 basis points.
  • Interest and other income/expense, net totaled $16.0 million of expense, consisting primarily of $20.8 million of interest expense, which increased $7.7 million versus last year due primarily to a higher average debt balance, partially offset by a $5.2 million favorable impact from foreign currency revaluation and realized foreign currency gains and losses.
  • The effective tax rate in the quarter was 16.9% compared to 16.0% in the third quarter last year.
  • Net income totaled $225.8 million, down 8.6% from a year ago. Diluted EPS of $1.78 decreased 3.8%.

Summary of Year-to-Date Results Compared to 2021

  • Total revenues increased 18.2% to $19.6 billion, driven primarily by higher pricing across most of our services.
  • Gross profits increased 23.0% to $2.8 billion. Adjusted gross profits increased 23.1% to $2.8 billion, primarily driven by higher adjusted gross profit per transaction across most of our services.
  • Operating expenses increased 14.7% to $1.7 billion. Personnel expenses increased 15.3% to $1.3 billion, primarily due to higher average employee headcount, which increased 14.0%, and higher incentive compensation costs. SG&A expenses increased 13.0% to $426.6 million, primarily due to increases in purchased and contracted services, legal settlements, travel expenses, and warehouse expenses, partially offset by a $25.3 million gain on the sale-leaseback of our Kansas City regional center.
  • Income from operations totaled $1.1 billion, up 38.8% from last year, primarily due to the increase in adjusted gross profits, partially offset by the increase in operating expenses. Adjusted operating margin of 39.0% increased 440 basis points.
  • Interest and other income/expense, net totaled $57.5 million of expense, which primarily consisted of $52.3 million of interest expense, which increased $14.3 million versus last year due to a higher average debt balance. The year-to-date results also included a $6.6 million unfavorable impact from foreign currency revaluation and realized foreign currency gains and losses.
  • The effective tax rate for the nine months was 19.2% compared to 18.5% in the year-ago period.
  • Net income totaled $844.3 million, up 37.5% from a year ago. Diluted EPS of $6.50 increased 42.5%.

North American Surface Transportation ("NAST") Results

Summarized financial results of our NAST segment are as follows (dollars in thousands):


Three Months Ended September 30,


Nine Months Ended September 30,


2022


2021


% change


2022


2021


% change

Total revenues

$

4,002,461


$

3,814,988


4.9

%


$

12,264,396


$

10,611,892


15.6

%

Adjusted gross profits(1)


563,787


460,149


22.5

%


1,694,438


1,317,853


28.6

%

Income from operations


211,899


149,035


42.2

%


670,752


436,911


53.5

%

____________________________________________

(1) Adjusted gross profits is a non-GAAP financial measure explained later in this release. The difference between adjusted gross profits and gross profits is not material.

Third quarter total revenues for the NAST segment totaled $4.0 billion, an increase of 4.9% over the prior year, primarily driven by higher LTL and truckload pricing. NAST adjusted gross profits increased 22.5% in the quarter to $563.8 million. Adjusted gross profits in truckload increased 20.8% due to a 20.5% increase in adjusted gross profit per shipment and a 0.5% increase in truckload volume. Our average truckload linehaul rate per mile charged to our customers, which excludes fuel surcharges, decreased approximately 13.0% in the quarter compared to the prior year, while truckload linehaul cost per mile, excluding fuel surcharges, decreased approximately 17.0%, resulting in a 15.5% increase in truckload adjusted gross profit per mile. LTL adjusted gross profits increased 22.7% versus the year-ago period, as adjusted gross profit per order increased 24.5% and LTL volumes declined 1.5%. Operating expenses increased 13.1% primarily due to increased employee headcount, legal settlements, and technology expenses. Income from operations increased 42.2% to $211.9 million, and adjusted operating margin expanded 520 basis points to 37.6%. NAST average employee headcount was up 10.8% in the quarter.

Global Forwarding Results

Summarized financial results of our Global Forwarding segment are as follows (dollars in thousands):


Three Months Ended September 30,


Nine Months Ended September 30,


2022


2021


% change


2022


2021


% change

Total revenues

$

1,511,115


$

1,978,901


(23.6

)%


$

5,798,702


$

4,585,734


26.5

%

Adjusted gross profits(1)


248,433


310,898


(20.1

)%


894,724


763,952


17.1

%

Income from operations


85,953


165,155


(48.0

)%


421,148


363,956


15.7

%

____________________________________________

(1) Adjusted gross profits is a non-GAAP financial measure explained later in this release. The difference between adjusted gross profits and gross profits is not material.

Third quarter total revenues for the Global Forwarding segment decreased 23.6% to $1.5 billion, driven by lower pricing and volumes in our ocean and air services, reflecting softening market demand. Adjusted gross profits decreased 20.1% in the quarter to $248.4 million. Ocean adjusted gross profits decreased 25.6%, driven by a 24.0% decrease in adjusted gross profit per shipment and a 2.5% decline in shipments. Adjusted gross profits in air decreased 21.1%, driven by a 16.5% decrease in metric tons shipped and a 5.5% decrease in adjusted gross profit per metric ton shipped. Customs adjusted gross profits increased 9.5%, driven by a 5.5% increase in adjusted gross profit per transaction and a 4.0% increase in transaction volume. Operating expenses increased 11.5%, primarily driven by increased salaries and technology expenses. Third quarter average employee headcount increased 13.4%. Income from operations decreased 48.0% to $86.0 million, and adjusted operating margin declined 1,850 basis points to 34.6% in the quarter.

All Other and Corporate Results

Total revenues and adjusted gross profits for Robinson Fresh, Managed Services and Other Surface Transportation are summarized as follows (dollars in thousands):


Three Months Ended September 30,


Nine Months Ended September 30,


2022


2021


% change


2022


2021


% change

Total revenues

$

501,800


$

469,806


6.8

%


$

1,566,706


$

1,402,664


11.7

%

Adjusted gross profits(1):


Robinson Fresh

$

27,677


$

26,651


3.8

%


$

93,163


$

81,539


14.3

%

Managed Services


29,595


26,720


10.8

%


85,295


78,510


8.6

%

Other Surface Transportation


17,702


19,774


(10.5

)%


57,383


53,894


6.5

%

____________________________________________

(1) Adjusted gross profits is a non-GAAP financial measure explained later in this release. The difference between adjusted gross profits and gross profits is not material.

Third quarter Robinson Fresh adjusted gross profits increased 3.8% to $27.7 million, driven by an increase in adjusted gross profit per case, which is primarily related to integrated supply chain and technology services. Managed Services adjusted gross profits increased 10.8% in the quarter, due to growth in adjusted gross profit per transaction. Other Surface Transportation adjusted gross profits decreased 10.5% to $17.7 million, primarily due to a 7.3% decrease in Europe truckload adjusted gross profits.

Other Income Statement Items

The third quarter effective tax rate was 16.9%, up from 16.0% last year. We expect our 2022 full-year effective tax rate to be near the low end of our previous guidance of 19% to 21%.

Interest and other income/expense, net totaled $16.0 million of expense, consisting primarily of $20.8 million of interest expense, which increased $7.7 million versus the third quarter of 2021 due to a higher average debt balance, partially offset by a $5.2 million favorable impact from foreign currency revaluation and realized foreign currency gains and losses.

Diluted weighted average shares outstanding in the quarter were down 4.7% due primarily to share repurchases over the past twelve months.

Cash Flow Generation and Capital Distribution

Cash generated from operations totaled $625.5 million in the third quarter, compared to $73.5 million cash used by operations in the third quarter of 2021. The $699.0 million improvement was primarily due to a $359.3 million sequential decrease in net operating working capital in the third quarter of 2022, compared to a $411.8 million sequential increase in the third quarter of 2021. The decrease in net operating working capital in the third quarter of 2022 resulted primarily from a $655.2 million sequential decrease in accounts receivable and contract assets, compared to a $295.9 million sequential decrease in total accounts payable and accrued transportation expense.

In the third quarter of 2022, cash returned to shareholders increased 156% versus last year to $606.7 million, with $535.7 million in repurchases of common stock and $71.0 million in cash dividends.

Capital expenditures totaled $31.3 million in the quarter. Capital expenditures for 2022 are expected to be at the high end of our previous guidance of $110 million to $120 million.

Outlook

"As inflationary pressures weigh on consumer discretionary spending and global economic growth, we continue to believe that our global suite of services, our growing digital platform, our responsive team of logistics experts, and our broad exposure to different industry verticals and geographies, supported by our resilient and flexible non-asset-based business model put us in a position to continue delivering strong financial results," Biesterfeld stated. "But we also need to continue evolving our organization to bring focus to our highest strategic priorities, including keeping the needs of our customers and carriers at the center of what we do and lowering our overall cost structure by driving scale. The work that our team is executing on related to scaling our digital processes and operating model, while working backwards from the needs of our customers and carriers, is focused on driving improvements in our customer and carrier experience, and in turn, driving market share gains and growth. We're also focused on improving productivity, which in turn reduces our long-term operating costs and increases profits, leading to continued strong returns to shareholders."

About C.H. Robinson

C.H. Robinson solves logistics problems for companies across the globe and across industries, from the simple to the most complex. With $28 billion in freight under management and 20 million shipments annually, we are one of the world’s largest logistics platforms. Our global suite of services accelerates trade to seamlessly deliver the products and goods that drive the world’s economy. With the combination of our multimodal transportation management system and expertise, we use our information advantage to deliver smarter solutions for our 100,000 customers and 85,000 contract carriers. Our technology is built by and for supply chain experts to bring faster, more meaningful improvements to our customers’ businesses. As a responsible global citizen, we are also proud to contribute millions of dollars to support causes that matter to our company, our Foundation and our employees. For more information, visit us at www.chrobinson.com (Nasdaq: CHRW).

Except for the historical information contained herein, the matters set forth in this release are forward-looking statements that represent our expectations, beliefs, intentions or strategies concerning future events. These forward-looking statements are subject to certain risks and uncertainties that could cause actual results to differ materially from our historical experience or our present expectations, including, but not limited to, such factors as changes in economic conditions, including uncertain consumer demand; changes in market demand and pressures on the pricing for our services; fuel price increases or decreases, or fuel shortages; competition and growth rates within the global logistics industry; freight levels and increasing costs and availability of truck capacity or alternative means of transporting freight; risks associated with significant disruptions in the transportation industry; changes in relationships with existing contracted truck, rail, ocean, and air carriers; changes in our customer base due to possible consolidation among our customers; risks with reliance on technology to operate our business; cyber-security related risks; risks associated with operations outside of the United States; our ability to identify or complete suitable acquisitions; our ability to successfully integrate the operations of acquired companies with our historic operations; risks associated with litigation, including contingent auto liability and insurance coverage; risks associated with the potential impact of changes in government regulations; our ability to hire and retain a sufficient number of qualified personnel; risks associated with the changes to income tax regulations; risks associated with the produce industry, including food safety and contamination issues; the impact of war on the economy; changes to our capital structure; changes due to catastrophic events including pandemics such as COVID-19; and other risks and uncertainties detailed in our Annual and Quarterly Reports.

Any forward-looking statement speaks only as of the date on which such statement is made, and we undertake no obligation to update such statement to reflect events or circumstances arising after such date. All remarks made during our financial results conference call will be current at the time of the call, and we undertake no obligation to update the replay.

Conference Call Information:

C.H. Robinson Worldwide Third Quarter 2022 Earnings Conference Call
Wednesday, November 2, 2022; 8:30 a.m. Eastern Time
Presentation slides and a simultaneous live audio webcast of the conference call may be accessed through the Investor Relations link on C.H. Robinson’s website at www.chrobinson.com.
To participate in the conference call by telephone, please call ten minutes early by dialing: 877-269-7756
International callers dial +1-201-689-7817

Adjusted Gross Profit by Service Line

(in thousands)


This table of summary results presents our service line adjusted gross profits on an enterprise basis. The service line adjusted gross profits in the table differ from the service line adjusted gross profits discussed within the segments as our segments have revenues from multiple service lines.


Three Months Ended September 30,


Nine Months Ended September 30,


2022


2021


% change


2022


2021


% change

Adjusted gross profits(1):


Transportation


Truckload

$

398,418


$

333,067


19.6

%


$

1,214,465


$

941,117


29.0

%

LTL


162,130


132,482


22.4

%


482,740


383,903


25.7

%

Ocean


160,122


214,926


(25.5

)%


609,543


501,422


21.6

%

Air


47,831


60,552


(21.0

)%


166,136


159,503


4.2

%

Customs


27,881


25,466


9.5

%


83,196


75,201


10.6

%

Other logistics services


65,441


53,018


23.4

%


182,638


158,450


15.3

%

Total transportation


861,823


819,511


5.2

%


2,738,718


2,219,596


23.4

%

Sourcing


25,371


24,681


2.8

%


86,285


76,152


13.3

%

Total adjusted gross profits

$

887,194


$

844,192


5.1

%


$

2,825,003


$

2,295,748


23.1

%

____________________________________________

(1) Adjusted gross profits is a non-GAAP financial measure explained later in this release. The difference between adjusted gross profits and gross profits is not material.

GAAP to Non-GAAP Reconciliation

(unaudited, in thousands)


Our adjusted gross profit is a non-GAAP financial measure. Adjusted gross profit is calculated as gross profit excluding amortization of internally developed software utilized to directly serve our customers and contracted carriers. We believe adjusted gross profit is a useful measure of our ability to source, add value, and sell services and products that are provided by third parties, and we consider adjusted gross profit to be a primary performance measurement. Accordingly, the discussion of our results of operations often focuses on the changes in our adjusted gross profit. The reconciliation of gross profit to adjusted gross profit is presented below (in thousands):


Three Months Ended September 30,


Nine Months Ended September 30,


2022


2021


% change


2022


2021


% change

Revenues:


Transportation

$

5,724,364


$

5,999,901


(4.6

)%


$

18,718,357


$

15,800,576


18.5

%

Sourcing


291,012


263,794


10.3

%


911,447


799,714


14.0

%

Total revenues


6,015,376


6,263,695


(4.0

)%


19,629,804


16,600,290


18.2

%

Costs and expenses:


Purchased transportation and related services


4,862,541


5,180,390


(6.1

)%


15,979,639


13,580,980


17.7

%

Purchased products sourced for resale


265,641


239,113


11.1

%


825,162


723,562


14.0

%

Direct internally developed software amortization


6,457


5,152


25.3

%


18,831


14,601


29.0

%

Total direct expenses


5,134,639


5,424,655


(5.3

)%


16,823,632


14,319,143


17.5

%

Gross profit

$

880,737


$

839,040


5.0

%


$

2,806,172


$

2,281,147


23.0

%

Plus: Direct internally developed software amortization


6,457


5,152


25.3

%


18,831


14,601


29.0

%

Adjusted gross profit

$

887,194


$

844,192


5.1

%


$

2,825,003


$

2,295,748


23.1

%

Our adjusted operating margin is a non-GAAP financial measure calculated as operating income divided by adjusted gross profit. We believe adjusted operating margin is a useful measure of our profitability in comparison to our adjusted gross profit which we consider a primary performance metric as discussed above. The comparison of operating margin to adjusted operating margin is presented below:


Three Months Ended September 30,


Nine Months Ended September 30,


2022


2021


% change


2022


2021


% change


Total revenues

$

6,015,376


$

6,263,695


(4.0

)%


$

19,629,804


$

16,600,290


18.2

%

Income from operations


287,609


310,769


(7.5

)%


1,102,748


794,702


38.8

%

Operating margin


4.8

%


5.0

%


(20) bps


5.6

%


4.8

%


80 bps


Adjusted gross profit

$

887,194


$

844,192


5.1

%


$

2,825,003


$

2,295,748


23.1

%

Income from operations


287,609


310,769


(7.5

)%


1,102,748


794,702


38.8

%

Adjusted operating margin


32.4

%


36.8

%


(440) bps


39.0

%


34.6

%


440 bps

Condensed Consolidated Statements of Income

(unaudited, in thousands, except per share data)


Three Months Ended September 30,


Nine Months Ended September 30,


2022


2021


% change


2022


2021


% change


Revenues:


Transportation

$

5,724,364


$

5,999,901


(4.6

)%


$

18,718,357


$

15,800,576


18.5

%

Sourcing


291,012


263,794


10.3

%


911,447


799,714


14.0

%

Total revenues


6,015,376


6,263,695


(4.0

)%


19,629,804


16,600,290


18.2

%

Costs and expenses:


Purchased transportation and related services


4,862,541


5,180,390


(6.1

)%


15,979,639


13,580,980


17.7

%

Purchased products sourced for resale


265,641


239,113


11.1

%


825,162


723,562


14.0

%

Personnel expenses


437,545


399,880


9.4

%


1,295,670


1,123,616


15.3

%

Other selling, general, and administrative expenses


162,040


133,543


21.3

%


426,585


377,430


13.0

%

Total costs and expenses


5,727,767


5,952,926


(3.8

)%


18,527,056


15,805,588


17.2

%

Income from operations


287,609


310,769


(7.5

)%


1,102,748


794,702


38.8

%

Interest and other income/expense, net


(15,972

)


(16,662

)


(4.1

)%


(57,541

)


(41,419

)


38.9

%

Income before provision for income taxes


271,637


294,107


(7.6

)%


1,045,207


753,283


38.8

%

Provision for income taxes


45,839


47,054


(2.6

)%


200,876


139,136


44.4

%

Net income

$

225,798


$

247,053


(8.6

)%


$

844,331


$

614,147


37.5

%


Net income per share (basic)

$

1.81


$

1.87


(3.2

)%


$

6.60


$

4.61


43.2

%

Net income per share (diluted)

$

1.78


$

1.85


(3.8

)%


$

6.50


$

4.56


42.5

%


Weighted average shares outstanding (basic)


124,980


131,845


(5.2

)%


127,944


133,201


(3.9

)%

Weighted average shares outstanding (diluted)


127,190


133,436


(4.7

)%


129,839


134,661


(3.6

)%


Contacts

Chuck Ives, Director of Investor Relations
Email: This email address is being protected from spambots. You need JavaScript enabled to view it.


Read full story here

DENVER--(BUSINESS WIRE)--Advanced Energy Industries, Inc. (Nasdaq: AEIS), a global leader in highly engineered, precision power conversion, measurement, and control solutions, today announced that it will participate at the following investor conferences.

Baird 2022 Global Industrial Conference in Chicago
Date: Thursday, November 10, 2022
Presentation time: 10:15 AM to 10:45 AM Central Time (11:15 AM to 11:45 AM Eastern)

6th Annual Wells Fargo TMT Summit in Las Vegas
Date: Tuesday, November 29, 2022
Fireside chat time: 1:10 PM to 1:40 PM Pacific Time (4:10 PM to 4:40 PM Eastern)

Raymond James Technology Investors Conference in New York City
Date: Tuesday, December 6, 2022
Fireside chat time: 9:10 AM to 9:40 AM Eastern Time

11th Annual NYC Summit in New York City
Date: Tuesday, December 13, 2022

To participate in these conferences, please contact a representative of those firms.

About Advanced Energy

Advanced Energy Industries, Inc. (Nasdaq: AEIS) is a global leader in the design and manufacture of highly engineered, precision power conversion, measurement and control solutions for mission-critical applications and processes. Advanced Energy’s power solutions enable customer innovation in complex applications for a wide range of industries including semiconductor equipment, industrial production, medical and life sciences, data center computing, networking and telecommunications. With engineering know-how and responsive service and support for customers around the globe, the company builds collaborative partnerships to meet technology advances, propels growth of its customers and innovates the future of power. Advanced Energy has devoted four decades to perfecting power. It is headquartered in Denver, Colorado, USA. For more information, visit www.advancedenergy.com.

Advanced Energy | Precision. Power. Performance. Trust.


Contacts

Edwin Mok
Advanced Energy Industries, Inc.
970-407-6555
This email address is being protected from spambots. You need JavaScript enabled to view it.

DUBLIN--(BUSINESS WIRE)--The "LNG Systems Industry Forecasts - China Focus" report has been added to ResearchAndMarkets.com's offering.


This new study focuses on industry trends and forecasts with historical data (2011, 2016 and 2021) and long-term forecasts through 2026 and 2031 are presented.

This study focuses on China's LNG Systems industry forecasts. In the two past decades, the industry has been growing at a fast pace. The dramatic expansions of the manufacturing capabilities and rising consumer consumptions in China have transformed China's society and economy. China is one of the world's major producers for industrial and consumer products.

Far outpacing other economies in the world, China is the world's fastest growing market for the consumptions of goods and services. The Chinese economy maintains a high speed growth which has been stimulated by the consecutive increases of industrial output, imports & exports, consumer consumption and capital investment for over two decades.

Rapid consolidation between medium and large players is anticipated since the Chinese government has been encouraging industry consolidation with an effort to regulate the industry and to improve competitiveness in the world market.

Although China has enjoyed the benefits of an expanding market for production and distribution, the industry is suffering from minimal innovation and investment in R&D and new product development. The sector's economies of scale have yet to be achieved. Most domestic manufacturers lack the autonomic intellectual property and financial resources to develop their own brand name products.

Key Topics Covered:

I. INTRODUCTION

  • Report Scope and Methodology
  • Executive Summary

II. BUSINESS ENVIRONMENT

  • Economic Outlook
  • Key Economic Indicators
  • Industrial Output
  • Population and Labor
  • Foreign Investment
  • Foreign Trade
  • Financial and Tax Regulations
  • Banking System and Regulations
  • Foreign Exchange
  • Taxes, Tariff and Custom Duties
  • Market Trends
  • Technology Development
  • Market Development
  • Major Industry Development
  • Regional Development
  • Enterprise Development
  • Labor Market Development

III. LNG SYSTEMS SALES VOLUMES AND FORECASTS

  • Overview
  • LNG Systems Sales Volumes and Forecasts (in Yuan)
  • Feed Gas Pretreatment System
  • Low Temperature Liquefied System
  • Coolant System
  • Storage and Transportation System
  • Exhaust and By-Product Recovery System
  • The Electric Control System
  • Utility System
  • LNG Systems Imports and Exports
  • Pricing Trends

LIST OF TABLES

I. INTRODUCTION

  • Economic Outlook Summary
  • LNG Systems Supply and Demand Summary

II. BUSINESS ENVIRONMENT

  • Key Economic Indicators
  • Industrial Output
  • Population and Labor Force Trends
  • Foreign Investment and Loans
  • Foreign Trade

III. LNG SYSTEMS SALES VOLUMES AND FORECASTS

  • Overview
  • LNG Systems Sales Volumes and Forecasts (in Yuan)
  • Feed Gas Pretreatment System
  • Low Temperature Liquefied System
  • Coolant System
  • Storage and Transportation System
  • Exhaust and By-Product Recovery System
  • The Electric Control System
  • Utility System
  • LNG Systems Imports and Exports

For more information about this report visit https://www.researchandmarkets.com/r/u4xus4


Contacts

ResearchAndMarkets.com
Laura Wood, Senior Press Manager
This email address is being protected from spambots. You need JavaScript enabled to view it.
For E.S.T Office Hours Call 1-917-300-0470
For U.S./ CAN Toll Free Call 1-800-526-8630
For GMT Office Hours Call +353-1-416-8900

Recent strategic transactions high-grade asset portfolio and enhance capital structure with the acquisitions of Sendero Midstream and CPJV in the Delaware Basin, the divestitures of non-core Barnett and Marcellus assets, and the repurchase of 4.6 million Crestwood common units from Chord Energy

Generated third quarter 2022 net loss of $43 million and Adjusted EBITDA1 of $209 million, a 50% increase year-over-year, driven by expanded operating footprints in the Williston and Delaware Basins

Solid cash flow profile highlighted by a quarterly coverage ratio of 1.9x; free cash flow generation from optimized portfolio coupled with EBITDA growth next year drives leverage ratio toward long-term target of approximately 3.5x

Revised 2022E Adjusted EBITDA guidance range of $780 million to $800 million reflects financial results year-to-date, the impact of the Marcellus divestiture, and shifts in timing for Williston Basin completion activity

MSCI upgraded Crestwood’s ESG corporate rating to ‘A’ from ‘BBB’ based on Crestwood's enhancements and commitment to corporate governance, business ethics, and environmental stewardship, the company's third upgrade since 2018

HOUSTON--(BUSINESS WIRE)--Crestwood Equity Partners LP (NYSE: CEQP) (“Crestwood”) reported today its financial and operating results for the three months ended September 30, 2022.

Third Quarter 2022 Financial Highlights1

  • Third quarter 2022 net loss of $43.0 million, compared to a net loss of $39.6 million in third quarter 2021
  • Third quarter 2022 Adjusted EBITDA of $209.3 million, compared to $139.9 million in the third quarter 2021, an increase of 50% year-over-year
  • Third quarter 2022 distributable cash flow (“DCF”) to common unitholders of $131.0 million, compared to $85.8 million in the third quarter of 2021, an increase of 53% year-over-year, resulting in a coverage ratio of 1.9x
  • Ended the quarter with approximately $3.6 billion of total debt, including $1.3 billion drawn on the revolving credit facilities, resulting in a consolidated leverage ratio of 4.2x (4.1x pro forma for the sale of the Marcellus Shale divestiture which closed on October 25, 2022)
  • Announced third quarter 2022 cash distribution of $0.655 per common unit, or $2.62 per common unit on an annualized basis, an approximate 5% increase year-over-year, payable on November 14, 2022, to unitholders of record as of November 7, 2022

1 Please see non-GAAP reconciliation tables included at the end of the press release.

Recent Developments

  • On September 15, 2022, Chord Energy Inc. (“Chord”) (Nasdaq: CHRD) sold 16 million Crestwood common units, or approximately 76% of the units received as consideration for its sale of Oasis Midstream, in an oversubscribed secondary offering. As part of this offering, Crestwood purchased and retired 4.6 million units for $123.7 million, resulting in annual distribution savings of approximately $12 million. Chord’s current ownership in Crestwood is now below 5% of total common units outstanding.
  • On October 14, 2022, Crestwood exercised the accordion feature on its revolving credit facility to increase the facility size from $1.5 billion to $1.75 billion, under its existing terms. Pro forma for the accordion and the divesture of the Marcellus assets, Crestwood has substantially enhanced its financial flexibility and liquidity with available capacity on its revolving credit facilities of more than $865 million.
  • On October 25, 2022, Crestwood closed the previously announced divestiture of its Marcellus gathering and compression assets to Antero Midstream Corporation for approximately $205 million in cash. Crestwood used the proceeds to paydown borrowings on its revolving credit facility.

Management Commentary

“During the third quarter, Crestwood continued to execute on its strategy of maximizing unitholder value through portfolio optimization and the reinvestment of cash flow and divestiture proceeds into the balance sheet, common unit repurchases, and high returning investment opportunities,” commented Robert G. Phillips, Founder, Chairman, and Chief Executive Officer of Crestwood. “Over the last 18 months, Crestwood completed several significant transactions that increased Adjusted EBITDA by over 30% and enhanced the company’s competitive position in our three core growth basins. Today, Crestwood’s portfolio is firmly concentrated in regions where we have competitive scale and is underpinned by high-quality, committed producer customers, as evidenced by 16 rigs actively drilling on our dedicated acreage. Crestwood continues to focus on its optimization strategy as we integrate the Oasis Midstream, Sendero Midstream, and CPJV acquisitions, invest in high-returning organic projects, and utilize growing free cash flow to achieve our long-term leverage target and further enhance returns to unitholders going forward.”

Mr. Phillips continued, “Producer activity in the Delaware Basin continues to exceed expectations and the anchor producer in the Powder River Basin is beginning to ramp drilling and completion activity on our acreage. In the Williston Basin, we continue to see solid rig activity across our systems and recent M&A transactions from key producers that further strengthen our customer base and highlight the quality of our dedicated acreage. As our customers integrate those recently acquired assets, and work to catch up from second quarter weather disruptions, near-term challenges in the oilfield services labor market, and supply chain constraints, we have seen delays in well completions which have led to the DUC count on the Arrow system to increase to approximately 20 wells. As a result, we have solid visibility to the fourth quarter and 2023 activity levels, but we are revising our full-year 2022E Adjusted EBITDA guidance range to $780 million to $800 million. As Crestwood and our customers continue to work through these short-term challenges, we remain increasingly confident in the strength of our portfolio and the ability for our asset base to generate meaningful, and growing, free cash flow in 2023 and beyond.”

Third Quarter 2022 Segment Results

Gathering and Processing North (G&P North) segment EBITDA totaled $157.2 million in the third quarter 2022, compared to $106.4 million in the third quarter 2021, an increase of 48% year-over-year. Segment EBITDA increased primarily as a result of higher natural gas gathering and processing and water gathering volumes, driven by the contribution from the Oasis Midstream assets in the Williston Basin, and the continued favorable impact of higher commodity prices on the Arrow system. In the Williston Basin, third quarter volumes were impacted by lower than expected well connects as producers shifted schedules and well connects were pushed into the fourth quarter 2022 and 2023. During the quarter, producer customers ran an average of six rigs in the Williston Basin and two rigs in the Powder River Basin.

Gathering & Processing South (G&P South) segment EBITDA totaled $53.3 million in the third quarter 2022, compared to $25.1 million in the third quarter 2021, an increase of 112% year-over-year. The third quarter of 2022 excludes gains and losses on long-lived assets related to the Barnett and Marcellus divestitures and a gain on the acquisition of CPJV. Segment EBITDA increased primarily as a result of higher natural gas gathering and processing volumes driven largely by contributions from the Sendero Midstream Partners LP ("Sendero Midstream") and Crestwood Permian Basin Holdings LLC (“CPJV”) acquisitions, both of which closed on July 11, 2022, offset by the divestiture of the Barnett assets on July 1, 2022. During the quarter, producers operated an average of nine rigs across Crestwood’s systems in New Mexico and Texas.

Storage & Logistics (S&L) segment EBITDA totaled $11.5 million in the third quarter 2022, compared to $15.7 million in the third quarter 2021. Both periods exclude the non-cash change in fair value of commodity inventory-related derivative contracts. Third quarter segment EBITDA was adversely impacted by realized losses on commodity price hedges entered into to partially mitigate commodity price exposure from Crestwood’s gathering and processing segments’ contracts that have percent of proceeds (POP) structures. During the third quarter, the NGL Logistics business benefited from strong demand for NGL products and recently completed a successful inventory build season, positioning the business to perform well in the upcoming winter season.

Combined O&M and G&A expenses, net of non-cash unit-based compensation, in the third quarter 2022 were $79.3 million compared to $44.6 million in the third quarter 2021. Third quarter 2022 expenses increased due to expanded operations as a result of the acquisitions of Oasis Midstream and Sendero Midstream and transaction costs related to the Sendero and CPJV acquisitions and the Barnett and Marcellus divestitures. Crestwood remains on-track to realize at least $25 million of run-rate O&M and G&A synergies related to the Oasis Midstream merger in 2022.

Third Quarter 2022 Business Update and Outlook

Williston Basin

During the third quarter 2022, the Williston Basin averaged crude oil gathering volumes of 78 MBbls/d, natural gas gathering volumes of 256 MMcf/d, natural gas processing volumes of 293 MMcf/d, and produced water gathering volumes of 173 MBbls/d. Natural gas gathering, natural gas processing, and produced water gathering volumes increased 84%, 124%, and 92%, respectively, year-over-year due to expanded operations as a result of the Oasis Midstream acquisition. During the quarter, producers connected 44 wells across Crestwood's footprint. Producer activity levels remain strong with four rigs currently drilling on Crestwood dedicated acreage, and as a result, the company anticipates between 40 and 45 incremental wells to be connected in the fourth quarter, bringing the full-year total to between 105 and 110 wells.

During the third quarter 2022, Crestwood invested $31 million in growth capital in the Williston Basin, approximately half of which is related to the continued build-out of multi-product infrastructure across the western footprint of the Rough Rider system acquired from Oasis Midstream for Chord and other recently contracted third-party producers.

Delaware Basin

During the third quarter 2022, the Delaware Basin averaged natural gas gathering volumes of 508 MMcf/d and natural gas processing volumes of 419 MMcf/d, year-over-year increases of 95% and 301%, respectively. Following the acquisition of Sendero Midstream, increased producer activity and strong well results drove gathering and processing volumes above management expectations. As part of the integration plans, Crestwood has completed a connection from the Willow Lake assets to Sendero Midstream, enabling Crestwood to immediately utilize the combined gathering and processing capacity to efficiently handle its producer customers’ active development programs and provide flow assurance. Produced water gathering volumes averaged 126 MBbls/d during the third quarter 2022, an increase of 197% year-over-year due to the integration of Oasis Midstream’s Panther assets. On the Panther crude oil gathering system, volumes averaged 21 MBbls/d during the quarter. During the third quarter, 43 wells were connected across the Delaware Basin systems. Crestwood’s diverse set of public and private producer customers are currently operating nine drilling rigs on Crestwood’s systems. As a result, Crestwood expects between 45 and 50 wells to be connected in the fourth quarter, bringing the full-year total to 135 to 140 wells.

During the third quarter 2022, Crestwood invested $26 million in the Delaware Basin, approximately half of which was related to the expansion of the Panther crude oil and produced water gathering and disposal system for Percussion Petroleum. The remaining projects include gathering and compression expansions in New Mexico to service the strong level of development activity ongoing from Crestwood’s dedicated producers.

Powder River Basin

During the third quarter 2022, the Powder River Basin averaged gathering volumes of 113 MMcf/d and natural gas processing volumes of 110 MMcf/d, year-over-year increases of 11% and 12%, respectively. Year-over-year volume growth was driven by six new wells connected to the Jackalope system during the third quarter 2022, as well as growing volumes on the Continental Express high-pressure pipeline, which was brought into service during the second quarter 2022. There are currently three rigs operating in the Powder River Basin on Crestwood’s dedicated acreage targeting multiple formations, which are expected to result in increasing volumes on the Jackalope system throughout 2023.

Tres Palacios

During the third quarter, Crestwood submitted a FERC filing for the expansion of the Tres Palacios Gas Storage Facility (“Tres”). The proposed expansion would add 6.5 Bcf of working gas capacity by converting an existing brine production well within the Tres facility into an additional natural gas storage cavern. Crestwood conducted an open season for the proposed expansion, which was six times oversubscribed, and subsequently executed long-term precedent agreements with existing, investment grade counterparties. Following Winter Storm Uri and the increase in Gulf Coast LNG demand, Tres has benefitted from increased customer demand for storage and wheeling services. Crestwood anticipates these positive market trends to benefit storage rates and contract tenors during the on-going re-contracting season for open capacity at Tres.

Updated 2022 Financial Guidance

Based on 2022 results to date and the outlook for the fourth quarter, Crestwood expects full-year Adjusted EBITDA to be in a range of $780 million to $800 million. The revised guidance range fully incorporates the acquisitions of Sendero Midstream and CPJV, the divestitures of Barnett and Marcellus, and the latest updates on completion timing from Crestwood’s producer customers in its core operating regions. Additionally, Crestwood is revising lower its ranges for both growth capital and maintenance capital spending based on the latest projections for the remainder of the year. These projections are subject to risks and uncertainties in the "Forward-Looking Statements" section at the end of this release.

  • Net income of $80 million to $100 million; impacted by gains and losses on long-lived assets related to the Barnett and Marcellus divestitures and a gain on the acquisition of CPJV
  • 2022E Adjusted EBITDA of $780 million to $800 million
  • Contribution by operating segment is set forth below:

$US millions


Adj. EBITDA Range

Operating Segment


Low


High

Gathering & Processing North


$595

-

$615

Gathering & Processing South


170

-

180

Storage & Logistics


60

-

70

Less: Corporate G&A


(55)


(55)

FY 2022 Totals


$780

-

$800

  • Distributable cash flow available to common unitholders of $485 million to $505 million
  • Free cash flow after distributions of $5 million to $25 million
  • Full-year 2022E coverage ratio of 1.8x to 2.0x
  • Year-end 2022E leverage ratio between 3.9x and 4.1x
  • Growth project capital spending in the range of $200 million to $220 million
  • Maintenance capital spending in the range of $25 million to $30 million

Capitalization and Liquidity Update

As of September 30, 2022, Crestwood had approximately $3.6 billion of debt outstanding, comprised of $2.25 billion of fixed-rate senior notes and $1.3 billion outstanding under its two revolving credit facilities, resulting in a consolidated leverage ratio of 4.2x. On October 14, 2022, Crestwood exercised the accordion feature on its revolving credit facility, under the existing terms, to enhance its liquidity position, increasing total commitments from $1.5 billion to $1.75 billion. On October 25, 2022, Crestwood closed its previously announced divestiture of its Marcellus Shale gathering and compression assets for $205 million in cash. Pro forma for the expansion of the corporate revolving credit facility and the closing of the Marcellus divestiture, Crestwood has current debt outstanding of $3.4 billion, a consolidated leverage ratio of 4.1x, and more than $865 million of available liquidity.

Crestwood currently has 71.3 million preferred units outstanding (par value of $9.13 per unit) that pay a fixed-rate annual cash distribution of 9.25%, payable quarterly. The preferred units are listed on the New York Stock Exchange and trade under the ticker symbol CEQP-P.

Sustainability Program Update

Crestwood’s ESG performance and commitment to enhanced transparency and disclosure continues to be recognized externally by key ESG rating groups. Recently, MSCI upgraded Crestwood’s ESG corporate rating to ‘A’ from ‘BBB’ due to its strong commitment to corporate governance and environmental stewardship, highlighted by Crestwood’s enhancements to its proxy access, Board diversity, and business ethics programs. MSCI is widely considered to be one of the top ESG evaluation systems recognized by the global investment community. This latest upgrade solidifies Crestwood’s ESG leadership position across the midstream sector and is the third rating upgrade the company has received since formally establishing its sustainability program in 2018.

For more information on Crestwood’s approach to sustainability and carbon management, please visit https://esg.crestwoodlp.com.

Upcoming Conference Participation

Crestwood’s management will participate in the following upcoming investor conferences. Prior to the start of each conference, new presentation materials may be posted to the Investors section of Crestwood’s website at www.crestwoodlp.com.

  • 2022 RBC Capital Markets Midstream and Energy Infrastructure Conference, November 16 - 17, 2022, Dallas, Texas
  • Bank of America General Leveraged Finance Conference, November 28 - 30, 2022, Boca Raton, Florida
  • Capital One Securities Energy Conference, December 5 - 7, 2022, Houston, Texas
  • Wells Fargo Midstream, Utilities and Renewable Power Symposium, December 8 - 9, 2022, New York City, New York

Earnings Conference Call Schedule

Management will host a conference call for investors and analysts of Crestwood today at 9:00 a.m. Eastern Time (8:00 a.m. Central Time) which will be broadcast live over the Internet. Investors will be able to connect to the webcast via the “Investors” page of Crestwood’s website at www.crestwoodlp.com. Please log in at least ten minutes in advance to register and download any necessary software. A replay will be available shortly after the call for 90 days.

Non-GAAP Financial Measures

Adjusted EBITDA, distributable cash flow and free cash flow are non-GAAP financial measures. The accompanying schedules of this news release provide reconciliations of these non-GAAP financial measures to their most directly comparable financial measures calculated and presented in accordance with GAAP. Our non-GAAP financial measures should not be considered as alternatives to GAAP measures such as net income or operating income or any other GAAP measure of liquidity or financial performance.

Forward-Looking Statements

This news release contains forward-looking statements within the meaning of the U.S. Private Securities Litigation Reform Act of 1995 and Section 21E of the Securities and Exchange Act of 1934. The words “expects,” “believes,” “anticipates,” “plans,” “will,” “shall,” “estimates,” and similar expressions identify forward-looking statements, which are generally not historical in nature. Forward-looking statements are subject to risks and uncertainties and are based on the beliefs and assumptions of management, based on information currently available to them. Although Crestwood believes that these forward-looking statements are based on reasonable assumptions, it can give no assurance that any such forward-looking statements will materialize. Important factors that could cause actual results to differ materially from those expressed in or implied from these forward-looking statements include the risks and uncertainties described in Crestwood’s reports filed with the Securities and Exchange Commission, including its Annual Report on Form 10-K and its subsequent reports, which are available through the SEC’s EDGAR system at www.sec.gov and on our website. Readers are cautioned not to place undue reliance on forward-looking statements, which reflect management’s view only as of the date made, and Crestwood assumes no obligation to update these forward-looking statements.

About Crestwood Equity Partners LP

Houston, Texas, based Crestwood Equity Partners LP (NYSE: CEQP) is a master limited partnership that owns and operates midstream businesses in multiple shale resource plays across the United States. Crestwood Equity is engaged in the gathering, processing, treating, compression, storage and transportation of natural gas; storage, transportation, terminalling and marketing of NGLs; gathering, storage, terminalling and marketing of crude oil; and gathering and disposal of produced water. To learn more about Crestwood Equity Partners LP, visit www.crestwoodlp.com; and to learn more about Crestwood’s sustainability efforts, please visit https://esg.crestwoodlp.com.

CRESTWOOD EQUITY PARTNERS LP

Consolidated Statements of Operations

(in millions, except per unit data)

(unaudited)


Three Months Ended
September 30,


Nine Months Ended
September 30,


2022


2021


2022


2021


Revenues

$

1,566.0


$

1,226.3


$

4,597.8


$

3,188.6


Cost of products/services sold


1,286.8


1,099.3


3,864.4


2,710.3


Operating expenses and other:


Operations and maintenance


55.0


31.6


144.0


90.2


General and administrative


33.9


25.9


103.8


67.4


Depreciation, amortization and accretion


86.9


64.6


242.3


182.6


Loss on long-lived assets, net


175.9


18.5


186.9


19.6


Gain on acquisition


(75.3

)


(75.3

)


276.4


140.6


601.7


359.8


Operating income (loss)


2.8


(13.6

)


131.7


118.5


Earnings (loss) from unconsolidated affiliates, net


3.2


4.9


12.2


(125.9

)

Interest and debt expense, net


(47.6

)


(30.9

)


(123.8

)


(102.0

)

Loss on modification/extinguishment of debt


(6.7

)

Other income, net


0.1


0.2


0.2


Income (loss) before income taxes


(41.6

)


(39.5

)


20.3


(115.9

)

Provision for income taxes


(1.4

)


(0.1

)


(1.7

)


(0.1

)

Net income (loss)


(43.0

)


(39.6

)


18.6


(116.0

)

Net income attributable to non-controlling partner


10.3


10.3


30.8


30.7


Net loss attributable to Crestwood Equity Partners LP


(53.3

)


(49.9

)


(12.2

)


(146.7

)

Net income attributable to preferred units


15.0


15.0


45.0


45.0


Net loss attributable to partners

$

(68.3

)


$

(64.9

)


$

(57.2

)


$

(191.7

)


Net loss per limited partner unit:


Basic and Diluted

$

(0.64

)


$

(1.03

)


$

(0.59

)


$

(2.88

)

CRESTWOOD EQUITY PARTNERS LP

Selected Balance Sheet Data

(in millions)


September 30,
2022


December 31,
2021


(unaudited)


Cash

$

6.4


$

13.3


Outstanding debt:


Revolving Credit Facilities

$

1,319.3


$

282.0

Senior Notes


2,250.0


1,800.0

Other


27.8


0.2

Subtotal


3,597.1


2,082.2

Less: deferred financing costs, net


27.1


29.9

Total debt

$

3,570.0


$

2,052.3


Partners' capital


Total partners' capital

$

1,938.2


$

1,099.6

Common units outstanding


104.7


63.0

CRESTWOOD EQUITY PARTNERS LP

Reconciliation of Non-GAAP Financial Measures

(in millions)

(unaudited)


Three Months Ended
September 30,


Nine Months Ended
September 30,


2022


2021


2022


2021


Net Income (Loss) to Adjusted EBITDA


Net income (loss)

$

(43.0

)


$

(39.6

)


$

18.6


$

(116.0

)

Interest and debt expense, net


47.6


30.9


123.8


102.0


Loss on modification/extinguishment of debt


6.7


Provision for income taxes


1.4


0.1


1.7


0.1


Depreciation, amortization and accretion


86.9


64.6


242.3


182.6


EBITDA (a)

$

92.9


$

56.0


$

386.4


$

175.4


Significant items impacting EBITDA:


Unit-based compensation charges


9.6


12.9


26.8


22.8


Loss on long-lived assets, net


175.9


18.5


186.9


19.6


Gain on acquisition


(75.3

)


(75.3

)


(Earnings) loss from unconsolidated affiliates, net


(3.2

)


(4.9

)


(12.2

)


125.9


Adjusted EBITDA from unconsolidated affiliates, net


5.7


9.8


24.2


56.5


Change in fair value of commodity inventory-related derivative contracts


(5.4

)


46.8


(4.6

)


48.9


Significant transaction and environmental related costs and other items


9.1


0.8


29.6


1.9


Adjusted EBITDA (a)

$

209.3


$

139.9


$

561.8


$

451.0


Distributable Cash Flow (b)


Adjusted EBITDA (a)

$

209.3


$

139.9


$

561.8


$

451.0


Cash interest expense (c)


(48.0

)


(29.4

)


(124.0

)


(97.3

)

Maintenance capital expenditures (d)


(6.4

)


(4.8

)


(15.2

)


(13.1

)

Adjusted EBITDA from unconsolidated affiliates, net


(5.7

)


(9.8

)


(24.2

)


(56.5

)

Distributable cash flow from unconsolidated affiliates


5.6


9.0


22.4


53.3


PRB cash received in excess of recognized revenues (e)


2.9


6.3


12.7


18.6


Provision for income taxes


(1.4

)


(0.1

)


(1.7

)


(0.1

)

Distributable cash flow attributable to CEQP


156.3


111.1


431.8


355.9


Distributions to preferred


(15.0

)


(15.0

)


(45.0

)


(45.0

)

Distributions to Niobrara preferred


(10.3

)


(10.3

)


(31.0

)


(30.9

)

Distributable cash flow attributable to CEQP common

$

131.0


$

85.8


$

355.8


$

280.0


Contacts

Crestwood Equity Partners LP
I
nvestor Contacts

Andrew Thorington, 713-381-3028
This email address is being protected from spambots. You need JavaScript enabled to view it.
Vice President, Finance & Investor Relations

Rhianna Disch, 713-380-3006
This email address is being protected from spambots. You need JavaScript enabled to view it.
Director, Investor Relations

Sustainability and Media Contact

Joanne Howard, 832-519-2211
This email address is being protected from spambots. You need JavaScript enabled to view it.
Senior Vice President, Sustainability and Corporate Communications


Read full story here

BrainFirm launches a new sustainability check service for your business partners in Japan

TOKYO--(BUSINESS WIRE)--BrainFirm Co., Ltd., the only Japanese consulting firm that received the Platinum Rating of EcoVadis, started providing companies doing business in Japan with sustainability consultancy.


In the current global market, multinational corporations must manage the potential business risks of foreign markets. But it is difficult to assess potential risks and take appropriate measures to control the risks in foreign markets. Moreover, especially in Japan, there are unique risks such as weak corporate governance, an immature management system, difficulty in English communication, and illogical business customs. Therefore, BrainFirm will provide consultancy services to companies concerned about sustainability issues of their operations, supply chains, or business partners in Japan.

BrainFirm will provide the following companies with tailor-made solutions.

  • The company that has concern about a low EcoVadis score for its business partner in Japan
  • The company that wants to improve the EcoVadis score of its subsidiary in Japan
  • The company that wants to provide help with its subsidiary in Japan to improve the quality of disclosure about climate change
  • The company that has any concerns about human rights issues related to a Japanese company it wants to start a business with

Please see details here: https://www.brainfirm-sustainability.com/consulting

Satomi Shintani, the president of BrainFirm, said: "We are the only Japanese consulting firm that received the Platinum Rating of EcoVadis and also the climate change consultancy solution provider of CDP in Japan. In addition, we have accumulated expertise in public-private partnership (PPP) and ample experience in consultancy for municipalities and private corporations during the last 25 years. Therefore we have a distinguished performance record and expertise in sustainability activities."

BrainFirm's main consulting services:

EcoVadis Score Improvement
BrainFirm helps customers improve their EcoVadis score and rating. In addition, BrainFirm has accumulated consulting experience and expertise in Japanese unique business customs. Therefore BrainFirm can advise corporations on what they should do in Japan.

A sustainability-related survey in Japan
Upon a client's request, BrainFirm will conduct an on-site survey in Japan and provide a report on sustainability-related issues, such as the human rights due diligence performance of operations and business partners in Japan.


Contacts

Satomi Shintani
President
Email: This email address is being protected from spambots. You need JavaScript enabled to view it.

Eiichi Kon
VP
Email: This email address is being protected from spambots. You need JavaScript enabled to view it.

Phone: +81-6-6441-2211
FAX: +81-50-3588-0077
Office hours:
9:00 – 17:00 (JST)/0:00 – 8:00 (GMT)

Partnership brings AI-powered consumer analytics to rural communities, improving grid management, energy education and more

MOUNTAIN VIEW, Calif.--(BUSINESS WIRE)--National Information Solutions Cooperative (NISC) has integrated Bidgely’s UtilityAI™ solution into its service platform to enhance customer experience for utility cooperative members. Bidgely’s artificial intelligence (AI)-powered energy insights are embedded within NISC’s software platform to provide utility members with a 360-degree view of their energy consumers, improving various customer touch points, such as customer service, call center experiences and targeted marketing programs. In addition to driving higher satisfaction for end consumers, this integration further advances NISC’s innovation efforts to foster success among utility cooperative members.


“Bidgely’s energy insights are a perfect complement to our SmartHub and Meter Data Management Strategies, and we are excited to introduce a new set of offerings to our utility cooperative members,” said David Bonnett, Vice President of Product Management for NISC. “As we continually increase our member base and service offerings, we are confident Bidgely’s scalable and highly secure solutions will continue to grow with us.”

Applying AI and machine learning techniques to smart meter data, Bidgely’s UtilityAI solution itemizes a household’s energy usage down to the appliance level. Equipped with behind-the-meter energy intelligence, utility cooperatives are able to not only make smarter, more informed business decisions for grid management and planning but also encourage greater energy efficiency among consumers, resulting in higher engagement and loyalty. NISC’s utility cooperative members can apply Bidgely energy insights to a myriad of organizational operations, including:

  • Increased customer satisfaction by providing relevant energy insights that educate and empower consumers to better manage their energy costs.
  • Improved call center experiences by equipping utility representatives with at-a-glance customer information to resolve issues quickly and at a lower cost-to-serve.
  • Reduced call center inquiries by providing budget alerts, forecasting tools and monthly summaries that minimize bill-related questions or surprises.
  • More time- and cost-efficient program targeting by accurately identifying consumers for program enrollment (i.e. time-of-use rates; load shifting) and personalizing marketing communications based on consumption patterns.
  • Greater grid resilience through a better understanding how energy flows along the grid, including electric vehicle (EV) detection, high demand times of use and distributed energy resource generation.

“We are proud to partner with NISC in bringing the next wave of advanced digital technology to utilities in rural communities across the U.S. for the first time, which traditionally has only been available to large utility corporations,” said Abhay Gupta, CEO of Bidgely. “One of the greatest aspects of AI is that it can be implemented universally, which is what we believe is essential in achieving greater energy equity around the world.”

To learn more about how Bidgely’s UtilityAI solution optimizes grid operations and enhances customer engagement, read NISC Partners With Bidgely to Drive Digital Transformation for Coop Members.

About NISC

NISC is an information technology organization that develops, implements and supports software and hardware solutions for our Members. We deliver advanced solutions, services and support to 935 independent broadband companies, electric cooperatives and other public power entities. NISC is an industry leader providing information technology solutions including financials, service, operations and marketing as well as many other supporting platforms and business services. With facilities in Mandan, N.D.; Lake Saint Louis, Mo.; Cedar Rapids, Iowa; and Blacksburg, VA. NISC and its subsidiary employ more than 1,300 professionals between the four locations and remotely throughout the United States. Additional information about NISC can be found at www.nisc.coop.

About Bidgely

Bidgely is an AI-powered SaaS Company accelerating a clean energy future by enabling energy companies and consumers to make data-driven energy-related decisions. Powered by our unique patented technology, Bidgely's UtilityAI™ Platform transforms multiple dimensions of customer data - such as energy consumption, demographic, and interactions - into deeply accurate and actionable consumer energy insights. We leverage these insights to empower each customer with personalized recommendations, tailored to their individual personality and lifestyle, usage attributes, behavioral patterns, purchase propensity, and beyond. From a Distributed Energy Resources (DER) and Grid Edge perspective, Bidgely is advancing smart meter innovation with data-driven solutions for solar PVs, EV detection, EV behavioral load shifting and managed charging, energy theft, short-term load forecasting, grid analytics, and TOU rate designs. Bidgely’s UtilityAI™ energy analytics provides deep visibility into generation, consumption for better peak load shaping and grid planning, and delivers targeted recommendations for new value-added products and services. With roots in Silicon Valley, Bidgely has over 17 energy patents, $75M+ in funding, retains 30+ data scientists, and brings a passion for AI to utilities serving residential and commercial customers around the world. For more information, please visit www.bidgely.com or the Bidgely blog at bidgely.com/blog.


Contacts

Christine Bennett
Bidgely
This email address is being protected from spambots. You need JavaScript enabled to view it.

  • CFO Michael Battles and COO Eric Gerstenberg Are Promoted to Co-CEO Role
  • Alan McKim to Become Executive Chairman of the Board and CTO

NORWELL, Mass.--(BUSINESS WIRE)--Clean Harbors, Inc. (“Clean Harbors”) (NYSE: CLH), the leading provider of environmental and industrial services throughout North America, today announced that it has appointed Chief Operating Officer Eric W. Gerstenberg and Chief Financial Officer Michael L. Battles as co-CEOs of the Company, effective March 31, 2023. As part of a long-planned transition, they will be succeeding Clean Harbors’ founder Alan S. McKim, who has been CEO for the past 42 years. McKim will become Executive Chairman of the Board of Directors and Chief Technology Officer (CTO) where he will continue to spearhead the Company’s M&A and technology initiatives. Battles and Gerstenberg will work together as co-CEOs to jointly direct the day-to-day operations and continued growth of the Company.


“Eric and Mike are proven leaders here at Clean Harbors and each brings a unique set of talents to their new role as co-CEOs,” McKim said. “Both have made valuable contributions to the Company and keeping this management team in place has been a top priority of mine. Our shareholders and more than 20,000 employees will benefit from their outstanding leadership. I have the utmost confidence in handing over the reins to Mike and Eric, and in their ability to succeed at the top level of the organization. In addition, while I am stepping away from the day-to-day management duties, I will remain actively involved in the Company’s strategic direction as executive chairman and CTO. I look forward to continuing to work with both Eric and Mike to advance Clean Harbors’ mission of creating a safer, cleaner environment through the treatment, recycling and disposal of hazardous materials.”

Dr. Gene Banucci, lead independent director of Clean Harbors’ Board, said, “Today’s announcement comes after a carefully detailed and comprehensive selection process that ensures a smooth transition for all critical stakeholders including employees, customers and investors. The Board believes that Mike and Eric together are not only the best choice, but the timing is ideal given the favorable market dynamics, positive momentum of the Company and the wide range of skills that they collectively bring to the CEO position. Each one has been integral at the executive level to the Company’s undeniable success over the past five plus years. We believe that working collaboratively together they are uniquely positioned to execute the Company’s strategic growth plan and navigate it through its next stage of development.”

Dr. Banucci continued, “Clean Harbors’ four decades of success stems from Alan McKim’s vision and extraordinary foresight of what the Company could become. His determination and leadership took a four-person startup and fashioned it into a multi-billion-dollar provider of environmental and industrial services that is relied upon for safe, sustainable solutions by more than 300,000 customers today. Along the way, he helped transform an entire industry that was once a fragmented collection of environmental assets and services into a reliable, compliance-driven field that provides customers with a broad spectrum of ecofriendly offerings to handle all of their hazardous waste needs. He has created an amazing legacy for himself and the Company he founded in 1980. On behalf of the Board and the entire Clean Harbors community, we want to thank Alan for all he has accomplished and look forward to continuing to work with him as executive chairman and CTO for the foreseeable future.”

Gerstenberg joined Clean Harbors in 1989 and during the past thirty years he has held a variety of positions of increasing responsibility throughout the organization. He was most recently Chief Operating Officer – a position he has held since 2015 – where he had responsibility for the Company’s environmental sales & service organization, all of its facilities including incinerators and re-refineries, and oversaw the majority of its workforce.

After a long career in public accounting at Deloitte & Touche and as a finance leader at PerkinElmer, Inc. Battles joined Clean Harbors in 2013 as Chief Accounting Officer before being elevated to Chief Financial Officer in 2016. Since that time, he has overseen the Company’s entire finance organization, including multiple debt raises and refinancings, as well as taking on some strategic and operational oversight. He is also a member of the Board of Directors of Casella Waste Systems Inc. (Nasdaq: CWST).

About Clean Harbors

Clean Harbors (NYSE: CLH) is North America’s leading provider of environmental and industrial services. The Company serves a diverse customer base, including a majority of Fortune 500 companies. Its customer base spans a number of industries, including chemical, energy and manufacturing, as well as numerous government agencies. These customers rely on Clean Harbors to deliver a broad range of services such as end-to-end hazardous waste management, emergency spill response, industrial cleaning and maintenance, and recycling services. Through its Safety-Kleen subsidiary, Clean Harbors also is North America’s largest re-refiner and recycler of used oil and a leading provider of parts washers and environmental services to commercial, industrial and automotive customers. Founded in 1980 and based in Massachusetts, Clean Harbors operates in the United States, Canada, Mexico, Puerto Rico and India. For more information, visit www.cleanharbors.com.

Safe Harbor Statement

Any statements contained herein that are not historical facts are forward-looking statements within the meaning of the Private Securities Litigation Reform Act of 1995. These forward-looking statements are generally identifiable by use of the words “believes,” “expects,” “intends,” “anticipates,” “plans to,” “seeks,” “should,” “estimates,” “projects,” “may,” “likely,” or similar expressions. Such statements may include, but are not limited to, statements about planned executive team changes, and other statements that are not historical facts. Such statements are based upon the beliefs and expectations of Clean Harbors’ management as of this date only and are subject to certain risks and uncertainties that could cause actual results to differ materially, and those items identified as “Risk Factors” in Clean Harbors’ most recently filed Form 10-K and Form 10-Q. Forward-looking statements are neither historical facts nor assurances of future performance. Therefore, readers are cautioned not to place undue reliance on these forward-looking statements. Clean Harbors undertakes no obligation to revise or publicly release the results of any revision to these forward-looking statements other than through its filings with the Securities and Exchange Commission, which may be viewed in the “Investors” section of Clean Harbors’ website at www.cleanharbors.com.


Contacts

Michael L. Battles
Chief Financial Officer
Clean Harbors, Inc.
781.792.5100
This email address is being protected from spambots. You need JavaScript enabled to view it.

Jim Buckley
SVP Investor Relations
Clean Harbors, Inc.
781.792.5100
This email address is being protected from spambots. You need JavaScript enabled to view it.

  • Wallbox has teamed up with Uber to support drivers on their transition to Electric Vehicles in seven European markets by providing exclusive discounts on home chargers.
  • Uber aims to be a zero-emissions platform in Europe by 2030 and has an ambitious target of 50% EV Kms across seven key European Capitals cities by 2025.
  • Drivers are going electric in Europe nearly 5x faster than average European private car owners.
  • Through the partnership, drivers on the Uber platform, will be able to purchase a Wallbox home charger with installation for a discounted price

LONDON--(BUSINESS WIRE)--Drivers on the Uber (NYSE:UBER) platform in seven European countries can now purchase discounted home EV chargers, as Wallbox (NYSE: WBX) – a leading provider of Electric Vehicle (EV) charging and energy management solutions worldwide – and Uber expand their partnership across the continent.


The partnership, which will operate in the UK, Germany, The Netherlands, Spain, France, Portugal and Belgium, builds on Wallbox and Uber’s partnership in the USA and Canada that was successfully launched in 2021.

Supporting drivers switching to electric is key to Uber’s ambition to become a zero emissions platform in Europe by 2030, with Uber aiming for 100% EV in cities such as London as early as 2025.

Drivers are going electric in Europe nearly 5x faster than average European private car owners, with 6.2% of Kms driven on the Uber platform across the region now being fully electric.

Access to charging, both at home and on-street, remains a key barrier for drivers making the switch. As part of the partnership, drivers on the Uber platform will be able to purchase a home charger plus installation from Wallbox at a discounted rate.

Masud Rabbani, CBO Wallbox, said:

“We are delighted to expand our successful partnership with Uber. At Wallbox, we want to make the transition to EV as smooth and simple for drivers as possible and we believe our products offer that to drivers on the Uber platform around Europe. We look forward to this partnership developing over the coming years.”

Chris Hook, Head of Global Sustainability Strategy at Uber, said:

“We want to be the cleanest mobility platform on the planet, becoming a 100% electric platform across Europe by 2030. Partnerships with private and public stakeholders will be key to this success.

“Drivers consistently tell us that lack of easily accessible charging is an important concern. By expanding our collaboration with Wallbox in Europe we hope this will help address this key barrier for switching to EVs and help ensure drivers can make the switch as seamlessly and as soon as possible.”

ENDS

About Wallbox

Wallbox is a global technology company, dedicated to changing the way the world uses energy. Wallbox creates advanced electric vehicle charging and energy management systems that redefine users’ relationship to the grid. Wallbox goes beyond electric vehicle charging to give users the power to control their consumption, save money, and live more sustainably.

Wallbox offers a complete portfolio of charging and energy management solutions for residential, semi-public and public use in more than 110 countries.

Founded in 2015 and headquartered in Barcelona, the company now employs over 1000 people in its offices in Europe, Asia, and the Americas.

About Uber

Uber’s mission is to create opportunity through movement. We started in 2010 to solve a simple problem: how do you get access to a ride at the touch of a button? Billions of trips later, we're building products to get people closer to where they want to be. By changing how people, food, and things move through cities, Uber is a platform that opens up the world to new possibilities

Wallbox Forward Looking Statements
This press release includes “forward-looking statements” within the meaning of Section 27A of the Securities Act and Section 21E of the Securities Exchange Act of 1934, as amended. All statements contained in this press release that do not relate to matters of historical fact should be considered forward-looking statements, including, without limitation, statements regarding the timing of Wallbox’s achievement of its emissions targets and goals. In some cases, you can identify forward-looking statements by terminology such as “anticipate,” “believe,” “can,” “continue,” “could,” “estimate,” “expect,” “forecast,” “intend,” “may,” “might,” “plan,” “possible,” “potential,” “predict,” “project,” “should,” “will” or the negatives of these terms or variations of them or similar terminology, but the absence of these words does not mean that statement is not forward-looking. Such forward-looking statements are subject to risks, uncertainties, and other factors which could cause actual results to differ materially from those expressed or implied by such forward looking statements, including those discussed under the caption “Risk Factors” in Wallbox’s Post-Effective Amendment No, 3 to Wallbox’s Registration Statement on Form F-1 (File No. 333-260652) Filed on September 28, 2022, as such factors may be updated from time to time in its other filings with the SEC, accessible on the SEC’s website at www.sec.gov and the Investors Relations section of Wallbox’s website at investors.wallbox.com. These and other important factors could cause actual results to differ materially from those indicated by the forward-looking statements made in this press release. Any forward-looking statement that Wallbox makes in this press release speaks only as of the date of such statement. Except as required by law, Wallbox disclaims any obligation to update or revise, or to publicly announce any update or revision to, any of the forward-looking statements, whether as a result of new information, future events or otherwise.


Contacts

Press contact
Carme Orra
PR Manager Iberia
This email address is being protected from spambots. You need JavaScript enabled to view it.
0034 617.87.13.68

DUBLIN--(BUSINESS WIRE)--The "Bangladesh Transformer Market Outlook 2022-2028" report has been added to ResearchAndMarkets.com's offering.


The market would register significant growth in revenues owing to increasing power consumption and growing renewable energy production.

Three phase oil transformers would be the fastest growing segment. The government has increased its power budget under the 8th Five Year Plan and is constantly working to upgrade the transmission and distribution infrastructure of the country and expand its grid system with plans like the Power System Master Plan and Energy Efficiency and Conservation Master Plan 2030.

Due to the outbreak of COVID-19 pandemic, the market has registered a minimal decline of 5-10% as most of the projects of the government are pre- scheduled and continued as usual. However, the demand from private sector registered a decline in the year 2020.

According to the publisher, Bangladesh Transformer Market revenue size is projected to grow at a CAGR of 6.8% during 2022-2028F. The Bangladesh government has implemented programmes to improve the power supply network in the country, with plans like Power System Master Plan 2016 and Energy Efficiency and Conservation Master Plan 2030 that is focused towards increasing the electricity generation capacity of the country over the coming years which would create ample opportunities for power & distribution transformers market in Bangladesh.

The government plans to generate 4100 MW of electricity through renewable sources by 2030 from current capacity of 780 MW in 2021. The upcoming construction projects such as Rooppur Nuclear Power Plant, Padma Bridge, Dhaka Metro among many others require the installation of transformers to achieve higher efficiency for meeting the increased electricity consumption thereby driving the aforesaid market over the forthcoming period.

Bangladesh Transformer Market Analysis, By types

In terms of market revenue share by types, 'three phase oil transformers have captured around 69% of the market revenues for the year 2021 as power utilities are the largest buyers of transformers in Bangladesh and three phase oil transformers are mostly used for distribution purposes in urban areas.

Bangladesh Transformer Market Analysis, By private vs government application

The government segment accounted for around 72% of the market revenue share for the year 2021 owing to the large number of ongoing power distribution network expansion projects throughout Bangladesh in order to achieve 100 percent electricity coverage targets. However, the burgeoning construction sector coupled with the development of commercial, industrial and healthcare sectors would bolster the demand from the private sector over the coming years.

Bangladesh Transformer Market Analysis, By regions

Central region held the maximum revenue share in the overall market for the year 2021 owing to the presence of large-scale industrial and commercial projects in Dhaka. Some of the ongoing projects such as the Dhaka metro rail project, Padma Rail Link project and the development of textile industry, hotel chains and hospitals in the central region would bolster the demand for transformers in the central region on account of the requirement of continuous power supply for all these developments.

Key Highlights of the Report

  • Bangladesh Transformer Market Size
  • Bangladesh Transformer Market Outlook
  • Bangladesh Transformer Market Forecast
  • Bangladesh Transformer Market Growth
  • Historical Data and Forecast of Bangladesh Transformer Market Revenues for the Period 2018-2028F
  • Historical Data and Forecast of Revenues, By Types, KVA Ratings, Applications and Regions for the Period 2018-2028F
  • Market Drivers and Restraints
  • Bangladesh Transformer Market Trends and Industry Life Cycle
  • Porter's Five Force Analysis
  • Market Opportunity Assessment
  • Bangladesh Transformer Market Share Ranking, By Company
  • Bangladesh Transformer Market - Impact of COVID-19
  • Bangladesh Transformer Market - Analysis of Domestic Production and Imports
  • Competitive Benchmarking
  • Company Profiles
  • Key Strategic Recommendations

Company Profiles

  • Bengal Telecommunication & Electric Corp. (Pvt.) Ltd.
  • EDISON Power Bangladesh Ltd.
  • Electro Power Engineering Ltd
  • Energypac Engineering Ltd.
  • General Electric Manufacturing Company Limited
  • Powermann Bangladesh Limited
  • POWERtrac Group
  • Transpower Engineering Limited
  • TS Transformers Limited
  • Vicar Electricals Ltd

Market Scope and Segmentation

By Type

  • Single Phase-oil
  • Three Phase-oil
  • Dry

By KVA Ratings (For Single Phase-oil)

  • 10 KVA
  • 15 KVA
  • 25 KVA
  • 5 KVA
  • 50 KVA

By KVA Ratings (For Three Phase-oil)

  • 50 KVA - 15 MVA

By KVA Ratings (For Dry)

  • Up to 500 KVA
  • 630-2500 KVA
  • Above 2500 KVA

By Applications

  • Government
  • Private

By Regions

  • Northern region
  • Southern region
  • Central region

For more information about this report visit https://www.researchandmarkets.com/r/hyd6x1


Contacts

ResearchAndMarkets.com
Laura Wood, Senior Press Manager
This email address is being protected from spambots. You need JavaScript enabled to view it.
For E.S.T Office Hours Call 1-917-300-0470
For U.S./ CAN Toll Free Call 1-800-526-8630
For GMT Office Hours Call +353-1-416-8900

SAN RAMON, Calif.--(BUSINESS WIRE)--Complete Solaria, Inc. (“Complete Solaria” or the “Company”), a solar technology, services and financing company, and Freedom Acquisition I Corp. (NYSE: FACT) (“Freedom”), a publicly traded special purpose acquisition company, today announced that Marathon Capital LLC will be acting as Lead Capital Markets Advisor to Complete Solaria and Cohen & Company Capital Markets, a division of J.V.B. Financial Group, LLC, will be acting as Lead Capital Markets Advisor to Freedom, in connection with the business combination between Complete Solaria and Freedom. Upon closing of the business combination, which is expected in the first half of 2023, the combined Company is expected to be listed on the New York Stock Exchange under the new ticker “CSLR”.

Complete Solaria will be the result of a merger between two leading U.S. residential solar companies, Complete Solar and Solaria which is expected to close in the fourth quarter of 2022. Complete Solaria will be a full system operator, with a compelling end to end customer offering including best-in-class technology, financing, project fulfilment, and service, for customers across the United States. Kroll, LLC, operating through its Duff and Phelps Opinions Practice, has provided a fairness opinion to the board of directors of Freedom in connection with the proposed business combination with Complete Solaria, which satisfies one of the conditions to the closing set forth in the related Business Combination Agreement.

On a pro forma combined basis, Complete Solaria generated $80 million in revenue in 2020, which is projected to increase to over $120 million in 2022, and more than double to approximately $285 million in 2023, with the expectation of achieving breakeven EBITDA in the second half of 2023. Supported by the synergies underlying the merger of Complete Solar and Solaria, the Company expects to achieve profitability in 2024.

About Complete Solaria
Complete Solaria will combine two of the leading residential solar companies in the U.S., Complete Solar and Solaria. The combination of businesses will create a compelling customer offering with best-in-class technology, which is expected to include financing, project fulfilment, and service allowing the combined company to sell more products across more markets and enable a package of financing options for customers wishing to make the switch to a more energy-efficient existence. Complete Solaria is backed by a world-class group of investors, including T.J. Rodgers and certain sponsor shareholders of Freedom. To learn more, please click link for Complete Solaria.

About Freedom
Freedom is a blank check company, formed for the purpose of effecting a merger, share exchange, asset acquisition, share purchase, reorganisation or similar business combination with one or more businesses. Freedom is led by the Executive Chairman Tidjane Thiam, who previously served as CEO of Credit Suisse and Prudential. Senior management of Freedom also includes Chief Executive Officer Adam Gishen, and Edward Zeng, a proven entrepreneur with a strong track record of creating value for investors across financial services, technology and energy transition sectors. To learn more about Freedom, visit www.freedomac1.com.

Important Information and Where to Find It
This press release relates to proposed transactions involving Complete Solar, Solaria, Complete Solaria and Freedom. Freedom intends to file a registration statement (“Registration Statement”), which will include a proxy statement for the solicitation of Freedom shareholder approval and a prospectus for the offer and sale of Freedom securities in the proposed transaction with Complete Solaria, and other relevant documents with the Securities and Exchange Commission (“SEC”) to be used at its extraordinary general meeting of shareholders to approve the proposed transaction with Complete Solaria. The proxy statement will be mailed to shareholders as of a record date to be established for voting on the proposed business combination between Freedom and Complete Solaria. INVESTORS AND SECURITY HOLDERS OF FREEDOM AND COMPLETE SOLARIA ARE URGED TO READ THE REGISTRATION STATEMENT, PROXY STATEMENT, PROSPECTUS AND OTHER RELEVANT DOCUMENTS THAT WILL BE FILED WITH THE SEC CAREFULLY AND IN THEIR ENTIRETY WHEN THEY BECOME AVAILABLE BECAUSE THEY WILL CONTAIN IMPORTANT INFORMATION ABOUT THE PROPOSED TRANSACTION. Investors and security holders will be able to obtain free copies of the Registration Statement, proxy statement, prospectus and other documents containing important information about Freedom and Complete Solaria once such documents are filed with the SEC, through the website maintained by the SEC at www.sec.gov.

Participants in the Solicitation
Freedom, Complete Solaria and their respective directors and executive officers may be deemed to be participants in the solicitation of proxies of Freedom’s shareholders in connection with the proposed transaction. A list of the names of such directors and executive officers and information regarding their interests in the proposed transaction between Freedom and Complete Solaria will be contained in the proxy statement/prospectus pertaining to the proposed transaction when available at www.sec.gov.

No Offer or Solicitation
This press release shall not constitute a solicitation of a proxy, consent or authorization with respect to any securities or in respect of the proposed transactions. This press release shall also not constitute an offer to sell or the solicitation of an offer to buy any securities, nor shall there be any sale of securities in any jurisdictions in which such offer, solicitation or sale would be unlawful prior to registration or qualification under the securities laws of any such jurisdiction. No offering of securities shall be made except by means of a prospectus meeting the requirements of Section 10 of the Securities Act of 1933, as amended, or an exemption therefrom.

Forward Looking Statements
This communication may contain certain forward-looking statements within the meaning of the federal securities laws with respect to the proposed transactions. These forward-looking statements generally are identified by the words “anticipate,” “believe,” “continue,” “could,” “estimate,” “expect,” “intend,” “may,” “might,” “plan,” “possible,” “potential,” “predict,” “project,” “should,” “would,” and similar expressions, but the absence of these words does not mean that a statement is not a forward-looking statement. Forward-looking statements are forecasts, predictions, projections and other statements about future events that are based on current expectations, hopes, beliefs, intentions, strategies and assumptions and, as a result, are subject to risks and uncertainties. Many factors could cause actual future events to differ materially from the forward-looking statements in this press release, including but not limited to: (i) the risk that the proposed transactions may not be completed in a timely manner or at all; (ii) the risk that the proposed business combination between Freedom and Complete Solaria may not be completed by Freedom’s business combination deadline and the potential failure to obtain an extension of the business combination deadline if sought by Freedom; (iii) the failure to satisfy the conditions to the consummation of the proposed transactions; (iv) the effect of the announcement or pendency of the proposed transactions on the companies’ business relationships, operating results, and business generally; (v) risks that the proposed transactions disrupt current plans and operations of the companies or divert managements’ attention from the companies’ ongoing business operations and potential difficulties in employee retention as a result of the announcement and consummation of the proposed transactions; (vi) the outcome of any legal proceedings that may be instituted in connection with the proposed transactions; (vii) the ability to maintain the listing of Freedom’s securities on a national securities exchange; (viii) the price of Freedom’s securities may be volatile due to a variety of factors, including changes in the applicable competitive or regulatory landscapes, variations in operating performance across competitors, changes in laws and regulations affecting Freedom’s or the Complete Solaria’s business, and changes in the combined capital structure; (ix) the ability to implement business plans, forecasts, and other expectations after the completion of the proposed transactions, and identify and realize additional opportunities; (x) the ability to recognize the anticipated benefits of the proposed transactions, which may be affected by, among other things, competition, the ability of the combined company to grow and manage growth profitably, maintain relationships with customers and suppliers and retain its management and key employees; (xi) the evolution of the markets in which Complete Solaria will compete; (xii) the costs related to the proposed transactions; (xiii) any impact of the COVID-19 pandemic on Complete Solaria’s business; and (xiv) Freedom and Complete Solaria’s expectations regarding its market opportunities.

The foregoing list of factors is not exhaustive. Readers should carefully consider the foregoing factors and the other risks and uncertainties described in the “Risk Factors” section of documents filed by Freedom from time to time with the SEC, including the Registration Statement, when available. Such filings identify and address other important risks and uncertainties that could cause actual events and results to differ materially from those contained in the forward-looking statements. Forward-looking statements speak only as of the date they are made. Readers are cautioned not to put undue reliance on forward-looking statements, and Freedom, Complete Solar, Solaria and Complete Solaria assume no obligation and do not intend to update or revise these forward-looking statements, whether as a result of new information, future events, or otherwise. None of Freedom, Complete Solar, Solaria or Complete Solaria gives any assurance that any of them will achieve its expectations.

Non-GAAP Financial Measures
This press release also includes certain non-GAAP (as defined below) financial measures the managements of Complete Solar and Solaria uses to evaluate their operations, measure their performance and make strategic decisions, including EBITDA. EBITDA represents earnings before interest expense, taxes, depreciation and amortization. Complete Solar, Solaria and Freedom believe that EBITDA provides useful information to investors and others in understanding and evaluating the current and projected operating results of Complete Solar, Solaria and Complete Solaria in the same manner as management. However, EBITDA is not a financial measure calculated in accordance with generally accepted accounting principles in the United States (“GAAP”) and should not be considered as substitutes for revenue, net income, operating profit or any other operating performance measures calculated in accordance with GAAP. Using non-GAAP financial measures to analyze the businesses of Complete Solar, Solaria or Freedom would have material limitations because the calculations are based on the subjective determination of their respective managements regarding the nature and classification of events and circumstances that investors may find significant. In addition, although other companies may report measures titled EBITDA or similar measures, such non-GAAP financial measures may be calculated differently from how Complete Solar, Solaria or Freedom calculate non-GAAP financial measures, which reduces their comparability. Because of these limitations, readers should consider EBITDA alongside other financial performance measures, including net income and other financial results presented in accordance with GAAP.


Contacts

Investor Relations – Complete Solaria
Sioban Hickie, ICR, Inc.
This email address is being protected from spambots. You need JavaScript enabled to view it.

Investor Relations – Freedom
Adam Gishen, Freedom Acquisition l Corp.
This email address is being protected from spambots. You need JavaScript enabled to view it.

Public Relations – Complete Solaria
Doug Donsky, ICR, Inc.
This email address is being protected from spambots. You need JavaScript enabled to view it.

Public Relations – Freedom
Andy Smith, Powerscourt (U.K.)
This email address is being protected from spambots. You need JavaScript enabled to view it.

DAVIDSON, N.C.--(BUSINESS WIRE)--The Board of Directors of Ingersoll Rand Inc. (NYSE: IR), a global provider of mission-critical flow creation and industrial solutions, declared yesterday a regular quarterly cash dividend of $0.02 (two cents) per share of common stock payable on December 16, 2022 to stockholders of record on November 16, 2022.


About Ingersoll Rand Inc.

Ingersoll Rand Inc. (NYSE:IR), driven by an entrepreneurial spirit and ownership mindset, is dedicated to helping make life better for our employees, customers and communities. Customers lean on us for our technology-driven excellence in mission-critical flow creation and industrial solutions across 40+ respected brands where our products and services excel in the most complex and harsh conditions. Our employees develop customers for life through their daily commitment to expertise, productivity and efficiency. For more information, visit our Investor Relations Website.


Contacts

Investors:
Matthew Fort
This email address is being protected from spambots. You need JavaScript enabled to view it.

Media:
Samantha Hamlin
This email address is being protected from spambots. You need JavaScript enabled to view it.

Offshore Source Logo

Offshore Source keeps you updated with relevant information concerning the Offshore Energy Sector.

Any views or opinions represented on this website belong solely to the author and do not represent those of the people, institutions or organizations that Offshore Source or collaborators may or may not have been associated with in a professional or personal capacity, unless explicitly stated.

Corporate Offices

Technology Systems Corporation
8502 SW Kansas Ave
Stuart, FL 34997

info@tscpublishing.com