Business Wire News

Shape strategic responses through the phases of industry recovery

ABB Ltd., Canadian Solar Inc., and Hanwha Corp. will emerge as major residential solar PV systems market participants during 2021-2025

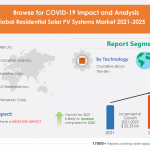
LONDON--(BUSINESS WIRE)--#GlobalResidentialSolarPVSystemsMarket--The residential solar PV systems market is expected to grow by USD 52.23 billion during 2021-2025, according to Technavio. The report offers a detailed analysis of the impact of the COVID-19 pandemic on the residential solar PV systems market in optimistic, probable, and pessimistic forecast scenarios.


Enterprises will go through the Response, Recovery, and Renew phases. Download a Free Sample Report on COVID-19

The residential solar PV systems market will witness a negative impact during the forecast period owing to the widespread growth of the COVID-19 pandemic. As per Technavio’s pandemic-focused market research, market growth is likely to increase as compared to 2019.

With the continuing spread of the novel coronavirus pandemic, organizations across the globe are gradually flattening their recessionary curve by leveraging technology. Many businesses will go through response, recovery, and renewal phases. Building business resilience and enabling agility will aid organizations to move forward in their journey out of the COVID-19 crisis towards the next normal.

This post-pandemic business planning research will aid clients to:

  • Adjust their strategic planning to move ahead once business stability kicks in.
  • Build resilience by making effective resource and investment choices for individual business units, products, and service lines.
  • Conceptualize scenario-based planning to mitigate future crisis situations.

Download the Post-Pandemic Business Planning Structure. Click here

Key Considerations for Market Forecast:

  • Impact of lockdowns, supply chain disruptions, demand destruction, and change in customer behavior
  • Optimistic, probable, and pessimistic scenarios for all markets as the impact of pandemic unfolds
  • Pre- as well as post-COVID-19 market estimates
  • Quarterly impact analysis and updates on market estimates

Gain instant access to 17,000+ market research reports by using

Technavio's SUBSCRIPTION platform

Related Report on Utilities Industries:

Global Rooftop Solar Market- The rooftop solar market is segmented by application (non-residential and residential), geography (APAC, Europe, North America, MEA, and South America), and key vendors. Click Here to Get an Exclusive Free Sample Report

Global Fuel Cell Market- The fuel cell market is segmented by product (PEMFC, PAFC, SOFC, and others), application (transport, stationary, and portable), and geography (APAC, Americas, and EMEA). Click Here to Get an Exclusive Free Sample Report

Major Three Residential Solar PV Systems Market Participants:

ABB Ltd.

ABB Ltd. operates the business through various segments such as Electrification, Industrial Automation, Motion, Robotics & Discrete Automation, and Corporate and Other. The company offers transmission and distribution of residential solar PV systems for both on-grid and off-grid applications.

Canadian Solar Inc.

Canadian Solar Inc. operates the business through various segments such as MSS, and Energy. The company offers solar panels and modules and residential solar power kits.

Hanwha Corp.

Hanwha Corp. operates the business through various segments such as Aerospace and mechatronics, Chemicals and materials, Solar energy, Financial services, Construction, and Leisure and lifestyle. The company offers Q cells such as.PLUS, Q.PEAK, Q.HOME, Q.HOME+, Q.POWER, Q.PRIME, and EPC.

If you purchase a report that is updated in the next 60 days, we will send you the new edition and data extract FREE! Get report snapshot here to get detailed market share analysis of market participants during COVID-19 lockdown: https://www.technavio.com/report/residential-solar-pv-systems-market-industry-analysis

Residential Solar PV Systems Market 2021-2025: Segmentation

The residential solar PV systems market is segmented as below:

  • Technology
    • Crystalline-silicon
    • Thin-film
  • Geography
    • APAC
    • Europe
    • North America
    • MEA
    • South America

The residential solar PV systems market is driven by increasing investments in renewable energy. In addition, other factors such as increasing adoption of microgrids are expected to trigger the residential solar PV systems market toward witnessing a CAGR of over 8% during the forecast period.

Get more insights about the global trends impacting the future of the residential solar PV systems market, Request Free Sample @ https://www.technavio.com/talk-to-us?report=IRTNTR46617

Market Drivers

Market Challenges

Market Trends

Vendor Landscape

  • Vendors covered
  • Vendor classification
  • Market positioning of vendors
  • Competitive scenario

About Us

Technavio is a leading global technology research and advisory company. Their research and analysis focuses on emerging market trends and provides actionable insights to help businesses identify market opportunities and develop effective strategies to optimize their market positions. With over 500 specialized analysts, Technavio’s report library consists of more than 17,000 reports and counting, covering 800 technologies, spanning across 50 countries. Their client base consists of enterprises of all sizes, including more than 100 Fortune 500 companies. This growing client base relies on Technavio’s comprehensive coverage, extensive research, and actionable market insights to identify opportunities in existing and potential markets and assess their competitive positions within changing market scenarios.


Contacts

Technavio Research
Jesse Maida
Media & Marketing Executive
US: +1 844 364 1100
UK: +44 203 893 3200
Email: This email address is being protected from spambots. You need JavaScript enabled to view it.
Website: www.technavio.com/

TULSA, Okla.--(BUSINESS WIRE)--NGL Energy Partners LP (NYSE: NGL) (“NGL”), through its wholly owned subsidiaries NGL Energy Operating LLC and NGL Energy Finance Corp., today announced that they intend to offer, subject to market and other conditions, $2.05 billion in aggregate principal amount of senior secured notes due 2026. NGL expects to use the net proceeds of the offering, together with borrowings under a new $500.0 million asset-based revolving credit facility (the “ABL Facility”), to (i) repay all outstanding borrowings under and terminate NGL’s existing revolving credit facility, (ii) repay all outstanding borrowings under and terminate NGL’s $250.0 million term credit agreement and (iii) to pay fees and expenses in connection therewith.


The notes will be offered and sold only to persons reasonably believed to be qualified institutional buyers in the United States pursuant to Rule 144A under the Securities Act of 1933, as amended (the “Securities Act”), and to persons, other than U.S. persons, outside of the United States pursuant to Regulation S under the Securities Act.

The offer and sale of the notes have not been registered under the Securities Act or any state securities laws and may not be offered or sold in the United States absent registration or an applicable exemption from the registration requirements of the Securities Act and applicable state laws. This press release shall not constitute an offer to sell or a solicitation of an offer to purchase the notes or any other securities, and shall not constitute an offer, solicitation or sale in any state or jurisdiction in which such an offer, solicitation or sale would be unlawful.

Forward Looking Statements

This press release includes “forward-looking statements.” All statements other than statements of historical facts included or incorporated herein may constitute forward-looking statements. Actual results could vary significantly from those expressed or implied in such statements and are subject to a number of risks and uncertainties. While NGL believes such forward-looking statements are reasonable, NGL cannot assure they will prove to be correct. The forward-looking statements involve risks and uncertainties that affect operations, financial performance, and other factors as discussed in filings with the Securities and Exchange Commission. Other factors that could impact any forward-looking statements are those risks described in NGL’s annual report on Form 10-K, quarterly reports on Form 10-Q, and other public filings. You are urged to carefully review and consider the cautionary statements and other disclosures made in those filings, specifically those under the heading “Risk Factors.” NGL undertakes no obligation to publicly update or revise any forward-looking statements except as required by law.

About NGL Energy Partners LP

NGL Energy Partners LP, a Delaware limited partnership, is a diversified midstream energy company that transports, stores, markets and provides other logistics services for crude oil, natural gas liquids and other products and transports, treats and disposes of produced water generated as part of the oil and natural gas production process.


Contacts

NGL Energy Partners LP
Trey Karlovich, 918.481.1119
Executive Vice President and Chief Financial Officer
This email address is being protected from spambots. You need JavaScript enabled to view it.
or
Linda Bridges, 918.481.1119
Senior Vice President – Finance and Treasurer
This email address is being protected from spambots. You need JavaScript enabled to view it.

DUBLIN--(BUSINESS WIRE)--The "United Arab Emirates Midstream Oil and Gas Industry Outlook to 2025" report has been added to ResearchAndMarkets.com's offering.


United Arab Emirates Midstream Oil and Gas Industry Outlook to 2025 - Market Outlook for Liquefied Natural Gas (LNG), Liquids Storage, Pipelines and Gas Processing is a comprehensive report on midstream oil and gas industry in United Arab Emirates. The report provides details such as name, type, operational status and operator for all active and planned (new build) LNG terminals, liquids storage terminals major trunk pipelines and gas processing plants in United Arab Emirates till 2025. Further, the report also offers recent developments and latest contracts awarded in the country's midstream sector, wherever available.

Scope

  • Updated information related to all active, planned and announced LNG terminals, oil storage terminals, trunk pipelines and gas processing plants in the country, including operator and equity details
  • Key mergers and acquisitions and asset transactions in the country's midstream oil and gas industry, where available
  • Latest developments, financial deals and awarded contracts related to midstream oil and gas industry in the country, wherever available

Reasons to Buy

  • Gain strong understanding of the country's midstream oil and gas industry
  • Facilitate decision making on the basis of strong historical and outlook of capacity/length data
  • Assess your competitor's major LNG terminals, oil storage terminals, trunk pipelines, and gas processing plants in the country
  • Analyze the latest developments, financial deals landscape and awarded contracts related to the country's midstream oil and gas industry

Key Topics Covered:

1. Table of Contents

1.1. List of Tables

1.2. List of Figures

2. Introduction

2.1. What is This Report About?

2.2. Market Definition

3. United Arab Emirates LNG Industry

3.1. United Arab Emirates LNG Industry, Liquefaction

3.1.1. United Arab Emirates LNG Industry, Liquefaction, Overview

3.1.2. United Arab Emirates LNG Industry, Total Liquefaction Capacity

3.2. United Arab Emirates LNG Industry, Liquefaction Capacity by Company

3.3. United Arab Emirates LNG Industry, Liquefaction Capacity by Terminal

3.4. United Arab Emirates LNG Industry, Asset Details

3.4.1. United Arab Emirates LNG Industry, Liquefaction Active Asset Details

3.5. United Arab Emirates LNG Industry, Regasification

3.5.1. United Arab Emirates LNG Industry, Regasification, Key Data

3.6. United Arab Emirates LNG Industry, Regasification, Overview

3.6.1. United Arab Emirates LNG Industry, Total Regasification Capacity

3.7. United Arab Emirates LNG Industry, Regasification Capacity by Major Companies

3.8. United Arab Emirates LNG Industry, Regasification Capacity by Terminal

3.9. United Arab Emirates LNG Industry, Asset Details

3.9.1. United Arab Emirates LNG Industry, Regasification Active Asset Details

3.9.2. United Arab Emirates LNG Industry, Regasification Planned Asset Details

4. United Arab Emirates Oil Storage Industry

4.1. United Arab Emirates Oil Storage Industry, Key Data

4.2. United Arab Emirates Oil Storage Industry, Overview

4.3. United Arab Emirates Oil Storage Industry, Storage Operations

4.3.1. United Arab Emirates Oil Storage Industry, Total Storage Capacity

4.4. United Arab Emirates Oil Storage Industry, Storage Capacity Share by Area

4.5. United Arab Emirates Oil Storage Industry, Storage Capacity by Major Companies

4.6. United Arab Emirates Oil Storage Industry, Storage Capacity by Terminal

4.7. United Arab Emirates Oil Storage Industry, Asset Details

4.7.1. United Arab Emirates Oil Storage Industry, Active Asset Details

4.7.2. United Arab Emirates Oil Storage Industry, Planned Asset Details

5. United Arab Emirates Oil and Gas Pipelines Industry

5.1. United Arab Emirates Oil Pipelines

5.1.1. United Arab Emirates Oil Pipelines, Key Data

5.1.2. United Arab Emirates Oil Pipelines, Overview

5.2. United Arab Emirates Oil and Gas Pipelines Industry, Crude Oil Pipeline Length by Major Companies

5.3. United Arab Emirates Oil and Gas Pipelines Industry, Crude Oil Pipelines

5.4. United Arab Emirates Oil and Gas Pipelines Industry, Petroleum Products Pipeline Length by Company

5.5. United Arab Emirates Oil and Gas Pipelines Industry, Petroleum Products Pipelines

5.6. United Arab Emirates Oil and Gas Pipelines Industry, Oil Pipelines Asset Details

5.6.1. United Arab Emirates Oil and Gas Pipelines Industry, Oil Pipelines Active Asset Details

5.6.2. United Arab Emirates Oil and Gas Pipelines Industry, Oil Pipelines Planned Asset Details

5.7. United Arab Emirates Gas Pipelines

5.7.1. United Arab Emirates Gas Pipelines, Key Data

5.7.2. United Arab Emirates Gas Pipelines, Overview

5.8. United Arab Emirates Oil and Gas Pipelines Industry, Natural Gas Pipeline Length by Major Companies

5.9. United Arab Emirates Oil and Gas Pipelines Industry, Natural Gas Pipelines

5.10. United Arab Emirates Oil and Gas Pipelines Industry, Gas Pipelines Asset Details

5.10.1. United Arab Emirates Oil and Gas Pipelines Industry, Gas Pipelines Active Asset Details

5.10.2. United Arab Emirates Oil and Gas Pipelines Industry, Gas Pipelines Planned Asset Details

6. United Arab Emirates Gas Processing Industry

6.1. United Arab Emirates Gas Processing Industry, Key Data

6.2. United Arab Emirates Gas Processing Industry, Overview

6.3. United Arab Emirates Gas Processing Industry, Gas Processing Capacity by Major Companies

6.4. United Arab Emirates Gas Processing Industry, Processing Plant number by Facility Type

6.5. United Arab Emirates Gas Processing Industry, Capacity Contribution of Various Provinces

6.6. United Arab Emirates Gas Processing Industry, Active Gas Processing Capacity

6.7. United Arab Emirates Gas Processing Industry, Planned Gas Processing Capacity

6.8. United Arab Emirates Gas Processing Industry, Asset Details

6.8.1. United Arab Emirates Gas Processing Industry, Active Asset Details

6.8.2. United Arab Emirates Gas Processing Industry, Planned Asset Details

7. Recent Contracts

7.1. Detailed Contract Summary

7.1.1. Awarded Contracts

8. Recent Developments

8.1. Other Significant Developments

8.2. New Contracts Announcements

9. Appendix

For more information about this report visit https://www.researchandmarkets.com/r/9saby2


Contacts

ResearchAndMarkets.com
Laura Wood, Senior Press Manager
This email address is being protected from spambots. You need JavaScript enabled to view it.

For E.S.T Office Hours Call 1-917-300-0470
For U.S./CAN Toll Free Call 1-800-526-8630
For GMT Office Hours Call +353-1-416-8900

  • With the addition of 107,000 square feet, Lightning eMotors now using 231,000 square feet of space at its Loveland, Colorado facility, with first right of acceptance for over 500,000 square feet of additional manufacturing space
  • New space to be used for manufacturing and development around advanced motorcoach electrification and fuel cell electric vehicles of all classes
  • Automation, CNC laser-cutting and powder-coating equipment added, accelerating production, reducing costs, and increasing reliability versus outsourcing
  • Expansion accelerates Lightning eMotors’ ability to deliver new and innovative products to customers, says CEO Tim Reeser

LOVELAND, Colo.--(BUSINESS WIRE)--Lightning eMotors (“Lightning eMotors” or the “Company”), a leading provider of commercial electric vehicles for fleets, today announced it is expanding to meet the growing demand for electric vehicles from commercial and government fleets.


Three and a half years ago, Lightning eMotors moved its headquarters, manufacturing, and research and development into the nearly one-million-square-foot campus that was formerly used by Hewlett-Packard/Agilent in southwest Loveland, Colorado. Early last year, the company took over the entire building on the campus located at Southwest 14th Street and Taft Avenue, expanding its square footage from 45,000 to 124,000. Now it is adding another 107,000 square feet in an adjacent building, for a total of 231,000 square feet of space for its operations. Lightning has first right of acceptance on more than 500,000 square feet of additional manufacturing space if it determines customer demand requires the additional space.

“The new space will initially be used for our development efforts around advanced motorcoach electrification and fuel cell electric vehicles of all classes,” said Tim Reeser, CEO of Lightning eMotors. “The second phase will support additional production capacity, important for ensuring we can support our 3,000 vehicle production plans for 2022.”

“The additional space helps us to accommodate the increased number of electric van and truck projects that are contracted for 2021, as well as our work on charging infrastructure for fleets and electric motorcoach repowers,” said Keith Lehmeier, director of research and development for Lightning eMotors. “Importantly, the expansion will enable our team to work both faster and smarter, with more testing equipment and automation. As we hire engineers, it gives us room to have top-notch facilities for them to work.”

During the summer and fall of 2020, the company ramped up production by more than 600 percent and continues to increase production as its orders increase. In addition, the company recently doubled its workforce and expects to double it again this year.

“Lightning eMotors is a strong example of the economic impact of sustainable, environmentally friendly businesses,” said Betsy Markey, executive director of the Colorado Office of Economic Development and International Trade. “Renewable energy is a pillar of the Polis administration because caring for the environment today creates enduring business models and high-quality jobs. It’s good for business and good for Colorado. We congratulate Lightning eMotors for this important milestone in their growth.”

As a part of the expansion, Lightning eMotors has added technology and automation, including CNC laser cutting and powder-coating equipment. “These additions to our in-house production capabilities allow us to produce all of our own framework in-house, better enabling us to control quality, accelerate development and production, and reduce costs,” Lehmeier said. “Combined, the expansion and new equipment ensures that we’re ready for continually increasing demand and the growth of the business.”

Lightning eMotors offers a full range of medium-duty battery-electric and fuel cell commercial electric vehicles, as well as electric motorcoaches for North American vehicle operators. In addition to its commercial EV business, the company offers charging technologies and energy as a service (EaaS) to commercial and government fleets via its Lightning Energy division. Lightning Energy designs, installs, services and manages charging solutions, providing fleets with an easy entry and full support to electrify and help stakeholders to achieve their sustainability goals. For information about Lightning Energy, visit https://lightningenergy.biz.

About Lightning eMotors

Lightning eMotors provides complete electrification solutions for commercial fleets – from Class 3 cargo and passenger vans to Class 6 work trucks, Class 7 city buses, and Class 8 motor coaches. The Lightning eMotors team designs, engineers, customizes, and manufactures electric vehicles to support the wide array of fleet customer needs, with a full suite of telematics, analytics, and charging solutions to simplify the buying and ownership experience and maximize uptime and energy efficiency.

For more information, please visit https://lightningemotors.com and follow us at @LightningeMtrs on Twitter, Lightning eMotors on LinkedIn and @LightningeMotors on Instagram.


Contacts

News Media Contact:
This email address is being protected from spambots. You need JavaScript enabled to view it.

Investors:
This email address is being protected from spambots. You need JavaScript enabled to view it.

DUBLIN--(BUSINESS WIRE)--The "Russia Midstream Oil and Gas Industry Outlook to 2025" report has been added to ResearchAndMarkets.com's offering.


Russia Midstream Oil and Gas Industry Outlook to 2025 - Market Outlook for Liquefied Natural Gas (LNG), Liquids Storage, Pipelines, Underground Gas Storage and Gas Processing is a comprehensive report on midstream oil and gas industry in Russia.

The report provides details such as name, type, operational status and operator for all active and planned (new build) LNG terminals, liquids storage terminals major trunk pipelines, underground gas storage sites and gas processing plants in Russia till 2025. Further, the report also offers recent developments, financial deals as well as latest contracts awarded in the country's midstream sector, wherever available.

Scope

  • Updated information related to all active, planned and announced LNG terminals, oil storage terminals, trunk pipelines, underground gas storage and gas processing plants in the country, including operator and equity details
  • Key mergers and acquisitions and asset transactions in the country's midstream oil and gas industry, where available
  • Latest developments, financial deals and awarded contracts related to midstream oil and gas industry in the country, wherever available

Reasons to Buy

  • Facilitate decision making on the basis of strong historical and outlook of capacity/length data
  • Assess your competitor's major LNG terminals, oil storage terminals, trunk pipelines, underground gas storage sites and gas processing plants in the country
  • Analyze the latest developments, financial deals landscape and awarded contracts related to the country's midstream oil and gas industry

Key Topics Covered:

1. Tables & Figures

2. Introduction

3. Russia LNG Industry

3.1. Russia LNG Industry, Liquefaction

3.1.1. Russia LNG Industry, Liquefaction, Key Data

3.2. Russia LNG Industry, Liquefaction, Overview

3.2.1. Russia LNG Industry, Total Liquefaction Capacity

3.3. Russia LNG Industry, Liquefaction Capacity by Major Companies

3.4. Russia LNG Industry, Liquefaction Capacity by Terminal

3.5. Russia LNG Industry, Liquefaction Asset Details

3.5.1. Russia LNG Industry, Liquefaction Active Asset Details

3.5.2. Russia LNG Industry, Liquefaction Planned Asset Details

3.6. Russia LNG Industry, Regasification

3.6.1. Russia LNG Industry, Regasification, Overview

3.6.2. Russia LNG Industry, Total Regasification Capacity

3.7. Russia LNG Industry, Regasification Capacity by Company

3.8. Russia LNG Industry, Regasification Capacity by Terminal

3.9. Russia LNG Industry, Regasification Asset Details

3.9.1. Russia LNG Industry, Regasification Planned Asset Details

4. Russia Oil Storage Industry

4.1. Russia Oil Storage Industry, Key Data

4.2. Russia Oil Storage Industry, Overview

4.3. Russia Oil Storage Industry, Storage Operations

4.3.1. Russia Oil Storage Industry, Total Storage Capacity

4.3.2. Russia Oil Storage Industry, Storage Capacity Share by Area

4.4. Russia Oil Storage Industry, Storage Capacity by Major Companies

4.5. Russia Oil Storage Industry, Storage Capacity by Terminal

4.6. Russia Oil Storage Industry, Asset Details

4.6.1. Russia Oil Storage Industry, Active Asset Details

4.6.2. Russia Oil Storage Industry, Planned Asset Details

5. Russia Oil and Gas Pipelines Industry

5.1. Russia Oil Pipelines

5.1.1. Russia Oil Pipelines, Key Data

5.2. Russia Oil Pipelines, Overview

5.3. Russia Oil and Gas Pipelines Industry, Crude Oil Pipeline Length by Major Companies

5.4. Russia Oil and Gas Pipelines Industry, Crude Oil Pipelines

5.5. Russia Oil and Gas Pipelines Industry, Petroleum Products Pipeline Length by Company

5.6. Russia Oil and Gas Pipelines Industry, Petroleum Products Pipelines

5.7. Russia Oil and Gas Pipelines Industry, NGL Pipeline Length by Company

5.8. Russia Oil and Gas Pipelines Industry, NGL Pipelines

5.9. Russia Oil and Gas Pipelines Industry, Oil Pipelines Asset Details

5.9.1. Russia Oil and Gas Pipelines Industry, Oil Pipelines Active Asset Details

5.9.2. Russia Oil and Gas Pipelines Industry, Oil Pipelines Planned Asset Details

5.10. Russia Gas Pipelines, Key Data

5.10.1. Russia Gas Pipelines, Overview

5.11. Russia Oil and Gas Pipelines Industry, Natural Gas Pipeline Length by Major Companies

5.12. Russia Oil and Gas Pipelines Industry, Natural Gas Pipelines

5.13. Russia Oil and Gas Pipelines Industry, Gas Pipelines Asset Details

5.13.1. Russia Oil and Gas Pipelines Industry, Gas Pipelines Active Asset Details

5.13.2. Russia Oil and Gas Pipelines Industry, Gas Pipelines Planned Asset Details

6. Russia Underground Gas Storage Industry

6.1. Russia Underground Gas Storage Industry, Key Data

6.2. Russia Underground Gas Storage Industry, Overview

6.3. Russia Underground Gas Storage Industry, Storage Capacity by Company

6.4. Russia Underground Gas Storage Industry, Storage Capacity by Area

6.5. Russia Underground Gas Storage Industry, Storage Capacity by Site

6.5.1. Russia Underground Gas Storage Industry, Storage Capacity by Active Sites

6.5.2. Russia Underground Gas Storage Industry, Storage Capacity by Planned Sites

6.6. Russia Underground Gas Storage Industry, Asset Details

6.6.1. Russia Underground Gas Storage Industry, Active Asset Details

6.6.2. Russia Underground Gas Storage Industry, Planned Asset Details

7. Russia Gas Processing Industry

7.1. Russia Gas Processing Industry, Key Data

7.2. Russia Gas Processing Industry, Overview

7.3. Russia Gas Processing Industry, Gas Processing Capacity by Major Companies

7.4. Russia Gas Processing Industry, Processing Plant Number by Plant Type

7.5. Russia Gas Processing Industry, Capacity Contribution of Various Provinces

7.6. Russia Gas Processing Industry, Active Gas Processing Capacity

7.7. Russia Gas Processing Industry, Planned Gas Processing Capacity

7.8. Russia Gas Processing Industry, Asset Details

7.8.1. Russia Gas Processing Industry, Active Asset Details

7.8.2. Russia Gas Processing Industry, Planned Asset Details

8. Recent Contracts

9. Financial Deal Landscape

9.1. Detailed Deal Summary

9.1.1. Acquisition

9.1.2. Debt Offerings

9.1.3. Partnerships

9.1.4. Asset Transactions

10. Recent Developments

11. Appendix

For more information about this report visit https://www.researchandmarkets.com/r/cyz3qg


Contacts

ResearchAndMarkets.com
Laura Wood, Senior Press Manager
This email address is being protected from spambots. You need JavaScript enabled to view it.

For E.S.T Office Hours Call 1-917-300-0470
For U.S./CAN Toll Free Call 1-800-526-8630
For GMT Office Hours Call +353-1-416-8900

CLEARWATER, Fla.--(BUSINESS WIRE)--MarineMax, Inc. (NYSE: HZO), the world’s largest recreational boat and yacht retailer, today announced that the Company will hold a webcast to review its first quarter of fiscal 2021 results on Thursday, January 28, 2021, at 10:00 a.m. Eastern Time.

To access the webcast, please visit the investor relations section of the Company's web site: http://www.marinemax.com. The on-line replay will be available for a limited time beginning within one hour of the conclusion of the call.

The Company will release its first quarter fiscal 2021 financial results prior to the market open on Thursday, January 28, 2021.

During the call, it is possible that the Company may make public disclosure of material nonpublic information and may make forward-looking statements regarding the Company's business, operations, and financial condition.

About MarineMax

MarineMax is the world’s largest recreational boat and yacht retailer, selling new and used recreational boats, yachts and related marine products and services, as well as providing yacht brokerage and charter services. MarineMax has over 100 locations worldwide, including 77 retail dealership locations, including 30 marinas or storage operations. Through Fraser Yachts and Northrop and Johnson, it is also the largest super-yacht services provider, operating 27 locations across the globe. MarineMax provides finance and insurance services through wholly owned subsidiaries and operates MarineMax Vacations in Tortola, British Virgin Islands. The Company also operates Boatyard, a pioneering digital platform that enhances the boating experience. MarineMax is a New York Stock Exchange-listed company (NYSE:HZO). For more information, please visit www.marinemax.com.


Contacts

Michael H. McLamb
Chief Financial Officer
727-531-1700

Media:
Abbey Heimensen
MarineMax, Inc.

Investors:
Brad Cohen or Dawn Francfort
ICR, LLC
This email address is being protected from spambots. You need JavaScript enabled to view it.

DUBLIN--(BUSINESS WIRE)--The "Iran Midstream Oil and Gas Industry Outlook to 2025" report has been added to ResearchAndMarkets.com's offering.


Summary

Iran Midstream Oil and Gas Industry Outlook to 2025 - Market Outlook for Liquefied Natural Gas (LNG), Liquids Storage, Pipelines, Underground Gas Storage and Gas Processing is a comprehensive report on midstream oil and gas industry in Iran. The report provides details such as name, type, operational status and operator for all active and planned (new build) LNG terminals, liquids storage terminals major trunk pipelines, underground gas storage sites and gas processing plants in Iran till 2025. Further, the report also offers recent developments, financial deals as well as latest contracts awarded in the country's midstream sector, wherever available.

Scope

  • Updated information related to all active, planned and announced LNG terminals, oil storage terminals, trunk pipelines, underground gas storage and gas processing plants in the country, including operator and equity details
  • Key mergers and acquisitions and asset transactions in the country's midstream oil and gas industry, where available
  • Latest developments, financial deals and awarded contracts related to midstream oil and gas industry in the country, wherever available

Reasons to Buy

  • Gain strong understanding of the country's midstream oil and gas industry
  • Facilitate decision making on the basis of strong historical and outlook of capacity/length data
  • Assess your competitor's major LNG terminals, oil storage terminals, trunk pipelines, underground gas storage sites and gas processing plants in the country
  • Analyze the latest developments, financial deals landscape and awarded contracts related to the country's midstream oil and gas industry

Key Topics Covered:

1. Tables & Figures

2. Introduction

3. Iran LNG Industry

3.1. Iran LNG Industry, Liquefaction

3.1.1. Iran LNG Industry, Liquefaction, Overview

3.1.2. Iran LNG Industry, Total Liquefaction Capacity

3.2. Iran LNG Industry, Liquefaction, Capacity by Company

3.3. Iran LNG Industry, Liquefaction, Capacity by Terminal

3.4. Iran LNG Industry, Liquefaction Asset Details

3.4.1. Iran LNG Industry, Liquefaction Planned Asset Details

4. Iran Oil Storage Industry

4.1. Iran Oil Storage Industry, Key Data

4.2. Iran Oil Storage Industry, Overview

4.3. Iran Oil Storage Industry, Storage Operations

4.3.1. Iran Oil Storage Industry, Total Storage Capacity

4.4. Iran Oil Storage Industry, Storage Capacity Share by Area

4.5. Iran Oil Storage Industry, Storage Capacity by Major Companies

4.6. Iran Oil Storage Industry, Storage Capacity by Terminal

4.7. Iran Oil Storage Industry, Asset Details

4.7.1. Iran Oil Storage Industry, Active Asset Details

4.7.2. Iran Oil Storage Industry, Planned Asset Details

5. Iran Oil and Gas Pipelines Industry

5.1. Iran Oil Pipelines

5.1.1. Iran Oil Pipelines, Key Data

5.2. Iran Oil Pipelines, Overview

5.3. Iran Oil and Gas Pipelines Industry, Crude Oil Pipeline Length by Major Companies

5.4. Iran Oil and Gas Pipelines Industry, Crude Oil Pipelines

5.5. Iran Oil and Gas Pipelines Industry, Petroleum Products Pipeline Length by Major Companies

5.6. Iran Oil and Gas Pipelines Industry, Petroleum Products Pipelines

5.7. Iran Oil and Gas Pipelines Industry, Oil Pipelines Asset Details

5.7.1. Iran Oil and Gas Pipelines Industry, Oil Pipelines Active Asset Details

5.7.2. Iran Oil and Gas Pipelines Industry, Oil Pipelines Planned Asset Details

5.8. Iran Gas Pipelines

5.8.1. Iran Gas Pipelines, Key Data

5.8.2. Iran Gas Pipelines, Overview

5.9. Iran Oil and Gas Pipelines Industry, Natural Gas Pipeline Length by Major Companies

5.10. Iran Oil and Gas Pipelines Industry, Natural Gas Pipelines

5.11. Iran Oil and Gas Pipelines Industry, Gas Pipelines Asset Details

5.11.1. Iran Oil and Gas Pipelines Industry, Gas Pipelines Active Asset Details

5.11.2. Iran Oil and Gas Pipelines Industry, Gas Pipelines Planned Asset Details

6. Iran Underground Gas Storage Industry

6.1. Iran Underground Gas Storage Industry, Key Data

6.2. Iran Underground Gas Storage Industry, Overview

6.3. Iran Underground Gas Storage Industry, Storage Capacity by Company

6.4. Iran Underground Gas Storage Industry, Storage Capacity by Area

6.5. Iran Underground Gas Storage Industry, Storage Capacity by Site

6.5.1. Iran Underground Gas Storage Industry, Storage Capacity by Active Sites

6.5.2. Iran Underground Gas Storage Industry, Storage Capacity by Planned Sites

6.6. Iran Underground Gas Storage Industry, Asset Details

6.6.1. Iran Underground Gas Storage Industry, Active Asset Details

6.6.2. Iran Underground Gas Storage Industry, Planned Asset Details

7. Iran Gas Processing Industry

7.1. Iran Gas Processing Industry, Key Data

7.2. Iran Gas Processing Industry, Overview

7.3. Iran Gas Processing Industry, Gas Processing Capacity by Major Companies

7.4. Iran Gas Processing Industry, Processing Plant Number by Plant Type

7.5. Iran Gas Processing Industry, Capacity Contribution of Various Provinces

7.6. Iran Gas Processing Industry, Active Gas Processing Capacity

7.7. Iran Gas Processing Industry, Planned Gas Processing Capacity

7.8. Iran Gas Processing Industry, Asset Details

7.8.1. Iran Gas Processing Industry, Active Asset Details

7.8.2. Iran Gas Processing Industry, Planned Asset Details

8. Recent Contracts

8.1. Detailed Contract Summary

8.1.1. Awarded Contracts

9. Financial Deals Landscape

9.1. Detailed Deal Summary

9.1.1. Acquisition

9.1.2. Debt Offerings

10. Recent Developments

10.1. Other Significant Developments

10.2. New Contracts Announcements

11. Appendix

For more information about this report visit https://www.researchandmarkets.com/r/bdmpu9


Contacts

ResearchAndMarkets.com
Laura Wood, Senior Press Manager
This email address is being protected from spambots. You need JavaScript enabled to view it.

For E.S.T Office Hours Call 1-917-300-0470
For U.S./CAN Toll Free Call 1-800-526-8630
For GMT Office Hours Call +353-1-416-8900

Shared Commitments to Sustainability, Energy Efficiency and Health to Drive Human-Centric Lighting Adoption and Growth

SOLON, Ohio--(BUSINESS WIRE)--#CWLighting--Energy Focus, Inc. (NASDAQ:EFOI), a leader in sustainable and human-centric lighting (“HCL”) technologies, has signed on CW Lighting and Associates, LLC, Flex Green Lighting, and LEC and Company as new sales agencies. They will market and sell Energy Focus’ full range of LED lighting and EnFocus™ lighting control solutions as well as its recently launched UV-C Disinfection solutions to its commercial and industrial customers in the designated regions.

CW Lighting and Associates, LLC, founded in 1983 and based in Houston, Texas is now a sales agent of Energy Focus, Inc. for commercial and industrial customers. “CW is excited to be partnering with Energy Focus. Energy Focus has a unique range of innovative products that complement our line card and we are looking forward to a very successful partnership as technologically advanced, human-centric lighting turns mainstream,” said Michelle Holman, Managing Partner of CW Lighting and Associates.

Flex Green Lighting, the energy and lighting division of a 35-year electrical distribution company based in Indianapolis, Indiana is now the sales agent for Energy Focus, Inc. for the majority of the state of Indiana. Rob Annee, Managing Partner of Flex Green, stated, “For years we have strived to align Flex Green with only the top-quality LED lighting manufacturers in the United States. In the past we struggled in dealing with less than superior quality manufacturers, which cost us significantly in warranty issues over time. Flex Green, as an organization, has decided to only partner with the industry’s premier LED manufacturers. Energy Focus pairs perfectly with Flex Green’s industry leading quality offerings. We have installed Energy Focus’ products for years without a single warranty claim. We look forward to now bringing Energy Focus’ LED solutions directly to our electrical contractor partners, as well as our long-term direct end-user customers.”

LEC and Company, based in St. Louis, Missouri for over 50 years has become the sales agent for Energy Focus for the state of Missouri and parts of southern Illinois. “We came on board because of the depth of Energy Focus’ commercial and industrial product line and strong demand for their emergency backup-battery integrated T8 lamps, RedCap® from our customer base,” said Don Calcaterra, Vice President of LEC and Company.

“Energy Focus is very excited to engage and partner with these new agencies to enter additional markets,” said Wanda Adams, Vice President of Business Development for Commercial Lighting for Energy Focus. “These agencies’ dedicated regional coverages and stellar growth records coupled with their reputation and commitment to sustainability, energy efficiency and human health make them the perfect partners for us. We look forward to developing long and mutually beneficial relationships with the teams at CW Lighting, Flex Green, and LEC to bring our growing line of leading LED, HCL and UV-C products to these new territories.”

About Energy Focus

Energy Focus is an industry-leading innovator of sustainable and human-centric lighting technologies and solutions. As the creator of the first flicker-free LED lamps, Energy Focus develops high quality LED lighting products that provide extensive energy and maintenance savings, as well as aesthetics, safety, health and sustainability benefits over conventional lighting. Our EnFocus™ lighting control platform enables existing and new buildings to provide quality, convenient and affordable, dimmable and color-tunable, circadian and human-centric lighting capabilities. Our patent-pending UV-C Disinfection (UVCD) technologies and products, announced in October 2020, aim to provide effective, reliable and affordable UVCD solutions for buildings, facilities and homes. Energy Focus’ customers include U.S. and foreign navies, U.S. federal, state and local governments, healthcare and educational institutions, as well as Fortune 500 companies. Since 2007, Energy Focus has installed approximately 900,000 lighting products across the U.S. Navy fleet, including tubular LEDs, waterline security lights, explosion-proof globes and berth lights, saving more than 5,000,000 gallons of fuel and 300,000 man-hours in lighting maintenance annually. Energy Focus is headquartered in Solon, Ohio. For more information, visit our website at www.energyfocus.com.

About CW Lighting and Associates LLC

CW Lighting is a lighting manufacturer’s representative servicing the Houston area. We pride ourselves on offering the best customer experience for our clients whether it be project management, quotations or specification work. Whatever your lighting need, we want to be your trusted source.

About Flex Green Lighting

Flex Green Lighting is a lighting consulting and distribution company of LED and High Efficiency Lighting products. Flex Green Lighting is an affiliate of FlexPac, a 30-year-old, independently owned company based out of Zionsville, Indiana. Our goal is to evaluate your current lighting and create an analysis to show all the benefits of choosing an investment in your lighting to improve sustainability. We can show that highly efficient lighting is an investment, not just a purchase, which can save up to 75% in electricity savings due to lighting. We can also improve the amount of light output and color rendering of the environment for better productivity and product appearance. Finally, there are several environmental benefits of using a Green product and energy reducing product.

About LEC and Company

LEC and Company has been a constant source of lighting information in the St. Louis market for well over 50 years. Bruce Eason, Don Calcaterra, and Tom Mispagel have brought together a dynamic sales team to service the St. Louis market.

LEC and Company is a lighting and controls manufacturer representative responsible for marketing and selling our manufacturers' products throughout our territory – Eastern Missouri and Southern Illinois.


Contacts

DGI Comm
This email address is being protected from spambots. You need JavaScript enabled to view it.

212-825-3210

CANONSBURG, Pa.--(BUSINESS WIRE)--#ETRN--Equitrans Midstream Corporation (NYSE: ETRN) will release its fourth quarter and full-year 2020 earnings on Tuesday, February 23, 2021, and will also host a conference call with analysts and investors at 10:30 am (ET). A brief Q&A session for ETRN security analysts will immediately follow the results discussion.


Call Access: All participants must pre-register online, in advance of the call. Upon completion, registered participants will receive a confirmation email that includes instructions for accessing the call, as well as a unique registration ID and passcode. Please pre-register using the appropriate online registration links below:

Security Analysts :: Audio Registration
Your email confirmation will contain dial-in information, along with your unique ID and passcode.

All Other Participants :: Webcast Registration
Your email confirmation will contain the webcast link, along with your unique ID and passcode.

An updated investor presentation will be available on ETRN’s Investor Relations website the day of the call.

Call Replay: For 14 days following the call, an audio replay will be available at (800) 585-8367 or (416) 621-4642. Conference ID: 4233629

About Equitrans Midstream Corporation

Equitrans Midstream Corporation (ETRN) has a premier asset footprint in the Appalachian Basin and, as the parent company of EQM Midstream Partners, is one of the largest natural gas gatherers in the United States. Through its strategically located assets in the Marcellus and Utica regions, ETRN has an operational focus on gas transmission and storage systems, gas gathering systems, and water services that support natural gas development and production across the Basin. With a rich 135-year history in the energy industry, ETRN was launched as a standalone company in 2018 with the vision to be the premier midstream services provider in North America. ETRN is helping to meet America’s growing need for clean-burning energy, while also providing a rewarding workplace and enriching the communities where its employees live and work.

For more information on Equitrans Midstream Corporation, visit www.equitransmidstream.com; and to learn more about our environmental, social, and governance practices visit ETRN Sustainability Reporting.

Source: Equitrans Midstream Corporation


Contacts

Analyst/Investor inquiries:
Nate Tetlow – Vice President, Corporate Development and Investor Relations
412-553-5834
This email address is being protected from spambots. You need JavaScript enabled to view it.

Media inquiries:
Natalie A. Cox – Communications and Corporate Affairs
412-395-3941
This email address is being protected from spambots. You need JavaScript enabled to view it.

SAN FRANCISCO--(BUSINESS WIRE)--Mapbox just updated the entire world with fresh satellite imagery, totaling 135,000,000 km² of satellite imagery from Maxar Technologies (NYSE:MAXR) (TSX:MAXR), the leader in Earth Intelligence and Space Infrastructure. The new data is from Maxar’s WorldView satellites — the most advanced, highest-resolution Earth observation instruments of their kind. The high-resolution imagery includes beautiful colors and textures, making it great for finding landmarks during a run on Strava, optimizing delivery times on Straightaway by zooming in on the last 100 feet, seeing snow storms forming along the coastlines in British Columbia with The Weather app, visualizing the landscape while reading National Geographic, and even seeing a real-time heatmap of what’s happening in a city on Snapchat.


“The world is beautiful, which is why we are working with Maxar to deliver its most accurate representation to our customers. Maxar builds excellent satellites, which are producing the highest quality imagery available today,” said Eric Gundersen, Mapbox CEO. “By incorporating the high-resolution satellite imagery, we are able to offer 3D maps that are far more advanced and detailed than anything else. The maps look stunning!”

This imagery, combined with the recent launch of Mapbox 3D, is the canvas for creating totally custom maps for the web and mobile. Now all maps are in 3D: the camera’s view of the map is controlled through the newly launched Camera API, and the sun’s position is simulated based on geographic location and time of day.

“We’re excited to continue our long partnership with Mapbox,” said Dan Jablonsky, Maxar CEO. “With the integration of Vivid Basic into their platform, Mapbox continues to raise the bar for providing end users with beautiful and accurate maps. When our next-generation WorldView Legion satellites launch, we will significantly expand our collection capacity supporting 3D model generation for the most accurate and up to date foundation data for mapping products."

The combination of Maxar’s image quality, volume, and recency — together with the launch of Mapbox 3D — transforms the interactive map experience. This imagery lets you read runway markings, count cars and shipping containers, and see inside buildings under construction. To enable the realistic views this new imagery offers, Mapbox has released new APIs to deliver greater controls for developers:

Camera API: The Camera API is the free form low-level API for controlling the camera and its view of the map. This increases the map’s maximum pitch from 60 to 85 degrees. This provides access to the low-level camera code for developers to fine-tune details where the map can be tightly coordinated with other UI elements, transitioning smoothly and precisely, framing the right content in the viewport.

High Performance DEM (Digital Elevation Model): Terrain tile sizes are now reduced by 50% on average compared to the legacy terrain-rgb data, corresponding to a 35% improvement in hillshade layer rendering. Improved map load by 30% on average, and in some styles more than 50%, through improved prioritization of resource loading and task distribution.

Sky API: The new Sky API, allows the map to simulate the sun’s position based on geographic location and time of day. Gradient sky layers use color ramps, starting at a distance of 0 from the sky center, and 1 at the sky’s farthest extent. Here the fading is set between 0.8 and 1 to ramp within the visible range.

About Mapbox

Mapbox is a mapping and location cloud platform for developers that provides the building blocks (SDKs and APIs) for real time location awareness into automobiles and applications.

The Mapbox platform creates a feedback cycle, where AI-powered data pipeline processes +300 million miles of anonymized and aggregated live road telemetry data daily — allowing Mapbox to continuously update the map everywhere in the world. The cloud platform shares this live map with developers via its scalable mapping software components (maps, navigation, search) for mobile and web applications, logistics and dispatching, and in-car automotive navigation.

Founded by Eric Gundersen in 2010 in a garage space in Washington, D.C., Mapbox now has roughly 700 million monthly active users touching its maps, a global workforce of 520 employees, and its services power industry leaders, including CNN, General Electric, IBM, Instacart, Lonely Planet, Mastercard, Snapchat, Tableau, and The Weather Channel. Learn more at Mapbox.com

About Maxar

Maxar is a trusted partner and innovator in Earth Intelligence and Space Infrastructure. We deliver disruptive value to government and commercial customers to help them monitor, understand and navigate our changing planet; deliver global broadband communications; and explore and advance the use of space. Our unique approach combines decades of deep mission understanding and a proven commercial and defense foundation to deploy solutions and deliver insights with unrivaled speed, scale and cost effectiveness. Maxar’s more than 4,300 employees in more than 20 global locations are inspired to harness the potential of space to help our customers create a better world. Maxar trades on the New York Stock Exchange and Toronto Stock Exchange as MAXR. For more information, visit www.maxar.com.

Forward-Looking Statements

This release may contain certain “forward-looking statements” or “forward-looking information” under applicable securities laws. Forward-looking terms such as “may,” “will,” “could,” “should,” “would,” “plan,” “potential,” “intend,” “anticipate,” “project,” “target,” “believe,” “plan,” “outlook,” “estimate,” “guidance” or “expect” and other words, terms and phrases of similar nature are often intended to identify forward-looking statements, although not all forward-looking statements contain these identifying words. Such forward-looking statements include, but are not limited to, statements concerning the intent to exercise the call option with respect to Vricon, the completion and timing of the consummation of the acquisition of Vricon, the Company’s plans, objectives, expectations and intentions and other statements that are not historical or current fact. Forward-looking statements are based on certain key expectations and assumptions made by the Company. Although management of the Company believes that the expectations and assumptions on which such forward-looking statements are based are reasonable, undue reliance should not be placed on the forward-looking statements because the Company can give no assurance that they will prove to be correct.

The risks that could cause actual results to differ materially from current expectations include, but are not limited to those Risk Factors set forth in our Annual Report on Form 10-K and Quarterly Reports on Form 10-Q, which are available online under the Company’s EDGAR profile at www.sec.gov or on the Company’s website at www.maxar.com, as well as the Company’s continuous disclosure materials filed from time to time with Canadian securities regulatory authorities, which are available online under the Company’s SEDAR profile at www.sedar.com or on the Company’s website at www.maxar.com. The risk factors detailed in the foregoing are not intended to be exhaustive and there may be other key risks that are not identified that are not presently known to the Company or that the Company currently deems immaterial. These risks and uncertainties are amplified by the global COVID-19 pandemic, which has caused and will continue to cause significant challenges, instability and uncertainty.

The forward-looking statements contained in this release are expressly qualified in their entirety by the foregoing cautionary statements. All such forward-looking statements are based upon data available as of the date of this release or other specified date and speak only as of such date. The Company disclaims any intention or obligation to update or revise any forward-looking statements herein as a result of new information, future events or otherwise, other than as may be required under applicable securities law.


Contacts

MEDIA CONTACT
Dave Smolensky
This email address is being protected from spambots. You need JavaScript enabled to view it.
847-525-8412

DUBLIN--(BUSINESS WIRE)--The "Oil & Gas Industry in India: Insights into Human Capital & Locations 2020" report has been added to ResearchAndMarkets.com's offering.


The most comprehensive report on the Oil & Gas industry, which covers the various sub-sectors in great detail. The workforce insights and compensation benchmarking will provide unparalleled insights across all business functions and seniority levels.

The objective of this report is to provide executives from the Oil & Gas industry anywhere in the globe, very relevant information which will help them:

  • Quantify cost and skill advantages in human resources that India offers
  • Select the right manufacturing destination within India based on their individual context
  • Obtain human resources and related data for business planning

This report has been created with a singular focus in mind - to help decision makers obtain the right set of data points and information to make decisions regarding locations and human resources pertaining to the Oil & Gas industry in India.

Key Topics Covered

1. Location Intelligence

  • Geographical Inputs
  • Developmental Parameters
  • Industrial Ecosystem
  • Co-located Industries
  • Global Companies Manufacturing in India

2. Workforce Insights & Compensation Benchmarking

  • Pyramid, Education & Salaries

3. Industry Insights

  • Availability of White-collar Workforce in Each Industry
  • Availability of Skills and Competencies
  • Workforce Intelligence
  • Factors Affecting Migration Preferences
  • Factors Affecting Job Changes

Companies Mentioned

  • Bharat Petroleum
  • Indian Oil Corporation Limited
  • Adani Wilmar
  • Reliance Industries
  • ONGC
  • GAIL
  • Chennai Petroleum Corporation Ltd.
  • Gulf Oil Lubricants
  • Biomax Fuels
  • Castrol
  • Numaligarh Refinery Limited
  • Shell
  • ExxonMobil

For more information about this report visit https://www.researchandmarkets.com/r/d7f2j6


Contacts

ResearchAndMarkets.com
Laura Wood, Senior Press Manager
This email address is being protected from spambots. You need JavaScript enabled to view it.

For E.S.T Office Hours Call 1-917-300-0470
For U.S./CAN Toll Free Call 1-800-526-8630
For GMT Office Hours Call +353-1-416-8900

Hiring represents an investment to improve the focus on customer experience and growth


CAMPBELL, Calif.--(BUSINESS WIRE)--Tigo Energy, Inc., the worldwide leader in Flex-MLPE (Module Level Power Electronics) today announced that Cathal McCarthy has joined at its new VP of Customer Success. Mr. McCarthy brings more than 25 years of experience building and scaling customer success organizations to the Tigo Executive Team.

Mr. McCarthy has enhanced the customer experience at multiple high growth technology companies during his career. He spent 16 years at Apple, leading the Direct Sales and Customer Support for its online, and retail organizations across 40 countries. At eBay, as VP Worldwide Customer Experience, he helped restructure the Customer Support organization. Most recently, he served as COO with XSELL Technologies an AI/ML company based out of Chicago, Illinois.

“Cathal has helped companies large and small scale their Customer Success organizations to better serve customers as they expand rapidly,” stated Zvi Alon, Chairman and CEO of Tigo. “His skills and experience are an excellent match for the phase of growth that Tigo is experiencing.”

Mr. McCarthy will oversee the team that supports Tigo’s extensive installed base, which includes tens of thousands of sites in more than one hundred countries. Tigo continues to add key members to its team to keep pace with the company’s rapid growth.

“What the Tigo team has been able to accomplish around the world is extremely impressive,“ stated Mr. McCarthy. “I look forward to accelerating the growth of our business and enabling more customers to adopt solar.”

Mr. McCarthy has also served as an advisor to multiple early to late-stage startups and public companies as they enter key inflection points in their growth cycle. He is based in Silicon Valley, California where Tigo is headquartered.

About Tigo

Tigo is the worldwide leader in flexible module level power electronics (MLPE) with innovative solutions that significantly enhance safety, increase energy production, and decrease operating costs of photovoltaic (PV) systems. Tigo’s TS4 platform maximizes the benefit of PV systems and provides customers with the most scalable, versatile, and reliable MLPE solution available. Tigo was founded in Silicon Valley in 2007 to accelerate the adoption of solar energy worldwide. Tigo systems operate on 7 continents and produce gigawatt hours of reliable, clean, affordable and safe solar energy daily. Tigo's global team is dedicated to making the best MLPE on earth so more people can enjoy the benefits of solar. Visit us at www.tigoenergy.com.


Contacts

Media Contact for Tigo
John Lerch
408.402.0802 x430
This email address is being protected from spambots. You need JavaScript enabled to view it.

DUBLIN--(BUSINESS WIRE)--The "Cuba Upstream (Oil and Gas) Fiscal and Regulatory Guide" report has been added to ResearchAndMarkets.com's offering.


"Cuba Upstream (Oil and Gas) Fiscal and Regulatory Guide", presents the essential information relating to the terms which govern investment into Cuba's upstream oil and gas sector. The report sets out in detail the contractual framework under which firms must operate in the industry, clearly defining factors affecting profitability and quantifying the state's take from hydrocarbon production. Considering political, economic and industry specific variables, the report also analyses future trends for Cuba's upstream oil and gas investment climate.

Cuba offers acreage for upstream operations through production sharing agreements (PSAs). A new deepwater PSA model has been announced as part of Cuba's 1st Offshore Licensing round taking place between 2019-2021.

The licensing round includes 24 deepwater blocks in Cuba's Gulf of Mexico EEA. The new PSA model except from training fees does not include any royalties, surface fees and production bonuses. Cuba's fiscal changes since 2014 are increasingly attractive and favourable, especially for deep-water blocks. There is an increasing exploration interest during the last few years across the Caribbean region which might encourage investments in Cuba as well.

Taking into consideration that all peer countries of Cuba have higher exploration activity, Cuba's favourable terms are expected to remain in place over the following years with the objective to attract foreign investments and support its economy. However, the reinstated US sanctions, the sector uncertainty caused by the COVID-19 pandemic, the accelerated efforts towards the energy transition, and the frontier nature of the deep-water blocks may be barriers to investment.

Scope

  • Overview of current fiscal terms governing upstream oil and gas operations in Cuba
  • Assessment of the current fiscal regime's state take and attractiveness to investors
  • Charts illustrating the regime structure, and legal and institutional frameworks
  • Detail on legal framework and governing bodies administering the industry
  • Levels of upfront payments and taxation applicable to oil and gas production
  • Information on application of fiscal and regulatory terms to specific licenses
  • Outlook on future of fiscal and regulatory terms in Cuba

Reasons to Buy

  • Understand the complex regulations and contractual requirements applicable to Cuba's upstream oil and gas sector
  • Evaluate factors determining profit levels in the industry
  • Identify potential regulatory issues facing investors in the country's upstream sector
  • Utilize considered insight on future trends to inform decision-making

Key Topics Covered:

1. Executive Summary

1.1 Regime Overview - Production Sharing Agreements

1.2 Timeline

2. State Take Assessment

3. Key Fiscal Terms - Production Sharing Agreements

3.1 Royalties, Bonuses, and Fees

3.2 Cost Recovery

3.3 Profit Sharing

3.4 Direct Taxation

3.5 Indirect Taxation

3.6 State Participation

3.7 Natural Gas Provisions

3.8 Domestic Market Obligation

3.9 Local Content

3.10 Abandonment Provisions

3.11 Joint Committee

4. Regulation and Licensing

4.1 Legal Framework

4.2 Institutional Framework

4.3 Licensing Process

5. Appendix

For more information about this report visit https://www.researchandmarkets.com/r/ekbhmn


Contacts

ResearchAndMarkets.com
Laura Wood, Senior Press Manager
This email address is being protected from spambots. You need JavaScript enabled to view it.

For E.S.T Office Hours Call 1-917-300-0470
For U.S./CAN Toll Free Call 1-800-526-8630
For GMT Office Hours Call +353-1-416-8900

SOUTH BURLINGTON, Vt.--(BUSINESS WIRE)--iSun, Inc. (NASDAQ:ISUN) ( “iSun”), formerly The Peck Company Holdings, Inc. (“Peck”), a leading commercial solar engineering, procurement and construction (“EPC”) company and iSun Energy LLC (“iSun”), a provider of innovative solar power, electric mobility and smart city solutions for government, commercial, retail, academic and data-center projects, today announced that they have closed on the acquisition of iSun Energy LLC, announced on January 5th, 2021.


Merger Rationale

iSun (formerly Peck) established a dominant position over the past 50 years as a leading electrical and data contractor, as well as the largest solar EPC (engineering, procurement and construction) in Vermont, focused on high-quality commercial, industrial and small-utility scale solar projects. It has constructed over 200 megawatts of solar projects to date (enough to power 38,000 homes). Despite COVID-related challenges last year, there were no project cancellations. Peck has been executing a disciplined growth plan since becoming a public company in June 2019, and an accretive merger & acquisition strategy has been a top priority. Acquiring iSun and the iSun® Brand and its innovations is consistent with the Company’s evolution toward serving its customers as a full-service energy solutions provider. Furthermore, adding higher margin products and energy services will have a positive impact on typical solar EPC margins. Combining a profitable EPC business for solar, electrical and data contracting with award-winning products and platforms that are modular, scalable and connected is a powerful combination that differentiates the Company from other solar or EV (electric vehicle) charging companies.

Highlights

  • iSun now trades on Nasdaq as ISUN and replaces PECK
  • iSun near term pipeline across New England, New York and other locations to be announced shortly.
  • Combined group backlog reaches USD $60M
  • The iSun® Brand companies will continue to provide its trusted solar, electrical, and data services to its commercial and industrial customers
  • The iSun® Brand offerings include the iSun Energy & Mobility Hub, a solar canopy for EV charging, and the iSun Oasis Smart Solar Bench will immediately begin to be offered by the entire group to its current and new prospect base.
  • Timely market expansion capitalizes on the Biden administration’s plan to make major public investments in renewables and electric mobility infrastructure, including in 500,000 electric vehicle charging stations.
  • Industry experts anticipate 100 GWs of solar infrastructure will be constructed over the next 5 years, representing 50% growth.1

iSun® Brand Products

The flagship iSun Energy & Mobility Hub is the result of 30 years of passion, dedication, and innovation through sustainability. The iSun solar EV carport charging systems incorporate solar panels to charge electric vehicles while providing unparalleled software insights into data surrounding the energy produced, consumed, air quality effects and other key metrics. The iSun Oasis Smart Solar Bench is expected to be an integral part in developing smart cities and campuses and has the ability to charge any mobile device through integrated solar panels that collect and store energy throughout the day. iSun’s accompanying data platform allows for monitoring and analysis of key metrics through built in IoT (Internet of Things) sensors. The platform also affords both physical and digital advertising and branding, for additional recurring revenue opportunities. iSun’s Augmented Reality 3D software platform helps clients visualize their projects before they are built, making it easy for our clients to adopt sustainable solutions and to understand their impact on sustainability.

Management Commentary

Jeffrey Peck, Chairman of the Board and Chief Executive Officer of iSun, commented, “The acquisition of iSun Energy LLC and name change of Peck to iSun, Inc., came to a swift closing due to great coordination and aligned interests. Our teams are already collaborating together on a number of new opportunities that have become available to us since our announcements. We appreciate the diligent approach to the process by Sass Peress and team, and welcome them to the family. As our new Chief Innovation and Experience Officer, Sass has been empowered to deliver innovative solar energy, electric vehicle infrastructure, and smart city technologies that we intend to incorporate into our basket of goods shortly. The importance of sustainability is a growing metric for governments, organizations and corporations around the world. In order for a growing audience to learn more about the good we do, the iSunOS platform will report on the total carbon reduced by our combined solar ground mount, rooftop, carport and other clean energy or mobility products. Sass will also contribute his experience in Investor Relations, Marketing and Business Development to our new growth opportunities. We welcome Sass to our executive team and look forward to many years of partnership.”

Sass Peress, Founder of iSun Energy LLC, added, “Executing this swift closing would not have happened without the tremendous work by our combined teams. We are grateful for the opportunity to be a part of such a great company and will focus ourselves on the delivery of enhanced experiences for our customers, shareholders and other stakeholders, so that the iSun® Brand continues its leadership in sustainability. Having first coined the iSun brand in 1999, and now having it on the NASDAQ exchange as a ticker symbol, is something I could have never dreamed of. We will now take the brand and our company to heights that aim to engage, inspire and elevate. Novel technologies in development, alone or in partnership, will provide enhanced revenue opportunities, while the existing business delivers great execution and contribution to financial performance.”

iSun’s innovations were recognized this year by the Solar Impulse Foundation of Bertrand Piccard as one the globe’s Top 1000 Sustainability Solutions. As a winner, this award will result in the iSun solution being presented to hundreds of government entities around the world, including various municipal, state and federal agencies in the United States.

About iSun, Inc.

Headquartered in South Burlington, VT, iSun, Inc. (NASDAQ: ISUN) is a business rooted in values that align people, purpose, innovation and sustainability. Ranked by Solar Power World as one of the leading commercial solar contractors in the Northeastern United States, iSun provides energy services, smart city innovations and clean mobility infrastructure to customers for projects from smart solar mobile phone and electric vehicle charging, up to multi-megawatt renewable energy solutions. Since entering the renewable energy market in 2012, iSun has installed over 200 megawatts of rooftop, ground mount and EV carport solar systems (equal to power required for 38,000 homes). We continue to focus on profitable growth opportunities. For more information, visit www.isunenergy.com

Forward Looking Statements

This press release contains forward-looking statements within the meaning of the Private Securities Litigation Reform Act of 1995. These forward-looking statements include, but are not limited to, statements about (i) the benefits of the proposed acquisition, including future financial and operating results, cost savings and synergies, effects on cash flow, market accessibility, financing opportunities, enhancements to revenue and accretion to reported earnings that may be realized from the proposed acquisition; (ii) iSun’s plans, objectives, expectations and intentions and other statements contained in this press release that are not historical facts; and (iii) other statements identified by words such as “expects” “anticipates,” “intends,” “plans,” “believes,” “seeks,” “estimates,” “targets,” “projects,” or words of similar meaning generally intended to identify forward-looking statements. These forward-looking statements are based upon the current beliefs and expectations of the respective management of iSun and are inherently subject to significant business, economic and competitive uncertainties and contingencies, many of which are beyond the control of iSun. In addition, these forward-looking statements are subject to assumptions with respect to future business strategies and decisions that are subject to change. Actual results may differ materially from the anticipated results discussed in these forward-looking statements because of possible uncertainties.

1 https://www.nasdaq.com/videos/tradetalks%3A-2021outlook-and-trends-in-the-solar-space


Contacts

Investor Contact:
Michael d’Amato
This email address is being protected from spambots. You need JavaScript enabled to view it.
p: 802-264-2040

HOUSTON--(BUSINESS WIRE)--Representatives of Kinder Morgan, Inc. (KMI) intend to make virtual presentations on January 27, 2021 at the Kinder Morgan 2021 Investor Day regarding the results for fiscal year 2020, the near-term outlook for 2021, as well as the long-term outlook for KMI.

Interested parties will be able to view the materials to be presented at the event by visiting KMI’s website at: https://ir.kindermorgan.com/events-and-presentations/default.aspx. The presentations will also be accessible by audio webcast (both live and on-demand) on KMI’s website at the same web address. Live presentations are scheduled to begin at 8 a.m. CT, and an archived webcast will remain available for 90 days on KMI’s website at the above address.

About Kinder Morgan

Kinder Morgan, Inc. (NYSE: KMI) is one of the largest energy infrastructure companies in North America. Access to reliable, affordable energy is a critical component for improving lives around the world. We are committed to providing energy transportation and storage services in a safe, efficient and environmentally responsible manner for the benefit of the people, communities and businesses we serve. We own an interest in or operate approximately 83,000 miles of pipelines and 144 terminals. Our pipelines transport natural gas, refined petroleum products, crude oil, condensate, CO2 and other products, and our terminals store and handle various commodities including gasoline, diesel fuel, chemicals, ethanol, metals and petroleum coke. For more information, please visit www.kindermorgan.com.


Contacts

Media Relations
(713) 420-6397
This email address is being protected from spambots. You need JavaScript enabled to view it.

Investor Relations
(800) 348-7320
This email address is being protected from spambots. You need JavaScript enabled to view it.

  • High-efficiency natural gas turbines will improve reliability, reduce emissions and cut customer costs
  • Turbines will enable future operation using hydrogen, which produces zero carbon emissions

LAKE MARY, Fla.--(BUSINESS WIRE)--#ChangeInPower--Entergy Texas, Inc.’s Montgomery County Power Station achieved commercial operation on January 1 with two Mitsubishi Power G-Series air-cooled (GAC) advanced class gas turbines to bring 993 megawatts (MW) of reliable, cleaner electricity to Southeast Texas.


In line with Entergy Corporation’s (NYSE: ETR) commitment to environmental stewardship, Entergy Texas chose Mitsubishi Power’s high-efficiency gas turbines. The companies are currently exploring integrating hydrogen-enabled gas turbine technology to decarbonize power generation at Entergy’s utility businesses in Texas and three other states through a collaboration announced in September 2020.

Mitsubishi Power is delivering all of its advanced class gas turbines with built-in capability for operating on a mixture of up to 30% hydrogen and 70% natural gas. These gas turbines provide the option to operate on up to 100% hydrogen in the future.

“We are pleased that the plant achieved commercial operation well ahead of schedule and is now using Mitsubishi Power’s advanced class gas turbine technology for cleaner and more efficient power to meet our growing demand,” said Sallie Rainer, President and CEO of Entergy Texas. “The new plant provides improved reliability, cleaner energy and substantial cost savings for our customers.”

The Montgomery plant’s G-Series gas turbines are the 93rd and 94th to reach commercial operation worldwide, joining a fleet that has demonstrated 5.7 million actual operating hours. For Entergy, they are the fifth and sixth to reach commercial operation, joining others at Entergy Louisiana’s 994 MW Lake Charles Power Station and 980 MW J. Wayne Leonard Power Station.

Paul Browning, President and CEO of Mitsubishi Power Americas, said, “Entergy maintains an impressive commitment to environmental stewardship, and we are proud to be a part of their progress toward reducing emissions and moving toward a more sustainable future. We look forward to our ongoing collaboration for cleaner energy. Together we are bringing a Change in Power.”

Additional Information

Click below for more about how Mitsubishi Power Americas is providing decarbonization solutions for customers:

About Mitsubishi Power Americas, Inc.

Mitsubishi Power Americas, Inc., headquartered in Lake Mary, Florida, employs more than 2,000 power generation, energy storage, and digital solutions experts and professionals. Our employees are focused on empowering customers to affordably and reliably combat climate change while also advancing human prosperity throughout North and South America. Mitsubishi Power’s power generation solutions include natural gas, steam, aero-derivative, geothermal, distributed renewable technologies, environmental controls, and services. Energy storage solutions include green hydrogen and battery energy storage systems. Mitsubishi Power also offers digital solutions that enable autonomous operations and maintenance of power assets. Mitsubishi Power, Ltd. is a wholly owned subsidiary of Mitsubishi Heavy Industries, Ltd. (MHI). Headquartered in Tokyo, Japan, MHI is one of the world’s leading heavy machinery manufacturers with engineering and manufacturing businesses spanning energy, infrastructure, transport, aerospace and defense. For more information, visit the Mitsubishi Power Americas website and follow us on LinkedIn.


Contacts

Sharon Prater
+1 407-688-6200
This email address is being protected from spambots. You need JavaScript enabled to view it.

  • Orders of $5.2 billion for the quarter, up 2% sequentially and down 25% year-over-year.
  • Revenue of $5.5 billion for the quarter, up 9% sequentially and down 13% year-over-year.
  • GAAP operating income of $182 million for the quarter, up $231 million sequentially and down 45% year-over-year.
  • Adjusted operating income (a non-GAAP measure) of $462 million for the quarter, up 98% sequentially and down 15% year-over-year.
  • GAAP diluted earnings per share of $0.91 for the quarter which included $(0.98) per share of adjusting items. Adjusted diluted earnings per share (a non-GAAP measure) were $(0.07).
  • Cash flows generated from operating activities were $378 million for the quarter. Free cash flow (a non-GAAP measure) for the quarter was $250 million.

    The Company presents its financial results in accordance with GAAP. However, management believes that using additional non-GAAP measures will enhance the evaluation of the profitability of the Company and its ongoing operations. Please see Tables 1a, 1b and 1c in the section entitled "Charges & Credits" for a reconciliation of GAAP to non-GAAP financial measures.  Certain columns and rows in our tables and financial statements may not sum up due to the use of rounded numbers. 

LONDON & HOUSTON--(BUSINESS WIRE)--Baker Hughes Company (NYSE: BKR) ("Baker Hughes" or the "Company") announced results today for the fourth quarter and total year 2020.


Three Months Ended


Variance

(in millions except per share amounts)

December 31,
2020

September 30,
2020

December 31,
2019


Sequential

Year-over-
year

Orders

$

5,188


$

5,106


$

6,944


2%

(25)%

Revenue

5,495


5,049


6,347


9%

(13)%

Operating income (loss)

182


(49)


331


F

(45)%

Adjusted operating income (non-GAAP)

462


234


546


98%

(15)%

Net income (loss) attributable to Baker Hughes

653


(170)


48


F

F

Adjusted net income (non-GAAP) attributable to Baker Hughes

(50)


27


179


U

U

Diluted EPS attributable to Class A shareholders

0.91


(0.25)


0.07


F

F

Adjusted diluted EPS (non-GAAP) attributable to Class A shareholders

(0.07)


0.04


0.27


U

U

Cash flow from operating activities

378


219


1,357


73%

(72)%

Free cash flow (non-GAAP)

250


52


1,053


F

(76)%

"F" is used in most instances when variance is above 100%. Additionally, "U" is used in most instances when variance is below (100)%.

We are pleased with our fourth quarter and full year results while navigating the impacts of the global pandemic and industry downturn. Despite an incredibly challenging year for the industry in 2020, we generated over $500 million in free cash flow, booked $6.4 billion in TPS orders, and executed on our substantial cost-out and restructuring program. We also took several important steps to accelerate our strategy and invest in energy transition technologies, helping to position the company for the future. I cannot thank our employees enough for their hard work and dedication to achieve our goals and move the company forward,” said Lorenzo Simonelli, Baker Hughes chairman and chief executive officer.

As we look ahead to 2021, we are cautiously optimistic that the global economy and oil demand will begin to recover from the impact of the global pandemic. We believe this macro environment likely translates into a tepid investment environment for oil and gas during the first half of 2021. However, we expect spending and activity levels to gain momentum through the year as the macro environment improves, likely setting up the industry for stronger growth in 2022.

Baker Hughes is well placed to navigate the current market environment and positioned to lead the energy transition. We remain focused on executing for customers, being disciplined on cost, and delivering for our shareholders,” concluded Simonelli.

Quarter Highlights

Supporting our Customers

The OFS segment was awarded several large contracts for drilling and completions in the fourth quarter. Equinor awarded Baker Hughes a significant portion of the drilling and well completions contracts for Phase 1 of the Bacalhau field in offshore Brazil. OFS will provide an integrated well services package for Equinor across multiple product lines, including drilling services, drill bits, drilling and completion fluids, cementing, stimulation, fishing services, and completion equipment.

OFS also secured artificial lift contracts in multiple regions, continuing to demonstrate OFS’ differentiated portfolio in electrical submersible pumping systems (ESPs) and digital monitoring solutions. Commercial agreements for artificial lift equipment and services included a seven-year contract with a customer in the Middle East, a six-year contract with a customer in Italy, and a four-year contract with a customer in the Russia Caspian region.

The OFE segment secured a major equipment order with Eni for the Agogo offshore oilfield in Angola. Consistent with Baker Hughes' Subsea Connect strategy, the order includes multiple subsea trees, wellheads, manifolds, flexible jumpers, distribution units, and controls systems for subsea and the topside.

The TPS segment was awarded a major contract by South Gas Company (SGC) in Iraq for the design, manufacturing, delivery, construction and commissioning of an integrated facility for the processing and production of natural gas. The facility is expected to have a capacity of 200 million standard cubic feet of natural gas per day and utilize previously flared natural gas from the Nassiriya and Gharraf oil fields, reducing emissions by an estimated 6+ million tons of CO2 annually. Baker Hughes will act as an overall solution provider for SGC, overseeing construction and startup of the facility as well as supplying compression equipment, digital monitoring systems and multiple services.

TPS was also awarded several LNG contracts in the fourth quarter, booking an order with longtime partner Qatar Petroleum for power generation equipment for the North Field East LNG project following the third quarter order for the main refrigerant compressors.

The Digital Solutions segment secured a major contract with Petrobras as a follow up to a third quarter award for a three-year frame agreement. The fourth quarter contract will provide a suite of digital solutions and services to optimize productivity, reduce operational and safety risks, and lower carbon emissions across Petrobras sites in Brazil. Petrobras will accelerate its digital transformation, adopting the latest Bently Nevada condition monitoring and protection platform as well as remote monitoring and diagnostics capability. The contract also includes Nexus Controls systems and cybersecurity solutions, flare monitoring and calibration technologies, and Flare.IQ advanced flare gas monitoring and optimization system.

Executing on Priorities

The OFS Chemicals product line secured multiple upstream and downstream chemicals contracts, including a multi-year contract to provide hydrocarbon and water treatment services at one of the largest U.S. refineries. In Asia, Chemicals secured multiple contracts in Thailand, China, Australia, and Malaysia, providing additional regional volume as OFS plans to open its first chemicals manufacturing facility in the region in 2022.

TPS secured several upgrade orders for the supply of high efficiency compression equipment to help extend the field life of projects in the North Sea, Sub-Saharan Africa and in North West Kazakhstan for the Karachaganak Expansion Project-1A operated by Karachaganak Petroleum Operating B.V. Baker Hughes high pressure-reinjection compressors will be used within the 5th Injection Compressor facility, thus helping to extend the duration of the liquid production plateau.

TPS continued executing on LNG projects in the quarter, with multiple equipment modules shipped from Italy to the U.S. for the Calcasieu Pass LNG project with Venture Global LNG. TPS also completed all three LM9000 string tests for power generation and mechanical drive for the Arctic LNG 2 project led by NOVATEK PAO and shipped compression equipment as well as electrical generator and gas turbine packages for the first of three gravity-based structures.

DS secured several North American contracts to enhance operations, improve productivity and drive digital transformation across the energy sector. The Bently Nevada product line secured a contract with a major hydroelectric operator in the U.S. to provide its Orbit 60 system, System 1 software and a five-year services agreement for industrial asset management across multiple dams. Bently Nevada will also provide its System 1 software to American Electric Power (AEP) for several plants in its generation fleet, allowing AEP to monitor live data from and diagnose issues as needed.

DS also continued to expand in industrial end markets. The Waygate Technologies (WT) business secured a significant order with a global leading Asian automaker for its latest Phoenix Speedscan HD system, providing automated inline computed tomography to inspect aluminum cylinder heads for automotive engines. In the aerospace market, WT developed an ‘intelligent borescope’ solution with Rolls-Royce, significantly reducing the time to inspect a jet engine and offering integration between the borescope, app, and turning tool that has not been available to the segment before. The Druck product line also secured multiple military aerospace contracts in Europe, Asia, and North America for aircraft sensors and instrumentation.

Leading with Innovation

Baker Hughes continued to develop technologies to advance the energy transition, improve efficiencies, and reduce emissions for customers. The Company acquired Compact Carbon Capture (3C), a pioneering technology development company specializing in carbon capture solutions. The acquisition underpins Baker Hughes’ strategic commitment to lead in the energy transition and provide differentiated decarbonization solutions for carbon-intensive industries.

Baker Hughes also announced a joint service offering with Wurth Industry North America (WINA) to expand additive manufacturing solutions for Wurth’s 80,000+ global customers. Together, WINA and Baker Hughes will provide advanced design, digital inventory, and customized 3D printing services in a range of industrial applications. Through 3D printing at scale, customers are capable of supply chain logistics-related emissions by moving production closer to the point of consumption.

OFE launched engageSubsea remote, an extension of its engageSubsea platform. EngageSubsea provides a single platform for equipment inspection, operational management and technical support, driving operational excellence and increasing capital productivity for offshore oil and gas operations. The latest remote capabilities further allow operators to cut costs, reduce downtime, improve efficiency, and minimize safety and travel risks. EngageSubsea remote is already a proven technology with live deployments with customers in the Norwegian Continental Shelf and at Baker Hughes services facilities.

DS launched the world’s fastest pressure controller from Druck, known as PACE CM3, as well as Druck’s next generation of pressure sensors, the ADROIT6000. Druck’s technological leadership in pressure sensor solutions continues to deliver exceptional performance and class-leading reliability and stability for customers across multiple industrial markets.

The BakerHughesC3.ai joint venture alliance (BHC3) continued to see interest in AI-based software. In the fourth quarter, a Malaysian-based company adopted BCH3’s technology to detect failure and improve maintenance decisions on gas compressors and control valves. In addition, a Latin American customer adopted BHC3 Reliability to further improve the early warning systems and scheduled maintenance of ESPs.

Consolidated Results by Reporting Segment

Consolidated Orders by Reporting Segment

(in millions)

Three Months Ended


Variance

Consolidated segment orders

December 31,
2020

September 30,
2020

December 31,
2019


Sequential

Year-over-
year

Oilfield Services

$

2,266


$

2,296


$

3,284


(1)

%

(31)

%

Oilfield Equipment

561


432


1,104


30

%

(49)

%

Turbomachinery & Process Solutions

1,832


1,885


1,910


(3)

%

(4)

%

Digital Solutions

528


493


645


7

%

(18)

%

Total

$

5,188


$

5,106


$

6,944


2

%

(25)

%

Orders for the quarter were $5,188 million, up 2% sequentially and down 25% year-over-year. The sequential increase was a result of higher order intake in Oilfield Equipment, and Digital Solutions, partially offset by lower orders in Oilfield Services, and Turbomachinery & Process Solutions. Equipment orders were down 10% sequentially and service orders were up 13%.

Year-over-year, the decline in orders was a result of lower order intake across all segments. Year-over-year equipment orders were down 30% and service orders were down 21%.

The Company's total book-to-bill ratio in the quarter was 0.9; the equipment book-to-bill ratio in the quarter was 0.9.

Remaining Performance Obligations (RPO) in the fourth quarter ended at $23.4 billion, an increase of $0.4 billion from the third quarter of 2020. Equipment RPO was $8.0 billion, down 3% sequentially. Services RPO was $15.4 billion, up 5% sequentially.

Consolidated Revenue by Reporting Segment

(in millions)

Three Months Ended


Variance

Consolidated segment revenue

December 31,
2020

September 30,
2020

December 31,
2019


Sequential

Year-over-
year

Oilfield Services

$

2,282


$

2,308


$

3,292


(1)

%

(31)

%

Oilfield Equipment

712


726


765


(2)

%

(7)

%

Turbomachinery & Process Solutions

1,946


1,513


1,632


29

%

19

%

Digital Solutions

556


503


659


10

%

(16)

%

Total

$

5,495


$

5,049


$

6,347


9

%

(13)

%

Revenue for the quarter was $5,495 million, an increase of 9%, sequentially. The increase was driven by Turbomachinery & Process Solutions and Digital Solutions, partially offset by Oilfield Services and Oilfield Equipment.

Compared to the same quarter last year, revenue was down 13%, driven by lower volume across the Oilfield Services, Oilfield Equipment, and Digital Solutions segments, partially offset by Turbomachinery & Process Solutions.

Consolidated Operating Income by Reporting Segment

(in millions)

Three Months Ended


Variance

Segment operating income

December 31,
2020

September 30,
2020

December 31,
2019


Sequential

Year-over-
year

Oilfield Services

$

142


$

93


$

235


53

%

(40)

%

Oilfield Equipment

23


19


16


22

%

47

%

Turbomachinery & Process Solutions

332


191


305


74

%

9

%

Digital Solutions

76


46


109


66

%

(30)

%

Total segment operating income

573


349


665


64

%

(14)

%

Corporate

(111)


(115)


(118)


3

%

6

%

Inventory impairment

(27)


(42)


34

%

U

Restructuring, impairment & other

(229)


(209)


(159)


(10)

%

(44)

%

Separation related

(24)


(32)


(57)


24

%

57

%

Operating income (loss)

182


(49)


331


F

(45)

%

Adjusted operating income*

$

462


$

234


$

546


98

%

(15)

%

*Non-GAAP measure.

"F" is used in most instances when variance is above 100%. Additionally, "U" is used in most instances when variance is below (100)%.

On a GAAP basis, operating income for the fourth quarter of 2020 was $182 million. Operating income increased $230 million sequentially and decreased $149 million year-over-year. Total segment operating income was $573 million for the fourth quarter of 2020, up 64% sequentially and down 14% year-over-year.

Adjusted operating income (a non-GAAP measure) for the fourth quarter of 2020 was $462 million, which excludes adjustments totaling $281 million before tax, mainly related to restructuring and separation related charges. A complete list of the adjusting items and associated reconciliation from GAAP has been provided in Table 1a in the section entitled “Charges and Credits.” Adjusted operating income for the fourth quarter was up 98% sequentially, driven by margin expansion across all segments. Adjusted operating income was down 15% year-over-year driven by lower margins in the Oilfield Services, and Digital Solutions segments, partially offset by higher margins in Turbomachinery & Process Solutions, and Oilfield Equipment.

Depreciation and amortization for the fourth quarter of 2020 was $307 million.

Corporate costs were $111 million in the fourth quarter of 2020, down 3% sequentially and down 6% year-over-year.

Other Financial Items

Income tax expense in the fourth quarter of 2020 was $568 million.

GAAP diluted earnings per share was $0.91. Adjusted diluted loss per share was $(0.07). Excluded from adjusted diluted earnings per share were all items listed in Table 1a in the section entitled "Charges and Credits" as well as the "other adjustments (non-operating)" found in Table 1b.

Cash flows generated from operating activities were $378 million for the fourth quarter of 2020. Free cash flow (a non-GAAP measure) for the quarter was $250 million. A reconciliation from GAAP has been provided in Table 1c in the section entitled "Charges and Credits."

Capital expenditures, net of proceeds from disposal of assets, were $127 million for the fourth quarter of 2020.

Results by Reporting Segment

The following segment discussions and variance explanations are intended to reflect management's view of the relevant comparisons of financial results on a sequential or year-over-year basis, depending on the business dynamics of the reporting segments.

Oilfield Services

(in millions)

Three Months Ended


Variance

Oilfield Services

December 31,
2020

September 30,
2020

December 31,
2019


Sequential

Year-over-
year

Revenue

$

2,282


$

2,308


$

3,292


(1)%

(31)%

Operating income

$

142


$

93


$

235


53%

(40)%

Operating income margin

6.2

%

4.0

%

7.1

%


2.2pts

-0.9pts

Oilfield Services (OFS) revenue of $2,282 million for the fourth quarter decreased by $26 million, or 1%, sequentially.

North America revenue was $621 million, up 11% sequentially. International revenue was $1,661 million, a decrease of 5% sequentially, driven by Asia Pacific, the Middle East, and Europe. From a product line perspective, the sequential decline of (1)% in OFS was driven primarily by Wireline and Completions, partially offset by Artificial Lift.

Segment operating income before tax for the quarter was $142 million. Operating income for the fourth quarter of 2020 was up $49 million, or 53%, sequentially, primarily driven by cost productivity.

Oilfield Equipment

(in millions)

Three Months Ended


Variance

Oilfield Equipment

December 31,
2020

September 30,
2020

December 31,
2019


Sequential

Year-over-
year

Orders

$

561


$

432


$

1,104


30%

(49)%

Revenue

$

712


$

726


$

765


(2)%

(7)%

Operating income

$

23


$

19


$

16


22%

47%

Operating income margin

3.2

%

2.6

%

2.1

%


0.6pts

1.2pts

Oilfield Equipment (OFE) orders were down $544 million, or 49%, year-over-year, driven primarily by lower equipment order intake across all business segments. Equipment orders were down 54% year-over-year and services orders were down 33% year-over-year.

OFE revenue of $712 million for the quarter decreased $53 million, or 7%, year-over-year. The decrease was driven by lower volume in the Services business, and from the sale of the Surface Pressure Control flow business in the quarter. These decreases were partially offset by higher volume in the Subsea Production Systems, and Flexible Pipe businesses.

Segment operating income before tax for the quarter was $23 million, up $7 million year-over-year. The increase was driven primarily by cost productivity.

Turbomachinery & Process Solutions

(in millions)

Three Months Ended


Variance

Turbomachinery & Process Solutions

December 31,
2020

September 30,
2020

December 31,
2019


Sequential

Year-over-
year

Orders

$

1,832


$

1,885


$

1,910


(3)%

(4)%

Revenue

$

1,946


$

1,513


$

1,632


29%

19%

Operating income

$

332


$

191


$

305


74%

9%

Operating income margin

17.1

%

12.6

%

18.7

%


4.5pts

-1.6pts

Turbomachinery & Process Solutions (TPS) orders were down 4% year-over-year. Equipment orders were down 10% year-over-year and service orders were up 2% year-over-year.

TPS revenue of $1,946 million for the quarter increased $314 million, or 19%, year-over-year. The increase was driven by higher equipment and projects revenue, partially offset by lower services volume. Equipment revenue in the quarter represented 54% of total segment revenue, and Service revenue represented 46% of total segment revenue.

Segment operating income before tax for the quarter was $332 million, up $27 million, or 9%, year-over-year. The increase was driven primarily by volume and productivity, partially offset by a higher mix of equipment revenue.

Digital Solutions

(in millions)

Three Months Ended


Variance

Digital Solutions

December 31,
2020

September 30,
2020

December 31,
2019


Sequential

Year-over-
year

Orders

$

528


$

493


$

645


7%

(18)%

Revenue

$

556


$

503


$

659


10%

(16)%

Operating income

$

76


$

46


$

109


66%

(30)%

Operating income margin

13.8

%

9.2

%

16.6

%


4.6pts

-2.8pts

Digital Solutions (DS) orders were down 18% year-over-year, driven primarily by lower order intake in the Waygate Technologies, Bently Nevada and Process & Pipeline Services businesses, partially offset by higher volume in Reuter Stokes.

DS revenue of $556 million for the quarter decreased 16% year-over-year, driven by lower volume across all product lines.

Segment operating income before tax for the quarter was $76 million, down 30% year-over-year. The decrease year-over-year was primarily driven by lower volume.

2020 Total Year Results


Twelve Months Ended


Orders

December 31, 2020

December 31, 2019

Variance
Year-over-year

Oilfield Services

$

10,119


$

12,902


(22)%

Oilfield Equipment

2,184


3,517


(38)%

Turbomachinery and Process Solutions

6,424


7,947


(19)%

Digital Solutions

1,986


2,607


(24)%

Total Orders

$

20,714


$

26,973


(23)%


Revenue


Oilfield Services

$

10,140


$

12,889


(21)%

Oilfield Equipment

2,844


2,921


(3)%

Turbomachinery and Process Solutions

5,705


5,536


3%

Digital Solutions

2,015


2,492


(19)%

Total Revenue

$

20,705


$

23,838


(13)%


Segment operating income


Oilfield Services

$

487


$

917


(47)%

Oilfield Equipment

19


55


(65)%

Turbomachinery and Process Solutions

805


719


12%

Digital Solutions

193


343


(44)%

Total segment operating income

1,504


2,035


(26)%

Corporate

(464)


(433)


(7)%

Inventory impairment

(246)


U

Goodwill impairment

(14,773)


U

Restructuring, impairment & other

(1,866)


(342)


U

Separation related

(134)


(184)


27%

Operating income

(15,978)


1,074


U

Adjusted operating income(a)

$

1,040


$

1,602


(35)%

(a) Adjusted operating income, a non-GAAP measure, excludes inventory impairment, goodwill impairment, restructuring, impairment & other charges, and separation related costs from GAAP operating income.

Charges & Credits

Table 1a. Reconciliation of GAAP and Adjusted Operating Income/(Loss)


Three Months Ended

(in millions)

December 31,
2020

September 30,
2020

December 31,
2019

Operating income (loss) (GAAP)

$

182


$

(49)


$

331


Separation related

24


32


57


Restructuring, impairment & other

229


209


159


Inventory impairment

27


42


Total operating income adjustments

281


283


216


Adjusted operating income (non-GAAP)

$

462


$

234


$

546


Table 1a reconciles operating income (loss), which is the directly comparable financial result determined in accordance with Generally Accepted Accounting Principles (GAAP), to adjusted operating income (loss) (a non-GAAP financial measure). Adjusted operating income excludes the impact of certain identified items.

Table 1b. Reconciliation of GAAP and Non-GAAP Net Income


Three Months Ended

(in millions, except per share amounts)

December 31,
2020

September 30,
2020

December 31,
2019

Net income (loss) attributable to Baker Hughes (GAAP)

$

653


$

(170)


$

48


Total operating income adjustments (identified items)

281


283


216


Other adjustments (non-operating) (1)

(1,412)


90


Tax effect on total adjustments and other tax items (2)

114


(54)


(9)


Total adjustments, net of income tax

(1,017)


319


207


Less: adjustments attributable to noncontrolling interests

(314)


122


76


Adjustments attributable to Baker Hughes

(703)


197


131


Adjusted net income (loss) attributable to Baker Hughes (non-GAAP)

$

(50)


$

27


$

179


Denominator:


Weighted-average shares of Class A common stock outstanding diluted

713


678


653


Adjusted diluted earnings (loss) per Class A share (non-GAAP)

$

(0.07)


$

0.04


$

0.27


Contacts

Investor Relations
Jud Bailey
+1 281-809-9088
This email address is being protected from spambots. You need JavaScript enabled to view it.

Media Relations
Thomas Millas
+1 713-879-2862
This email address is being protected from spambots. You need JavaScript enabled to view it.


Read full story here

DUBLIN--(BUSINESS WIRE)--The "United States Crude Oil Refinery Outlook to 2025" report has been added to ResearchAndMarkets.com's offering.


United States Crude Oil Refinery Outlook to 2025 is a comprehensive report on crude oil refinery industry in United States. The report also provides details on oil refineries such as name, type, operational status, operator apart from capacity data for the major processing units, for all active and planned refineries in United States for the period 2015-2025. Further, the report also offers recent developments, financial deals as well as latest contracts awarded in the country's oil refinery industry, wherever available.

Scope

  • Updated information related to all active, planned and announced refineries in the country, including operator and equity details
  • Information on CDU, condensate splitter, coking, catalytic cracking and hydrocracking capacities by refinery in the country, wherever available
  • Key mergers and acquisitions, and asset transactions in the country's crude oil industry, wherever available
  • Latest developments, and awarded contracts related to crude oil refineries in the country, wherever available

Reasons to Buy

  • Gain strong understanding of the country's crude oil refining industry
  • Facilitate decision making on the basis of strong historical and outlook of capacity data
  • Assess your competitor's major crude oil refining assets and their performance in the country
  • Analyze the latest developments, financial deals and awarded contracts related to the country's crude oil refining industry
  • Understand the country's financial deals landscape by analyzing how competitors are financed, and the mergers and partnerships that have shaped the market

Key Topics Covered:

1. Table of Contents

1.1. List of Tables

1.2. List of Figures

2. Introduction

2.1. What is This Report About?

2.2. Market Definition

3. United States Refining Industry

3.1. United States Refining Industry, Key Data

3.2. United States Refining Industry, Overview

3.3. United States Refining Industry, Total Refining Capacity

3.4. United States Refining Industry, Crude Distillation Unit Capacity

3.5. United States Refining Industry, Condensate Splitter Unit Capacity

3.6. United States Refining Industry, Coking Capacity

3.7. United States Refining Industry, Catalytic Cracking Capacity

3.8. United States Refining Industry, Hydrocracking Capacity

3.9. United States Refining Industry, Asset Details

3.9.1. United States Refining Industry, Active Asset Details

3.9.2. United States Refining Industry, Planned Asset Details

4. Recent Contracts

4.1. Detailed Contract Summary

4.1.1. Awarded Contracts

5. Financial Deals Landscape

5.1. Detailed Deal Summary

5.1.1. Acquisition

5.1.2. Debt Offerings

5.1.3. Partnerships

5.1.4. Asset Transactions

6. Recent Developments

6.1. Other Significant Developments

7. Appendix

For more information about this report visit https://www.researchandmarkets.com/r/rov848


Contacts

ResearchAndMarkets.com
Laura Wood, Senior Press Manager
This email address is being protected from spambots. You need JavaScript enabled to view it.

For E.S.T Office Hours Call 1-917-300-0470
For U.S./CAN Toll Free Call 1-800-526-8630
For GMT Office Hours Call +353-1-416-8900

PRINCETON, N.J.--(BUSINESS WIRE)--$NRG--NRG Energy, Inc. (NYSE:NRG) today announced that its Board of Directors declared an 8% increase to its quarterly dividend from $0.30 per share to $0.325 per share, or $1.30 per share on an annualized basis. This increase is in-line with the Company’s previously announced annual dividend growth rate target of 7-9% per share. The dividend is payable on February 16, 2021 to stockholders of record as of February 1, 2021.

About NRG Energy

At NRG, we’re bringing the power of energy to people and organizations by putting customers at the center of everything we do. We generate electricity and provide energy solutions and natural gas to millions of customers through our diverse portfolio of retail brands. A Fortune 500 company, operating in the United States and Canada, NRG delivers innovative solutions while advocating for competitive energy markets and customer choice, working towards a sustainable energy future. More information is available at www.nrg.com. Connect with NRG on Facebook, LinkedIn and follow us on Twitter @nrgenergy.

Safe Harbor

This communication contains forward-looking statements that may state NRG’s or its management’s intentions, beliefs, expectations or predictions for the future. Such forward-looking statements are subject to certain risks, uncertainties and assumptions, and typically can be identified by the use of words such as “will,” “expect,” “estimate,” “anticipate,” “forecast,” “plan,” “believe” and similar terms. Although NRG believes that its expectations are reasonable, it can give no assurance that these expectations will prove to have been correct, and actual results may vary materially. Factors that could cause actual results to differ materially from those contemplated above include, among others, risks and uncertainties related to the capital markets generally.


Contacts

Investors:
Kevin L. Cole, CFA
609.524.4526
This email address is being protected from spambots. You need JavaScript enabled to view it.

Media:
Candice Adams
609.524.5428
This email address is being protected from spambots. You need JavaScript enabled to view it.

LEAWOOD, KS--(BUSINESS WIRE)--To further emphasize the firm’s longstanding pledge to corporate social responsibility, Ecofin announced it has appointed Managing Director Greg Murphy as Head of Impact. In this position, he leads the execution of the firm’s Sustainability & Impact Policy and corresponding initiatives. Greg collaborates with the investment research and portfolio teams to enhance the sustainability, impact measurement and environmental, social, and governance (ESG) factors that are embedded in the investment process, and to ensure the integration across asset classes and geographies. By actively engaging with portfolio companies, Ecofin strives to be a change agent, helping drive continuous improvement of sustainability practices.


“Our investments are decarbonizing global electric grids, providing quality education in underserved areas, affordably caring for the elderly, contributing to solving the global water crisis, and making the economy more circular. Anyone can report financial performance. In this role, I plan to bring to life the impacts beyond financial returns,” said Murphy. “We are measuring and tracking items that just a few years ago seemed impossible to quantify. I want to integrate data with anecdotes from the field to tell the true stories of how our investments impact people, communities and economies around the globe.”

Greg’s role ties together all aspects of Ecofin and its parent, TortoiseEcofin. He coordinates closely with Brent Newcomb, President-Ecofin, providing firm-wide guidance on impact principles that help serve clients’ evolving needs.

“Our primary goal at Ecofin is to provide strong risk-adjusted returns for our clients, while secondly, tackling some of the planet’s biggest challenges by investing in companies earning solid returns and doing business in ethical and responsible ways,” said Newcomb. “Greg has a passion for understanding the impact our investments are making on the world. Investors are demanding greater precision out of their holdings in sustainability and ESG, and Greg is exceptionally suited for this position.”

With firm and affiliate tenure of over 20 years, Greg most recently served as Client Portfolio Manager, articulating various aspects of the business to a range of clients. Prior to joining the firm, he was an investment committee member and principal at Fountain Capital Management, a founding sponsor of the firm. He also worked as a public accountant and as a consultant to the energy industry. Greg graduated cum laude with a Bachelor of Science in business administration and economics from Trinity University and a Master of Business Administration from the University of Kansas, and is a CFA® charterholder.

For more information about our approach to sustainable investing, watch this short video Who is Ecofin? or visit the About Ecofin, Insight and Sustainability and Impact sections of our website.

About Ecofin

Ecofin is a sustainable investment firm dedicated to uniting ecology and finance. Our mission is to generate strong risk-adjusted returns while optimizing investors’ impact on society. We are socially-minded, ESG-attentive investors, harnessing years of expertise investing in sustainable infrastructure, energy transition, clean water & environment and social impact. Our strategies are accessible through a variety of investment solutions and seek to achieve positive impacts that align with UN Sustainable Development Goals by addressing pressing global issues surrounding climate action, clean energy, water, education, healthcare and sustainable communities. Ecofin Investments, LLC is the parent of registered investment advisers Ecofin Advisors, LLC and Ecofin Advisors Limited (collectively "Ecofin"). Learn more at www.ecofininvest.com.

About TortoiseEcofin

TortoiseEcofin focuses on essential assets – those assets and services that are indispensable to the economy and society. We strive to make a positive impact on clients and communities by investing in energy infrastructure and the transition to cleaner energy and by providing capital for social impact projects focused on education and seniors housing. TortoiseEcofin brings together strong legacies from Tortoise, with expertise investing across the energy value chain for more than 20 years, and from Ecofin, which unites ecology and finance and has roots back to the early 1990s. For additional information, please visit www.TortoiseEcofin.com.

Forward-Looking Statement

This press release contains certain statements that may include “forward-looking statements” within the meaning of Section 27A of the Securities Act of 1933 and Section 21E of the Securities Exchange Act of 1934. All statements, other than statements of historical fact, included herein are "forward-looking statements." Although the funds and TortoiseEcofin believe that the expectations reflected in these forward-looking statements are reasonable, they do involve assumptions, risks and uncertainties, and these expectations may prove to be incorrect. Actual results could differ materially from those anticipated in these forward-looking statements as a result of a variety of factors, including those discussed in the funds’ reports that are filed with the Securities and Exchange Commission. You should not place undue reliance on these forward-looking statements, which speak only as of the date of this press release. Other than as required by law, the funds and TortoiseEcofin do not assume a duty to update this forward-looking statement.

Safe Harbor Statement

This press release shall not constitute an offer to sell or a solicitation to buy, nor shall there be any sale of these securities in any state or jurisdiction in which such offer or solicitation or sale would be unlawful prior to registration or qualification under the laws of such state or jurisdiction.


Contacts

Maggie Zastrow, (913) 981-1020 or This email address is being protected from spambots. You need JavaScript enabled to view it.

Offshore Source Logo

Offshore Source keeps you updated with relevant information concerning the Offshore Energy Sector.

Any views or opinions represented on this website belong solely to the author and do not represent those of the people, institutions or organizations that Offshore Source or collaborators may or may not have been associated with in a professional or personal capacity, unless explicitly stated.

Corporate Offices

Technology Systems Corporation
8502 SW Kansas Ave
Stuart, FL 34997

info@tscpublishing.com