Business Wire News

MINNEAPOLIS--(BUSINESS WIRE)--On Thursday, January 28, 2021, Xcel Energy (NASDAQ: XEL) will host a conference call to review fourth quarter and year end 2020 financial results. Earnings will be released prior to the opening of trading.


The call will begin at 9:00 a.m. Central Time. To participate in the conference call, please dial in at least 5-10 minutes prior to the scheduled start and follow the operator’s instructions. You will be asked for the conference ID number.

US Dial-In: 888-394-8218
International Dial-In: 400-120-8590
Conference ID: 6174235

The conference call will also be simultaneously broadcast and archived on our website, along with an MP3 download, at the following location:

http://www.xcelenergy.com
Under Company, select: Investor Relations

If you are unable to participate in the live event, the call will be available for replay from 12:00 p.m. on January 28 through 12:00 p.m. on January 31, Central Time.

Replay Numbers
US Dial-In: 888-203-1112
International Dial-In: 719-457-0820
Replay Passcode: 6174235

About Xcel Energy

Xcel Energy (NASDAQ: XEL) provides the energy that powers millions of homes and businesses across eight Western and Midwestern states. Headquartered in Minneapolis, the company is an industry leader in responsibly reducing carbon emissions and producing and delivering clean energy solutions from a variety of renewable sources at competitive prices. For more information, visit xcelenergy.com or follow us on Twitter and Facebook.


Contacts

Financial analysts may call:
Paul Johnson, Vice President - Investor Relations 612-215-4535

News media inquiries please call Xcel Energy Media Relations at 612-215-5300.
Internet: www.xcelenergy.com

Company’s largest project generates electricity for Fortune 500 corporate customers

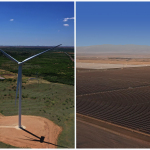
DULUTH, Minn.--(BUSINESS WIRE)--ALLETE Clean Energy, a wholly owned subsidiary of ALLETE, Inc. (NYSE: ALE), announced today the start of commercial operations at its Diamond Spring wind site in southern Oklahoma.


The output from the 303-megawatt Diamond Spring site is contracted to provide renewable energy to Walmart, Smithfield Foods and Starbucks though separate renewable energy sales agreements with 12-15 year terms.

Diamond Spring is ALLETE Clean Energy’s largest wind site, producing enough energy to power about 114,000 homes and increasing the company’s total wind capacity to more than 1,000 megawatts.

“Diamond Spring will help our customers achieve their climate-action goals and bring more renewable energy onto the nation’s power grid,” said ALLETE Clean Energy President Allan S. Rudeck Jr. “I’m extremely proud of our team for developing our largest wind site and bringing it to commercial operation on schedule during a global pandemic. We intend to continue to build on our strong reputation for delivering timely, responsible and cost-effective renewable solutions. ALLETE Clean Energy will continue to innovate and drive new growth opportunities in the clean-energy sector.”

“Meaningful and lasting actions to address climate change by utilities, cities, and corporate and industrial customers are an important part of ALLETE’s sustainability in action strategy and provide an exciting market for ALLETE Clean Energy as companies embrace sustainability goals,” said ALLETE President and CEO Bethany Owen.

Smithfield Foods, a $16 billion global food and agriculture company, announced a goal in 2016 to reduce greenhouse gas emissions across its supply chain 25 percent by 2025. Earlier this year, the company furthered its commitment to emissions reduction by announcing it will become carbon negative across its company-owned operations in the United States by 2030.

“Smithfield Foods has an ambitious carbon reduction program aimed at making a real, positive impact on the climate and generating value for multiple stakeholders,” said Kraig Westerbeek, senior director of Smithfield Renewables for Smithfield Foods. “With the completion of the Diamond Spring project, the wind energy generated from this site will account for what is needed to power more than 15 percent of our total U.S. operations, marking a significant step forward in achieving our goals.”

ALLETE Clean Energy’s strategic purchase of wind turbines that qualify for the safe harbor provision of federal production tax credits enables Diamond Spring’s low energy costs. In addition to turbines installed at Diamond Spring, ALLETE Clean Energy retains more safe harbor turbines for additional wind site development.

With Diamond Spring online, ALLETE Clean Energy has turned its attention to developing the Caddo wind site in central Oklahoma. The 303-megawatt Caddo site is fully contracted to three corporate customers, of which 200 megawatts is contracted to McDonald’s Corp., increasing ALLETE Clean Energy’s share of the corporate and industrial clean-energy market. The project is expected to be operational by the end of 2021.

ALLETE Clean Energy acquires, develops and operates clean and renewable energy projects and is well-positioned to drive additional clean-energy sector growth. ALLETE Clean Energy owns, operates, has in advanced construction and has delivered build-transfer projects totaling more than 1,450 megawatts of nameplate wind capacity across seven states.

ALLETE, Inc. is an energy company headquartered in Duluth, Minnesota. In addition to its electric utilities, Minnesota Power and Superior Water, Light and Power of Wisconsin, ALLETE owns ALLETE Clean Energy, based in Duluth; BNI Energy in Bismarck, North Dakota; and has an 8 percent equity interest in the American Transmission Co. More information about ALLETE is available at www.allete.com. ALE-CORP

The statements contained in this release and statements that ALLETE may make orally in connection with this release that are not historical facts, are forward-looking statements. Actual results may differ materially from those projected in the forward-looking statements. These forward-looking statements involve risks and uncertainties and investors are directed to the risks discussed in documents filed by ALLETE with the Securities and Exchange Commission.


Contacts

Amy Rutledge
Manager - Corporate Communications
218-723-7400
This email address is being protected from spambots. You need JavaScript enabled to view it.

LONDON--(BUSINESS WIRE)--#GlobalOffshoreOilandGasPipelineMarket--The offshore oil and gas pipeline market is poised to grow by USD 2.79 bn during 2020-2024 progressing at a CAGR of over 4% during the forecast period.


Worried about the impact of COVID-19 on your Business? Here is an Exclusive report talking about Market scenarios, Estimates, the impact of lockdown, and Customer Behaviour.

Get FREE Sample Report in Minutes!

The report on the offshore oil and gas pipeline market provides a holistic update, market size and forecast, trends, growth drivers, and challenges, as well as vendor analysis.

The report offers an up-to-date analysis regarding the current global market scenario, the latest trends and drivers, and the overall market environment. The market is driven by the increase in global energy demand.

The offshore oil and gas pipeline market analysis includes the product segment and geography landscape. This study identifies the economic benefits of offshore pipelines than other oil and gas transportation modes as one of the prime reasons driving the offshore oil and gas pipeline market growth during the next few years.

This report presents a detailed picture of the market by the way of study, synthesis, and summation of data from multiple sources by an analysis of key parameters.

The offshore oil and gas pipeline market covers the following areas:

Offshore Oil And Gas Pipeline Market Sizing

Offshore Oil And Gas Pipeline Market Forecast

Offshore Oil And Gas Pipeline Market Analysis

Companies Mentioned

  • Allseas Group SA
  • ArcelorMittal SA
  • John Wood Group Plc
  • McDermott International Inc.
  • PAO TMK
  • Saipem Spa
  • Subsea 7 SA
  • TechnipFMC Plc
  • Tenaris SA
  • United Metallurgical Co. (OMK)

Related Reports on Energy Include:

  • Sand Control Systems Market by Application and Geography - Forecast and Analysis 2020-2024- The sand control systems market size has the potential to grow by USD 418.62 million during 2020-2024, and the market’s growth momentum will accelerate during the forecast period. To get extensive research insights: Click and get FREE sample report in minutes
  • Transmission and Distribution (T&D) Equipment Market by Type and Geography - Forecast and Analysis 2020-2024- The transmission and distribution (T&D) equipment market size has the potential to grow by USD 44.17 billion during 2020-2024, and the market’s growth momentum will accelerate during the forecast period. To get extensive research insights: Click and get FREE sample report in minutes

Key Topics Covered:

Executive Summary

Market Landscape

  • Market ecosystem
  • Value chain analysis

Market Sizing

  • Market definition
  • Market segment analysis
  • Market size 2019
  • Market outlook: Forecast for 2019 - 2024

Five Forces Analysis

  • Five forces summary
  • Bargaining power of buyers
  • Bargaining power of suppliers
  • Threat of new entrants
  • Threat of substitutes
  • Threat of rivalry
  • Market condition

Market Segmentation by Product

  • Market segments
  • Comparison by Product
  • Gas - Market size and forecast 2019-2024
  • Oil - Market size and forecast 2019-2024
  • Market opportunity by Product

Customer landscape

Geographic Landscape

  • Geographic segmentation
  • Geographic comparison
  • Europe - Market size and forecast 2019-2024
  • MEA - Market size and forecast 2019-2024
  • APAC - Market size and forecast 2019-2024
  • South America - Market size and forecast 2019-2024
  • North America - Market size and forecast 2019-2024
  • Key leading countries
  • Market opportunity by geography
  • Market drivers
  • Market challenges
  • Market trends

Vendor Landscape

  • Overview
  • Vendor landscape
  • Landscape disruption

Vendor Analysis

  • Vendors covered
  • Market positioning of vendors
  • Allseas Group SA
  • ArcelorMittal SA
  • John Wood Group Plc
  • McDermott International Inc.
  • PAO TMK
  • Saipem Spa
  • Subsea 7 SA
  • TechnipFMC Plc
  • Tenaris SA
  • United Metallurgical Co. (OMK)

Appendix

  • Scope of the report
  • Currency conversion rates for US$
  • Research methodology
  • List of abbreviations

Technavio suggests three forecast scenarios (optimistic, probable, and pessimistic) considering the impact of COVID-19. Technavio’s in-depth research has direct and indirect COVID-19 impacted market research reports.

Register for a free trial today and gain instant access to 17,000+ market research reports.

Technavio's SUBSCRIPTION platform

About Us

Technavio is a leading global technology research and advisory company. Their research and analysis focuses on emerging market trends and provides actionable insights to help businesses identify market opportunities and develop effective strategies to optimize their market positions. With over 500 specialized analysts, Technavio’s report library consists of more than 17,000 reports and counting, covering 800 technologies, spanning across 50 countries. Their client base consists of enterprises of all sizes, including more than 100 Fortune 500 companies. This growing client base relies on Technavio’s comprehensive coverage, extensive research, and actionable market insights to identify opportunities in existing and potential markets and assess their competitive positions within changing market scenarios.


Contacts

Technavio Research
Jesse Maida
Media & Marketing Executive
US: +1 844 364 1100
UK: +44 203 893 3200
Email: This email address is being protected from spambots. You need JavaScript enabled to view it.
Website: www.technavio.com/

DUBLIN--(BUSINESS WIRE)--The "The Global Military Simulator Systems Market to 2030" report has been added to ResearchAndMarkets.com's offering.


The report covers the industry analysis including the key market drivers, emerging technology trends, and major challenges faced by industry participants. It also offers insights regarding key factors and government programs that are expected to influence the demand for military simulator systems market over the forecast period.

The demand for military simulator systems is anticipated to be driven by high levels of expenditure by emerging economies in the Asia-Pacific region, including India and China. The North American region, supported by the US Armed Forces' multi-year procurement programs, is anticipated to register a second leading position globally, exhibiting a steady pace of growth over the forecast period. Militaries are incorporating simulators into their training programs to cut down various operating costs associated with the training involved with real equipment. Governments are also planning to shift most pilot training to simulators.

Land simulator is expected to be the largest segment in the military simulator systems market over the forecast period. The demand for land simulators is anticipated to originate from the procurement of various land platforms, such Australia's Land 400 Phase 2 - Boxer CRV, China's T-15 Light Tank, India's Arjun MK1-A, Russia's T-14 Armata, the UK's Athena C2 and the US's Joint Light Tactical Vehicles (JLTVs), among others.

The land simulator segment is expected to account for a 47.9% revenue share of the total market over the forecast period followed by flight simulator segment. The demand for this segment is driven by several high-value procurement programs worldwide, including the US's Predator Mission Aircrew Training System (PMATS), E-2D Hawkeye Integrated Training System III, AH-64 Apache Flight Simulators, Thailand's F-16A/B Block 15 Simulator, the UK's Military Flying Training System (UKMFTS) and Qatar's P5 Air Combat Training System, among others

The global military simulator systems market is expected to be led by Asia-Pacific with a revenue share of 28.0%. The growth in the Asia-Pacific market is attributed to spending by countries such as India, China, Australia, South Korea, and Japan on advanced simulators of various categories.

Key Highlights

  • The global military simulator systems market is expected to grow at a CAGR of 4.49% over the forecast period.
  • The global military simulator systems market is classified into four categories: Land Simulator, Flight Simulator, Maritime Simulator and Joint Force Simulator.
  • The global military simulator systems market is expected to be led by Asia-Pacific with a revenue share of 28.0%. The growth in the Asia-Pacific market is attributed to spending by countries such as India, China, Australia, South Korea, and Japan on advanced simulators of various categories.
  • Land simulator is expected to be the largest segment in the military simulator systems market over the forecast period.

Key Topics Covered:

Executive Summary

  • Global Military Simulator Systems Market - Overview

Market Dynamics

  • Demand Drivers: Cost-effectiveness of simulators to drive demand
  • Trends: Growing popularity for integrated live, virtual and constructive training methods
  • Technological Developments: Usage of big data and artificial intelligence
  • Key Challenges: Mobility and Scalability issues pose a challenge for simulator designers

Global Military Simulator Systems Market - Segment Analysis

  • Segment Analysis: Flight Simulator
  • Segment Analysis: Land Simulator
  • Segment Analysis: Maritime Simulator
  • Segment Analysis: Joint Force Simulator

Global Military Simulator Systems Market - Regional Analysis

  • Global Military Simulator Systems - Regional Overview, 2020 and 2030
  • Regional Analysis: North America
  • Regional Analysis: Asia-Pacific
  • Regional Analysis: Europe
  • Regional Analysis: Middle East
  • Regional Analysis: Africa
  • Regional Analysis: Latin America

Global Military Simulator Systems Market - Trend Analysis

  • Leading Segments in Key Countries
  • Country Analysis
  • Leading Countries
  • Market Size and CAGR Growth Analysis, 2020-2030
  • Change in Market Share, 2020-2030
  • Segmental Share (%), 2020-2030
  • Country Share (%), 2020 & 2030
  • Major Suppliers
  • Segmental Analysis

Key Programs Analysis

  • Description of Key Programs
  • Delivery Period, Units and Total Expenditure

Competitive Landscape Analysis

  • Competitive Analysis
  • Leading Companies

Major Products and Services

  • Financial Analysis covering Revenue, Operating Profit and Net Profit
  • Financial Deal and Contracts

Companies Mentioned

  • General Dynamics Corp
  • L3 Harris Technologies Inc
  • The Boeing Co
  • Lockheed Martin Corp
  • Rheinmetall AG
  • Cubic Corporation
  • Raytheon Technologies Corp
  • CAE Inc.
  • Northrop Grumman Corp.

For more information about this report visit https://www.researchandmarkets.com/r/w7usp9


Contacts

ResearchAndMarkets.com
Laura Wood, Senior Press Manager
This email address is being protected from spambots. You need JavaScript enabled to view it.
For E.S.T Office Hours Call 1-917-300-0470
For U.S./CAN Toll Free Call 1-800-526-8630
For GMT Office Hours Call +353-1-416-8900

ANNAPOLIS, Md.--(BUSINESS WIRE)--$HASI--Hannon Armstrong Sustainable Infrastructure Capital, Inc. ("Hannon Armstrong") (NYSE: HASI), a leading investor in climate solutions, today announced a preferred equity investment in an approximately 1.6 gigawatt (GW) onshore wind and utility-scale solar portfolio developed and managed by Clearway Energy Group, one of the largest developers and operators of clean energy in the United States with a pipeline of 9 GW of renewable energy through 2022.


The large-scale, diversified, and highly contracted renewables portfolio includes 874 megawatts (MW) of onshore wind, 192 MW of utility-scale solar, and 557 MW of utility-scale solar with 395 MW of co-located storage (seven projects in total) located in four states: California, Hawaii, Texas, and West Virginia. The partnership combines Hannon Armstrong's expertise in providing long-term investment for climate solutions with the world-class development and asset owner-operator experience of Clearway Energy Group.

"We are pleased to expand our relationship with Clearway Energy Group through a preferred equity investment in this portfolio of renewable assets," said Hannon Armstrong Chairman and CEO Jeffrey W. Eckel. "Clearway's mission to accelerate the world's transformation to a clean energy future is aligned with our purpose as a climate-positive investor. These assets will be a significant addition to our portfolio, offering increased scale and diversity to our business and supporting continued growth in recurring Net Investment Income," added Eckel.

"We are thrilled to partner with Hannon Armstrong on such an impactful portfolio transaction," said Craig Cornelius, Chief Executive Officer at Clearway Energy Group, LLC. "This geographically diverse portfolio of wind, solar, and energy storage projects represents the economic opportunity of renewable energy in every corner of this country. Taken together, more than 2,500 American jobs will be created to build and operate these clean energy assets, which will go on to supply clean low-cost power to hundreds of thousands of households and businesses across the United States. This agreement with our investment partners will be pivotal in Clearway's continued ability to provide clean energy at the scale our country demands while helping to deliver on investors' growing interest in climate change solutions."

In accordance with the terms of the investment, which reached financial close on December 21, 2020, Hannon Armstrong will hold a preferred equity interest in a number of holding companies owning the cash equity interests in individual portfolio operating projects and will participate in the cash flows from such projects. Hannon Armstrong has funded approximately $200 million of its investment to date and anticipates funding the remaining portion in 2021 and 2022. Once fully funded, Hannon Armstrong's total investment in the portfolio will be approximately $663 million.

The remaining ownership of cash equity interests in the holding companies will be held by Clearway Energy, Inc. (NYSE: CWEN, CWEN.A), a publicly traded affiliate of Clearway Energy Group focused on ownership of modern, sustainable, and long-term contracted assets across North America. Clearway Energy Group will continue to manage the assets and provide operations and maintenance services.

Highlights

  • The portfolio includes three wind, one solar, and three solar-plus-storage projects representing approximately 1.6 GW of renewable energy generation and 395 MW of storage capacity, including:
    • Daggett Solar: a 482 MW utility-scale solar project with 320 MW of co-located storage located in San Bernardino County, California.
    • Mesquite Star: a 419 MW wind project located in Fisher and Nolan County, Texas.
    • Mesquite Sky: a 345 MW wind project located in Callahan County, Texas.
    • Rosamond Central: a 192 MW utility-scale solar project located in Kern County, California.
    • Black Rock: a 110 MW wind project in Mineral and Grant County, West Virginia.
    • Waiawa and Mililani: a 36 MW utility-scale solar project and a 39 MW utility-scale solar project with a combined 75 MW of co-located storage located in Oahu, Hawaii.
  • With a weighted average contract life of greater than 14 years, the portfolio's cash flows are contracted with a diversified group of predominately investment-grade corporate, utility, university, and municipal offtakers.
  • With a CarbonCount® score of 1.06 metric tons of carbon dioxide equivalent (CO2e) reduced annually per $1,000 invested, Hannon Armstrong's investment will avoid an estimated 703,000 metric tons of CO2e annually, equivalent to the CO2e emissions from the annual electricity consumption of approximately 119,000 U.S. homes.

About Hannon Armstrong

Hannon Armstrong (NYSE: HASI) is the first U.S. public company solely dedicated to investments in climate solutions, providing capital to leading companies in energy efficiency, renewable energy, and other sustainable infrastructure markets. With more than $6 billion in managed assets as of September 30, 2020, Hannon Armstrong's core purpose is to make climate-positive investments with superior risk-adjusted returns. For more information, please visit www.hannonarmstrong.com. Follow Hannon Armstrong on LinkedIn and Twitter @HannonArmstrong.

Forward Looking Statements

Some of the information in this press release contains forward-looking statements and within the meaning of Section 27A of the Securities Act of 1933, as amended, and Section 21E of the Securities Exchange Act of 1934, as amended. When used in this press release, words such as "believe," "expect," "anticipate," "estimate," "plan," "continue," "intend," "should," "may," "target," or similar expressions, are intended to identify such forward-looking statements. Forward-looking statements are subject to significant risks and uncertainties. Investors are cautioned against placing undue reliance on such statements. Actual results may differ materially from those set forth in the forward-looking statements. Factors that could cause actual results to differ materially from those described in the forward-looking statements include those discussed under the caption "Risk Factors" included in our Annual Report on Form 10-K for our fiscal year ended December 31, 2019, which was filed with the U.S. Securities and Exchange Commission ("SEC"), as well as in other reports that we file with the SEC.

Forward-looking statements are based on beliefs, assumptions and expectations as of the date of this press release. We disclaim any obligation to publicly release the results of any revisions to these forward-looking statements reflecting new estimates, events or circumstances after the date of this press release.


Contacts

Media
Gil Jenkins
This email address is being protected from spambots. You need JavaScript enabled to view it.
443-321-5753

Investors
Chad Reed
This email address is being protected from spambots. You need JavaScript enabled to view it.
410-571-6189

Expanded facility with new commitments from Deutsche Bank, Helaba and NORD/LB driven by rapid growth in 8minute’s solar-plus-storage pipeline

LOS ANGELES--(BUSINESS WIRE)--#RenewableEnergy--After securing a $225 million letter of credit and revolving credit facility earlier this year, 8minute Solar Energy (8minute) has significantly upsized that facility to a total of $350 million with support from new lenders. The additional $125 million in commitments comes from the existing lenders who are joined by Deutsche Bank, Landesbank Hessen-Thüringen (Helaba), and Norddeutsche Landesbank (NORD/LB). The expanded facility will help 8minute accelerate the development of its growing pipeline, which includes more than 18-gigawatts (GW) of solar capacity and 24-gigawatt-hours (GWh) of storage throughout California, Texas, and the Southwestern United States.


“Over the last year, 8minute has been very successful in growing and contracting our best-in-class portfolio through ‘smart’ solar-plus-storage power plants that are the lowest-cost, most reliable way to decarbonize our electrical grid,” said Dr. Tom Buttgenbach, Founder and CEO of 8minute. “This additional financing is not only a strong testament to the demand for 8minute’s technological leadership, but also a sign that lenders are moving away from risky and volatile fossil fuel infrastructure, toward the predictability of clean energy.”

In May, 8minute closed the initial facility from a consortium of banks, led by CIT as sole coordinating lead arranger, with joint lead arrangers KeyBanc Capital Markets, HSBC, Rabobank and Nomura. 8minute is using the facility to cost effectively post securities for its power purchase agreements (PPAs) and interconnection agreements.

8minute has one of the largest development pipelines of solar and solar-plus-storage projects in the country, including more than 50 utility-scale projects in various stages of development, with a typical project size of 400 MW. Most of these projects will deploy 8minute’s new generation of highly efficient solar power plants with energy storage that are custom designed for each customer.

This year alone, 8minute signed about one-gigawatt of solar and 800-megawatt-hours (MWh) of storage with new customers, including its first project in New Mexico and the largest solar and storage center among California’s Community Choice Aggregators (CCAs).

Latham & Watkins LLP represented 8minute and Norton Rose Fulbright LLP represented the lenders.

ABOUT 8MINUTE SOLAR ENERGY

As a nationwide leader in solar-plus-storage, 8minute Solar Energy (8minute) is championing the clean energy transition in the United States and shaping the future of energy. Since its founding in 2009, 8minute has successfully put 2 GW of solar projects into operation and currently has over 18 GW of solar and storage projects under development. By focusing on technology and engineering innovation, 8minute’s best-in-class team has continued to set new industry records, developing the largest solar plant in the nation starting in 2011, delivering the first operational solar plant in the U.S. to beat fossil fuel prices in 2016, and setting the record for the lowest cost solar and solar-plus-storage projects in 2019. As the largest solar developer in the country with an established track record of delivering above-market profitability, 8minute is pioneering a new generation of large-scale, fully dispatchable solar power. For more information, please visit www.8minute.com, and follow 8minute on Twitter and LinkedIn.


Contacts

Katie Struble
Director, Corporate Communications
This email address is being protected from spambots. You need JavaScript enabled to view it.

Texas Oversized Market Seen as Prime Area for Carrier Growth

HOUSTON--(BUSINESS WIRE)--Port Houston will be the first port of call in the United States on a new direct Trans-Pacific Asia service being launched by THE Alliance called the “EC6,” an East Coast all-water service via Panama calling the U.S. Gulf.


Economic expansion and corporate relocations (Tesla, Hewlett Packard, Oracle are among several new corporate relocations recently announced) have fueled a large and fast growing consumer base and strong housing market which has translated to new import distribution centers in Houston and throughout Texas. Combined with the biggest manufacturing region in the North America for exports, Houston and the U.S. Gulf is a prime area for carrier service growth.

In its service network announcement for 2021, member carriers of THE Alliance which include Ocean Network Express (ONE), Hapag-Lloyd, Hyundai Merchant Marine (HMM) and Yang Ming Line have stated they are, “launching the East Coast Loop 6 (EC6), the first service within THE Alliance network to directly and seamlessly connect the US Gulf with important ports in Asia.”

“With the introduction of the EC6, HMM is delighted to add direct coverage between Asia and Port Houston to our expanding global service portfolio,” said Jay Y. Lee, Chairman and CEO, HMM (America) Inc. “The EC6 will allow us to better serve our current customers who have voiced their desire for options between the US Gulf and Asia as well as open up a growing market for us,” continued Mr. Lee.

Among the nation’s top container ports, Port Houston was 2019’s fastest-growing, according to data from maritime sector data vendor IHS Markit PIERS. Port Houston nearly hit the 3 million mark for twenty-foot equivalent units last year, recording 2,987,291 TEUs and is on track to approach the same record for 2020 despite the pandemic.

“We are very excited about the start of this new service by THE Alliance. It offers our regional exporters and importers new options,” Executive Director Roger Guenther said. “We look forward to providing them great efficiencies through our modern facilities.”

“Port Houston’s strategy of relentless focus on customer service and continued investment in terminal capacity allows it to seamlessly handle double digit growth in container volumes,” stated Guenther.

Port Houston is a prominent import gateway with a growing population base that is adding to customer demand. Loaded imports at Port Houston grew 5% in 2019, driven by a broad spectrum of companies from sectors including retail, alternative energy, food and beverage, and industrial materials.

“Hapag Lloyd has had a long presence in Houston and the Gulf. The new EC6 service will provide a new premium solution to our customers in Texas, Louisiana, Alabama and the Southern United States. Port Houston is a great partner and is among the best terminal operators in North America,” stated Uffe Ostergaard, President of Hapag Lloyd, North America.

The new service launched by THE Alliance is part of an adjustment of its overall network. THE Alliance said they made changes to offer customers more capacity in trade lanes with the greatest demand. Additionally, the network has been evaluated and reconfigured to ensure better frequency, more competitive transit times and comprehensive port coverage.

The EC6 service will call the ports of Kaohsiung – Hong Kong – Yantian – Ningbo – Shanghai – Pusan – (Panama) and Houston on a weekly basis before making stops in New Orleans and Mobile before returning to Panama and onward to Kaohsiung.

About Port Houston

For more than 100 years, Port Houston has owned and operated the public wharves and terminals of the greater Port of Houston – the nation’s largest port for the foreign waterborne tonnage and an essential economic engine for the Houston region, the state of Texas and the U.S. nation. The Port of Houston supports the creation of nearly 1.35 million jobs in Texas and 3.2 million jobs nationwide, and economic activity totaling $339 billion in Texas – 20.6 percent of Texas’ total gross domestic product (GDP) – and total of $801.9 billion in economic impact across the nation. For more information, visit the website at PortHouston.com.


Contacts

Bill Hensel, Manager External Communications, Office: 713-670-2893; Mobile: 832-452-5776; E-mail: This email address is being protected from spambots. You need JavaScript enabled to view it.

LEAWOOD, Kan.--(BUSINESS WIRE)--Tallgrass Energy Partners, LP (“TEP”) announced today that the tender offer (the “Tender Offer”) commenced on December 15, 2020 to purchase any and all of the outstanding 4.75% Senior Notes due 2023 (the “Notes”), co-issued by TEP and Tallgrass Energy Finance Corp., a wholly owned subsidiary of TEP (together with TEP, the “Issuers”), expired at 5:00 p.m. New York City Time on December 21, 2020 (the “Expiration Time”).


According to Global Bondholder Services Corporation, the tender agent for the offer, valid tenders had been received at the expiration of the offer in the amount and percentage set forth in the table below.


Title of Security


CUSIP
Number


Principal
Amount
Outstanding


Principal
Amount
Tendered

Percentage of
Principal
Amount
Tendered

4.75% Senior Notes due 2023

87470LAE1/
U8302LAF5

$498,390,000

$334,430,000

67.10%

TEP expects to accept for purchase all Notes validly tendered and not validly withdrawn as of the Expiration Time and expects to make payment for any such Notes later today. The settlement date for Notes tendered pursuant to guaranteed delivery procedures is expected to be December 24, 2020.

TEP will use a portion of the proceeds from the issuance of $750 million aggregate principal amount of the Issuers’ 6.00% Senior Notes due 2030 (the “New Notes”), which is expected to close today, for the payment of all Notes to be purchased in the Tender Offer. TEP’s obligation to accept and pay for the tendered Notes is conditioned on, among other things, the closing of the offering of the New Notes (the “Notes Offering”). Subject to the completion of the Notes Offering, TEP intends to exercise its right to redeem any Notes that were not tendered in the Tender Offer. The redemption date is expected to be on or about January 21, 2021. The redemption price for the Notes will be 102.375% of the aggregate principal amount being redeemed, plus accrued and unpaid interest on the Notes redeemed to, but not including, the redemption date.

The Tender Offer was made pursuant to the terms and conditions contained in the Offer to Purchase, Letter of Transmittal and Notice of Guaranteed Delivery, copies of which may be obtained from Global Bondholder Services Corporation, by calling (866) 794-2200 (toll free) or, for banks and brokers, (212) 430-3774. Copies of the Offer to Purchase, Letter of Transmittal and Notice of Guaranteed Delivery are also available at the following web address: https://www.gbsc-usa.com/tallgrass/.

TEP has retained Wells Fargo Securities, LLC to serve as the exclusive Dealer Manager for the Tender Offer. Questions regarding the terms of the Tender Offer may be directed to Wells Fargo Securities, LLC at (toll free) (866) 309-6316 or (collect) (704) 410-4756.

This press release is neither an offer to purchase nor a solicitation of an offer to sell any Notes in the Tender Offer. In addition, this press release is not an offer to sell or the solicitation of an offer to buy any securities issued in connection with any contemporaneous notes offering, nor shall there be any sale of the securities issued in such offering in any jurisdiction in which such offer, solicitation or sale would be unlawful prior to registration or qualification under the securities laws of any such jurisdiction. This press release does not constitute a notice of redemption under the indenture governing the Notes.

About Tallgrass Energy

Tallgrass Energy is a leading energy and infrastructure company operating across 11 states with transportation, storage, terminal, water, gathering and processing assets that serve some of the nation’s most prolific crude oil and natural gas basins.


Contacts

Investor and Financial Inquiries
Andrea Attel, (913) 928-6012
This email address is being protected from spambots. You need JavaScript enabled to view it.
or
Media and Trade Inquiries
Phyllis Hammond, (303) 763-3568
This email address is being protected from spambots. You need JavaScript enabled to view it.


LUXEMBOURG--(BUSINESS WIRE)--Pacific Drilling S.A. (OTC: PACDQ) announced today that the United States Bankruptcy Court for the Southern District of Texas confirmed the First Amended Joint Plan of Reorganization of Pacific Drilling S.A. and its Debtor Affiliates Pursuant to Chapter 11 of the Bankruptcy Code (the “Plan”) on December 21, 2020.

“The Court’s confirmation of our Plan represents an important milestone in our progress towards emergence by year-end with a fully de-levered balance sheet and the capacity to deliver world class drilling services with our fleet of 6th and 7th generation drillships,” said Bernie G. Wolford, Chief Executive Officer of the Company.

In accordance with the confirmed Plan, the Company will de-lever its balance sheet by eliminating over $1 billion of funded debt obligations and have access to additional liquidity to operate going forward with approximately $100 million in cash on hand at emergence and an undrawn $80 million senior secured delayed draw term loan exit facility.

Additional information regarding the restructuring and Chapter 11 proceedings, including the Plan, can be found (i) on the Company’s website at www.pacificdrilling.com/restructuring, (ii) on a website administered by Prime Clerk, at http://cases.primeclerk.com/PacificDrilling2020, or (iii) via our dedicated restructuring information line at: +1 877-930-4314 (toll free) or +1 347-897-4073 (international).

Advisors

Greenhill & Co. is acting as financial advisor, Latham & Watkins LLP and Jones Walker LLP are serving as legal counsel, and AlixPartners is acting as restructuring advisor to the Company in connection with the restructuring. Houlihan Lokey is acting as financial advisor and Akin Gump Strauss Hauer & Feld LLP is acting as legal advisor to an ad hoc group of noteholders.

About Pacific Drilling

With our best-in-class drillships and highly experienced team, Pacific Drilling is committed to exceeding our customers’ expectations by delivering the safest, most efficient and reliable deepwater drilling services in the industry. Pacific Drilling’s fleet of seven drillships represents one of the youngest and most technologically advanced fleets in the world. For more information about Pacific Drilling, including the Chapter 11 proceedings and the Plan of Reorganization, please visit our website at www.pacificdrilling.com.

Forward-Looking Statements

Certain statements and information contained in this press release constitute “forward-looking statements” within the meaning of the safe harbor provisions of the Private Securities Litigation Reform Act of 1995, and are generally identifiable by their use of words such as “anticipate,” “believe,” “could,” “estimate,” “expect,” “forecast,” “intend,” “our ability to,” “may,” “plan,” “potential,” “predict,” “project,” “projected,” “should,” “will,” “would”, or other similar words which are not generally historical in nature. The forward-looking statements speak only as of the date hereof, and we undertake no obligation to publicly update or revise any forward-looking statements after the date they are made, whether as a result of new information, future events or otherwise.

Our forward-looking statements express our current expectations or forecasts of possible future results or events, including the timing of our expected emergence from our Chapter 11 proceedings; the future impact of the COVID-19 pandemic on our business, future financial and operational performance and cash balances; our future liquidity position and future efforts to improve our liquidity position; revenue efficiency levels; market outlook; forecasts of trends; future client contract opportunities; future contract dayrates; our business strategies and plans or objectives of management; estimated duration of client contracts; backlog; expected capital expenditures; projected costs and savings.

Although we believe that the assumptions and expectations reflected in our forward-looking statements are reasonable and made in good faith, these statements are not guarantees, and actual future results may differ materially due to a variety of factors. These statements are subject to a number of risks and uncertainties and are based on a number of judgments and assumptions as of the date such statements are made about future events, many of which are beyond our control. Actual events and results may differ materially from those anticipated, estimated, projected or implied by us in such statements due to a variety of factors, including if one or more of these risks or uncertainties materialize, or if our underlying assumptions prove incorrect.

Important factors that could cause actual results to differ materially from our expectations include: the time it may take to execute the steps required for us to emerge from our Chapter 11 proceedings and any unexpected delays of contingencies that may arise; evolving risks from the COVID-19 outbreak and resulting significant disruption in international economies, and international financial and oil markets, including a substantial decline in the price of oil during 2020, which if sustained would continue to have a material adverse effect on our financial condition, results of operations and cash flow; changes in actual and forecasted worldwide oil and gas supply and demand and prices, and the related impact on demand for our services; the offshore drilling market, including changes in capital expenditures by our clients; rig availability and supply of, and demand for, high-specification drillships and other drilling rigs competing with our fleet; our ability to enter into and negotiate favorable terms for new drilling contracts or extensions of existing drilling contracts; our ability to successfully negotiate and consummate definitive contracts and satisfy other customary conditions with respect to letters of intent and letters of award that the Company receives for our drillships; actual contract commencement dates; possible cancellation, renegotiation, termination or suspension of drilling contracts as a result of mechanical difficulties, performance, market changes or other reasons; costs related to stacking of rigs and costs to reactivate a stacked rig; downtime and other risks associated with offshore rig operations, including unscheduled repairs or maintenance, relocations, severe weather or hurricanes or accidents; our small fleet and reliance on a limited number of clients; our ability to continue as a going concern; the effects of the Chapter 11 proceedings on our operations and agreements, including our relationships with employees, regulatory authorities, customers, suppliers, banks and other financing sources, insurance companies and other third parties; the length of time that the Company will operate under Chapter 11 protection and the continued availability of operating capital during the pendency of the Chapter 11 proceedings; increased advisory costs to execute the prearranged Plan; the potential adverse effects of the Chapter 11 proceedings on our liquidity, results of operations, or business prospects; increased administrative and legal costs related to the Chapter 11 proceedings and other litigation and the inherent risks involved in a bankruptcy process; the potential effects of the delisting of our common shares from trading on the New York Stock Exchange, including how long our common shares will trade on the over-the-counter market; the potential effects of the anticipated suspension by the Company of its reporting obligations to the Securities and Exchange Commission (“SEC”); and the other risk factors described in our 2019 Annual Report on Form 10-K filed with the SEC on March 12, 2020, as updated by our Quarterly Reports on Form 10-Q as filed with the SEC on May 8, August 7, and November 6, 2020 and subsequent filings with the SEC. These documents are available through our website at www.pacificdrilling.com or through the SEC’s website at www.sec.gov.


Contacts

Investor Contact:
James Harris
Pacific Drilling S.A.
+713 334 6662
This email address is being protected from spambots. You need JavaScript enabled to view it.

Media Contact:
Amy L. Roddy
Pacific Drilling S.A.
+713 334 6662
This email address is being protected from spambots. You need JavaScript enabled to view it.

  • Nearthlab, first Korean company to enter offshore wind turbine inspection market overseas
  • Nearthlab conducts first Taiwanese autonomous drone inspection

SEOUL, South Korea--(BUSINESS WIRE)--#AI--Nearthlab, an autonomous drone solution provider for wind turbine inspection, announced today that the company successfully completed an offshore wind turbine inspection off the coast of Taiwan in partnership with Siemens Gamesa Renewable Energy and Formosa I Wind Power Ltd.


The turbines inspected in Taiwan are 6MW-class turbines with blades reaching over 75 meters. While onshore blades typically measure around 50 meters, offshore wind turbines utilize longer, larger blades to maximize operational efficiency. Offshore wind turbines are harder to inspect and repair as they have lower accessibility compared to onshore wind turbines. Drone inspection has become a favorable option for farm owners and operators, and more so for those located in the offshore sites.

Nearthlab has been accelerating its market expansion overseas beginning from the first quarter of 2020 in partnership with Siemens Gamesa Renewable Energy North America. Nearthlab’s all-in-one solution includes Nearthlab’s autonomous drone, its data management platform, and a pilot training program. Nearthlab’s data management platform, Zoomable, offers a high level of compatibility with other asset management platforms. Based on this flexibility, Nearthlab offers an inspection solution optimized for the client’s workflow.

Nearthlab is expanding the scope of its partnership with Siemens Gamesa Renewable Energy beginning with onshore wind turbine inspections in North America. Nearthlab has successfully demonstrated its capability to conduct offshore wind turbine inspections with autonomous drone technology in Taiwan. Nearthlab is also providing its all-in-one inspection solution to North America, Europe, and Japan.

About Nearthlab

Founded in 2015, Nearthlab provides AI-powered O&M solutions for the infrastructure inspection market. Nearthlab combines AI and computer vision to solve inefficiencies at inspection sites and facilitate the digital transformation of industrial asset management. With extensive experience in wind turbine blade inspection, Nearthlab’s autonomous drone takes fifteen minutes of flight time to finish the inspection for one wind turbine. Data collected from the inspection is uploaded onto Nearthlab’s data management platform, Zoomable, to be analyzed into valuable insights assisting companies to optimize their operation and maintenance procedure. Nearthlab’s portfolio spans over wind energy, oil and gas, railway, bridges, dams, and telecom towers. Leading energy corporations have selected Nearthlab as their autonomous drone solution provider. Make inspection easy with drone driven data. For more information, visit our website: https://www.nearthlab.com/ and follow us on Facebook https://www.facebook.com/Nearthlab/ and LinkedIn https://www.linkedin.com/company/nearthlab.


Contacts

Nearthlab
Dawon Lee, PR Manager
This email address is being protected from spambots. You need JavaScript enabled to view it.
Tel: +82 2 566 1574
Fax: +82 2 6935 1574

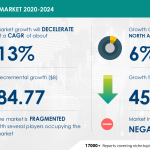
LONDON--(BUSINESS WIRE)--#GlobalFuelOilMarket--The fuel oil market is poised to decline by USD 84.77 bn during 2020-2024, decelerating at a CAGR of about 13% during the forecast period.


Worried about the impact of COVID-19 on your Business? Here is an Exclusive report talking about Market scenarios, Estimates, the impact of lockdown, and Customer Behaviour.

Get FREE Sample Report in Minutes!

The report on the fuel oil market provides a holistic update, market size and forecast, trends, growth drivers, and challenges, as well as vendor analysis.

The report offers an up-to-date analysis regarding the current global market scenario and the overall market environment. The market is driven by the rise in world energy demand.

The fuel oil market analysis includes application segment and geography landscape. This study identifies the rise in world refining capacity as one of the prime reasons driving the fuel oil market growth during the next few years.

This report presents a detailed picture of the market by the way of study, synthesis, and summation of data from multiple sources by an analysis of key parameters.

The fuel oil market covers the following areas:

Fuel Oil Market Sizing
Fuel Oil Market Forecast
Fuel Oil Market Analysis

Companies Mentioned

  • BP Plc
  • Chevron Corp.
  • Exxon Mobil Corp.
  • JXTG Holdings Inc.
  • PJSC LUKOIL
  • PT Pertamina (Persero)
  • Qatar Petroleum
  • Reliance Industries Ltd.
  • Royal Dutch Shell Plc
  • SK Innovation Co. Ltd. 

Related Reports on Energy Include:

  • Floating Power Plant Market by Technology and Geography - Forecast and Analysis 2020-2024- The floating power plant market size has the potential to grow by 1204.04 MW during 2020-2024, and the market’s growth momentum will accelerate at a CAGR of 2.38%. To get extensive research insights: Click and get FREE sample report in minutes
  • Wetgas Meters Market by Application and Geography - Forecast and Analysis 2020-2024- The wetgas meters market size has the potential to grow by USD 497.60 million during 2020-2024, and the market’s growth momentum will accelerate during the forecast period. To get extensive research insights: Click and get FREE sample report in minutes

Key Topics Covered:

Executive Summary

Market Landscape

  • Market ecosystem
  • Value chain analysis

Market Sizing

  • Market definition
  • Market segment analysis
  • Market size 2019
  • Market outlook: Forecast for 2019 - 2024

Five Forces Analysis

  • Five forces summary
  • Bargaining power of buyers
  • Bargaining power of suppliers
  • Threat of new entrants
  • Threat of substitutes
  • Threat of rivalry
  • Market condition

Market Segmentation by Application

  • Market segments
  • Comparison by application
  • Marine - Market size and forecast 2019-2024
  • Industrial - Market size and forecast 2019-2024
  • Others - Market size and forecast 2019-2024
  • Market opportunity by application

Customer Landscape

Geographic Landscape

  • Geographic segmentation
  • Geographic comparison
  • APAC - Market size and forecast 2019-2024
  • MEA - Market size and forecast 2019-2024
  • Europe - Market size and forecast 2019-2024
  • South America - Market size and forecast 2019-2024
  • North America - Market size and forecast 2019-2024
  • Key leading countries
  • Market opportunity by geography
  • Market drivers
  • Market challenges
  • Market trends

Vendor Landscape

  • Vendor landscape
  • Landscape disruption

Vendor Analysis

  • Vendors covered
  • Market positioning of vendors
  • BP Plc
  • Chevron Corp.
  • Exxon Mobil Corp.
  • JXTG Holdings Inc.
  • PJSC LUKOIL
  • PT Pertamina (Persero)
  • Qatar Petroleum
  • Reliance Industries Ltd.
  • Royal Dutch Shell Plc
  • SK Innovation Co. Ltd.

Appendix

  • Scope of the report
  • Currency conversion rates for US$
  • Research methodology
  • List of abbreviations

Technavio suggests three forecast scenarios (optimistic, probable, and pessimistic) considering the impact of COVID-19. Technavio’s in-depth research has direct and indirect COVID-19 impacted market research reports.
Register for a free trial today and gain instant access to 17,000+ market research reports.
Technavio's SUBSCRIPTION platform

About Us

Technavio is a leading global technology research and advisory company. Their research and analysis focuses on emerging market trends and provides actionable insights to help businesses identify market opportunities and develop effective strategies to optimize their market positions. With over 500 specialized analysts, Technavio’s report library consists of more than 17,000 reports and counting, covering 800 technologies, spanning across 50 countries. Their client base consists of enterprises of all sizes, including more than 100 Fortune 500 companies. This growing client base relies on Technavio’s comprehensive coverage, extensive research, and actionable market insights to identify opportunities in existing and potential markets and assess their competitive positions within changing market scenarios.


Contacts

Technavio Research
Jesse Maida
Media & Marketing Executive
US: +1 844 364 1100
UK: +44 203 893 3200
Email: This email address is being protected from spambots. You need JavaScript enabled to view it.
Website: www.technavio.com/

12th annual California Green Innovation Index finds state must achieve five percent emissions reductions each year through 2030 as recession persists

Heavy-duty transportation, case studies of local pollution reduction projects illustrate potential of programs to be scaled

SAN FRANCISCO--(BUSINESS WIRE)--California’s stand out progress reducing greenhouse gas emissions has temporarily reversed, with pollution upticks signaling an increasingly difficult path ahead in achieving the state’s 2030 and 2050 climate targets. That’s the finding of the 12th annual California Green Innovation Index—released by the nonpartisan nonprofit Next 10 and prepared by Beacon Economics.


This year’s Index finds that 2018 greenhouse gas emissions—the latest year for which data are available—rose overall for the first time since 2012, driven in part by increases in the power and commercial sectors. Data from the report illustrate that California now must reduce emissions by an average of 4.9 percent each year from 2020 to 2030 to cut emissions to 40 percent below 1990 levels by 2030, as mandated by SB 32. The largest one-year emissions drop California has ever achieved was at the height of the Great Recession in 2009, when climate pollution fell 6.1 percent. While 2020 may see a similar emissions drop, the state has never cut emissions more than 2.6 percent in a year while not experiencing an economic downturn since California passed AB 32 in 2006. Now the state must double that each year. In this way, the 2020 Index illustrates the many complex challenges that state leaders face in prioritizing policies to combat the climate crisis this decade.

“This year’s Index highlights just how much things need to change,” said F. Noel Perry, businessman and founder of Next 10. “Programs instituted in the past decade may not achieve the gains we need in the coming decade. The fact is, we’ve never come anywhere near cutting emissions five percent in a single year in a period of economic stability—and yet, in order to meet our climate goal by 2030, we have to. But, if any state can achieve this level of reductions while supporting a healthy economy, it’s California.”

The report emphasizes how a steady rise in commercial emissions, a surprise uptick in power sector emissions, and—for the first time in three years—a dip in transportation pollution, illustrate some of the challenges and opportunities facing policymakers. It also comes as the California Air Resources Board welcomes a new chair and several new board members who are now tasked with steadily cutting emissions in a manner that has never been achieved.

“California has a solid history of reducing emissions while growing the economy, up until this slight increase in 2018. That’s an important achievement,” said Hoyu Chong, practice lead for sustainable growth and development at Beacon Economics. “We now need to ramp up those efforts in the face of major emissions and economic challenges. Investment breeds investment—so a recovery program that includes clean energy stimulus investments may be exactly what we need for a reset that enables us to scale solutions to these competing crises together.”

Key findings of this year’s Green Innovation Index include:

  • Total emissions rose 0.83 million metric tons of carbon dioxide-equivalent (MMTCO2e) to 425.3 MMTCO2e (+0.2%) in 2018 compared to 2017. This level is still below the state’s first climate milestone (2020’s AB 32 goal, met four years early in 2016) of reducing to 431 MMTCO2e below 1990 levels.
  • While the transportation sector saw a reduction in emissions from 2017 to 2018 (-0.9%), emissions rose in all other economic sectors in 2018: Agriculture & Forestry (+0.8%), Commercial (+2.1%), Electricity Power (+1.5%), Industrial (+0.7%), and Residential (+0.3%).
  • Despite the slight increase in emissions of 0.2 percent, the state has managed to continue to reduce its carbon intensity—emissions relative to GDP— by 3.2 percent from 2017 to 2018 thanks to a strong growth in real GDP.
  • At the current trajectory, the state will take significantly more time to reach the 2030 and 2050 emissions goals than it did to reach the 2020 goal. Assuming the same three-year average rate of reduction from 2015 to 2018 (-1.18%), California needs to quadruple the rate of reduction to achieve the 2030 goal and ramp up that rate of reduction even more to achieve the 2050 goal.
  • California’s energy-related emissions were 9.1 MTCO2e per person in 2017—the third-lowest among the 50 states, behind New York and Maryland.

POWER AND COMMERCIAL SECTOR EMISSIONS INCREASES WORRISOME

The electric power sectors (imports and in-state generation), which have reliably and significantly reduced emissions since 2008 (-47.4% from 2008 to 2018), actually increased slightly in 2018, driven by a decrease in electricity generated by large hydroelectric sources and an increase in generation from natural gas compared to 2017. This was especially true for merchant-owned electricity generation in-state. Imported generation from unspecified sources accounted for an even greater increase in emissions—increasing by 31 percent in 2018.

At the current pace, the state should meet the 50 percent and 60 percent RPS goals by 2026 and 2030, respectively—requiring an increase in renewable generation of 2.6 percent each year from 2019 to 2026 and by 2.5 percent annually from 2026 to 2030.

However, in March 2020, as part of the state’s next cycle for energy resource planning, the California Public Utilities Commission voted to approve a target to reduce emissions for the electric sector to 46 million metric tons carbon dioxide-equivalent (MMTCO2e) by 2030, and instructed energy load providers in the state to also plan for an alternative scenario of a 38 MMTCO2e reduction target by the same year. The Index finds the approved 46 MMTCO2e scenario could hamper the momentum that California’s electric sector has gained in the last several years—and that even the 38 MMTCO2e target may be too high, forcing the electricity sector to rely on achieving steeper emissions, and increasing the use of renewables, in later years.

“Reaching our long-term climate goals is like saving for retirement—the earlier you start to save, the more you have in the bank, and the less work you have to do down the road,” said Chong. “We can’t keep punting the emissions burden, particularly in the power sector. We need to spur innovation in this sector now—with a ramping up of renewable resources plus storage solutions like long-duration storage, so that we don’t risk forcing ourselves into a dramatic and unachievable sprint at the end.”

Replacement of ozone depleting substances causes commercial sector emissions to skyrocket

Compared to 2017, the commercial sector experienced the largest one-year emissions increase (+2.7%) of any sector, and emissions in this sector have shot up 69.3 percent since 2000, with no sign of slowing down. The continuous uptick is primarily due to adoption of carbon-intensive HVAC and refrigeration technologies that came to replace ozone-depleting substances (ODS) phased out decades ago via the Montreal Protocol.

The technologies that replaced hydrofluorocarbons (HFCs) and perfluorocarbons (PFCs) now represent the fastest-growing source of global warming pollution in California—accounting for 4.7 percent of total statewide emissions in 2018—a considerably larger share compared to 2008 (2.3%) and 2000 (1.2%). Internationally, there have been efforts to address this emissions problem (via the Kigali Amendment to the Montreal Protocol, which entered into force in January 2019) by creating market certainty to allow growth of more environmentally friendly alternatives.

The United States has not yet ratified that agreement, but president-elect Biden has indicated plans to do so. And at the state level, California has implemented a number of programs and policies to help transition away from these “super pollutant” refrigerants – including the recent announcement of a new rule that will require all new facilities to use refrigerants that can reduce their emissions by up to 90 percent beginning in 2022. While the California Air Resources Board had recently warned that the state may not be able to meet its 40 percent below 2013 levels reduction goal for these substances by 2030, this new rule could go a significant way in reducing emissions from refrigeration and commercial sector emissions overall.

“We’re encouraged that the ARB has recently announced new standards for reducing the use of these harmful “super polluting” substances,” said Perry. “Businesses have expended significant capital on these technologies that have a long life-span, so the more we can work to scale innovative programs and incentives to move to cleaner technologies, the faster we can help lead a market transformation away from these harmful pollutants.”

California’s record-breaking wildfire season also adds to the complicated picture. As of September 13, 2020, emissions from wildfires reached 83 MMTCO2e—82.4 percent above the 45.5 MMTCO2e recorded for wildfire emissions in 2018. While the state’s forests also serve as a carbon sink, the increasing threat of wildfires and the kind of mega-fires experienced in 2020 pose a significant emissions challenge—not to mention the impacts of particulate matter pollution, which further worsen air quality throughout the state.

TRANSPORTATION BRIGHT SPOT TACKLES DEADLY PARTICULATE POLLUTION, MORE MUST BE DONE TO TRANSITION TO ELECTRIC VEHICLES

The Transportation sector remains by far the largest emitting sector in California, but its share of emissions dropped from an all-time high of 41.3 percent in 2017 to 40.9 percent in 2018—driven by a large drop in heavy-duty vehicle pollution.

All three subsectors of on-road heavy-duty vehicles had reductions in emissions: Heavy-duty Trucks (-4.0%), Buses (-4.6%), and Motorhomes (-3.6%). This sector represents an increased area of opportunity thanks to the Advanced Clean Trucks standard that was adopted by the Air Resources Board in July 2020, which will increase the sale of zero-emission trucks in coming years. On the horizon is the Advanced Clean Fleet standard that is set to be voted on by CARB in late 2021, which will set standards for fleet electrification to align with the manufacturing targets.

But while gains have been made in heavy-duty, emissions from off-road vehicles and light-duty vehicles remain a significant challenge.

Transportation Key Findings

  • Within the transportation sector, emissions dropped 1.3 percent from the on-road vehicles subsector, but increased 3.6 percent from off-road vehicles, which includes airport ground equipment, construction and mining equipment, industrial equipment and oil drilling equipment.
  • While the amount of transportation fuel consumed in 2018 was similar to levels from ten and fifteen years prior, emissions from transportation fuel in 2018 were 3.3 percent lower and 8.3 percent lower than 2008 and 2003, respectively. This is the result of policies promoting cleaner vehicle fuels and advanced clean vehicle standards.
  • Notably, emissions of buses decreased from 2017 to 2018 despite a slight uptick in the vehicle revenue miles of buses (+0.5%). This is plausibly due to bus fleets becoming cleaner or electrified. Likewise, there exists vast opportunities to electrify heavy-duty trucks.
  • California is on-track to meet its 2025 ZEV target, but at the current pace of adoption, will not meet the goal of five million zero-emission vehicle on-road by 2030.
  • Light-duty vehicles emissions went down slightly from 2017 to 2018 (-0.5%), but the overall trend for the last five years is still up (+6.6%).

“Gov. Newsom’s executive order calling for 100 percent zero-emission vehicle sales by 2035 is a great market signal,” said Perry. “But obstacles to ZEV adoption remain, and new ones have arisen, with waning federal subsidies and a lack of charging stations. The good news is that the market is finally offering a full line-up of electrified vehicles. Registrations of electric pickups and SUVs increased almost 40 percent compared to 2018—almost double the increase for cars.”

GREEN STIMULUS FOR PANDEMIC RECOVERY COULD BE CALIFORNIA’S BEST BET TO GAIN GROUND

California has already demonstrated that reduction of emissions can occur alongside economic growth, and recent history suggests the inclusion of green investments in economic stimulus packages leads to employment and output growth. The report finds that the state would greatly benefit from long-term funding for programs that produce local emissions reductions while spurring jobs and economic growth, rather than relying solely on cap-and-trade revenue for these projects, given budget shortfalls of 2020.

“Our data show that we should be wary of letting the pandemic derail critical initiatives that support clean technology markets,” said Perry. “Investing in a clean energy stimulus now can play an instrumental role in jumpstarting California’s economy. Clean energy economy spending IS, in fact, economy-wide stimulus spending.”

Investment drives investment, stimulating positive ripple effects throughout local economies

The report assessed the employment, labor income, and economic outputs expected from several green stimulus projects. The model used to analyze the projects measured the market transactions between businesses, between businesses and consumers, as well as the ripple effects on downstream industries.

“Investment can become self-sustaining, creating waves of positive economic stimulus throughout the community,” said Chong. “Policymakers can do more to replicate these projects across the state to help improve the economy for all Californians.”

Stimulus project analysis findings include:

  • With a total of $23.1 million in project funding, the City of Los Angeles’ BlueLA car share program, which aims to reduce emissions by extending access to electric vehicles (through carshares, vanpools, and shuttle services) in disadvantaged communities most affected by pollutants—airborne and otherwise, is expected to generate $7.1 million in labor income, $24.9 million in economic output, $1.6 million in state and local tax revenue, and support 108 jobs in the City of Los Angeles.
  • With a total of $70.8 million in funding, the Sustainable Agricultural Lands Conservation Program (SALC) Program, which aims to reduce GHG emissions by protecting agricultural lands against conversion to more GHG-intensive uses through conservation easement and planning grants is expected to generate $31.7 million in labor income, $94.0 million in output, $6.2 million in state and local tax revenue, and support 514 jobs in California.
  • With a total of $11.4 million in funding, the Low-Income Weatherization Program (LIWP), which provides low-income households (located in either multifamily, community - or farmworker housing) with energy efficiency upgrades and solar photovoltaic systems to help reduce residential emissions, is expected to generate $8.9 million in labor income, $22.9 million in output, $1.0 million in state and local tax revenue, and support 116 jobs in California.

The report outlines opportunities for policymakers to expand the economic potential of green stimulus projects in the coming months to reduce emissions and generate a clean economy growth post-pandemic. Example below:

  • Prior to the COVID-19 outbreak, the California Energy Commission awarded a one-time $51 million payment (and up to $200 million over time) to the California Electric Vehicle Infrastructure Project (CALeVIP) to fund four large-scale EV charging infrastructure projects in Northern California (Humboldt, Shasta and Tehama counties), Sacramento County, Fresno County, and Southern California (Los Angeles, Orange, Riverside, and San Bernardino counties). These projects are projected to add nearly 3,900 EV charging stations, the construction of which would support 447 jobs, and generate $32.7 million in labor income, $92.4 million in economic output, and $4.1 million in state and local tax revenue.

Private sector investment can also drive green stimulus

Despite decreased investment in transportation and wind power, California still captured 51 percent of the U.S.’ total $6 billion in clean tech venture capital investment in 2019, as large gains were made at companies that focus on geothermal, smart grid, and hydroelectric technologies.

Clean Technology Key Findings

Clean Technology Investment

  • Compared to 2018, the dollar amount investment in California clean tech firms decreased significantly in 2019 (-39%), totaling $3.1 billion —with $1.25 billion of that total investment attributed to a single deal from Faraday Future, a leading electric vehicles company.
  • The average investment amount has gone down. In 2019, the average deal in California was $18.5 million (down from $27 million in 2018) compared to $11 million in the U.S. overall (down from $15 million in 2018).
  • Despite the economic impacts induced by the COVID-19 pandemic, total clean tech investment through mid-August 2020 ($2.8 billion) was close to the total amount of clean tech VC investment through all of 2019 ($3.1 billion).

California Clean Technology Investment by Segment

  • The largest increase in dollars between 2018 and 2019 invested was in Geothermal, which saw an increase from nothing in 2018 to over $11 million in 2019. This was followed by Smart Grid, which saw a 360 percent increase, and Hydropower, which saw an 81 percent increase.
  • Though two transportation companies––Faraday Future and Joey Aviation––each represent the largest clean tech deals of 2019 and 2020 respectively, there has been an overall decline in investment in companies that specialize in transportation.
  • The three largest clean tech deals in 2019 were all transportation-related: Faraday Future ($1.25 billion), RomeoPower ($92 million), and Proterra ($75 million).

Raw material potential to store California’s clean energy

The report calls special attention to the potential for California’s Salton Sea to be a new source for lithium development, noting that it could provide up to a third of the world’s current lithium demand, according to some estimates, and up to $860 million annually in revenues. The report also highlights notable investments in lithium recovery in California this year.

EMISSIONS VS. OVERALL ECONOMIC GROWTH

In summary, the 12th annual California Green Innovation Index finds that since the passage of California's landmark climate bill, AB 32, the state has achieved a great deal of emissions reductions primarily through the power sector, but significant hurdles must be overcome to reduce emissions in harder-to-reach sectors such as transportation and buildings.

“It’s been a difficult year full of competing critical and wide-reaching challenges. We’ve been forced to look at the embedded issues in our state and across the country to reflect on how we build a better future for all our citizens,” said Perry. “When we recognize the interdependence between our environment, our health, and our economy, then we can finally prioritize the necessary progress on climate and clean energy that will help us thrive in a post-pandemic world and improve the livelihoods of all Californians.”

About Next 10

Next 10 is an independent, nonpartisan, nonprofit organization that educates, engages and empowers Californians to improve the state’s future. With a focus on the intersection of the economy, the environment, and quality of life, Next 10 employs research from leading experts on complex state issues and creates a portfolio of nonpartisan educational materials to foster a deeper understanding of the critical issues affecting our state.


Contacts

Christina Heartquist
408-661-2666
This email address is being protected from spambots. You need JavaScript enabled to view it.

TAIPEI, Taiwan--(BUSINESS WIRE)--CPC Corporation, Taiwan (CPC) has been exploring for oil in Africa for decades. In 2006, it signed a contract with Chad’s Ministry of Petroleum and Energy under the name of OPIC Africa. In 2011, it discovered a large amount of crude oil at the first well. In 2017, it was granted the development and production license for the Oryx Concession. It conducted trial production in February 2020. In October 2020, the first cargo of oil produced from Oryx Concession — a tanker carrying about 950,000 barrels of crude oil — departed from the Kribi terminal in Cameroon and arrived in Taiwan at the end of November. On December 1, CPC held a ceremony to celebrate the first cargo of Chadian crude oil arriving in Taiwan at the Dalin Refinery operated by CPC’s Refining Business Division, to announce the latest results of its overseas petroleum exploration project.


CPC Chairman Jerry Ou said at the ceremony: “The Chad Oryx Concession is the first time that CPC has conducted exploration overseas as an operator and entered into development and production phase. This shows that CPC has the capacity to manage the whole life cycle of petroleum exploration and production project by itself. In the future, CPC will replicate its successful experience in Chad and will continue to expand overseas exploration areas to help achieve energy independence for Taiwan.”

Over the past 40 years, CPC has participated in global exploration as well as mergers and acquisitions. In recent years, it has achieved brilliant accomplishments in Africa, Australia, South America, and Southeast Asia, all of which increased Taiwan’s ability to maintain national energy security. CPC will continue to work towards the vision of building itself into an international petroleum upstream sector business with a high asset value.

The seismic surveys, drilling, development and production of the Chad Oryx Concession are all managed by CPC. The company is proud of its expertise in geoscience, oil well drilling and geological modeling technology. Its international export technical services and the technology for oilfield development planning also can be shared with the international community.

Established 74 years ago, CPC is Taiwan’s largest energy group and is listed in Fortune’s Global 500. It is an integrated energy group covering the upper, middle and downstream petroleum industries.


Contacts

Luo Tsuei-yi
886-2-5051180 ext.680
This email address is being protected from spambots. You need JavaScript enabled to view it.

DUBLIN--(BUSINESS WIRE)--The "Compressed Air Energy Storage - Global Market Trajectory & Analytics" report has been added to ResearchAndMarkets.com's offering.


The publisher brings years of research experience to the 9th edition of this report. The 125-page report presents concise insights into how the pandemic has impacted production and the buy side for 2020 and 2021. A short-term phased recovery by key geography is also addressed.

Global Compressed Air Energy Storage Market to Reach US$6.6 Billion by the Year 2027

Amid the COVID-19 crisis, the global market for Compressed Air Energy Storage estimated at US$1.5 Billion in the year 2020, is projected to reach a revised size of US$6.6 Billion by 2027, growing at a CAGR of 24% over the analysis period 2020-2027.

Renewable Energy Integration, one of the segments analyzed in the report, is projected to grow at a 24.3% CAGR to reach US$2.9 Billion by the end of the analysis period. After an early analysis of the business implications of the pandemic and its induced economic crisis, growth in the Grid Optimization segment is readjusted to a revised 20.6% CAGR for the next 7-year period. This segment currently accounts for a 28.8% share of the global Compressed Air Energy Storage market.

The U.S. Accounts for Over 29.9% of Global Market Size in 2020, While China is Forecast to Grow at a 23.4% CAGR for the Period of 2020-2027

The Compressed Air Energy Storage market in the U.S. is estimated at US$438 Million in the year 2020. The country currently accounts for a 29.92% share in the global market. China, the world second largest economy, is forecast to reach an estimated market size of US$1.1 Billion in the year 2027 trailing a CAGR of 23.4% through 2027. Among the other noteworthy geographic markets are Japan and Canada, each forecast to grow at 21.5% and 20.4% respectively over the 2020-2027 period. Within Europe, Germany is forecast to grow at approximately 16.8% CAGR while Rest of European market (as defined in the study) will reach US$1.1 Billion by the year 2027.

T&D Deferral Segment Corners a 28.3% Share in 2020

In the global T&D Deferral segment, USA, Canada, Japan, China and Europe will drive the 26.6% CAGR estimated for this segment. These regional markets accounting for a combined market size of US$331.6 Million in the year 2020 will reach a projected size of US$1.7 Billion by the close of the analysis period. China will remain among the fastest growing in this cluster of regional markets. Led by countries such as Australia, India, and South Korea, the market in Asia-Pacific is forecast to reach US$777.5 Million by the year 2027.

Competitors identified in this market include, among others:

  • AES Energy Storage LLC
  • ALMiG Kompressoren GmbH
  • Alstom Power, Inc.
  • Ambri, Inc.
  • American Precision Industries (API)
  • American Vanguard Corporation
  • Ansaldo Energia SpA
  • Atlas Copco Energas GmbH - Atlas Copco Gas and Process Division
  • Babcock Power Inc.
  • Bauer Kompressoren Group
  • Brayton Energy, LLC
  • BTEC Turbines LP
  • Dresser-Rand Group, Inc.
  • Elliott Company
  • GE Energy
  • General Compression Limited
  • Hydrostor Inc.
  • LightSail Energy
  • MAN Diesel & Turbo SE
  • Maxwell Technologies, Inc.
  • Pacific Gas and Electric Company
  • Parker Hannifin India Pvt. Ltd.
  • R&D Dynamics Corporation
  • Siemens Energy
  • Solar Turbines, Inc.
  • SSS Gears Limited

Key Topics Covered:

I. INTRODUCTION, METHODOLOGY & REPORT SCOPE

II. EXECUTIVE SUMMARY

1. MARKET OVERVIEW

  • Impact of COVID-19 and a Looming Global Recession
  • Global Competitor Market Shares
  • Compressed Air Energy Storage Competitor Market Share Scenario Worldwide (in %): 2018E

2. FOCUS ON SELECT PLAYERS

3. MARKET TRENDS & DRIVERS

4. GLOBAL MARKET PERSPECTIVE

III. MARKET ANALYSIS

IV. COMPETITION

  • Total Companies Profiled: 46

For more information about this report visit https://www.researchandmarkets.com/r/eegsib


Contacts

ResearchAndMarkets.com
Laura Wood, Senior Press Manager
This email address is being protected from spambots. You need JavaScript enabled to view it.
For E.S.T Office Hours Call 1-917-300-0470
For U.S./CAN Toll Free Call 1-800-526-8630
For GMT Office Hours Call +353-1-416-8900

LONDON & OSLO, Norway--(BUSINESS WIRE)--Bulk Infrastructure Holding AS, a Nordic data center, fiber network developer and operator, and logistics real estate developer, announced a new partnership with BentallGreenOak (BGO), a global real estate investment manager, as a strategic partner and investor. BentallGreenOak has committed NOK 1.5 billion (approximately €140 million) to support the future growth of Bulk Infrastructure’s core lines of business.


BentallGreenOak joins main shareholders, Bulk Industrier and Geveran, in securing capital for the company’s future growth, with a series of capital injections from BGO and existing shareholders that will take place from January, 2021. John Carrafiell, Senior Managing Partner and Co-founder of BentallGreenOak, will join Bulk Infrastructure’s Board of Directors, and founder, Peder Nærbø, and his company Bulk Industrier, will continue to work actively within the company and remain the lead investor and Chairman of the Board. Bulk Infrastructure’s capital-intensive investments are advancing scalable, sustainable solutions in infrastructure and real estate that are poised to make long-lasting, positive impacts to the environment.

Bulk Infrastructure, in partnership with BentallGreenOak, expects to invest in the continuing development of its N01 Data Center Campus in south Norway. At 3 million sqm (740 acres) and up to 1 GigaWatt of IT power, N01 Campus has the ambition to become the world’s largest data center campus powered by 100% renewable energy. This data center campus provides integral access to Bulk Infrastructure’s recently completed Havfrue fiber cable, the first trans-Atlantic subsea cable system into the Nordics in almost two decades, providing unparalleled connectivity between Northern Europe and the U.S. Bulk Infrastructure’s planned new cable project, called Leif Erikson, between Norway and Atlantic Canada will further improve connectivity, and build on BGO’s strong position and history in the Canadian market.

We want to unlock the potential the Nordics and renewable energy has to offer in sustainable digital infrastructure,” says Peder Nærbø, founder of Bulk Infrastructure. “With a top tier international investor like BentallGreenOak in our company, we will enable faster growth and better scale for our opportunities,” the founder continues. “This provides us with a great platform for reaching our vision of bringing sustainable infrastructure to a global audience, and to serve the biggest and most demanding customers out there,” says Nærbø.

This partnership with Bulk Infrastructure is a perfect match for BGO,” says Senior Managing Partner and Co-founder of BentallGreenOak, John Carrafiell. “BGO has been focused on the European logistics market since 2013, and, similar to Bulk's own evolution, considers data centers to be a natural extension of the firm’s real estate investment strategy. Bulk Infrastructure's commitment to building on the Nordic region's natural advantages to deliver strong economic and environmental performance in real estate and infrastructure, is well-aligned with BGO's own investment priorities. We are pleased to be developing exciting new pathways, on behalf of our investors, that deliver performance-driven investment opportunities that also benefit the local economy and maintain a focus on environmental sustainability.”

This partnership provides us with a solid financial platform as Bulk Infrastructure is opportunity rich in all three business areas. As an example, we see opportunities for major capacity add in our three existing Data Center campuses as well as in other Nordic destinations. Bulk Infrastructure’s combination of reliable and cost-effective access to 100% green power from renewable sources, cold climate, stable business environment, and well-positioned fiber optic network, is uniquely situated to attract a significant share of the rapidly growing European and global data center market,” says Bulk Infrastructure CEO, Jon Gravråk.

Arctic Securities, Pareto Securities, PwC and Schjødt served as advisors to Bulk Infrastructure on the partnership and BentallGreenOak were advised by Wiersholm and EY.

About Bulk Infrastructure

Bulk Infrastructure is a leading provider of sustainable digital infrastructure in the Nordics. We are an industrial investor, developer and operator of industrial real estate, data centers and dark fiber networks. We believe in the value creation opportunity of enabling our digital society to be fully sustainable. Our ambition is to be the go-to player for anyone that wants to leverage the Nordics for data processing requirements of the future. We have a track record of delivering high quality and cost-effective customer solutions with short time to market. Hence our vision: Racing to bring sustainable infrastructure to a global audience.

Bulk Industrial Real Estate maintains a landbank of strategic locations for industrial real estate projects in Norway, Sweden and Denmark. Based on standard designs, we develop, build and operate warehouse buildings, cross dock terminals and other industrial facilities.

Bulk Data Centers delivers strategically located Nordic data centers and a dedication to service excellence that enable customers to reduce costs and environmental impact with ultra-flexible, highly connected and scalable solutions. 

Bulk Fiber Networks connects the Nordics with the world’s major markets via low-latency and high-capacity fiber networks. We build and operate international and intra-Nordic fiber infrastructure that is designed to meet the large-scale data transport needs of the future.

About BentallGreenOak

BentallGreenOak is a leading, global real estate investment management advisor and a globally recognized provider of real estate services. BentallGreenOak serves the interests of more than 750 institutional clients with approximately $50 billion USD of assets under management (as of September 30, 2020) and expertise in the asset management of office, logistics, multi-residential and retail property across the globe. BentallGreenOak has offices in 24 cities across twelve countries with deep, local knowledge, experience, and extensive networks in the regions where we invest and manage real estate assets on behalf of our clients.

In Europe, BentallGreenOak is a leading investment manager with over 50 professionals and $5.2 billion USD in AUM across debt and equity, with strategies spanning from Core to Value-Add and Development, with its own internalised operating capability. The firm has acquired or developed over 133 logistics assets comprising 4.8 million square meters (52 million square feet) since 2015. BentallGreenOak’s investment vehicles have assembled a large and diversified land bank across Europe, currently owning or controlling 4.4 million square meters of land (capable of building 2.2 million square meters of space) zoned for Logistics, Data Centers and Cold Storage.

BentallGreenOak is a part of SLC Management, which is the institutional alternatives and traditional asset management business of Sun Life.

The assets under management shown above include real estate equity and mortgage investments managed by the BentallGreenOak group of companies and their affiliates.

For more information, please visit www.bentallgreenoak.com

About Geveran

Geveran Trading Co. Limited ("Geveran"), a company indirectly controlled by trusts established by Mr John Fredriksen for the benefit of his immediate family, invested in Bulk Infrastructure in 2018 and currently has an ownership stake of approximately 14%.

About Bulk Industrier

Bulk Industrier AS is an industrial investment company of Norwegian entrepreneur Peder Nærbø (Naerboe). The company focus on investments that create sustainable solutions with scalable impact. Bulk Industrier is the controlling shareholder to Bulk Infrastructure AS where Mr Naerboe conducts his active leadership as a business and industry developer.


Contacts

Media Contacts
Mr. Lars Hognestad
Senior Manager Group Communications
Bulk Infrastructure
This email address is being protected from spambots. You need JavaScript enabled to view it.
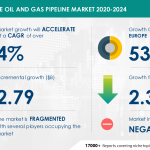
Mr. Rahim Ladha
Vice President, Corporate Communications
BentallGreenOak
This email address is being protected from spambots. You need JavaScript enabled to view it.

Project 11 included in Water Resources Development Act Legislation

HOUSTON--(BUSINESS WIRE)--On Monday, Congress passed the 2020 Water Resources Development Act. The bill formally authorized the expansion of the Houston Ship Channel, which was recently ranked the #1 U.S. Port in total waterborne tonnage. The channel is the busiest waterway in the nation averaging 50 deep-draft vessel transits every day. These are just the latest milestones reached by the busiest waterway in the nation, averaging 50 deep-draft vessel transits every day.


“Today’s announcement is BIG. The authorization to widen and deepen the Houston Ship Channel is BIG for our region, the state of Texas, and our nation,” said Executive Director Roger Guenther. “It is BIG for economic prosperity and growth of industry that is served by the busiest waterway in the country.”

The Houston Ship Channel and the public and private terminals along it moved nearly 285 million tons of cargo in 2019. That was almost 47 million tons more than any other U.S. port and a 6% increase compared to the previous year. To support this vital waterway’s continued growth, planning for the deepening and widening of the Houston Ship Channel has been Port Houston’s top priority for nearly a decade.

The Houston Ship Channel expansion, known as Project 11, will widen and deepen the channel for safer and more efficient navigation of vessels calling the port.

The project also includes new environmental features to benefit channel users. “Project 11 is expected to improve regional air quality by increasing the efficiency of vessel movements and reducing potential congestion along the Houston Ship Channel. New bird islands and oyster reefs will be created as part of the project,” Port Houston Chairman Ric Campo said. “The bottom line is an expanded channel that will positively impact the flow of goods in and out of our region.”

The Houston Ship Channel supports 3.2 million jobs in the nation, with 1.35 million in Texas, and nationwide economic impact totaling $802 billion.

As the Houston Ship Channel’s non-federal sponsor, Port Houston has been the waterway’s advocate and strategic leader working in partnership with the United States Army Corps of Engineers. Expansion of the channel has been Port Houston’s top priority for nearly a decade.

“Today’s WRDA success didn’t happen overnight – it took many years of planning,” Guenther said, in appreciation to all partners and stakeholders for their support of the effort.

Along with Port Houston’s eight public terminals, there are more than 200 private facilities along the channel, and many of these stakeholders have actively participated in driving the expansion project forward.

Chairman Campo added his congratulations to everyone “for driving this change forward and for leading the way toward progress that will help the Houston Ship Channel remain the economic powerhouse it is today.”

Guenther said that steps remain to reach the start of construction and emphasized that passage of the WRDA bill is significant, “but our work is not done.”

Guenther explained that after WRDA is enacted, the next step in the project delivery process will be to secure a ‘New Start’ designation from the Administration and discretionary funding from the Corps of Engineers. “Over the next couple of months, our teams will be advocating to achieve this next benchmark,” he said.

“As the advocate and a strategic leader of the Houston Ship Channel, we are a steward of progress. But we aren’t doing it alone,” Guenther said. “It takes a lot of support to be included in a WRDA bill, and this exciting step would not have been possible without the support of so many, and we are especially grateful to all the elected officials who have been vital to this effort.”

Port Houston produced a special video on the importance of the channel expansion project and appreciation to all the elected officials, partners, and stakeholders involved in bringing Project 11 to this milestone https://protect-us.mimecast.com/s/VizBCQWgmzIyjMPhxLuCt?domain=youtu.be.

About Port Houston

For more than 100 years, Port Houston has owned and operated the public wharves and terminals along the Houston Ship Channel – the nation’s largest port for waterborne tonnage and an essential economic engine for the Houston region, the state of Texas, and the U.S. nation. The more than 200 private and eight public terminals along the federal waterway supports the creation of nearly 1.35 million jobs in Texas and 3.2 million jobs nationwide, and economic activity totaling $339 billion in Texas – 20.6% of Texas’ total gross domestic product (GDP) – and a total of $801.9 billion in economic impact across the nation. For more information, visit www.PortHouston.com.


Contacts

Lisa Ashley, Director, Media Relations, Office: 713-670-2644; Mobile: 832-247-8179; E-mail: This email address is being protected from spambots. You need JavaScript enabled to view it.

HOUSTON--(BUSINESS WIRE)--ConocoPhillips (NYSE: COP) today announced a new oil discovery in production license 891 on the Slagugle prospect located 14 miles north-northeast of the Heidrun Field in the Norwegian Sea. ConocoPhillips Skandinavia AS is operator of the license with 80 percent working interest. Pandion Energy AS is license partner with 20 percent working interest.


Preliminary estimates place the size of the discovery between 75 million and 200 million barrels of recoverable oil equivalent. Extensive data acquisition and sampling has been carried out in the discovery well 6507/5-10, and future appraisal will be conducted to determine potential flow rates, the reservoir’s ultimate resource recovery and potential development plan.

“This discovery marks our fourth successful exploration well on the Norwegian Continental Shelf in the last 16 months,” said Matt Fox, executive vice president and chief operating officer. “All four discoveries have been made in well-documented parts of the North Sea and the Norwegian Sea and offer very low cost of supply resource additions that can extend our more than 50-year legacy in Norway.”

The discovery well was drilled in 1,165 feet of water to a total depth of 7,149 feet by the Leiv Eiriksson drilling rig.

--- # # # ---

About ConocoPhillips

Headquartered in Houston, Texas, ConocoPhillips had operations and activities in 15 countries, $63 billion of total assets, and approximately 9,800 employees at Sept. 30, 2020. Production excluding Libya averaged 1,108 MBOED for the nine months ended Sept. 30, 2020, and proved reserves were 5.3 BBOE as of Dec. 31, 2019. For more information, go to www.conocophillips.com.

CAUTIONARY STATEMENT FOR THE PURPOSES OF THE "SAFE HARBOR" PROVISIONS OF THE PRIVATE SECURITIES LITIGATION REFORM ACT OF 1995

This news release contains forward-looking statements as defined under the federal securities laws. Forward-looking statements relate to future events and anticipated results of operations, business strategies, and other aspects of our operations or operating results. Words and phrases such as "anticipate," "estimate," "believe," “budget,” "continue," "could," "intend," "may," "plan," "potential," "predict," “seek,” "should," "will," “would,” "expect," "objective," "projection," "forecast," "goal," "guidance," "outlook," "effort," "target" and other similar words can be used to identify forward-looking statements. However, the absence of these words does not mean that the statements are not forward-looking. Where, in any forward-looking statement, the company expresses an expectation or belief as to future results, such expectation or belief is expressed in good faith and believed to be reasonable at the time such forward-looking statement is made. However, these statements are not guarantees of future performance and involve certain risks, uncertainties and other factors beyond our control. Therefore, actual outcomes and results may differ materially from what is expressed or forecast in the forward-looking statements. Factors that could cause actual results or events to differ materially from what is presented include the impact of public health crises, such as pandemics (including coronavirus (COVID-19)) and epidemics and any related company or government policies and actions to protect the health and safety of individuals or government policies or actions to maintain the functioning of national or global economies and markets; global and regional changes in the demand, supply, prices, differentials or other market conditions affecting oil and gas and the resulting company actions in response to such changes, including changes resulting from the imposition or lifting of crude oil production quotas or other actions that might be imposed by the Organization of Petroleum Exporting Countries and other producing countries; changes in commodity prices; changes in expected levels of oil and gas reserves or production; operating hazards, drilling risks, unsuccessful exploratory activities; unexpected cost increases or technical difficulties in constructing, maintaining, or modifying company facilities; legislative and regulatory initiatives addressing global climate change or other environmental concerns; investment in and development of competing or alternative energy sources; disruptions or interruptions impacting the transportation for our oil and gas production; international monetary conditions and exchange rate fluctuations; changes in international trade relationships, including the imposition of trade restrictions or tariffs on any materials or products (such as aluminum and steel) used in the operation of our business; our ability to collect payments when due under our settlement agreement with PDVSA; our ability to collect payments from the government of Venezuela as ordered by the ICSID; our ability to liquidate the common stock issued to us by Cenovus Energy Inc. at prices we deem acceptable, or at all; our ability to complete our announced dispositions or acquisitions on the timeline currently anticipated, if at all; the possibility that regulatory approvals for our announced dispositions or acquisitions will not be received on a timely basis, if at all, or that such approvals may require modification to the terms of our announced dispositions, acquisitions or our remaining business; business disruptions during or following our announced dispositions or acquisitions, including the diversion of management time and attention; the ability to deploy net proceeds from our announced dispositions in the manner and timeframe we currently anticipate, if at all; potential liability for remedial actions under existing or future environmental regulations; potential liability resulting from pending or future litigation; the impact of competition and consolidation in the oil and gas industry; limited access to capital or significantly higher cost of capital related to illiquidity or uncertainty in the domestic or international financial markets; general domestic and international economic and political conditions; the ability to successfully receive the requisite approvals and consummate the proposed acquisition of Concho resources; the ability to successfully integrate the operations of Concho Resources with our operations and achieve the anticipated benefits from the transaction; changes in fiscal regime or tax, environmental and other laws applicable to our business; and disruptions resulting from extraordinary weather events, civil unrest, war, terrorism or a cyber attack; and other economic, business, competitive and/or regulatory factors affecting our business generally as set forth in our filings with the Securities and Exchange Commission. Unless legally required, ConocoPhillips expressly disclaims any obligation to update any forward-looking statements, whether as a result of new information, future events or otherwise.


Contacts

John C. Roper (media)
281-293-1451
This email address is being protected from spambots. You need JavaScript enabled to view it.

Investor Relations
281-293-5000
This email address is being protected from spambots. You need JavaScript enabled to view it.

Adds to $10 million bill credit already benefiting customers in month of December

WALL, N.J.--(BUSINESS WIRE)--New Jersey Natural Gas (NJNG), the principal subsidiary of New Jersey Resources (NYSE: NJR) today notified the New Jersey Board of Public Utilities (BPU) it will provide residential and small commercial customers with a bill credit of $12.5 million for the month of January. The credit comes on top of a $10 million credit issued for December, a total of $22.5 million delivered to customers over the two-month period.


This one-time additional bill credit will save the typical residential heating customer using 197 therms during the month of January $24.03, or a decrease of 11.3% on their monthly bill.

When combined with the previous credit issued in December, NJNG will have saved the average customer $43.34 over the two-month period.

“With the arrival of winter snowfall and colder temperatures across the state, we are pleased to be able provide another timely bill credit to our customers during the heating season, when bills are typically at their highest,” said Steve Westhoven, President and CEO of New Jersey Natural Gas. “We will continue to utilize our market expertise and prudently manage our costs to identify savings wherever possible for our customers.”

NJNG is able to provide this additional bill credit at this time due to lower natural gas prices. NJNG does not earn a return on the price of natural gas used to serve its customers. This bill credit does not affect NJNG’s profitability.

While delivering this type of direct, broad-based relief benefits all of its customers, NJNG recognizes many customers are still struggling under the economic pressures of the pandemic and has additional resources to help. Any customer who is having trouble paying their bills should contact NJNG to be connected with Energy Assistance programs that can provide other relief, including: deferred payment arrangements, budget plans, utility bill payment assistance, one-time grants, and low- or no-cost energy efficiency programs to reduce consumption and lower bills.

If you or someone you know is a NJNG utility residential customer in need of assistance, call 800-221-0051 and say "energy assistance" at the prompt to speak with an NJNG customer service representative or email us at This email address is being protected from spambots. You need JavaScript enabled to view it..

About New Jersey Resources

New Jersey Resources (NYSE: NJR) is a Fortune 1000 company that, through its subsidiaries, provides safe and reliable natural gas and clean energy services, including transportation, distribution, asset management and home services. NJR is composed of five primary businesses:

  • New Jersey Natural Gas, NJR’s principal subsidiary, operates and maintains over 7,500 miles of natural gas transportation and distribution infrastructure to serve over half a million customers in New Jersey’s Monmouth, Ocean, Morris, Middlesex and Burlington counties.
  • NJR Clean Energy Ventures invests in, owns and operates solar projects with a total capacity of more than 350 megawatts, providing residential and commercial customers with low-carbon solutions.
  • NJR Energy Services manages a diversified portfolio of natural gas transportation and storage assets and provides physical natural gas services and customized energy solutions to its customers across North America.
  • Storage & Transportation serves customers from local distributors and producers to electric generators and wholesale marketers through its ownership of Leaf River Energy Center and the Adelphia Gateway Pipeline Project, as well as our 50 percent equity ownership in the Steckman Ridge natural gas storage facility, and our 20 percent equity interest in the PennEast Pipeline Project.
  • NJR Home Services provides service contracts as well as heating, central air conditioning, water heaters, standby generators, solar and other indoor and outdoor comfort products to residential homes throughout New Jersey.

NJR and its more than 1,100 employees are committed to helping customers save energy and money by promoting conservation and encouraging efficiency through Conserve to Preserve® and initiatives such as The SAVEGREEN Project® and The Sunlight Advantage®. For more information about NJR: www.njresources.com.

Follow us on Twitter @NJNaturalGas.
“Like” us on facebook.com/NewJerseyNaturalGas.


Contacts

Media Contact:
Michael Kinney
732-938-1031
This email address is being protected from spambots. You need JavaScript enabled to view it.

Investor Contact:
Dennis Puma
732-938-1229
This email address is being protected from spambots. You need JavaScript enabled to view it.

As the market continues to evolve, utilities should consider time-of-use rates, vehicle-to-grid pilots, and increased stakeholder collaboration


BOULDER, Colo.--(BUSINESS WIRE)--#EVcharging--A new report from Guidehouse Insights explores the maturing EV and charging markets, along with EV grid impacts and potential utility benefits.

Electricity demand in the US and European Union has been flat or down for several years, threatening the traditional business utility model of greater demand driving higher revenue. However, projected growth in EV adoption and the electricity that EVs use represent a dramatic increase in the amount of power that utilities will likely sell to consumers, yet, intermittent charge times and geographic clustering could exacerbate peak demand issues and threaten transformers. Click to tweet: According to a new report from @WeAreGHInsights, the evolving EV market, charging infrastructure, and charge times are expected to have a significant impact on utility load shapes.

“As utilities determine investment strategies and how to incorporate a step-change in demand, they will need to consider a range of strategies including price signals and vehicle-to-grid integration,” says Scott Shepard, senior research analyst with Guidehouse Insights. “These tools can help utilities and regulators nudge EV charging behavior to minimize disruptive grid impacts, lower consumer costs, and reduce carbon emissions.”

To position for success as the EV market evolves, Guidehouse Insights recommends utilities and regulators consider shifting electricity customers to time-of-use (TOU) rates. Utilities should work with fleets and firms to foster workplace charging, partner with charging companies to run vehicle-to-grid pilots, and collaborate with automakers to reduce friction for smart charging.

The report, Optimizing EV Load Profiles to Benefit the Grid, explores the maturing EV and charging markets, the move from EV grid impacts from theoretical to practical, and potential utility benefits, including demand response, energy storage, and managed charging. The report also explores this question: how are EVs and renewables exacerbating load shape peaks and troughs? Recommendations for utilities and other stakeholders are provided along with instruments in utility and regulator toolbelts that could help shift EV load. An executive summary of the report is available for free download on the Guidehouse Insights website.

About Guidehouse Insights

Guidehouse Insights, the dedicated market intelligence arm of Guidehouse, provides research, data, and benchmarking services for today’s rapidly changing and highly regulated industries. Our insights are built on in-depth analysis of global clean technology markets. The team’s research methodology combines supply-side industry analysis, end-user primary research, and demand assessment, paired with a deep examination of technology trends, to provide a comprehensive view of emerging resilient infrastructure systems. Additional information about Guidehouse Insights can be found at www.guidehouseinsights.com.

About Guidehouse

Guidehouse is a leading global provider of consulting services to the public and commercial markets with broad capabilities in management, technology, and risk consulting. We help clients address their toughest challenges with a focus on markets and clients facing transformational change, technology-driven innovation and significant regulatory pressure. Across a range of advisory, consulting, outsourcing, and technology/analytics services, we help clients create scalable, innovative solutions that prepare them for future growth and success. Headquartered in Washington DC, the company has more than 7,000 professionals in more than 50 locations. Guidehouse is led by seasoned professionals with proven and diverse expertise in traditional and emerging technologies, markets and agenda-setting issues driving national and global economies. For more information, please visit: www.guidehouse.com.

* The information contained in this press release concerning the report, Optimizing EV Load Profiles to Benefit the Grid, is a summary and reflects the current expectations of Guidehouse Insights based on market data and trend analysis. Market predictions and expectations are inherently uncertain and actual results may differ materially from those contained in this press release or the report. Please refer to the full report for a complete understanding of the assumptions underlying the report’s conclusions and the methodologies used to create the report. Neither Guidehouse Insights nor Guidehouse undertakes any obligation to update any of the information contained in this press release or the report.


Contacts

Lindsay Funicello-Paul
+1.781.270.8456
This email address is being protected from spambots. You need JavaScript enabled to view it.

DUBLIN--(BUSINESS WIRE)--The "Project Management Software Market - Growth, Trends, Forecasts (2020 - 2025)" report has been added to ResearchAndMarkets.com's offering.


The Project Management Software market is expected to register a CAGR of 10.67% during the forecast period (2020 - 2025). As today's corporations increase in size and complexity, an all-inclusive solution is needed to manage and coordinate an entire organization's portfolio of different projects. These solutions help the management to shuffle between plans, workload, budgets, and resources, carefully observe the project progress and report on delivery success.

  • Project management software (PMS) has now evolved into a strategic function of today's business due to the accelerating pace, technological advancements as well as the digital transformation and disruption happening across almost every industry.
  • Some of the factors that are expected to enhance the growth of the Project Management Software (PMS) systems market include increasing usage of software to manage resources, rising demand for the software that minimizes project risk as well as project cost, budget and shuffle plans, help in accessing real-time dashboard anywhere and anytime. On the other hand, the increasing sophistication and rising capabilities such as reminders and setting due dates are also anticipated to provide further impetus to the growth of the market during the forecast period.
  • While the factors, such as increased sophistication of software systems, growing awareness among end users, and ability to connect and integrate multiple disparate systems are anticipated to drive the demand, the high installation costs of setting up these systems coupled with high maintenance costs, are dissuading the enterprises in the end user from investing in project management software systems, thus leading to slow market penetration.
  • Project management has also evolved into a means of new product development, owing to the emergence of the Internet of Things and the adoption of agile NPD, which has now merged with PMS and has led to the development of new firms like UMT360, GenSight, and Decision Lens in the field of enterprise product creation.
  • With the COVID-19 pandemic lurking around, project management software is likely to provide a 360-degree view of analysis in terms of import and fare control, flexibility chain, provincial government strategy, future impact on the business, among others. Hence, the reliance on such digital solutions has greatly increased and is anticipated to witness no retreat even in the post-pandemic era.
  • These software systems also help project managers to evaluate the critical ways in which the pandemic affects their teams to mitigate the negative effects and plans to recover, even remotely. It is evident that enterprises are intending to harness digital channels that could provide proper planning and scheduling, team collaboration, project budgeting, among others, and ultimately leading to supplement and further strengthen their relationships with their customers.

Key Market Trends

Oil and Gas Segment to Witness High Growth

  • Digital transformation, tight budgets owing to global economic conditions, and the need to provide a growth platform cause an intense change in the Oil & Gas industry. The smallest of delays can cost millions of dollars to an oil and gas or chemical company.
  • Projects are increasing in volume, size, and scope, and the need to be scalable has become even more critical. Relying on manual processes and decentralized spreadsheets expose projects to risks and require ample time to prevent errors. The need for accurate forecasts and useful progress reports is essential.
  • Oil & Gas organizations are moving towards a more efficient month-end project process. Instead of manually updating information, organizations are utilizing project management software for real-time accurate project data to focus more time on data analysis over data entry. Industry players are focusing on adopting a disciplined approach to capital investment decisions and leveraging digital technologies to achieve higher capital productivity.
  • The market vendors are forming partnerships to provide the best solutions with the most upgraded technology to the industry. For instance, in July 2020, AVEVA, a global engineering, and industrial software firm, announced that it had formed a digital twin alliance for the upstream oil and gas sector with engineering and project management company DORIS Group energy management and automation specialist Schneider Electric.

Key Topics Covered:

1 INTRODUCTION

2 RESEARCH METHODOLOGY

3 EXECUTIVE SUMMARY

4 MARKET DYNAMICS

4.1 Market Overview

4.2 Market Drivers

4.2.1 Increased Sophistication and Growing Awareness Among End Users

4.2.2 Ability to Connect and Integrate Multiple Disparate Systems

4.3 Market Restraints

4.4 Industry Value Chain Analysis

4.5 Industry Attractiveness - Porter's Five Forces Analysis

4.6 Assessment of Impact of Covid-19 on the Market

5 MARKET SEGMENTATION

5.1 Deployment

5.2 End-user Vertical

5.3 Geography

6 COMPETITIVE LANDSCAPE

7 INVESTMENT ANALYSIS

8 MARKET OPPORTUNITIES AND FUTURE TRENDS

Companies Mentioned

  • Oracle Corporation
  • Microsoft Corporation
  • SAP SE
  • Broadcom Inc. (CA Technologies)
  • Basecamp LLC
  • AEC Software
  • Workfront Inc.
  • ServiceNow Inc.
  • Unit4 NV
  • Atlassian Corporation PLC

For more information about this report visit https://www.researchandmarkets.com/r/3c8z86

About ResearchAndMarkets.com

ResearchAndMarkets.com is the world's leading source for international market research reports and market data. We provide you with the latest data on international and regional markets, key industries, the top companies, new products and the latest trends.


Contacts

ResearchAndMarkets.com
Laura Wood, Senior Press Manager
This email address is being protected from spambots. You need JavaScript enabled to view it.

For E.S.T Office Hours Call 1-917-300-0470
For U.S./CAN Toll Free Call 1-800-526-8630
For GMT Office Hours Call +353-1-416-8900

Offshore Source Logo

Offshore Source keeps you updated with relevant information concerning the Offshore Energy Sector.

Any views or opinions represented on this website belong solely to the author and do not represent those of the people, institutions or organizations that Offshore Source or collaborators may or may not have been associated with in a professional or personal capacity, unless explicitly stated.

Corporate Offices

Technology Systems Corporation
8502 SW Kansas Ave
Stuart, FL 34997

info@tscpublishing.com