Business Wire News

KANSAS CITY, Mo.--(BUSINESS WIRE)--$CORR #dividend--CorEnergy Infrastructure Trust, Inc. (NYSE: CORR, CORRPrA) ("CorEnergy" or the "Company") today announced the tax characterization of the 2020 distributions paid to stockholders.


The following table summarizes, for income tax purposes, the nature of cash distributions paid by the Company during the year ended December 31, 2020.

Common Shareholders

Record
Date

Payable Date

Total
Distributions
Per Share

Total Ordinary
Dividends

Box 1a

Qualified
Dividends

Box 1b

Total Capital
Gain Distr.

Box 2a

Nondividend
Distr.

Box 3

2/14/2020

2/28/2020

$

0.7500


$


$


$


$

0.7500


5/15/2020

5/29/2020

0.0500


0.0500


8/17/2020

8/31/2020

0.0500


0.0500


11/16/2020

11/30/2020

0.0500


0.0500


Total 2020 Distributions

$

0.9000


$


$


$


$

0.9000


7.375% Series A Cumulative Redeemable Preferred Stock

Record
Date

Payable Date

Total
Distributions
Per Share

Total Ordinary
Dividends

Box 1a

Qualified
Dividends

Box 1b

Total Capital
Gain Distr.

Box 2a

Nondividend
Distr.

Box 3

2/14/2020

2/28/2020

$

0.4609


$


$


$


$

0.4609


5/15/2020

5/29/2020

0.4609


0.4609


8/17/2020

8/31/2020

0.4609


0.4609


11/16/2020

11/30/2020

0.4609


0.4609


Total 2020 Distributions

$

1.8436


$


$


$


$

1.8436


Additional information regarding the tax characterization of the 2020 distributions is available at corenergy.reit.

Nothing contained herein or therein should be construed as tax advice. Consult your tax advisor for more information. Furthermore, you may not rely upon any information herein or therein for the purpose of avoiding any penalties that may be imposed under the Internal Revenue Code.

About CorEnergy Infrastructure Trust, Inc.

CorEnergy Infrastructure Trust, Inc. (NYSE: CORR, CORRPrA), is a real estate investment trust (REIT) that owns critical energy assets, such as pipelines, storage terminals, and transmission and distribution assets. We receive long-term contracted revenue from operators of our assets, primarily under triple-net participating leases and from long-term customer contracts. For more information, please visit corenergy.reit.

Forward-Looking Statements

This press release contains certain statements that may include "forward-looking statements" within the meaning of Section 27A of the Securities Act of 1933 and Section 21E of the Securities Exchange Act of 1934. All statements, other than statements of historical fact, included herein are "forward-looking statements." Although CorEnergy believes that the expectations reflected in these forward-looking statements are reasonable, they do involve assumptions, risks and uncertainties, and these expectations may prove to be incorrect. Actual results could differ materially from those anticipated in these forward-looking statements as a result of a variety of factors, including those discussed in CorEnergy’s reports that are filed with the Securities and Exchange Commission. You should not place undue reliance on these forward-looking statements, which speak only as of the date of this press release. Other than as required by law, CorEnergy does not assume a duty to update any forward-looking statement. In particular, any distribution paid in the future to our stockholders will depend on the actual performance of CorEnergy, its costs of leverage and other operating expenses and will be subject to the approval of CorEnergy’s Board of Directors and compliance with leverage covenants.

Source: CorEnergy Infrastructure Trust, Inc.


Contacts

CorEnergy Infrastructure Trust, Inc.
Investor Relations
Debbie Hagen or Matt Kreps
877-699-CORR (2677)
This email address is being protected from spambots. You need JavaScript enabled to view it.

DUBLIN--(BUSINESS WIRE)--The "North America Offshore Pipeline Market Forecast to 2027 - COVID-19 Impact and Regional Analysis by Diameter, Line Type, and Product" report has been added to ResearchAndMarkets.com's offering.


The North America offshore pipeline market is expected to grow from US$ 2,925.21 million in 2019 to US$ 3,391.55 million by 2027; it is estimated to grow at a CAGR of 2.1% from 2020 to 2027.

Increasing need for safe, cost-effective, and efficient connectivity of pipelines across North America escalates the growth of the North America offshore pipeline market. Several advancements in technology are taking place to enhance the efficiency, safety, and reliability of offshore pipelines. For instance, the development of hydrate-phobic coating for the construction of methane hydrates in the deep sea. Moreover, several companies across North America are developing innovative coating solutions to evade corrosion of pipes. For instance, in April 2020, material scientists in North America developed a super hydrophobic coating for offshore drilling pipes.

The coating moderates or avoids hydrates and other deposits from cohering to subsea pipelines. Such developments focused on enhancing the safety, connectivity, and robustness of offshore oil & gas pipelines are raising more investments in offshore pipelines as compared to other modes of oil & gas transportation, which boosts the market growth. The growing demand for natural gas and crude oil is one of the significant factors expected to drive the demand for offshore pipelines across North America during the forecast period.

Countries in North America, especially the US, are reporting an unprecedented rise in the number of COVID-19 cases, which is disrupting construction activities in the oil & gas sector. The demand for offshore pipelines was hindered during the early months of 2020.

Moreover, the considerable decline in the overall global oil prices hampered the oil & gas related projects and other activities, which restrained the demand for offshore pipelines. Similar trend is also witnessed across Canada and Mexico. However, the countries are expected to overcome the swift drop in demand as they are resuming their economic activities for the revival of business activities, which would escalate the North America offshore pipeline market in the coming years.

Based on diameter, the less than 24 inches segment led the North America offshore pipeline market in 2019. Generally, oil & gas pipelines with less than 24 inches diameter are available in various types such as gathering pipelines, distribution pipelines, flow lines, and feeder pipelines. A gathering pipeline is used for delivering oil & gas products to store tanks from processing plants. Common products transmitted by these pipelines are crude oil, natural gas, and natural gas liquids.

These pipelines are relatively shorter than other pipelines, and their usual diameter is under 18 inches. However, the diameter of these pipelines is usually 2 to 8 inches for crude oil transmission. Recently, gathering lines - with diameters as large as 20 inches - were used in shale production. Distribution pipelines are a system with a combination of main pipelines and service pipelines. The diameter of the main pipelines ranges from 2 to 24 inches, whereas service pipelines have a typical diameter of less than 2 inches. Flow lines are used to transmit raw products to the gathering lines from the wellhead.

On the other hand, feeder pipelines carry natural gas, crude oil, or natural gas liquids to storage tanks. The diameter of feeder pipelines is generally 6 to 12 inches. Various advantages of less than 24 inches pipeline such as long distance transmission, cost effective, and efficient for crude oil transmission are expected to drive its demand in the coming years, which would bolster the North America offshore pipeline market during the forecast period.

Key Topics Covered:

1. Introduction

2. Key Takeaways

3. Research Methodology

4. North America Offshore Pipeline Market Landscape

4.1 Market Overview

4.2 North America PEST Analysis

4.3 Ecosystem Analysis

4.4 Expert Opinion

5. North America Offshore Pipeline Market - Key Market Dynamics

5.1 Market Drivers

5.1.1 Growing Demand for Natural Gas and Crude Oil

5.1.2 Need for Safe, Cost-Effective, and Efficient Connectivity

5.2 Market Restraints

5.2.1 Problems Associated with Cross-Border Pipeline Transportation

5.3 Market Opportunities

5.3.1 Identification of New Oil & Gas Reserves

5.4 Future Trends

5.4.1 Advancements in Flexible Pipe Technology

5.5 Impact Analysis of Drivers and Restraints

6. Offshore Pipeline Market - North America Analysis

6.1 North America Offshore Pipeline Market Overview

6.2 North America Offshore Pipeline Market - Revenue, and Forecast to 2027 (US$ Million)

6.3 Market Positioning - Market Players Ranking

7. North America Offshore Pipeline Market Analysis - By Diameter

7.1 Overview

7.2 North America Offshore Pipeline Market, By Diameter (2019 and 2027)

7.3 More than 24 inches

7.4 Less than 24 inches

8. North America Offshore Pipeline Market Analysis - By Line Type

8.1 Overview

8.2 North America Offshore Pipeline Market, By Line Type (2019 and 2027)

8.3 Export Line

8.4 Transport

9. North America Offshore Pipeline Market Analysis - By Product

9.1 Overview

9.2 North America Offshore Pipeline Market, By Product (2019 and 2027)

9.3 Oil

9.4 Gas

9.5 Refined Products

10. North America Offshore Pipeline Market - Country Analysis

10.1 Overview

11. Impact of COVID-19 Pandemic on North America Offshore Pipeline Market

12. Industry Landscape

12.1 Overview

12.2 Market Initiative

12.3 New Product Development

12.4 Merger and Acquisition

13. Company Profiles

  • Bechtel Corporation
  • Fugro
  • John Wood Group PLC
  • Larsen & Toubro Limited
  • McDermott International, Inc.
  • Petrofac Limited
  • Saipem S.p.A
  • Sapura Energy Berhad
  • Subsea 7 S.A.
  • TechnipFMC plc

For more information about this report visit https://www.researchandmarkets.com/r/h5sqpf


Contacts

ResearchAndMarkets.com
Laura Wood, Senior Press Manager
This email address is being protected from spambots. You need JavaScript enabled to view it.
For E.S.T Office Hours Call 1-917-300-0470
For U.S./CAN Toll Free Call 1-800-526-8630
For GMT Office Hours Call +353-1-416-8900

PHOENIX--(BUSINESS WIRE)--Pinnacle West Capital Corp. (NYSE: PNW) announced today that it plans to release its 2020 fourth-quarter and full-year financial results before the U.S. financial markets open on Wednesday, Feb. 24, 2021.


That same day at 11 a.m. ET (9 a.m. Arizona time), management will host a live webcast and conference call to discuss financial results and recent developments.

To access the live session:

To access the replay:

  • Visit www.pinnaclewest.com/presentations for the webcast recording.
  • An audio recording will be available by phone until 11:59 p.m. ET, Wednesday, March 3, 2021, by calling (877) 481-4010 in the U.S. and Canada or (919) 882-2331 internationally and entering replay passcode 39492.

Pinnacle West Capital Corp., an energy holding company based in Phoenix, has consolidated assets of approximately $20 billion, about 6,300 megawatts of generating capacity, and 6,200 employees in Arizona and New Mexico. Through its principal subsidiary, Arizona Public Service, the company provides retail electricity service to nearly 1.3 million Arizona homes and businesses. For more information about Pinnacle West, visit the company’s website at pinnaclewest.com.


Contacts

Media Contact: Alan Bunnell (602) 250-3376
Analyst Contact: Stefanie Layton (602) 250-4541
Website: pinnaclewest.com

DUBLIN--(BUSINESS WIRE)--The "China Fuel Cards Market to 2023 - COVID-19 Impact Update" report has been added to ResearchAndMarkets.com's offering.


China Fuel Cards Market to 2023 is invaluable for issuers of fleet cards, fuel retailers, fleet leasing companies and other suppliers to the sector. Based on research with issuers and fuel retailers it provides commercial (B2B) fuel card volume (split by fleet and CRT), value and market share forecasts to 2023 with the impact of COVID-19, key data on independent and oil company card issuers and an analysis of fuel card competition in China.

Fleet card volumes rose by 7.2%, from 36,290.5 million liters in 2018 to 38,912.2 million liters in 2019.

Scope

  • The total number of service stations in China rose by 0.6%, from 103,039 in 2018 to 103,607 in 2019.
  • More than 0.5 million new fuel cards will be issued from 2019 to 2023, resulting in a total of 6.6 million cards in the market.
  • Out of the total active cards in the market, 69.8% will be held by fleet vehicles and 31.2% CRT vehicles.
  • Fuel card volumes will rise by 4.1% from 2019 to 2023, reaching 68,460.8 million liters in 2023.

Reasons to Buy

  • Plan effective market entry strategies by uncovering current and future volumes and values of the Chinese fuel card market.
  • Assess whether you should increase network acceptance of your card and identify potential new merchants by uncovering the position of competitors.
  • Whether you are an issuer, a processor, a leasing company or a fuel retailer, make informed pitches to partners by understanding their business.
  • Enhance fuel sales at your service stations by identifying which fuel cards you should accept based on their market shares and network acceptance.
  • This data also provides Value and Volume forecasts till 2023 with COVID-19 impact.

Key Topics Covered:

  • Market Overview
  • Market Size
  • Market Forecast
  • Category Share
  • Market Share
  • Major Competitors
  • Competitor Card Analysis

Companies Mentioned

  • Sinopec
  • PetroChina
  • BP
  • Shell

For more information about this report visit https://www.researchandmarkets.com/r/74qw10


Contacts

ResearchAndMarkets.com
Laura Wood, Senior Press Manager
This email address is being protected from spambots. You need JavaScript enabled to view it.

For E.S.T Office Hours Call 1-917-300-0470
For U.S./CAN Toll Free Call 1-800-526-8630
For GMT Office Hours Call +353-1-416-8900

STAMFORD, Conn.--(BUSINESS WIRE)--Crane Co., a diversified manufacturer of highly engineered industrial products, today announced its regular quarterly dividend of $0.43 per share for the first quarter of 2021. The dividend is payable on March 10, 2021 to shareholders of record as of the close of business on February 26, 2021.


Crane Co. is a diversified manufacturer of highly engineered industrial products. Founded in 1855, Crane Co. provides products and solutions to customers in the chemicals, oil & gas, power, automated payment solutions, banknote design and production and aerospace & defense markets, along with a wide range of general industrial and consumer related end markets. The Company has four business segments: Fluid Handling, Payment & Merchandising Technologies, Aerospace & Electronics and Engineered Materials. Crane Co. has approximately 11,000 employees in the Americas, Europe, the Middle East, Asia and Australia. Crane Co. is traded on the New York Stock Exchange (NYSE:CR). For more information, visit www.craneco.com.


Contacts

Jason D. Feldman
Vice President, Investor Relations
203-363-7329
www.craneco.com

Appointment underscores growing market opportunities and continued need for expertise in power generation, transmission and distribution


OVERLAND PARK, Kan.--(BUSINESS WIRE)--Continuing with its global growth strategy, Black & Veatch today named Youssef Merjaneh as Senior Vice President, Europe, Middle East and Africa (EMEA) as the region’s focus on the dynamic energy transition continues.

The company's expansion in the EMEA region and Youssef’s appointment come at a transformational time for Black & Veatch. In 2020, the company announced it would cease participation in any new coal-based power design and construction and focus its capabilities on supporting the other parts of its portfolio including renewable generation, transmission and distribution, and other aspects of conventional generation including gas, hydrogen, and carbon capture.

While Europe has been building renewable capacity for many years and continues to do so, the Middle East and Africa regions are also following a similar path, and Black & Veatch's full Power portfolio is a perfect fit to support the entire region with this transition both on the power generation and delivery fronts.

“Although EMEA is a highly diverse region, the power landscape shares a common dynamic: Rising demand has to be met while carbon emissions have to fall,” Youssef said. “Europe is taking a lead in the drive to accelerate the path towards zero carbon energy. Development of alternative energy sources is integral to the strategies of Gulf Cooperation Council countries, and African nations are also making NetZero commitments.”

Youssef has 19 years of global business experience in operations, sales, business development, strategy and project management, with a strong focus on the Middle East and Europe. His background is in power, oil & gas, transportation and IT. He was most recently CEO and Managing Director at RATP Dev Mobility Egypt. Prior to that, Youssef led the ABB Division in Saudi Arabia for Electrical Motors and Drives, and earlier in his career he held several positions at Siemens, including leadership roles in Power Generation Services, Power Transmission and Distribution, and Mobility.

“We have been delivering power projects in the Middle East for more than 45 years. Our Europe power team has continued to grow to meet rising client demand for solutions. Youssef’s appointment provides a unifying focal point in a region the company considers strategic to expanding its portfolio in the global Power market,” said Mario Azar, President of Black & Veatch’s power business.

Click here to download an accompanying image.

Editor’s Notes:

About Black & Veatch
Black & Veatch is an employee-owned engineering, procurement, consulting and construction company with a more than 100-year track record of innovation in sustainable infrastructure. Since 1915, we have helped our clients improve the lives of people in over 100 countries by addressing the resilience and reliability of our world's most important infrastructure assets. Our revenues in 2019 were US$3.7 billion. Follow us on www.bv.com and on social media.


Contacts

MALCOLM HALLSWORTH | +44 1737 856594 p | +44 7920 701764 m | This email address is being protected from spambots. You need JavaScript enabled to view it.
24-HOUR MEDIA HOTLINE | +1 866 496 9149

Highlights from Full Year 2020 Results and 2021 Guidance:


  • GAAP earnings per diluted share (EPS) of $3.08 in 2020.
  • Excluding Special Items, EPS of $3.84 in 2020 compared to $6.02 in 2019.
  • Strong full year free cash flow of $275 million (cash provided by operating activities less capital spending).
  • Introducing 2021 GAAP EPS guidance of $4.85-$5.05.
  • Excluding Special Items, 2021 EPS guidance is $4.90-$5.10, a 30% increase at the midpoint compared to 2020.

STAMFORD, Conn.--(BUSINESS WIRE)--Crane Co. (NYSE: CR), a diversified manufacturer of highly engineered industrial products, reported full year and fourth quarter 2020 results, and provided its 2021 outlook.

"We are introducing 2021 adjusted EPS guidance in a range of $4.90-$5.10, with the midpoint reflecting 30% adjusted earnings growth compared to last year," said Max Mitchell, Crane Co. President and Chief Executive Officer. "This growth is supported by recent trends, including markets that strengthened towards the end of 2020 and order rates that accelerated throughout the fourth quarter. Orders were higher in December than in any other month of 2020, with broad-based core year-over-year growth of 11% led by Crane Currency, our defense electronics business, and Engineered Materials. Sequentially, December orders also improved substantially at Crane Payment Innovations and at our process valve business. Although these trends improve our confidence in a strong 2021 recovery, we are still managing through sporadic and isolated ongoing COVID-19 related logistics and supply chain disruptions due to the recent global spike in infection rates that resulted in some shipment delays at the end of the fourth quarter."

Mr. Mitchell continued, "We were one of a handful of industrial companies that provided guidance during 2020, and our teams executed well and delivered solid results which were in-line with what we communicated at the outset of the pandemic. We have deep and experienced leadership, paired with a strong balance sheet and a diverse portfolio of strong, durable, and differentiated businesses; that combination allowed us to once again navigate through an extremely challenging period. While we adjusted our cost base in 2020, delivering approximately $105 million of gross cost savings, we did not reduce investments in any key growth area of the business and we continued to make significant progress on our technology roadmaps, positioning us for long-term success."

Mr. Mitchell concluded, "Most importantly, I am incredibly proud of how all of our associates across Crane performed through the pandemic, as well as in our response to the unprecedented set of circumstances we faced during 2020. That response began with the actions we took to ensure the safety and well-being of our associates. Starting in early March, we quickly adopted new safety protocols and procedures worldwide, in most cases more stringent than, and in advance of, government mandates. We also quickly adopted a new Emergency Pandemic Pay program providing additional paid time off to all Crane associates globally that were directly or indirectly impacted by COVID-19. While our cost saving initiatives did involve many tough decisions and a substantial reduction-in-force, every possible effort was made to protect and retain our associates during this challenging period given how critical they are to our long-term success. COVID-19 related challenges are continuing, but we believe that we are seeing the beginning of the end of the pandemic crisis, and we are confident in our long-term outlook and growth prospects as end markets continue to recover."

Full Year 2020 Results

Full year 2020 GAAP earnings per diluted share (EPS) of $3.08, compared to $2.20 in 2019. Full year 2019 GAAP EPS included, among other Special Items, an after-tax net asbestos provision of $181 million, or $2.98 per share. Excluding Special Items, full year 2020 EPS was $3.84, compared to $6.02 in 2019. (Please see the attached Non-GAAP Financial Measures tables for a detailed reconciliation of reported results to adjusted measures.)

Full year 2020 sales were $2.94 billion, a decline of 11% compared to 2019. The sales decline was comprised of a $565 million, or 17%, decline in core sales, partially offset by a $212 million, or 6%, benefit from acquisitions and slightly favorable foreign exchange. The core sales decline was attributable to COVID-19 related macroeconomic factors.

Full year 2020 operating profit was $263 million compared to $210 million in 2019. Operating profit margin was 9.0% in 2020 compared to 6.4% in 2019. Excluding Special Items, 2020 operating profit was $323 million compared to $494 million in 2019. Excluding Special Items, operating profit margin was 11.0% compared to 15.0% in 2019. (Please see the attached Non-GAAP Financial Measures tables for a detailed reconciliation of reported results to adjusted measures.)

Full Year Cash Flow, Liquidity, and Other Financial Metrics

Cash provided from operating activities in 2020 was $310 million compared to $394 million in 2019. Capital expenditures in 2020 were $34 million compared to $69 million in 2019. Full year 2020 free cash flow (cash provided by operating activities less capital spending) was $275 million compared to $325 million in 2019.

The Company held $581 million in cash and short-term investments at December 31, 2020, compared to $394 million at December 31, 2019. Total debt was $1,219 million at December 31, 2020, compared to $991 million at December 31, 2019. As of December 31, 2020, liquidity of approximately $1,104 million was comprised of $581 million in cash and short-term investments, and $523 million available under our revolving credit facility.

Richard Maue, Crane Co. Senior Vice President and Chief Financial Officer, commented, "Our free cash flow performance during 2020 was impressive, primarily reflecting very effective management of working capital and capital expenditures. We also maintained a high level of liquidity throughout the pandemic, ensuring that we had the flexibility to continue all key strategic growth initiatives last year. That liquidity was enhanced by a $343 million 364-day term loan that closed in April 2020. Given our balance sheet strength and our financial outlook for 2021, we expect to repay that term loan in April 2021 using cash on hand and commercial paper, and to continue our pursuit of potential acquisitions."

Fourth Quarter 2020 Results

Fourth quarter 2020 GAAP earnings per diluted share (EPS) of $0.80, compared to a fourth quarter 2019 GAAP net loss of $1.89 per share. The fourth quarter 2019 GAAP net loss included, among other Special Items, an after-tax net asbestos provision of $181 million, or $3.04 per share. Excluding Special Items, fourth quarter 2020 EPS was $1.00, compared to $1.58 in 2019. (Please see the attached Non-GAAP Financial Measures tables for a detailed reconciliation of reported results to adjusted measures.)

Fourth quarter 2020 sales were $726 million, a decline of 13% compared to 2019. The sales decline was comprised of a $178 million, or 21%, decline in core sales, partially offset by a $55 million, or 7%, benefit from acquisitions and $12 million, or 1%, of favorable foreign exchange. The core sales decline was attributable to COVID-19 related macroeconomic factors.

Fourth quarter 2020 operating profit was $59 million compared to an operating loss of $135 million in the fourth quarter of 2019. Operating profit margin was 8.1% in the fourth quarter of 2020 compared to -16.2% in 2019. Excluding Special Items, fourth quarter 2020 operating profit was $75 million compared to $128 million in 2019. Excluding Special Items, fourth quarter 2020 operating profit margin was 10.3% compared to 15.3% in 2019. (Please see the attached Non-GAAP Financial Measures tables for a detailed reconciliation of reported results to adjusted measures.)

Fourth Quarter 2020 Segment Results

All comparisons detailed in this section refer to operating results for the fourth quarter 2020 versus the fourth quarter 2019.

Fluid Handling


Fourth Quarter


Change

(dollars in millions)


2020


2019


Sales


$

258


$

277


$

(19

)


(7

%)


Operating Profit


$

24


$

25


$

(1

)


(5

%)

Operating Profit, before Special Items*


$

28


$

37


$

(10

)


(26

%)


Profit Margin


9.2

%


9.0

%


Profit Margin, before Special Items*


10.7

%


13.5

%


*Please see the attached Non-GAAP Financial Measures tables

Sales of $258 million decreased $19 million, or 7%, driven by a $38 million, or 14%, decline in core sales, partially offset by a $14 million, or 5%, benefit from an acquisition and $5 million, or 2%, of favorable foreign exchange. Operating profit margin improved to 9.2%, compared to 9.0% last year, primarily reflecting lower repositioning costs as well as productivity and cost reduction measures which were mostly offset by lower volumes. Excluding Special Items, operating profit margin declined to 10.7%, compared to 13.5% last year primarily reflecting lower volumes, partially offset by productivity and cost reduction measures. Fluid Handling order backlog was $313 million at December 31, 2020 which includes $11 million related to the January 2020 I&S acquisition, compared to $267 million at December 31, 2019. Core backlog, which excludes the impact of foreign currency and acquisitions, increased 10% compared to the end of 2019. Typically, Fluid Handling orders weaken sequentially from the third to the fourth quarter, primarily due to seasonality; however, on a sequential basis, excluding the impact of foreign currency, fourth quarter segment backlog increased slightly and orders increased 2% compared to third quarter.

Payment & Merchandising Technologies


Fourth Quarter


Change

(dollars in millions)


2020


2019


Sales


$

283


$

315


$

(32

)


(10

%)

Sales, including acquisition-related deferred revenue*


$

285


$

315


$

(30

)


(9

%)


Operating Profit


$

32


$

53


$

(21

)


(40

%)

Operating Profit, before Special Items*


$

42


$

55


$

(14

)


(24

%)


Profit Margin


11.2

%


16.7

%


Profit Margin, before Special Items*


14.7

%


17.6

%


*Please see the attached Non-GAAP Financial Measures tables


Sales of $283 million decreased $32 million, or 10%, driven by an $80 million, or 25%, decline in core sales, partially offset by a $41 million, or 13%, benefit from an acquisition, and $7 million, or 2%, of favorable foreign exchange. Including $2.5 million of acquisition-related deferred revenue, sales in the fourth quarter of 2020 were $285 million. Operating profit margin declined to 11.2%, from 16.7% last year primarily reflecting the impact of lower volumes, partially offset by productivity, benefits from cost saving measures and favorable product mix. Excluding Special Items, operating profit margin decreased to 14.7%, from 17.6% last year. Payment & Merchandising Technologies order backlog was $348 million at December 31, 2020, compared to $311 million at December 31, 2019. Excluding the impact of foreign exchange, fourth quarter backlog increased 4% driven by strength in the Crane Payment Innovations business. On a sequential basis, excluding the impact of foreign currency, fourth quarter segment backlog increased 23% and orders increased 35% compared to third quarter, with broad-based strength across Crane Payment Innovations and Crane Currency. Segment orders in December, excluding the impact of foreign currency, were higher than any other month during 2020.

Aerospace & Electronics


Fourth Quarter


Change

(dollars in millions)


2020


2019


Sales


$

143


$

203


$

(59

)


(29

%)


Operating Profit


$

13


$

48


$

(35

)


(73

%)

Operating Profit, before Special Items*


$

15


$

48


$

(33

)


(69

%)


Profit Margin


9.0

%


23.7

%


Profit Margin, before Special Items*


10.3

%


23.8

%


*Please see the attached Non-GAAP Financial Measures tables

Sales of $143 million decreased $59 million, or 29%, driven by lower core sales to the commercial aerospace market. Operating profit margin declined to 9.0%, from 23.7% last year, primarily reflecting lower volumes. Excluding Special Items, operating profit margin declined to 10.3%, from 23.8% last year. Aerospace & Electronics' order backlog was $491 million at December 31, 2020, compared to a record $567 million at December 31, 2019.

Engineered Materials


Fourth Quarter


Change

(dollars in millions)


2020


2019


Sales


$

43


$

43


$

(1

)


(2

%)


Operating Profit


$

5


$

4


$

1


22

%


Profit Margin


11.7

%


9.4

%


Sales decreased $1 million, or 2%, driven primarily by lower sales to the Building Products market, partially offset by stronger sales to Recreational Vehicle customers. Operating profit margin increased to 11.7%, from 9.4% last year, primarily reflecting productivity and the benefit of cost reduction measures.

Introducing 2021 Guidance

We are introducing full year 2021 GAAP EPS guidance in a range of $4.85-$5.05. Excluding Special items, full year 2021 EPS guidance is $4.90-$5.10. Sales are expected to be approximately $3.05 billion, reflecting core sales growth of approximately 2%, favorable foreign exchange of 1.5% and a nominal acquisition benefit. Full year 2021 free cash flow (cash provided by operating activities less capital spending) is expected to be in a range of $260 million to $290 million. (Please see the attached Non-GAAP Financial Measures tables.)

Additional guidance details will be provided on the Company’s fourth quarter 2020 earnings conference call on January 26, 2021 and in the slide presentation accompanying that call, as well as at the Company's Annual Investor Day conference scheduled for February 25, 2021.

Additional Information

Additional information with respect to the Company’s asbestos liability and related accounting provisions and cash requirements is set forth in the Current Report on Form 8-K filed with a copy of this press release.

Conference Call

Crane Co. has scheduled a conference call to discuss the fourth quarter financial results on Tuesday, January 26, 2021 at 10:00 A.M. (Eastern). All interested parties may listen to a live webcast of the call at http://www.craneco.com. An archived webcast will also be available to replay this conference call directly from the Company’s website under Investors, Events & Presentations. Slides that accompany the conference call will be available on the Company’s website.

Crane Co. is a diversified manufacturer of highly engineered industrial products. Founded in 1855, Crane Co. provides products and solutions to customers in the chemicals, oil & gas, power, automated payment solutions, banknote design and production and aerospace & defense markets, along with a wide range of general industrial and consumer related end markets. The Company has four business segments: Fluid Handling, Payment & Merchandising Technologies, Aerospace & Electronics and Engineered Materials. Crane Co. has approximately 11,000 employees in the Americas, Europe, the Middle East, Asia and Australia. Crane Co. is traded on the New York Stock Exchange (NYSE:CR). For more information, visit www.craneco.com.

This press release may contain forward-looking statements as defined by the Private Securities Litigation Reform Act of 1995. These statements are based on the management’s current beliefs, expectations, plans, assumptions and objectives regarding Crane Co.’s future financial performance and are subject to significant risks and uncertainties. Any discussions contained in this press release, except to the extent that they contain historical facts, are forward-looking and accordingly involve estimates, assumptions, judgments and uncertainties. There are a number of factors, including risks and uncertainties related to the ongoing COVID-19 pandemic, that could cause actual results or outcomes to differ materially from those expressed or implied in these forward-looking statements. Such factors also include, among others: uncertainties regarding the extent and duration of the impact of the COVID-19 pandemic on many aspects of our business, operations and financial performance; changes in economic, financial and end-market conditions in the markets in which we operate; fluctuations in raw material prices; the financial condition of our customers and suppliers; economic, social and political instability, currency fluctuation and other risks of doing business outside of the United States; competitive pressures, including the need for technology improvement, successful new product development and introduction and any inability to pass increased costs of raw materials to customers; our ability to value and successfully integrate acquisitions, to realize synergies and opportunities for growth and innovation, and to attract and retain highly qualified personnel and key management; a reduction in congressional appropriations that affect defense spending and our ability to predict the timing and award of substantial contracts in our banknote business; adverse effects on our business and results of operations, as a whole, as a result of increases in asbestos claims or the cost of defending and settling such claims; adverse effects as a result of environmental remediation activities, costs, liabilities and related claims; investment performance of our pension plan assets and fluctuations in interest rates, which may affect the amount and timing of future pension plan contributions; and other risks noted in reports that we file with the Securities and Exchange Commission, including the Company’s Annual Report on Form 10-K for the fiscal year ended December 31, 2019 and subsequent reports filed with the Securities and Exchange Commission. Crane Co. does not undertake any obligation to update or revise any forward-looking statements.

(Financial Tables Follow)

CRANE CO.

Income Statement Data

(in millions, except per share data)


Three Months Ended


Twelve Months Ended


December 31,


December 31,


2020


2019


2020


2019


Net sales:


Fluid Handling


$


257.7


$

277.0


$


1,005.8


$


1,117.4


Payment & Merchandising Technologies


282.6


314.6


1,104.8


1,158.3


Aerospace & Electronics


143.4


202.5


650.7


798.8


Engineered Materials


42.7


43.4


175.6


208.6


Total net sales


726.4


837.5


2,936.9


3,283.1


Operating profit (loss):


Fluid Handling


23.7


24.9


97.7


131.7


Payment & Merchandising Technologies


31.7


52.5


100.6


177.3


Aerospace & Electronics


12.9


48.0


100.7


189.4


Engineered Materials


5.0


4.1


22.7


26.8


Corporate


(14.4

)


(17.0

)


(58.8

)


(66.9

)

Asbestos provision


(229.0

)


(229.0

)

Environmental provision


(18.9

)


(18.9

)

Total operating profit (loss)


58.9


(135.4

)


262.9


210.4


Interest income


0.7


0.8


2.0


2.7


Interest expense


(14.0

)


(11.8

)


(55.3

)


(46.8

)

Miscellaneous, net


4.3


0.6


14.9


4.4


Income (loss) before income taxes


49.9


(145.8

)


224.5


170.7


Provision for (benefit from) income taxes


3.0


(33.3

)


43.4


37.1


Net income (loss) before allocation to noncontrolling interests


46.9


(112.5

)


181.1


133.6


Less: Noncontrolling interest in subsidiaries' earnings


0.1


0.1


0.1


0.3


Net income (loss) attributable to common shareholders


$


46.8


$

(112.6

)


$


181.0


$


133.3


Share data:


Earnings (loss) per diluted share


$

0.80


$

(1.89

)


$

3.08


$

2.20


Average diluted shares outstanding


58.5


59.5


58.8


60.6


Average basic shares outstanding


58.1


59.5


58.3


59.8


Supplemental data:


Cost of sales


$


491.1


$

794.6


$


1,936.4


$


2,352.0


Selling, general & administrative


176.4


178.3


737.6


720.7


Asbestos provision 1


229.0


229.0


Environmental provision 1


18.9


18.9


Acquisition-related and integration charges 1


2.7


1.5


12.9


5.2


Repositioning related charges, net 1


10.9


14.1


37.4


30.3


Depreciation and amortization 1


32.2


29.3


127.5


113.5


Stock-based compensation expense 1


6.1


5.5


22.3


22.3


1 Amounts included within cost of sales and/or selling, general & administrative costs.

Totals may not sum due to rounding

CRANE CO.

Condensed Balance Sheets

(in millions)


December 31,
2020


December 31,
2019

Assets


Current assets


Cash and cash equivalents


$

551.0


$

393.9


Accounts receivable, net


432.7


555.1


Current insurance receivable - asbestos


14.4


14.1


Inventories, net


438.7


457.3


Other current assets


137.4


79.5


Total current assets


1,574.2


1,499.9


Property, plant and equipment, net


600.4


616.3


Long-term insurance receivable - asbestos


72.5


83.6


Other assets


733.3


751.5


Goodwill


1,608.5


1,472.4


Total assets


$

4,588.9


$

4,423.7


Liabilities and equity


Current liabilities


Short-term borrowings


$

375.7


$

149.4


Accounts payable


218.4


311.1


Current asbestos liability


66.5


65.0


Accrued liabilities


395.9


378.2


Income taxes


0.1


13.0


Total current liabilities


1,056.6


916.7


Long-term debt


842.9


842.0


Long-term deferred tax liability


53.6


55.8


Long-term asbestos liability


603.6


646.6


Other liabilities


501.1


486.3


Total equity


1,531.1


1,476.3


Total liabilities and equity


$

4,588.9


$

4,423.7


Totals may not sum due to rounding

CRANE CO.

Condensed Statements of Cash Flows

(in millions)


Three Months Ended
December 31,


Twelve Months Ended
December 31,


2020


2019


2020


2019


Operating activities:


Net income (loss) attributable to common shareholders


$

46.8


$

(112.6

)


$

181.0


$

133.3


Noncontrolling interest in subsidiaries' earnings (loss)


0.1


0.1


0.1


0.3


Net income (loss) before allocations to noncontrolling interests


46.9


(112.5

)


181.1


133.6


Asbestos provision


229.0


229.0


Environmental provision


18.9


18.9


Loss on deconsolidation of joint venture


1.2


Realized gain on marketable securities


(1.1

)


Depreciation and amortization


32.2


29.3


127.5


113.5


Stock-based compensation expense


6.1


5.5


22.3


22.3


Defined benefit plans and postretirement credit


(2.6

)


(0.3

)


(7.1

)


(0.7

)


Deferred income taxes


2.7


(49.8

)


10.2


(25.1

)


Cash provided by (used for) operating working capital


54.2


117.1


46.0


(40.0

)


Defined benefit plans and postretirement contributions


(25.3

)


(2.7

)


(28.4

)


(8.7

)


Environmental payments, net of reimbursements


(1.3

)


(1.7

)


(4.2

)


(8.2

)


Other


(4.1

)


2.6


(6.8

)


0.7


Subtotal


108.8


235.4


340.6


435.4


Asbestos related payments, net of insurance recoveries


(7.3

)


(12.5

)


(31.1

)


(41.5

)


Total provided by operating activities


101.5


222.9


309.5


393.9


Investing activities:


Payments for acquisitions, net of cash acquired


(0.3

)


(156.2

)


(169.5

)


(156.2

)


Proceeds from disposition of capital assets


0.6


1.8


4.5


3.1


Capital expenditures


(13.5

)


(17.9

)


(34.1

)


(68.8

)


Impact of deconsolidation of joint venture


(0.2

)


Purchase of marketable securities


(30.0

)


(90.0

)


(8.8

)


Proceeds from sale of marketable securities


60.0


60.0


9.9


Total provided by (used for) investing activities


16.8


(172.3

)


(229.1

)


(221.0

)


Financing activities:


Dividends paid


(25.0

)


(23.1

)


(100.4

)


(93.2

)


Reacquisition of shares on open market


(79.9

)


(70.0

)


(79.9

)


Stock options exercised, net of shares reacquired


0.8


0.3


5.1


2.9


Debt issuance costs


(1.3

)


Repayment of long-term debt


(94.9

)


(99.4

)


Repayment of short-term debt


(7.4

)


(7.4

)


Proceeds from issuance of long-term debt


3.0


Proceeds from issuance of commercial paper with maturities greater than 90 days


25.0


251.3


25.0


Repayments of commercial paper with maturities greater than 90 days


(108.1

)


(296.7

)


Net proceeds (repayments) from issuance of commercial paper with maturities of 90 days or less


124.4


(76.8

)


124.4


Proceeds from revolving credit facility


77.2


Repayments of revolving credit facility


(77.2

)


Proceeds from term loan


343.9


Total (used for) provided by financing activities


(132.2

)


(55.6

)


55.1


(124.6

)


Effect of exchange rate on cash and cash equivalents


20.3


10.1


21.6


2.2


Increase in cash and cash equivalents


6.4


5.1


157.1


50.5


Cash and cash equivalents at beginning of period


544.6


388.8


393.9


343.4


Cash and cash equivalents at end of period


$

551.0


$

393.9


$

551.0


$

393.9


Contacts

Jason D. Feldman
Vice President, Investor Relations
203-363-7329
www.craneco.com


Read full story here

DUBLIN--(BUSINESS WIRE)--The "From Oil to Energy - IOC Strategies for the Energy Transition" report has been added to ResearchAndMarkets.com's offering.


Oil and gas demand hit hard by COVID-19 shock. Potential for long-term behavioral change after lockdown experiences creates uncertainty over transportation demand for oil. Majority of future power demand growth to be supplied by renewables. Major IOCs recognized large impairments in Q2 after downward revisions to future oil and gas price assumptions.

Scope

  • IOC targets for the energy transition
  • IOCs investments in multiple transition technologies
  • BP Transition Targets
  • How wider oil and gas sector preparing for transition

Reasons to Buy

  • Understand the factors supporting the energy transition among IOCs
  • Identify net zero ambitions of major European IOCs
  • Understand key technologies IOCs are investing for energy transition.
  • Analyze BP's energy transition strategy

Key Topics Covered:

  • Questions over recovery of oil and gas demand from COVID 19 shock
  • IOC targets for the energy transition
  • European majors leading the charge on renewables
  • Fastest growth expected in solar and offshore wind
  • IOCs pursuing investments in multiple transition technologies
  • BP Focus: Key targets for transformation to an Integrated Energy Company
  • BP Focus: Future Investment Outlook
  • BP Focus: Downsizing of traditional hydrocarbons business
  • BP Focus: Low carbon M&A
  • BP Focus: Prospects for key growth segments
  • Wider oil and gas Challenges and opportunities for the wider market

For more information about this report visit https://www.researchandmarkets.com/r/abfnte


Contacts

ResearchAndMarkets.com
Laura Wood, Senior Press Manager
This email address is being protected from spambots. You need JavaScript enabled to view it.
For E.S.T Office Hours Call 1-917-300-0470
For U.S./CAN Toll Free Call 1-800-526-8630
For GMT Office Hours Call +353-1-416-8900

KILGORE, Texas--(BUSINESS WIRE)--Martin Midstream Partners L.P. (NASDAQ: MMLP) (the “Partnership”) plans to release its financial results for the fourth quarter ended December 31, 2020 and issue 2021 financial guidance after the market closes on February 17, 2021. An investors' conference call to review the fourth quarter and full-year results, along with 2021 financial guidance, will be held the following day.


Date: Thursday, February 18, 2021

Time: 8:00 a.m. CT (please dial in by 7:55 a.m.)

Dial In #: (833) 900-2251

Conference ID: 9494038

Replay Dial In # (800) 585-8367 – Conference ID: 9494038

Webcast: Fourth Quarter 2020 Earnings Conference Call

The Partnership announced today it has declared a quarterly cash distribution of $0.005 per unit for the quarter ended December 31, 2020. The distribution is payable on February 12, 2021 to common unitholders of record as of the close of business on February 5, 2021. The ex-dividend date for the cash distribution is February 4, 2021.

During the conference call, management will discuss certain non-generally accepted accounting principle financial measures for which reconciliations to the most directly comparable GAAP financial measures will be provided in Martin Midstream Partners’ announcement concerning its financial results for the quarter ended December 31, 2020, along with an archive of the replay. Each will be available on the investor relations page of Martin Midstream Partners’ website.

Qualified Notice to Nominees

This release serves as qualified notice to nominees as provided for under Treasury Regulation Section 1.1446-4(b)(4) and (d). Please note that 100 percent of the Partnership's distributions to foreign investors are attributable to income that is effectively connected with a United States trade or business. Accordingly, all of the Partnership's distributions to foreign investors are subject to federal income tax withholding at the highest effective tax rate for individuals or corporations, as applicable. Nominees, and not the Partnership, are treated as withholding agents responsible for withholding on the distributions received by them on behalf of foreign investors.

About Martin Midstream Partners

Martin Midstream Partners L.P., headquartered in Kilgore, Texas, is a publicly traded limited partnership with a diverse set of operations focused primarily in the United States Gulf Coast region. The Partnership's primary business lines include: (1) terminalling, processing, storage, and packaging services for petroleum products and by-products; (2) land and marine transportation services for petroleum products and by-products, chemicals, and specialty products; (3) sulfur and sulfur-based products processing, manufacturing, marketing and distribution; and (4) natural gas liquids marketing, distribution, and transportation services. To learn more, visit www.MMLP.com. Follow Martin Midstream Partners L.P. on LinkedIn and Facebook.

Forward-Looking Statements

Statements about the Partnership’s outlook and all other statements in this release other than historical facts are forward-looking statements within the meaning of the Private Securities Litigation Reform Act of 1995. These forward-looking statements and all references to financial estimates rely on a number of assumptions concerning future events and are subject to a number of uncertainties, including (i) the current and potential impacts of the COVID-19 pandemic generally, on an industry-specific basis, and on the Partnership’s specific operations and business, (ii) the effects of the continued volatility of commodity prices and the related macroeconomic and political environment, and (iii) other factors, many of which are outside its control, which could cause actual results to differ materially from such statements. While the Partnership believes that the assumptions concerning future events are reasonable, it cautions that there are inherent difficulties in anticipating or predicting certain important factors. A discussion of these factors, including risks and uncertainties, is set forth in the Partnership’s annual and quarterly reports filed from time to time with the Securities and Exchange Commission (the “SEC”). The Partnership disclaims any intention or obligation to revise any forward-looking statements, including financial estimates, whether as a result of new information, future events, or otherwise except where required to do so by law.

The information in the Partnership’s website is not, and shall not be deemed to be, a part of this notice or incorporated in filings the Partnership makes with the SEC.

MMLP-F


Contacts

Sharon Taylor
Chief Financial Officer
(877) 256-6644
This email address is being protected from spambots. You need JavaScript enabled to view it.

DUBLIN--(BUSINESS WIRE)--The "Oil and Gas Upstream Mergers, Acquisition and Capital Raising Quarterly Deals Review - Q2 2020" report has been added to ResearchAndMarkets.com's offering.


"Oil and Gas Upstream Mergers, Acquisition and Capital Raising Quarterly Deals Review - Q2 2020" report is an essential source of data and trend analysis on M&A (mergers, acquisitions, and asset transactions) and financings (equity/debt offerings and PE/VC) in the upstream oil and gas industry.

The report provides detailed comparative quarter-on-quarter data, on the number of deals and their value, sub-divided into deal types by geographies. It also envisage on the recent rumors on acquisitions across the industry. The report also highlights Valuation Multiples ($/boed, $/1P boe, $/2P boe) by Region for the last five quarters. Data presented in this report is derived from the publisher's proprietary in-house Oil and Gas eTrack deals database and primary and secondary research.

Scope

  • Analyze market trends for the upstream oil and gas industry in the global arena
  • Review of deal trends in the upstream segments, i.e. conventional and unconventional
  • Analysis of M&As, Equity/Debt Offerings, Private Equity, and Venture Financing in the upstream oil and gas industry
  • Review the valuation metrics, such as US$ per boe, US$ per 1P reserves, and US$ per 2P reserves"
  • Information on the top deals that took place in the industry
  • Geographies covered include North America, Europe, Asia Pacific, South & Central America, and Middle East & Africa

Reasons to Buy

  • Enhance your decision making capability in a more rapid and time sensitive manner
  • Find out the major deal performing segments for investments in your industry
  • Evaluate type of companies divesting / acquiring and ways to raise capital in the market
  • Evaluate ways to raise capital in the market, and identify major financial and legal advisors
  • Do deals with an understanding of how competitors are financed
  • Identify growth segments and opportunities in each region within the industry

Key Topics Covered:

  • Sector Highlights
  • Mergers and Acquisitions - Americas
  • Capital Raising - Americas
  • Mergers and Acquisitions - Europe, Middle East, and Africa
  • Capital Raising - Europe, Middle East, and Africa
  • Mergers and Acquisitions - Asia-Pacific
  • Capital Raising - Asia-Pacific
  • Appendix

List of Tables

  • Upstream Global Oil and Gas Transaction Multiples, Q2 2019-Q2 2020
  • Top Upstream Oil and Gas Transactions in Americas, Q2 2020
  • Upstream Oil and Gas Americas Transaction Multiples, Q2 2019-Q2 2020
  • Top Upstream Capital Raising Transactions in Americas, Q2 2020
  • Top Upstream Oil and Gas Transactions in Emea, Q2 2020
  • Upstream Oil and Gas Emea Transaction Multiples, Q2 2019-Q2 2020
  • Upstream Oil and Gas Emea Rumored M&A, Q2 2020
  • Top Upstream Capital Raising Transactions in Emea, Q2 2020
  • Top Upstream Oil and Gas Transactions in Apac, Q2 2020
  • Upstream Oil and Gas Apac Transaction Multiples, Q2 2019-Q2 2020
  • Upstream Oil and Gas Apac Rumored M&A, Q2 2020
  • Top Upstream Capital Raising Transactions in Apac, Q2 2020

List of Figures

  • Upstream Global Number of Deals by Type, Q2 2020
  • Upstream Global M&A Deal Value and Count, Q2 2019-Q2 2020
  • Upstream Oil and Gas M&A Regional Deal Share and Value, Q2 2020
  • Upstream Global Oil and Gas M&A Deal Share and Value by Terrain, Q2 2020
  • Upstream Global Capital Raising Deal Value and Count, Q2 2019-Q2 2020
  • Upstream Oil and Gas Capital Raising Regional Deal Share and Value, Q2 2020
  • Upstream Oil and Gas Americas M&A Deal Value and Count, Q2 2019-Q2 2020
  • Upstream Oil and Gas Americas Capital Raising Deal Value and Count, Q2 2019-Q2 2020
  • Upstream Oil and Gas Emea M&A Deal Value and Count, Q2 2019-Q2 2020
  • Upstream Oil and Gas Emea Capital Raising Deal Value and Count, Q2 2019-Q2 2020
  • Upstream Oil and Gas Apac M&A Deal Value and Count, Q2 2019-Q2 2020
  • Upstream Oil and Gas Apac Capital Raising Deal Value and Count, Q2 2019-Q2 2020

For more information about this report visit https://www.researchandmarkets.com/r/got7e6


Contacts

ResearchAndMarkets.com
Laura Wood, Senior Press Manager
This email address is being protected from spambots. You need JavaScript enabled to view it.
For E.S.T Office Hours Call 1-917-300-0470
For U.S./CAN Toll Free Call 1-800-526-8630
For GMT Office Hours Call +353-1-416-8900

THIS NEWS RELEASE IS INTENDED FOR DISTRIBUTION IN CANADA ONLY AND IS NOT FOR DISTRIBUTION, DIRECTLY OR INDIRECTLY, IN OR INTO THE UNITED STATES (INCLUDING ITS TERRITORIES AND POSSESSIONS, ANY STATE OF THE UNITED STATES OR THE DISTRICT OF COLUMBIA), OR ANY JURISDICTION WHERE TO DO SO WOULD CONSTITUTE A VIOLATION OF THE RELEVANT LAWS OF SUCH JURISDICTION.

VANCOUVER, British Columbia--(BUSINESS WIRE)--$GRN #RNG--Greenlane Renewables Inc. (“Greenlane”) (TSXV: GRN / FSE: 52G) is pleased to announce that, in connection with its previously announced upsized bought deal offering of 10,600,000 common shares of the Company (“Shares”) at a price of $2.17 per Share, for gross proceeds of approximately $23 million (the “Offering”), the underwriters have determined to exercise their over-allotment option to purchase an additional 1,590,000 common shares at the offering price of $2.17 per share (“Additional Shares”). Exercise of the over-allotment option will bring the total gross proceeds of the Offering to approximately $26.5 million.


TD Securities Inc. is acting as lead underwriter and sole bookrunner on behalf of itself and a syndicate of underwriters in connection with the Offering.

Closing of the Offering, which will include issuance of the Additional Shares, is anticipated to occur on January 27, 2021 and remains subject to certain conditions including, but not limited to, the receipt of all necessary approvals including the approval of the TSX Venture Exchange. The Company will use the net proceeds of the Offering for development of and investments in new renewable natural gas projects, for strategic growth initiatives, and for general corporate purposes (including the Company’s ongoing business initiatives) and working capital.

The Shares will be issued pursuant to a prospectus supplement that has been filed with the securities regulatory authorities in each of the provinces of British Columbia, Alberta, Manitoba and Ontario under the Company’s base shelf prospectus dated July 31, 2019 and may also be offered by way of private placement into the United States pursuant to Rule 144A. No securities regulatory authority has either approved or disapproved of the contents of this news release.

The securities being offered have not been, and will not be, registered under the United States Securities Act of 1933, as amended, or any state securities laws, and may not be offered, sold or delivered, directly or indirectly, in the United States, its possessions and other areas subject to its jurisdiction or to, or for the account or for the benefit of a U.S. person, unless an exemption from registration is available. This news release is for information purposes only and does not constitute an offer to sell or a solicitation of an offer to buy any securities of the Company in any jurisdiction.

About Greenlane Renewables

Greenlane Renewables is a leading global provider of biogas upgrading systems that are helping decarbonize natural gas. Our systems produce clean, low-carbon renewable natural gas from organic waste sources including landfills, wastewater treatment plants, dairy farms, and food waste, suitable for either injection into the natural gas grid or for direct use as vehicle fuel. Greenlane is the only biogas upgrading company offering the three main technologies: water wash, pressure swing adsorption, and membrane separation. With over 30 years industry experience, patented proprietary technology, and over 110 biogas upgrading systems supplied into 18 countries worldwide, including the world’s largest biogas upgrading facility, Greenlane is inspired by a commitment to helping waste producers, gas utilities or project developers turn a low-value product into a high-value low-carbon renewable resource. For further information, please visit www.greenlanerenewables.com.

FORWARD LOOKING INFORMATION – This news release contains “forward-looking information” within the meaning of applicable securities laws. All statements contained herein that are not historical in nature contain forward-looking information. Forward-looking information can be identified by words or phrases such as “may”, “expect”, “likely”, “should”, “would”, “plan”, “anticipate”, “intend”, “potential”, “proposed”, “estimate”, “believe” or the negative of these terms, or other similar words, expressions and grammatical variations thereof, or statements that certain events or conditions "may" or "will" happen. The forward looking information contained in this press release includes expectations about the likelihood of completing the Offering, the amount of funds to be raised, the use of proceeds of the Offering and the ability of the Company to secure required regulatory acceptances. The forward-looking information contained herein is made as of the date of this press release and is based on assumptions management believed to be reasonable at the time such statements were made, including management's perceptions of future growth, results of operations, operational matters, historical trends, current conditions and expected future developments, as well as other considerations that are believed to be appropriate in the circumstances. While we consider these assumptions to be reasonable based on information currently available to management, there is no assurance that such expectations will prove to be correct. By their nature, forward looking information is subject to inherent risks and uncertainties that may be general or specific and which give rise to the possibility that expectations, forecasts, predictions, projections or conclusions will not prove to be accurate, that assumptions may not be correct and that objectives, strategic goals and priorities will not be achieved. A variety of factors, including known and unknown risks, many of which are beyond our control, could cause actual results to differ materially from the forward-looking information in this press release. Such factors include, without limitation, the risk of failure to satisfy customary closing conditions of the Offering. Additional risk factors can also be found in the Company's annual information form and prospectuses, which have been filed under the Company's SEDAR profile at www.sedar.com. Readers are cautioned not to put undue reliance on forward-looking information. The Company undertakes no obligation to update or revise any forward-looking information, whether as a result of new information, future events or otherwise, except as required by applicable law. Forward-looking statements contained in this news release are expressly qualified by this cautionary statement.


Contacts

Incite Capital Markets
Eric Negraeff / Darren Seed
Ph: 604.493.2004
Brad Douville, President & CEO, Greenlane Renewables
Email: This email address is being protected from spambots. You need JavaScript enabled to view it.

Provides one-stop shop for the industry’s most robust midstream analysis at the company and segment level

CENTENNIAL, Colo.--(BUSINESS WIRE)--#energy--East Daley Capital Advisors, Inc., the midstream expert, today announced that their data and analysis will be available through the Bloomberg Terminal. The Bloomberg Terminal is the latest solution to integrate and deliver East Daley’s midstream energy data, coverage, and expertise.


Users will now be able to access East Daley’s data and reports directly on the Bloomberg Terminal to better integrate industry-leading analysis into their existing workflows. Earnings Estimates and Segment-Level Financial Models will provide a five-year outlook for top North American midstream equities. This information is powered by East Daley’s patented G&P Methodology and its Midstream Asset-level Database which includes over 1,000 assets from both public and private companies. An assortment of East Daley’s proprietary industry and company research reports will also be available with frequencies ranging from daily to quarterly.

“We’re excited to provide our clients with faster and more efficient access to our unrivalled financial and operational data on one of the industry’s leading platforms,” said Justin Carlson, Co-Founder and Chief Strategy Officer at East Daley Capital. “The same world-class research driven by asset-level analysis that East Daley has become known for is now accessible for clients through the Bloomberg Terminal.”

Earnings Estimates: East Daley’s five-year forecast for EBITDA, Free Cash Flow, CAPEX, Net Debt and Dividend Per Share allows users to quickly view and compare East Daley’s consolidated-level estimates to consensus and other research providers to identify opportunities. It also enables them to track how East Daley’s estimates have changed over time and to pull the data directly into their existing workflows.

Segment-Level Financial Models: Segment-level financial models provide financial and operational data at the segment and consolidated level for each company under East Daley’s coverage. This data provides a deeper cut into the Earnings Estimates and can be accessed directly on the Bloomberg Terminal via MODL <GO> or downloaded as a Microsoft Excel file.

Data Intelligence Reports: An assortment of East Daley’s proprietary research reports provide context to the quantitative Earnings Estimates and Segment-Level Financial Models. These reports will include East Daley’s most powerful research including Board Reports, Roadmaps, Data Insights, Midstream Navigators and The Daley Note.

“Many research providers have dropped midstream coverage leaving a significant analytical void in an extremely complex, data intensive industry,” said Andy Ptacek, CPA, Senior Director at East Daley Capital. “Establishing our independent research on Bloomberg will enhance transparency to financial markets for an asset class we believe is positioned to generate significant amounts of free cash flows, even in these uncertain times.”

To learn more or sign up, visit the East Daley Data Distribution page.

About East Daley Capital Advisors, Inc.
East Daley Capital (EDC) is the only comprehensive provider of midstream energy asset-level data and analysis that covers both the capital and commodity sectors. East Daley goes deep to empower its clients with North American Midstream energy expertise found nowhere else on the market. The company’s proprietary methodologies and datasets uncover risk and opportunity by leveraging analysis of the intersection of energy capital and commodity markets. East Daley provides unbiased, actionable market intelligence to many of the largest midstream companies in the oil and gas industry, as well as investors and capital market participants in the energy sector to give them the EDC Advantage with their strategy and execution. For more information visit http://www.eastdaley.com.


Contacts

Media Contact:
East Daley Capital
Meredith Bagnulo
This email address is being protected from spambots. You need JavaScript enabled to view it.
303-513-7494

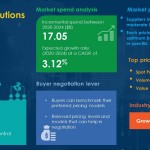
LONDON--(BUSINESS WIRE)--#apac--Global procurement intelligence advisory firm, SpendEdge, has announced the release of their Oil Spill Solutions Market Intelligence Report, for the Utilities market is expected to grow by USD 17.05 billion as we reach 2024.


Collaborations with global suppliers will also help buyers in cost-saving and ensure high-quality procurement in the forthcoming years in this dynamic market. Price forecasts are beneficial in purchase planning, especially when supplemented by the constant monitoring of price influencing factors. During the forecast period, the market expects a change of 4%-6%,” says senior procurement analyst at SpendEdge.

Looking for more insights from this report? Request a free sample report

  • Oil Spill Solutions Report Insights
    • The Oil Spill Solutions market is set to showcase a CAGR of around 3.12%
    • SpendEdge’s analysts expects that suppliers will have moderate bargaining power in this market
    • Holistic category management approach will help buyers

This report is available at a discount for a limited time only: View a procurement intelligence snapshot before purchasing

  • Oil Spill Solutions Pricing Trends
    • The pressure from substitutes and a high level of threat from new entrants has resulted in the moderate bargaining power of suppliers.
    • Buyers should align their preferred pricing models for Oil Spill Solutions with the wider industry and identify the cost-saving potential.
    • Perpetual license, package pricing, and subscription based are the most widely adopted pricing models in the Oil Spill Solutions.

To get instant access to over 1000 market-ready procurement intelligence reports without any additional costs or commitment, Subscribe Now for Free.

Browse Related Reports:

Oil Spill Solutions Market 2020-2024: Key Highlights

  • CAGR of the market during the forecast period 2020-2024
  • Detailed information on factors that will assist Oil Spill Solutions market growth during the next five years
  • Estimation of the Oil Spill Solutions market size
  • Predictions on upcoming trends and changes in supplier behavior
  • The growth of the Oil Spill Solutions market
  • Analysis of the market’s competitive landscape and detailed information on vendors
  • Comprehensive details of factors that will challenge the growth of Oil Spill Solutions market vendors

Get unlimited access to all our reports. Our Insights platform provides ready-to-use procurement research reports, latest supplier news, innovation landscape, markets insights, supplier tracking, and much more at the click of a button. Start your free trial now.

About SpendEdge:

SpendEdge shares your passion for driving sourcing and procurement excellence. We are the preferred procurement market intelligence partner for 120+ Fortune 500 firms and other leading companies across numerous industries. Our strength lies in delivering robust, real-time procurement market intelligence reports and solutions.

To know more Request for demo


Contacts

SpendEdge
Anirban Choudhury
Marketing Manager
Ph No: +1 (872) 206-9340
Contact us

 Sunlight and Apollo-Affiliated Spartan Acquisition Corp. II (NYSE: SPRQ) Enter Into Business Combination Agreement

Institutional Investors Led By Chamath Palihapitiya, Coatue, Funds and Accounts Managed by BlackRock, Franklin Templeton and Neuberger Berman Commit to Invest $250 Million at Closing in Common Stock PIPE at $10.00 per Share

Pro Forma Implied Equity Value of the Combined Company is Approximately $1.3 Billion

Webcast Scheduled for Today at 9:00 AM Eastern

NEW YORK & CHARLOTTE, N.C.--(BUSINESS WIRE)--Sunlight Financial LLC (“Sunlight”), a premier U.S. residential solar financing platform, and Spartan Acquisition Corp. II (NYSE: SPRQ) (“Spartan”), a publicly-traded special purpose acquisition company sponsored by funds managed by an affiliate of Apollo Global Management, Inc. (NYSE: APO) (together with its consolidated subsidiaries, “Apollo”), today announced that they have entered into a definitive agreement for a business combination that will result in Sunlight becoming a publicly listed company.

Upon closing of the transaction, the combined public company will be named Sunlight Financial Holdings Inc. Sunlight Financial LLC will be the new public holding company’s sole operating subsidiary and Sunlight’s existing management team will continue to lead the business.

Sunlight Overview

Sunlight is a B2B2C fintech platform that provides residential solar contractors with seamless point-of-sale (“POS”) financing capabilities and delivers unique, attractive assets to capital providers. Through its proprietary technology and deep contractor network, Sunlight offers instant credit decisions and affordable solar loans to homeowners nationwide. Sunlight prides itself on creating value for all constituents it serves – solar contractors, capital providers, and consumers.

Residential solar is a multibillion-dollar market at the forefront of the fast-growing clean energy industry. To date, Sunlight has funded over $3.5 billion of loans through its proprietary platform. Sunlight’s best-in-class underwriting has delivered the industry’s strongest-performing residential solar loans to its funding partners. As a tech-enabled solar financing provider, Sunlight is committed to strong environmental, social and governance (“ESG”) principles. Sunlight has arranged financing for more than an estimated 100,000 residential solar systems, which will produce over 500 megawatts of solar-generated electricity and avoid more than 10 million metric tons of carbon dioxide emissions.

Sunlight’s existing investors include Tiger Infrastructure Partners, FTV Capital, and founder Hudson Sustainable Group.

Management Comments

“Sunlight partners with contractors and capital providers to accelerate the United States’ transition to a clean energy future,” said Matt Potere, Chief Executive Officer of Sunlight. “We are proud to have built a profitable, capital-light company that generates significant free cash flow and is poised for strong, sustainable growth. Our proprietary technology platform offers contractors robust tools to sell more solar systems and consumers a fast, fully-digital, and frictionless experience. Our risk management drives industry-low credit losses and results in strong risk-adjusted returns for capital providers. This, in turn, reduces our cost of capital and facilitates the deployment of financial products that help contractors grow.”

“I am grateful for the support of Sunlight’s major equityholders and the value they bring to our areas of core competence, and they will remain our largest shareholders following closing. Our original institutional equityholder, Tiger Infrastructure, is a growth-oriented infrastructure investor that brings a wealth of solar energy expertise. FTV Capital, our most recent equityholder, is a leading financial services growth investor, with a track record in specialty finance and scaling innovative, high-growth companies. Our team is thrilled to now team up with Spartan and Apollo,” added Mr. Potere. “Apollo is one of the preeminent financial institutions in the world and shares our vision for a sustainable future. In strengthening our balance sheet and accessing Apollo’s strategic support through this business combination, we expect to continue to scale the Sunlight platform to sustain and accelerate both revenue and earnings growth, and further establish our business as the premier point-of-sale financing platform for residential solar contractors and customers.”

“Spartan and Apollo are committed to being ESG leaders. We are excited to team up with Sunlight to enable the energy transition by providing affordable, responsible financing for customers to own their residential solar systems,” said Geoffrey Strong, CEO of Spartan and Senior Partner, Co-head of Infrastructure and Natural Resources at Apollo. “Matt and the Sunlight team have built an outstanding, proprietary fintech platform to pursue that mission. The business has substantial operating leverage, which well prepares Sunlight to grow and profit for years to come.”

Sunlight Highlights

  • Leading POS platform through which over $3.5 billion of loans have been originated in the rapidly growing residential solar market
  • Proprietary, scalable and highly-rated Orange® technology platform provides more than 14,000+ users a seamless experience, with instant credit decision making and automated loan underwriting, processing and funding
  • Diversified mix of more than 800 solar and home improvement contractors, including national, regional and local installers and contractors
  • Industry-leading credit quality and loan performance with industry-low credit losses
  • Broad and diverse network of capital providers that have consistently extended and upsized their commitments
  • Profitable – strong free cash flow, strong operating leverage and expanding margins
  • Robust risk management and compliance underpin stellar portfolio performance for premier capital providers
  • Strong management team with expertise in specialty finance, fintech and renewable energy

Transaction Highlights

The business combination reflects an estimated implied pro forma equity value at closing of $1.3 billion. In connection with the transaction, investors led by Chamath Palihapitiya, Coatue, funds and accounts managed by BlackRock, Franklin Templeton and accounts advised by Neuberger Berman Investment Advisers LLC have committed to invest $250 million in a private purchase of Spartan’s Class A Common Stock at $10.00 per share immediately prior to the closing of the transaction.

Upon the closing of the transaction, existing Sunlight equityholders are expected to own approximately 50% of the combined company, Spartan stockholders are expected to own approximately 26%, and PIPE participants are expected to own approximately 19%. The pro forma board will include nominees from existing Sunlight equityholders Tiger Infrastructure Partners and FTV Capital, nominees from Spartan, and independent directors to be nominated before closing.

The Boards of Directors of each of Spartan and Sunlight have unanimously approved the transaction. The transaction will require the approval of the stockholders of Spartan and equityholders of Sunlight, the effectiveness of a registration statement to be filed with the Securities and Exchange Commission (the “SEC”) in connection with the transaction, satisfaction of the conditions stated in the definitive agreement and other customary closing conditions. The transaction is expected to close in the second quarter of 2021.

Advisors

Citi acted as exclusive financial advisor to Sunlight. Credit Suisse, Citi and Cowen acted as PIPE placement agents to Spartan. Hunton Andrews Kurth LLP acted as the legal advisor to Sunlight, Vinson & Elkins L.L.P. acted as the legal advisor to Spartan, Latham & Watkins LLP acted as the legal advisor to the placement agents, and Gibson Dunn & Crutcher LLP advised a transaction committee of the Board of Directors of Spartan.

Webcast Information

Investors may listen to a pre-recorded webcast regarding the proposed business combination later today at 9:00 am ET. Please visit Sunlight’s investor relations website sunlightfinancial.com/investors to access the webcast – a replay will be available shortly after the webcast’s completion and on Spartan’s website at spartanspacii.com.

Investor Presentation

An investor presentation will be available at sunlightfinancial.com/investors and filed with the SEC as an exhibit to a Current Report on Form 8-K prior to the call, and available on the SEC website at www.sec.gov.

Dial-in Information

The pre-record may also be accessed by dialing (877) 407-4018 for domestic callers or (201) 689-8471 for international callers. Once connected with the operator, please provide the conference ID of “13715622.”

A replay of the pre-record will also be available today from 11:00 am ET to 11:59 pm ET on February 8, 2021. To access the replay, the domestic toll-free access number is (844) 512-2921 and participants should provide the conference ID of “13715622.”

About Sunlight Financial LLC

Sunlight Financial is a point-of-sale finance company. Sunlight partners with contractors nationwide to provide homeowners with financing for the installation of residential solar systems and other home improvement upgrades. Sunlight’s best-in-class technology and deep credit expertise simplify and streamline consumer finance, ensuring a fast and frictionless process for both contractors and homeowners. For more information, visit www.sunlightfinancial.com.

About Spartan Acquisition Corp. II

Spartan Acquisition Corp. II (NYSE: SPRQ) is a special purpose acquisition entity focused on the energy value chain in North America and was formed for the purpose of effecting a merger, capital stock exchange, asset acquisition, stock purchase, reorganization or similar business combination with one or more businesses. Spartan is sponsored by Spartan Acquisition Sponsor II LLC, which is owned by a private investment fund managed by an affiliate of Apollo Global Management, Inc. (“Apollo”) (NYSE: APO). For more information, please visit www.spartanspacii.com.

About Tiger Infrastructure Partners

Tiger Infrastructure Partners is a middle-market private equity firm that invests in growing infrastructure platforms. Tiger Infrastructure targets investments in communications, energy transition, transportation, and related sectors, primarily located in North America and Europe. For more information, visit www.tigerinfrastructure.com.

About FTV Capital

FTV Capital is a growth equity investment firm that has raised nearly $4 billion to invest in high-growth companies offering a range of innovative solutions in three sectors: enterprise technology and services, financial services, and payments and transaction processing. FTV’s experienced team leverages its domain expertise and proven track record in each of these sectors to help motivated management teams accelerate growth. FTV also provides companies with access to its Global Partner Network®, a group of the world’s leading enterprises and executives who have helped FTV portfolio companies for two decades. FTV has offices in San Francisco and New York. For more information, please visit www.ftvcapital.com.

Forward-Looking Statements

The information in this press release includes “forward-looking statements” within the meaning of Section 27A of the Securities Act of 1933, as amended (the “Securities Act”), and Section 21E of the Securities Exchange Act of 1934, as amended. All statements, other than statements of present or historical fact included in this press release, regarding Spartan’s proposed business combination of Sunlight, Spartan’s ability to consummate the transaction, the benefits of the transaction and the combined company’s future financial performance, as well as the combined company's strategy, future operations, estimated financial position, estimated revenues and losses, projected costs, prospects, plans and objectives of management are forward-looking statements. When used in this press release, the words “could,” “should,” “will,” “may,” “believe,” “anticipate,” “intend,” “estimate,” “expect,” “project,” the negative of such terms and other similar expressions are intended to identify forward-looking statements, although not all forward-looking statements contain such identifying words. These forward-looking statements are based on management’s current expectations and assumptions about future events and are based on currently available information as to the outcome and timing of future events. Except as otherwise required by applicable law, Spartan and Sunlight disclaim any duty to update any forward-looking statements, all of which are expressly qualified by the statements in this section, to reflect events or circumstances after the date of this press release. Spartan and Sunlight caution you that these forward-looking statements are subject to numerous risks and uncertainties, most of which are difficult to predict and many of which are beyond the control of either Spartan or Sunlight. In addition, Spartan and Sunlight caution you that the forward-looking statements contained in this press release are subject to the following factors: (i) the occurrence of any event, change or other circumstances that could delay the business combination or give rise to the termination of the agreements related thereto; (ii) the outcome of any legal proceedings that may be instituted against Spartan or Sunlight following announcement of the transactions; (iii) the inability to complete the business combination due to the failure to obtain approval of the shareholders of Spartan, or other conditions to closing in the transaction agreement; (iv) the risk that the proposed business combination disrupts Spartan’s or Sunlight’s current plans and operations as a result of the announcement of the transactions; (v) Sunlight’s ability to realize the anticipated benefits of the business combination, which may be affected by, among other things, competition and the ability of Sunlight to grow and manage growth profitably following the business combination; (vi) costs related to the business combination; (vii) changes in applicable laws or regulations; and (viii) the possibility that Sunlight may be adversely affected by other economic, business, and/or competitive factors. Should one or more of the risks or uncertainties described in this press release, or should underlying assumptions prove incorrect, actual results and plans could different materially from those expressed in any forward-looking statements. Additional information concerning these and other factors that may impact the operations and projections discussed herein can be found in Spartan’s periodic filings with the Securities and Exchange Commission (the “SEC”), including Spartan’s prospectus filed with the SEC on November 27, 2020. Spartan’s SEC filings are available publicly on the SEC’s website at www.sec.gov.

Important Information for Investors and Shareholders

In connection with the proposed business combination, Spartan will file a registration statement on Form S-4 (the “Form S-4”) with the SEC. The Form S-4 will include a proxy statement/prospectus of Spartan. Additionally, Spartan will file other relevant materials with the SEC in connection with the business combination. Copies may be obtained free of charge at the SEC’s web site at www.sec.gov. Security holders of Spartan are urged to read the proxy statement/prospectus and the other relevant materials when they become available before making any voting decision with respect to the proposed business combination because they will contain important information about the business combination and the parties to the business combination. The information contained on, or that may be accessed through, the websites referenced in this press release is not incorporated by reference into, and is not a part of, this press release.

Participants in the Solicitation

Spartan and its directors and officers may be deemed participants in the solicitation of proxies of Spartan’s shareholders in connection with the proposed business combination. Security holders may obtain more detailed information regarding the names, affiliations and interests of certain of Spartan’s executive officers and directors in the solicitation by reading Spartan’s prospectus filed with the SEC on November 27, 2020, and the proxy statement and other relevant materials filed with the SEC in connection with the business combination when they become available. Information concerning the interests of Spartan’s participants in the solicitation, which may, in some cases, be different than those of their stockholders generally, will be set forth in the proxy statement relating to the business combination when it becomes available.


Contacts

Sunlight Financial LLC
Investor Relations
Garrett Edson, ICR
This email address is being protected from spambots. You need JavaScript enabled to view it.
888.315.0822

Public Relations
Doug Donsky / Brian Ruby, ICR
This email address is being protected from spambots. You need JavaScript enabled to view it.
646.677.1844

Apollo Global Management, Inc./Spartan Acquisition Corp. II
For investors please contact:
Peter Mintzberg
Head of Investor Relations
Apollo Global Management, Inc.
+1 212 822 0528
This email address is being protected from spambots. You need JavaScript enabled to view it.

For media inquiries please contact:
Joanna Rose
Global Head of Corporate Communications
Apollo Global Management, Inc.
+1 212 822 0491
This email address is being protected from spambots. You need JavaScript enabled to view it.

DALLAS--(BUSINESS WIRE)--Kosmos Energy (NYSE/LSE: KOS) announced today the following schedule for its fourth quarter 2020 results:


  • Earnings Release: Monday, February 22, 2021, pre-UK market open via Business Wire, Regulatory News Service, and the Company’s website at www.kosmosenergy.com.
  • Conference Call: Monday, February 22, 2021 at 11:00 a.m. EST. The call will be available via telephone and webcast.

Dial-in telephone numbers:
Toll Free: 1-877-407-3982
Toll/International: 1-201-493-6780
UK Toll Free: 0800 756 3429

Webcast:
investors.kosmosenergy.com

  • Webcast Conference Call Replay: A replay of the webcast will be available at investors.kosmosenergy.com for approximately 90 days following the event.

About Kosmos Energy

Kosmos is a full-cycle deepwater independent oil and gas exploration and production company focused along the Atlantic Margins. Our key assets include production offshore Ghana, Equatorial Guinea and U.S. Gulf of Mexico, as well as a world-class gas development offshore Mauritania and Senegal. Kosmos is listed on the New York Stock Exchange and London Stock Exchange and is traded under the ticker symbol KOS. As an ethical and transparent company, Kosmos is committed to doing things the right way. The Company’s Business Principles articulate our commitment to transparency, ethics, human rights, safety and the environment. Read more about this commitment in our Corporate Responsibility Report. For additional information, visit www.kosmosenergy.com.

Forward-Looking Statements

This press release contains forward-looking statements within the meaning of Section 27A of the Securities Act of 1933 and Section 21E of the Securities Exchange Act of 1934. All statements, other than statements of historical facts, included in this press release that address activities, events or developments that Kosmos expects, believes or anticipates will or may occur in the future are forward-looking statements. Kosmos’ estimates and forward-looking statements are mainly based on its current expectations and estimates of future events and trends, which affect or may affect its businesses and operations. Although Kosmos believes that these estimates and forward-looking statements are based upon reasonable assumptions, they are subject to several risks and uncertainties and are made in light of information currently available to Kosmos. When used in this press release, the words “anticipate,” “believe,” “intend,” “expect,” “plan,” “will” or other similar words are intended to identify forward-looking statements. Such statements are subject to a number of assumptions, risks and uncertainties, many of which are beyond the control of Kosmos, which may cause actual results to differ materially from those implied or expressed by the forward-looking statements. Further information on such assumptions, risks and uncertainties is available in Kosmos’ Securities and Exchange Commission (“SEC”) filings. Kosmos undertakes no obligation and does not intend to update or correct these forward-looking statements to reflect events or circumstances occurring after the date of this press release, except as required by applicable law. You are cautioned not to place undue reliance on these forward-looking statements, which speak only as of the date of this press release. All forward-looking statements are qualified in their entirety by this cautionary statement.


Contacts

Investor Relations
Jamie Buckland
+44 (0) 203 954 2831
This email address is being protected from spambots. You need JavaScript enabled to view it.

Media Relations
Thomas Golembeski
+1-214-445-9674
This email address is being protected from spambots. You need JavaScript enabled to view it.

Independent director nominees include former UPS CFO Richard Peretz, Sense Photonics CEO and former Google automotive services program lead Shauna McIntyre, CDK Global CEO and former Intel CEO Brian Krzanich, and Raymour & Flanigan Chairman and CEO Neil Goldberg

Seasoned leaders bring experience across emerging mobility technologies, software and data connectivity, vehicle distribution and commercial delivery

TROY, Mich. & DELRAY BEACH, Fla.--(BUSINESS WIRE)--Electric Last Mile, Inc. (ELMS), a commercial electric vehicle (EV) solutions company, and Forum Merger III Corporation (NASDAQ: FIII, FIIIU, FIIIW) (Forum) today announced the nominees for the board of directors of the combined company that will result from the previously announced combination of Forum, a special purpose acquisition company, and ELMS. The director nominees bring decades of leadership across the technology, mobility and commercial delivery sectors. Following the proposed business combination, the common stock of the post-combination company is expected to continue to be listed on The Nasdaq Stock Market.

The director nominees for the post-combination company are former UPS CFO Richard Peretz, Sense Photonics CEO and former Google automotive services program lead Shauna McIntyre, CDK Global CEO and former Intel CEO Brian Krzanich, Raymour & Flanigan Chairman and CEO Neil Goldberg, Forum’s Co-CEO and CFO David Boris, ELMS Co-Founder and CEO James Taylor and ELMS Co-Founder and Executive Chairman Jason Luo. Messrs. Goldberg and Boris currently serve on the board of directors of Forum.

I look forward to working with such a seasoned and diverse board of directors as ELMS prepares to begin production of its first vehicle,” said ELMS Co-Founder and CEO, James Taylor. “The directors’ collective experience in emerging mobility technologies, software and connected data, automotive distribution and commercial delivery aligns with our future business strategy and will help us to execute our shared vision of transforming the last mile delivery market with efficient and sustainable solutions.”

Richard Peretz, Former CFO, United Parcel Service, Inc. (UPS)
Fortune 50 Financial Leadership and Global Last Mile Delivery Expertise
Independent Director Nominee

Richard has nearly four decades of financial and operating experience in the last mile industry. As CFO and a member of the UPS Management Committee, Richard oversaw all financial operations and served as the company’s senior liaison to the investor, finance and analyst community. He brings significant international experience, having served as International Chief Financial Officer, during which time he opened UPS operations in China. Richard also helped expand the company’s international small package footprint in Poland, Japan, the United Kingdom, eastern Europe, South Korea, Vietnam and Costa Rica among others. Richard also brings extensive operations, leadership and M&A experience, having overseen the acquisitions of healthcare companies Polar Speed, Poltraf, Cemelog and Pieffe Group, as well as the acquisitions of iParcel and Kiala to strengthen UPS’s business-to-consumer portfolio. He also was a member of the team that managed UPS’s initial public offering in 1999, at the time the largest in U.S. history.

Shauna McIntyre, CEO, Sense Photonics, Inc. and Former program lead, Google automotive services, Alphabet, Inc.
Operating Executive at the Intersection of Technology and Mobility
Independent Director Nominee

Shauna is a seasoned executive with operating experience at the intersection of technology and mobility. Since April 2020, she has served as CEO of Sense Photonics, Inc., a 3D vision company building high-performance, mass manufacturable LiDAR solutions for next-generation transportation needs. She previously led Google’s automotive services program, during which time she released Google products, including Google Maps, into automakers’ new vehicle models. Prior to this, she served as Chief of Staff for Google’s consumer electronics division, which combines the best of Google AI, software, and hardware. Shauna earlier led the U.S. New Mobility Practice for management consulting firm, Egon Zehnder, and was VP of Honeywell’s Commercial Vehicle Turbocharger platform. Shauna began her career at Ford, where she automated manufacturing plants overseas and led final assembly production, and later joined McKinsey & Company as a management consultant. Shauna holds a Bachelor of Science and Master of Science in Mechanical Engineering from UCLA and UC Berkeley, respectively, and an M.B.A. from the Harvard Business School. She is the co-founder of the North American Council for Freight Efficiency (NACFE). Since 2019, she has served on the Board of Directors of Lithia Motors (NYSE: LAD), one of the largest providers of personal transportation solutions in the U.S.

Brian Krzanich, CEO, CDK Global LLC and Former CEO, Intel Corporation
Leadership Across the Technology Ecosystem and in Manufacturing and Supply Chain
Independent Director Nominee

Brian is an experienced leader of companies developing transformational technologies. He is currently CEO of CDK Global LLC (CDK Global), which provides integrated technology solutions to auto, truck, motorcycle, marine, recreational and heavy equipment dealers worldwide. Prior to joining CDK Global, Brian served as CEO of Intel Corporation from May 2013 to June 2018. As CEO, Brian led Intel’s transition from a PC-centric to a data-focused company and oversaw the acquisition of emerging technology companies such as autonomous driving company Mobileye. Brian also led the transformation of Intel’s workforce, pledging to invest $300 million to improve diversity at the company. He joined Intel in 1982 as an engineer, ultimately serving as President and General Manager of Assembly and Test, SVP and General Manager of Manufacturing and Supply Chain and EVP and COO, responsible for global manufacturing, supply chain, human resources and information technology. Brian currently serves on the Boards of AMS AG and Footprint US. He previously served on the Boards of Deere & Company and Semiconductor Industry Association, as well as the Chair of the FAA Drone Advisory Committee, which advises the Federal Aviation Administration.

Neil Goldberg, Chairman and CEO, Raymour & Flannigan Furniture and Holdings
Experienced Retailer and Real Estate Developer
Independent Director Nominee

Neil has 45 years of retailing, merchandising and general management experience. He currently serves as Chairman and CEO of Raymour & Flannigan Furniture and Holdings, one of the largest furniture retailers in the U.S. Over his tenure, he has led the growth of Raymour & Flannigan from three local stores in 1972 to its current 130 locations across seven Northeast states, employing more than 6,500 people. In addition, Neil has been active on numerous national industry boards including the National Home Furnishing Association, the Home Furnishing Council, the American Furniture Hall of Fame and FurnitureFan.com. He has also participated on the board of local and national charitable organizations including the HSBC Bank Regional Board, the Metropolitan Development Association, Say Yes to Education, the Salvation Army of Central New York and the Syracuse University School of Management. Neil served as a Director of Forum Merger Corporation and Forum Merger II Corporation and currently serves as a Director of Forum.

David Boris, Co-CEO and CFO, Forum Merger III Corporation
SPAC Pioneer with Significant Financial and Capital Markets Experience

David has over 30 years of Wall Street experience in mergers and corporate finance and has been involved in approximately 20 SPAC transactions as a board member, underwriter and M&A advisor, including ten business combinations totaling over $5.0 billion. He is currently Co-CEO and CFO and a Director of Forum and a Director of Tattooed Chef, Inc., which completed its merger with Forum Merger II Corporation in October 2020. David previously was a Director of ConvergeOne (NASDAQ: CVON), which merged with Forum Merger Corporation in a business combination. Earlier, David served as Senior Managing Director and Head of Investment Banking at Pali Capital, Inc., an investment banking firm, and prior to this was a founding member and Managing Director of Morgan Joseph & Co. Inc.

James Taylor, Co-Founder and CEO, Electric Last Mile, Inc. (ELMS)
Seasoned Leader of Global Automotive Brands

James is a highly accomplished automotive executive with over 30 years of experience building and leading global automotive brands. As Co-Founder and CEO of ELMS, he is now applying his extensive experience to disrupt the commercial last mile delivery sector. James has spent the last decade in the emerging EV segment, most recently as CEO of SF Motors and Chief Sales and Marketing Officer at Karma Automotive, where he established the company’s brand and market positioning and built a successful network for sales, service and distribution focused on providing a world-class customer experience. James was previously one of the founding members of Workhorse Group and served as the company’s Chairman and CEO. During his tenure, he raised capital investments and pivoted the company’s focus from the electrification of cars and SUVs to medium duty commercial trucks. Earlier, James ran some of General Motors’ most well-known and unique brands, serving as President of Cadillac and CEO of Hummer. James graduated from McMaster University with a degree in Mechanical Engineering and Business.

Jason Luo, Co-Founder Executive Chairman, Electric Last Mile, Inc.
Leader in Automotive Safety with Proven Record of Shareholder Value Creation

Co-Founder and Executive Chairman of ELMS, Jason brings senior leadership experience from some of the world’s most prominent automotive OEMs, mobility safety companies and private equity firms. In addition to ELMS, Jason is currently an Operating Executive at Crestview Partners, a private equity firm focused on industrials, media and financial services. Earlier, Jason was Chairman and CEO of Ford China, where he oversaw all operations for the 1.2 million vehicle business and the company’s joint venture partnership with Changan Automobile. Previously, Jason served for nearly a decade as CEO of Key Safety Systems (now Joyson Safety Systems), one of the largest automotive safety companies in the world. During his transformational tenure, he expanded Key Safety Systems’ global operations and led an active M&A program that saw the company’s acquisition by Crestview Partners, FountainVest Partners and later Ningbo Joyson Electronic Corp. His tenure culminated with the company’s acquisition of Takata Corporation for $1.6 billion, creating the second-largest airbag maker globally with $7.5 billion in annual sales and more than 60,000 employees. Jason currently serves on the board of directors of Accuride, Elo Touch Solutions, ATC Drivetrain and Sybridge Technologies. He was named the Regional Entrepreneur of the Year in 2015 by Ernst & Young for entrepreneurial excellence in the automotive supplier category.

Forward-Looking Statements
This press release includes “forward-looking statements” within the meaning of the “safe harbor” provisions of the Private Securities Litigation Reform Act of 1995. Forum and ELMS’s actual results may differ from their expectations, estimates and projections and consequently, you should not rely on these forward-looking statements as predictions of future events. Words such as “expect,” “estimate,” “project,” “budget,” “forecast,” “anticipate,” “intend,” “plan,” “may,” “will,” “could,” “should,” “believes,” “predicts,” “potential,” “continue,” and similar expressions are intended to identify such forward-looking statements. These forward-looking statements include, without limitation, Forum’s and ELMS’s expectations with respect to future performance and anticipated financial impacts of the business combination, the satisfaction of the closing conditions to the business combination, the size, demands and growth potential of the markets for ELMS’s products and ELMS’s ability to serve those markets, ELMS’s ability to develop innovative products and compete with other companies engaged in the commercial delivery vehicle industry and/or the electric vehicle industry, ELMS’s ability to attract and retain customers, the estimated go to market timing and cost for ELMS’s products, the implied valuation of ELMS and the timing of the completion of the business combination. These forward-looking statements involve significant risks and uncertainties that could cause the actual results to differ materially from the expected results. Most of these factors are outside Forum’s and ELMS’s control and are difficult to predict. Factors that may cause such differences include, but are not limited to: (1) the occurrence of any event, change or other circumstances that could give rise to the termination of the agreement and plan of merger (“Merger Agreement”) relating to the business combination or could otherwise cause the business combination to fail to close; (2) the inability of ELMS to (x) execute the transaction agreements for the Carveout Transaction (as defined below) that are in form and substance acceptable to Forum (at Forum’s sole discretion), (y) acquire a leasehold interest or fee simple title to the Indiana manufacturing facility or (z) secure key intellectual property rights related to its proposed business; (3) the outcome of any legal proceedings that may be instituted against Forum or ELMS following the announcement of the business combination; (4) the inability to complete the business combination, including due to failure to obtain approval of the stockholders of Forum or other conditions to closing in the Merger Agreement; (5) the receipt of an unsolicited offer from another party for an alternative business transaction that could interfere with the business combination; (6) the inability to obtain the listing of the common stock of the post-acquisition company on the Nasdaq Stock Market or any alternative national securities exchange following the business combination; (7) the risk that the announcement and consummation of the business combination disrupts current plans and operations; (8) the inability to recognize the anticipated benefits of the business combination, which may be affected by, among other things, competition and the ability of the combined company to grow and manage growth profitably and retain its key employees; (9) costs related to the business combination; (10) changes in applicable laws or regulations; (11) the possibility that ELMS may be adversely affected by other economic, business, and/or competitive factors; (12) the impact of COVID-19 on the combined company’s business; and (13) other risks and uncertainties indicated from time to time in the proxy statement to be filed relating to the business combination, including those under the “Risk Factors” section therein, and in Forum’s other filings with the SEC. Some of these risks and uncertainties may in the future be amplified by the COVID-19 outbreak and there may be additional risks that Forum and ELMS consider immaterial or which are unknown. Forum and ELMS caution that the foregoing list of factors is not exclusive. Forum and ELMS caution readers not to place undue reliance upon any forward-looking statements, which speak only as of the date made. ELMS is currently engaged in limited operations only and its ability to carry out its business plans and strategies in the future are contingent upon the closing of the proposed business combination. The consummation of the business combination is subject to, among other conditions, (i) the execution and effectiveness of transaction agreements by ELMS with SF Motors, Inc. (d/b/a SERES) that are each in form and substance acceptable to Forum (at Forum’s sole discretion), (ii) the acquisition by ELMS of a leasehold interest or fee simple title to the Indiana manufacturing facility prior to the business combination, and (iii) the securing by ELMS of key intellectual property rights related to its proposed business (collectively, the “Carveout Transaction”). All statements herein regarding ELMS’s anticipated business assume the completion of the Carveout Transaction. Forum and ELMS do not undertake or accept any obligation or undertaking to release publicly any updates or revisions to any forward-looking statements to reflect any change in their expectations or any change in events, conditions or circumstances on which any such statement is based.

Important Information About the Business Combination and Where to Find It
In connection with the business combination, Forum intends to file a preliminary proxy statement. Forum will mail a definitive proxy statement and other relevant documents to its stockholders. Forum’s stockholders and other interested persons are advised to read, when available, the preliminary proxy statement and the amendments thereto and the definitive proxy statement and documents incorporated by reference therein filed in connection with the business combination, as these materials will contain important information about Forum, ELMS and the business combination. When available, the definitive proxy statement and other relevant materials for the business combination will be mailed to stockholders of Forum as of a record date to be established for voting on the business combination. Stockholders will also be able to obtain copies of the preliminary proxy statement, the definitive proxy statement and other documents filed with the SEC that will be incorporated by reference therein, without charge, once available, at the SEC’s web site at www.sec.gov, or by directing a request to: Forum Merger III Corporation, 1615 South Congress Avenue, Suite 103, Delray Beach, FL 33445, Attention: Secretary, telephone: (212) 739-7860.

Participants in the Solicitation
Forum and its directors and executive officers may be deemed participants in the solicitation of proxies from Forum’s stockholders with respect to the business combination. A list of the names of those directors and executive officers and a description of their interests in Forum is contained in Forum’s Registration Statement on Form S-1/A, which was filed with the SEC and is available free of charge at the SEC’s web site at www.sec.gov, or by directing a request to Forum Merger III Corporation, 1615 South Congress Avenue, Suite 103, Delray Beach, FL 33445, Attention: Secretary, telephone: (212) 739-7860. Additional information regarding the interests of such participants will be contained in the proxy statement for the business combination when available.

ELMS and its directors and executive officers may also be deemed to be participants in the solicitation of proxies from the stockholders of Forum in connection with the business combination. A list of the names of such directors and executive officers and information regarding their interests in the business combination will be included in the proxy statement for the business combination when available.

No Offer or Solicitation
This press release shall not constitute a solicitation of a proxy, consent or authorization with respect to any securities or in respect of the business combination. This press release shall also not constitute an offer to sell or the solicitation of an offer to buy any securities, nor shall there be any sale of securities in any states or jurisdictions in which such offer, solicitation or sale would be unlawful prior to registration or qualification under the securities laws of any such jurisdiction.

About Electric Last Mile, Inc.
ELMS is focused on redefining the last mile with efficient, customizable and sustainable solutions. ELMS’s first vehicle, the Urban Delivery, is anticipated to be the first Class 1 electric vehicle in the U.S. market. The company is headquartered in Troy, Michigan.

About Forum Merger III Corporation
Forum Merger III Corporation (NASDAQ: FIII, FIIIU, FIIIW) is a blank check company formed for the purpose of entering into a merger, capital stock exchange, asset acquisition, stock purchase, reorganization or similar business combination with one or more businesses. Forum’s mandate is to consider an initial business combination target in any business or industry and it focused its search on companies with an aggregate enterprise value of approximately $500 million to $2 billion that are based in the United States. Forum is led by Co-Chief Executive Officers Marshall Kiev and David Boris.


Contacts

This email address is being protected from spambots. You need JavaScript enabled to view it.

This email address is being protected from spambots. You need JavaScript enabled to view it.

This email address is being protected from spambots. You need JavaScript enabled to view it.

DUBLIN--(BUSINESS WIRE)--The "Global Oil and Gas Midstream Capital Raising, Q2 2020 Quarterly Review" report has been added to ResearchAndMarkets.com's offering.


The "Global Oil and Gas Midstream Capital Raising, Q2 2020 Quarterly Review" report is an essential source of data and trend analysis on financings (equity/debt offerings and PE/VC) in the Midstream oil and gas industry. The report provides detailed comparative quarter-on-quarter data, on the number of deals and their value, sub-divided into deal types by geographies.

Scope

  • Analyze market trends for the Midstream oil and gas industry in the global arena
  • Analysis of Equity/Debt Offerings, Private Equity, and Venture Financing in the Midstream oil and gas industry
  • Information on the top deals that took place in the industry
  • Geographies covered include - North America, Europe, Asia Pacific, South & Central America, Oceania, and Middle East & Africa

Reasons to Buy

  • Enhance your decision making capability in a more rapid and time sensitive manner
  • Evaluate ways to raise capital in the market, and identify major financial and legal advisors
  • Do deals with an understanding of how competitors are financed
  • Identify growth segments and opportunities in each region within the industry

Sector Highlights

  • Capital Raising - North America
  • Capital Raising - Europe
  • Capital Raising - Asia
  • Capital Raising - South America
  • Capital Raising - Middle East
  • Capital Raising - Oceania
  • Capital Raising - Africa
  • Appendix

For more information about this report visit https://www.researchandmarkets.com/r/rdcg8


Contacts

ResearchAndMarkets.com
Laura Wood, Senior Press Manager
This email address is being protected from spambots. You need JavaScript enabled to view it.

For E.S.T Office Hours Call 1-917-300-0470
For U.S./CAN Toll Free Call 1-800-526-8630
For GMT Office Hours Call +353-1-416-8900

Not for Distribution to United States Newswire Services or for Dissemination in the United States

TORONTO--(BUSINESS WIRE)--Sherritt International Corporation (“Sherritt”) (TSX:S) today announced production results for the fourth quarter and full-year ended December 31, 2020 and provided guidance for expected production, unit costs and capital spending in 2021.


Highlights

  • Finished nickel production at the Moa Joint Venture (“Moa JV”) in 2020 on a 100% basis was 31,506 tonnes, largely in line with guidance of 32,000 to 33,000 tonnes for the year. Production was negatively impacted by railway service disruptions in Q1, an extended plant shutdown in Q3 due to additional found work scope and reduced contractor availability due to COVID-19, and by unplanned repairs to autoclaves in Q4.
  • Finished cobalt production was 3,370 tonnes on a 100% basis, consistent with guidance for the year.
  • Power production in 2020 was 602 gigawatts (GWh) of electricity, exceeding guidance for the year.
  • Finished nickel production in 2021 is expected to be 32,000 – 34,000 tonnes on a 100% basis.
  • Finished cobalt production in 2021 is expected to be 3,300 – 3,600 tonnes on a 100% basis.
  • Net direct cash costs at the Moa JV are forecasted to be in the range of US$4.25 and US$4.75 per pound of finished nickel sold in 2021.
  • Sherritt’s share of capital spending in 2021 is forecasted at US$45 million. The total will be primarily earmarked to replace existing equipment and infrastructure at Moa operations as well as at the refinery in Fort Saskatchewan, Alberta.

Summary of 2020 Production Results

Production volumes1

Q4 2020

FY2020

Guidance for
2020

Moa Joint Venture (tonnes, 100% basis)


Nickel

8,040

31,506

32,000 – 33,000

Cobalt

902

3,370

3,300 – 3,400

Oil – Cuba (gross working-interest, bopd)

2,599

2,947

3,000 – 3,300

Oil and Gas – All operations (net working-interest) boepd)

1,518

1,687

1,800 – 2000

Power (GWh, 331/3% basis)

144

602

500 – 550

Finished nickel production at the Moa JV in 2020 was 31,506 tonnes on a 100% basis, largely in line with guidance of 32,000 – 33,000 tonnes for the year. Finished cobalt production at the Moa JV in 2020 was 3,370 tonnes on a 100% basis, consistent with guidance for the year.

Finished nickel and cobalt production in 2020 were negatively impacted by railway service disruptions in Q1, an extended plant shutdown in Q3 due to additional found work scope and reduced contractor availability due to COVID-19, and by unplanned repairs to autoclaves in Q4. Production totals achieved at the Moa JV in 2020 benefitted from additional health and safety measures implemented in Q1 to prevent the spread of COVID-19.

Production for the Oil and Gas business in Cuba on a gross working interest was 2,947 barrels of oil per day, largely in line guidance for the year. Oil production in Cuba in 2020 was impacted by natural reservoir declines at Puerto Escondido/Yumuri.

Power production in 2020 was 602 gigawatt hours of electricity, exceeding guidance for the year. Higher production for 2020 was largely due to the decision to defer maintenance activities initially planned for the year as a result of reduced liquidity.

Sherritt expects to report its full operational and financial results for the three- and 12-month periods ended December 31, 2020 on February 10, 2021 after market close.

2021 Guidance
Guidance for 2021 is based on a number of assumptions and estimates as of January 22, 2021 including, among other items, assumptions about commodity prices, anticipated costs and expenditures. Sherritt’s guidance for 2021 also includes estimates based on a number of risks and uncertainties, which may cause actual results to differ materially.

Summary of 2021 Production Forecasts

Production volumes2

Guidance for 2021

Moa Joint Venture (tonnes, 100% basis)


Nickel

32,000 – 34,000

Cobalt

3,300 – 3,600

Power (GWh, 331/3% basis)

450 - 500

In 2021, nickel and cobalt production at the Moa JV are forecasted at between 32,000 and 34,000 tonnes and 3,300 and 3,600 tonnes, respectively. Anticipated production for 2021 is consistent with initial guidance for 2020 and recent performance at the Moa JV, and reflective of the ongoing commitment to operational excellence and employee health and safety.

The Power business is forecasted to produce between 450 and 500 gigawatt hours of electricity in 2021. The forecast for 2021 is lower than guidance for 2020 due to planned maintenance activities previously deferred in 2020. Production in 2021 may be also impacted by the availability of natural gas provided to Sherritt for power production activities and operational spending in relation to the receipt of funds under Sherritt’s energy agreements with its Cuban partners.

Summary of 2021 Unit Cost Forecasts

Unit Operating Costs

Guidance for 2021


Moa Joint Venture Net Direct Cash Costs (US$ per lb.)

US$4.25 - $4.75


Power (unit operating costs, C$ per MWh)

C$30.50 - $32.00

Net direct cash costs (NDCC) at the Moa JV are forecasted at between US$4.25 and US$4.75 per pound of finished nickel sold, marginally above 2020 guidance due to higher forecasted input commodity prices. Net direct cash costs include by-product credits and input commodities that are subject to considerable change given the volatility of cobalt, fertilizers, crude oil, natural gas and sulphur prices. Forecasted NDCC for 2021 is also subject to the seasonality of fertilizer sales, which are typically higher in the second and fourth quarters. NDCC guidance for 2021 is based on a forecast cobalt reference price of US$15.58 per pound and a forecast average sulphur price of US$145 per tonne including freight and handling.

Operating costs for the Power business in 2021 are forecasted to be between C$30.50 and C32.50. The increase in forecasted unit costs for 2021 relative to 2020 guidance is due to the anticipated reduction in production due to planned maintenance activities that were deferred in 2020. Operating costs for 2021 may vary if maintenance activities are impacted by the delays in the collection of receivables.

Summary of 2021 Spending Cost Forecasts

Spending on capital3 (US$ millions/ C$millions)

2021
Guidance


Moa Joint Venture (50% basis) and Fort Site (100% basis)

US$44 (C$57)


Power (331/3% basis).

US$1.0 (C$1.3)

Sherritt’s share of capital spending at the Moa JV and at the Fort Site is forecasted at US$44 million in 2021. Capital spending in 2021 is planned for the continued replacement of mine and plant equipment.

Capital spend at the Power business is forecasted at US$1 million, consistent with 2020 guidance.

About Sherritt
Sherritt is a world leader in the mining and refining of nickel and cobalt from lateritic ores with projects and operations in Canada and Cuba. The Corporation is the largest independent energy producer in Cuba, with extensive oil and power operations across the island. Sherritt licenses its proprietary technologies and provides metallurgical services to mining and refining operations worldwide. The Corporation’s common shares are listed on the Toronto Stock Exchange under the symbol “S”.

Forward-Looking Statements
This press release contains certain forward-looking statements. Forward-looking statements can generally be identified by the use of statements that include such words as “believe”, “expect”, “anticipate”, “intend”, “plan”, “forecast”, “likely”, “may”, “will”, “could”, “should”, “suspect”, “outlook”, “potential”, “projected”, “continue” or other similar words or phrases. Specifically, forward-looking statements in this document include, but are not limited to, statements regarding future guidance and forecasts set forth in this press release and certain expectations regarding production volumes; operating costs and capital spending.

Forward looking statements are not based on historical facts, but rather on current expectations, assumptions and projections about future events, including commodity and product prices and demand; the level of liquidity and access to funding; share price volatility; production results; realized prices for production; earnings and revenues; development and exploration wells and enhanced oil recovery in Cuba; environmental rehabilitation provisions; availability of regulatory approvals; compliance with applicable environmental laws and regulations; debt repayments; collection of accounts receivable; and certain corporate objectives, goals and plans. By their nature, forward looking statements require the Corporation to make assumptions and are subject to inherent risks and uncertainties. There is significant risk that predictions, forecasts, conclusions or projections will not prove to be accurate, that those assumptions may not be correct and that actual results may differ materially from such predictions, forecasts, conclusions or projections.

The Corporation cautions readers of this press release not to place undue reliance on any forward looking statement as a number of factors could cause actual future results, conditions, actions or events to differ materially from the targets, expectations, estimates or intentions expressed in the forward looking statements. These risks, uncertainties and other factors include, but are not limited to, the impact of the COVID-19 pandemic, changes in the global price for nickel, cobalt, oil and gas or certain other commodities; supply and demand in the nickel and cobalt markets;; share price volatility; level of liquidity; access to capital; access to financing; the risk to Sherritt’s entitlements to future distributions from the Moa joint venture; risk of future non-compliance with debt restrictions and covenants; risks associated with the Corporation’s joint venture partners; variability in production at Sherritt’s operations in Cuba; potential interruptions in transportation; uncertainty of gas supply for electrical generation; Sherritt’s ability to replace depleted mineral reserves; the Corporation’s reliance on key personnel and skilled workers; the possibility of equipment and other failures; the potential for shortages of equipment and supplies; risks associated with mining, processing and refining activities; uncertainty of resources and reserve estimates; environmental risks and risks related to rehabilitation provisions estimates; risks related to the Corporation’s corporate structure; political, economic and other risks of foreign operations; risks related to Sherritt’s operations in Cuba; risks related to the U.S. government policy toward Cuba, including the U.S. embargo on Cuba and the Helms-Burton legislation; risks associated with Sherritt’s development, construction and operation of large projects generally; risks related to the accuracy of capital and operating cost estimates; foreign exchange and pricing risks; compliance with applicable environment, health and safety legislation and other associated matters; risks associated with governmental regulations regarding greenhouse gas emissions; risks relating to community relations and maintaining the Corporation’s social license to grow and operate; credit risks; shortage of equipment and supplies; competition in product markets; future market access; interest rate changes; risks in obtaining insurance; uncertainties in labour relations; uncertainty in the ability of the Corporation to enforce legal rights in foreign jurisdictions; uncertainty regarding the interpretation and/or application of the applicable laws in foreign jurisdictions; legal contingencies; risks related to the Corporation’s accounting policies; risks associated with future acquisitions; uncertainty in the ability of the Corporation to obtain government permits; risks to information technologies systems and cybersecurity; failure to comply with, or changes to, applicable government regulations; bribery and corruption risks, including failure to comply with the Corruption of Foreign Public Officials Act or applicable local anti-corruption law; uncertainties in growth management. Readers are cautioned that the foregoing list of factors is not exhaustive and should be considered in conjunction with the risk factors described in this press release and in the Corporation’s other documents filed with the Canadian securities authorities, including without limitation the Management’s Discussion and Analysis for the nine months ended September 30, 2020 and the Annual Information Form of the Corporation dated March 19, 2020 for the period ending December 31, 2019, which is available on SEDAR at www.sedar.com.

__________________
1 Nickel and cobalt production are presented on a 100% basis. Sherritt’s share varies by business unit, with the Moa JV being a 50% joint venture and Power a 33% interest.
2 As Sherritt currently anticipates expiration of its production sharing contract at Puerto Escondido/Yumuri on March 20, 2021, none of its production, unit costs or capital spend forecasts for 2021 is presented.
3 Capital spend is based on Sherritt’s ownership interests in the Moa Joint Venture (50%); Fort Site (100%), Power (33%).


Contacts

Joe Racanelli, Director of Investor Relations
416-935-2457
This email address is being protected from spambots. You need JavaScript enabled to view it.
www.sherritt.com

DUBLIN--(BUSINESS WIRE)--The "Oil and Gas Equipment and Services Mergers and Acquisitions Quarterly Deals Review - Q2 2020" report has been added to ResearchAndMarkets.com's offering.


The "Oil and Gas Equipment and Services Mergers and Acquisitions Quarterly Deals Review - Q2 2020" report is an essential source of data and trend analysis on M&A (mergers, acquisitions, and asset transactions), in the equipment and services oil and gas industry. The report provides detailed comparative quarter-on-quarter data, on the number of deals and their value, sub-divided into deal types by geographies.

Scope

  • Analyze market trends for the equipment and services oil and gas industry in the global arena
  • Review of deal trends in the market
  • Analysis of M&As in the equipment and services oil and gas industry
  • Information on the top deals that took place in the industry
  • Geographies covered include - North America, Europe, Asia Pacific, South & Central America, and Middle East & Africa

Reasons to Buy

  • Enhance your decision making capability in a more rapid and time sensitive manner
  • Find out the major deal performing segments for investments in your industry
  • Evaluate type of companies divesting / acquiring in the market
  • Identify growth segments and opportunities in each region within the industry
  • Identify top buyers in the oil and gas equipment and services industry

Sector Highlights

  • Mergers and Acquisitions - North America
  • Mergers and Acquisitions - Europe
  • Mergers and Acquisitions - Asia
  • Mergers and Acquisitions - Oceania
  • Mergers and Acquisitions - Middle East
  • Mergers and Acquisitions - Africa
  • Mergers and Acquisitions - South America
  • Appendix

For more information about this report visit https://www.researchandmarkets.com/r/twjtuz


Contacts

ResearchAndMarkets.com
Laura Wood, Senior Press Manager
This email address is being protected from spambots. You need JavaScript enabled to view it.
For E.S.T Office Hours Call 1-917-300-0470
For U.S./CAN Toll Free Call 1-800-526-8630
For GMT Office Hours Call +353-1-416-8900

DUBLIN--(BUSINESS WIRE)--The "Asia Pacific Offshore Pipeline Market Forecast to 2027 - COVID-19 Impact and Regional Analysis by Diameter, Line Type, and Product" report has been added to ResearchAndMarkets.com's offering.


The APAC offshore pipeline market is expected to grow from US$ 2,188.82 million in 2019 to US$ 2,761.26 million by 2027; it is estimated to grow at a CAGR of 3.2 % from 2020 to 2027.

New oil and gas reserves detection and discovery across APAC drive the growth of the APAC offshore pipeline market. In September 2020, Equinor - an energy company - announced the discovery of new oil & gas fields. Furthermore, in October 2020, another oil and gas company, Total and its partners announced that they will evaluate several development options for commercializing a new gas and condensate discovery. Such discoveries of new offshore oil & gas reserves across the region boost the construction of new plants and requirements for new offshore pipelines for cross-border transmission, which bolster the APAC offshore pipeline market. The upgradation in flexible pipe technology is another factor that generates the demand of offshore pipelines across the region.

Countries across APAC, especially the China and India, are adversely affected by the COVID-19 pandemic. The region comprises the world's two most populated and prominent oil producing countries. China virtually imposed strict lockdown and social isolation, restricting manufacturing activities. These measures resulted in shrinking demand for oil and other energy commodities across the country. Thus, the oil & gas construction activities across China plummeted significantly, which hindered the offshore pipeline market in the country. Similarly, Indian government is imposing a nationwide lockdown to control the growing number of COVID-19 cases. Subsequently, the lockdown and disruption of various manufacturing activities contributed significantly in reduced activities in oil & gas sector. Therefore, the overall restrictions on activities in oil & gas industries collectively hindered the demand for offshore pipelines across APAC countries during the early months of 2020. The impact of the outbreak is quite severe in 2020, and it is likely to continue in 2021. Hence, the ongoing COVID-19 crisis and critical situation in China and India would restrain the APAC offshore pipeline market growth in the next a few quarters.

Based on line type, the transport line segment led the APAC offshore pipeline market in 2019. Transport lines, also called transmission lines, are used for carrying gas or oil from one coast to another coast. These lines work similarly to a tanker carrying oil for trading purposes. They transport oil or gas from their corresponding gathering pipelines to processing, refining, or storage facilities. Transport lines are also used to carry refined petroleum products and natural gas to consumers for further distribution. Transport pipeline systems comprise equipment - such as pipe, pumps or compressors, valves, storage tanks, and breakout tanks - and facilities essential to carry the products. They are made up of steel pipe, and their diameter size can vary from several feet to inches. These pipeline systems can be constructed for operating from quite low pressures to more than 1,000 pounds per square inch of pressure, based on the product being carried. Also, their range can vary in length from hundreds of miles to hundreds of feet. All these factors are driving the growth of the APAC offshore pipeline market.

Reasons to Buy

  • Save and reduce time carrying out entry-level research by identifying the growth, size, leading players and segments in the APAC offshore pipeline market.
  • Highlights key business priorities in order to assist companies to realign their business strategies
  • The key findings and recommendations highlight crucial progressive industry trends in the APAC offshore pipeline market, thereby allowing players across the value chain to develop effective long-term strategies
  • Develop/modify business expansion plans by using substantial growth offering developed and emerging markets
  • Scrutinize in-depth APAC market trends and outlook coupled with the factors driving the offshore pipeline market, as well as those hindering it
  • Enhance the decision-making process by understanding the strategies that underpin commercial interest with respect to client products, segmentation, pricing and distribution

Market Dynamics

Drivers

  • Upsurge in Demand for Natural Gas and Crude Oil
  • Necessity for Safe, Cost-Effective, and Efficient Connectivity

Restraints

  • Difficulties Related to Cross- Border Pipeline Transportation

Opportunities

  • New Oil & Gas Reserves Detection

Future Trends

  • Upgradation in Flexible Pipe Technology

Companies Mentioned

  • Bechtel Corporation
  • Fugro
  • John Wood Group PLC
  • Larsen & Toubro Limited
  • McDermott International, Inc.
  • Petrofac Limited
  • Saipem S.p.A
  • Sapura Energy Berhad
  • Subsea 7 S.A.
  • TechnipFMC plc

For more information about this report visit https://www.researchandmarkets.com/r/xtsswa


Contacts

ResearchAndMarkets.com
Laura Wood, Senior Press Manager
This email address is being protected from spambots. You need JavaScript enabled to view it.
For E.S.T Office Hours Call 1-917-300-0470
For U.S./CAN Toll Free Call 1-800-526-8630
For GMT Office Hours Call +353-1-416-8900

Offshore Source Logo

Offshore Source keeps you updated with relevant information concerning the Offshore Energy Sector.

Any views or opinions represented on this website belong solely to the author and do not represent those of the people, institutions or organizations that Offshore Source or collaborators may or may not have been associated with in a professional or personal capacity, unless explicitly stated.

Corporate Offices

Technology Systems Corporation
8502 SW Kansas Ave
Stuart, FL 34997

info@tscpublishing.com