Business Wire News

HOUSTON--(BUSINESS WIRE)--Halliburton Company (NYSE: HAL) announced today that its annual meeting of shareholders will take place on May 17, 2023, at 9 a.m. CDT. The Company will hold the meeting at its headquarters located at 3000 N. Sam Houston Parkway East, Houston, Texas. The record date for determination of shareholders entitled to vote at the meeting is March 20, 2023.


About Halliburton

Halliburton is one of the world’s leading providers of products and services to the energy industry. Founded in 1919, we create innovative technologies, products, and services that help our customers maximize their value throughout the life cycle of an asset and advance a sustainable energy future. Visit us at www.halliburton.com; connect with us on Facebook, Twitter, LinkedIn, Instagram and YouTube.


Contacts

Investor Relations Contact
David Coleman
This email address is being protected from spambots. You need JavaScript enabled to view it.
281-871-2688

Press Contact
Brad Leone
This email address is being protected from spambots. You need JavaScript enabled to view it.
281-871-2601

Leading cleantech integrator receives recognition for its Chicago Smart Lighting Program, which transformed Chicago’s streetlighting system and is designed to save the city approximately $100 million over the next 10 years

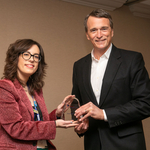
FRAMINGHAM, Mass.--(BUSINESS WIRE)--#carbonreduction--Ameresco, Inc., (NYSE: AMRC), a leading cleantech integrator specializing in energy efficiency and renewable energy, today announced its Chicago Smart Lighting Program (CSLP) has been awarded the Inspiring Efficiency Impact Award by the Midwest Energy Efficiency Alliance, a collaborative network advancing energy efficiency in the Midwest for sustainable economic development and environmental stewardship.


Completed in 2022, CSLP is the largest city-led wireless smart streetlight program in the United States. The project transformed the city’s streetlight system, reducing energy consumption and increasing visibility for public safety. Ameresco replaced approximately 280,000 existing outdated High Pressure Sodium light fixtures with new energy-efficient LED lights and created a modern lighting management system to streamline maintenance and repairs. The project is designed to save the city approximately $100 million throughout the next 10 years.

“The benefits of this project are twofold, not only do the implemented upgrades lead to significant reductions in energy consumption, but they also positively impact the surrounding community with cost, safety and equitable solutions,” said Louis P. Maltezos, EVP, Ameresco. “We are honored to be recognized by the Midwest Energy Efficiency Alliance and hope this project sets a precedent for cities of all sizes — demonstrating how the public and private sectors can collaborate to improve energy infrastructure and public safety with smart solutions that reduce emissions and energy costs.”

The Inspiring Efficiency Impact Award is presented to an organization that has shown exemplary leadership in advancing energy efficiency across the Midwest through significant and measurable impact by a project, program or strategy that has reduced energy consumption or resulted in a quantifiable positive impact on health, emissions reductions, energy burden or other societal impact, based on the target market.

“This year’s Inspiring Efficiency Award winner has proven to be champions of energy efficiency within their communities,” said MEEA Executive Director Stacey Paradis. “The Midwest Energy Efficiency Alliance is proud to recognize and honor the commitment of the Chicago Smart Lighting Program to reduce energy consumption within the city.”

The Inspiring Efficiency Impact Award was presented to Ameresco on February 1 at the Midwest Energy Solutions Conference, a yearly conference for energy stakeholders to raise awareness and reinforce the importance of energy efficiency in the Midwest.

To learn more about the energy efficiency solutions offered by Ameresco, visit www.ameresco.com/energy-efficiency/.

About Ameresco, Inc.

Founded in 2000, Ameresco, Inc. (NYSE:AMRC) is a leading cleantech integrator and renewable energy asset developer, owner and operator. Our comprehensive portfolio includes energy efficiency, infrastructure upgrades, asset sustainability and renewable energy solutions delivered to clients throughout North America and Europe. Ameresco’s sustainability services in support of clients’ pursuit of Net Zero include upgrades to a facility’s energy infrastructure and the development, construction, and operation of distributed energy resources. Ameresco has successfully completed energy saving, environmentally responsible projects with Federal, state and local governments, healthcare and educational institutions, housing authorities, and commercial and industrial customers. With its corporate headquarters in Framingham, MA, Ameresco has more than 1,000 employees providing local expertise in the United States, Canada, and Europe. For more information, visit www.ameresco.com.

About the Midwest Energy Efficiency Alliance

The Midwest Energy Efficiency Alliance (MEEA) is a collaborative network advancing energy efficiency in the Midwest for sustainable economic development and environmental stewardship across 13 states. MEEA is the Midwest’s key proponent and resource for energy efficiency policy, helping to educate and advise a diverse range of stakeholders on ways to pursue a cost-effective, energy-efficient agenda. Through partnerships, programs and a dynamic annual conference, we curate a forward-thinking conversation to realize the economic and environmental benefits of energy efficiency. For more information, visit www.mwalliance.org.


Contacts

Media:
Ameresco: Leila Dillon, 508-661-2264, This email address is being protected from spambots. You need JavaScript enabled to view it.

LUGANO, Switzerland & WESTLAKE VILLAGE, Calif.--(BUSINESS WIRE)--Energy Vault Holdings, Inc. (“Energy Vault”) (NYSE: NRGV), a global energy storage company today announced that on February 24, 2023, the Compensation Committee of Energy Vault’s Board of Directors granted restricted stock unit awards covering an aggregate of 693,203 shares of its common stock to 25 new, non-executive employees under the Energy Vault Holdings, Inc. 2022 Employment Inducement Award Plan (as amended and/or restated, the “Inducement Award Plan”). The restricted stock units were granted as inducements material to the employees entering into employment with Energy Vault in accordance with New York Stock Exchange Listing Rule 303A.08.

The Inducement Award Plan is used exclusively for the grant of equity awards to individuals who were not previously employees of Energy Vault, or following a bona fide period of non-employment, as an inducement material to such individuals’ entering into employment with Energy Vault, pursuant to New York Stock Exchange Listing Rule 303A.08.

The restricted stock units will vest with respect to the underlying shares as to 25% of the restricted stock units, on the first anniversary of the vesting commencement date and 6.25% of the restricted stock units, upon the employee’s completion of each three-month period of continuous service thereafter, subject to the employee’s continued employment with Energy Vault on such vesting dates. The restricted stock units are subject to the terms and conditions of the Inducement Award Plan and the terms of the restricted stock unit award agreement covering the grant.

About Energy Vault

Energy Vault develops and deploys utility-scale energy storage solutions designed to transform the world's approach to sustainable energy storage. The company's comprehensive offerings include proprietary gravity-based storage, battery storage, and green hydrogen energy storage technologies. Each storage solution is supported by the company’s hardware technology-agnostic energy management system software and integration platform. Unique to the industry, Energy Vault’s innovative technology portfolio delivers customized short-and-long-duration energy storage solutions to help utilities, independent power producers, and large industrial energy users significantly reduce levelized energy costs while maintaining power reliability. Utilizing eco-friendly materials with the ability to integrate waste materials for beneficial reuse, Energy Vault’s EVx™ gravity-based energy storage technology is facilitating the shift to a circular economy while accelerating the global clean energy transition for its customers. Please visit www.energyvault.com for more information.


Contacts

Investors:
This email address is being protected from spambots. You need JavaScript enabled to view it.

Media:
This email address is being protected from spambots. You need JavaScript enabled to view it.

ATLANTA & RAMSEY, N.J.--(BUSINESS WIRE)--Southern Cross, a subsidiary of Sparus Holdings, and Konica Minolta Sensing Americas, Inc., a wholly owned subsidiary of Konica Minolta, Inc., are announcing a partnership to provide state-of-the-art natural gas leak detection and emission reduction solutions. Sparus Holdings is a complementary suite of outsourced field and professional services for utility and industrial customers and Konica Minolta Sensing Americas Inc. is a leading provider of next generation gas monitoring systems. The two companies are combining decades of industry field knowledge, instrumentation and advanced analytics expertise to deliver data-driven asset management solutions for the broader utility market segment.


Yoshiki Fukai, General Manager of Imaging IoT Solutions Business Unit, Konica Minolta, Inc. said: “We are honored to announce our partnership with Southern Cross. We expect the capabilities and features of the GMP02 such as quantification, unique image processing, straightforward data management and utilization, will lead to a safer and more stable operation for Southern Cross’ industry partners.”

Richard Summers, President, and CEO of Sparus Holdings commented: “We are extremely pleased to partner with Konica Minolta Sensing Americas and bring state-of-the-art gas sensing technologies to the energy sector. We believe that technology is changing the industry’s capability to identify and quantify greenhouse gas emissions. The GMP02 optical gas detector is a critical component in helping the energy sector improve safety, reduce leak-related losses and drive data to assist in identifying greenhouse gas emissions.”

About Sparus Holdings

Sparus is a leading provider of a complementary suite of field and professional services for utility and industrial customers. Through a growing family of brands, Sparus provides gas line inspection and leak detection, utility metering services, utility locate services, field-based project oversight, project management and controls, and other related services. For over 75 years, the Company has been committed to the highest standards of safety and industry expertise to meet the evolving needs of its customers. www.sparusholdings.com


Contacts

Jody Boyles
Southern Cross
Vice President Business Development
Email: This email address is being protected from spambots. You need JavaScript enabled to view it.
Phone: 919-799-3701

Ryo (Ryan) Minegishi
Konica Minolta Sensing Americas
Business Development Manager, Monitoring Biz Dept.
E-mail This email address is being protected from spambots. You need JavaScript enabled to view it.
Mobile: 201-739-3243 | Office: 201-785-2403

New Company to Be a Renewable Energy and Sustainable Agriculture Platform

ANNAPOLIS, Md.--(BUSINESS WIRE)--BurTech Acquisition Corp. (NASDAQ: BRKH), a publicly traded special purpose acquisition company or “SPAC” (“BurTech”), and CleanBay Renewables Inc. (“CleanBay”), a late-stage enviro-tech company focused on the production of sustainable renewable natural gas (“RNG”), green hydrogen and natural controlled-release fertilizer, today announced the signing of a letter of intent (“LOI”) for a potential business combination.


CleanBay’s board of directors believes that a business combination with BurTech is a positive and natural next step for the company. Executives believe this new company will provide opportunities to make meaningful climate and energy transition contributions and is in the best interest of CleanBay shareholders.

“We believe that our process improves the air, soil and water quality around our facilities. In addition, our renewable energy products are a sustainable, environmentally friendly way to reduce emissions and provide a low carbon solution for vehicle fuel, residential use, EV charging and hydrogen production,” said CleanBay’s Executive Chairman Thomas Spangler. “We believe our projects can help to address U.S. climate policy objectives and many of the United Nation’s Sustainable Development Goals.”

“Our process converts agricultural byproducts into high-quality fertilizer, returning it back to the farming community to further support crop development and healthy soils,” said CleanBay’s Chief Executive Officer Donal Buckley. “As we continue to develop new facilities, we hope to become one of the largest single sources for climate-friendly fertilizer in the country.”

“We are excited to partner with CleanBay and believe that access to capital markets will enable CleanBay to commercialize and scale its proprietary and patented processes. We look forward to working with CleanBay’s management team to consummate the business combination. CleanBay’s 'shovel-ready projects' present an attractive investment opportunity for existing and future shareholders. In addition, access to state municipal bond incentives in Maryland and California could create a robust economic platform to assist in financing these plants and produce RNG, hydrogen and natural fertilizer on an industrial scale. Most importantly 'Made in the USA' sources of RNG, through offtake agreements, can help fossil fuel producers and agriculture companies lower their carbon footprint. With nine identified facilities and eight potential future facilities in the pipeline, we believe that CleanBay will become a significant player in the North American RNG and natural fertilizer market,” said BurTech Chairman and CEO Shahal Khan.

According to CleanBay’s management, at full capacity, each CleanBay bioconversion facility can recycle more than 150,000 tons of poultry litter annually. By repurposing a potential source of excess nutrients, each facility can generate more than 750,000 MMBtus of sustainable RNG, 100,000 tons of natural, controlled-release fertilizer, and up to an estimated 1,000,000 tons of CO2 equivalent carbon credits that can be available for monetization in global carbon markets. As an alternative to renewable natural gas, the facilities can also produce clean hydrogen at an estimated rate of 20,000 tons per year. CleanBay has accumulated proprietary intellectual property covering its conversion process to include trade secrets, a U.S. patent and pending patent applications in the U.S. and Europe.

Transaction Overview

Under the terms of the letter, CleanBay’s existing equity holders would convert 100 percent of their equity into the combined public company. The proposed transaction values CleanBay at $330 million. The BurTech trust account currently holds approximately $294 million in cash. BurTech expects to announce additional details regarding the proposed business combination when a definitive merger agreement is executed in the second quarter of 2023.

Completion of a business combination with CleanBay is subject to, among other matters, the completion of due diligence, the negotiation of a definitive agreement providing for the transaction, satisfaction of the conditions negotiated therein and approval of the transaction by the board and stockholders of both BurTech and CleanBay. There can be no assurance that a definitive agreement will be entered into or that the proposed transaction will be consummated on the terms or timeframe currently contemplated, or at all..

About CleanBay Renewables Inc.

CleanBay is an enviro-tech company founded in 2013 focused on the sustainable management of agriculture byproducts through anaerobic digestion and nutrient recovery technologies which produce renewable natural gas and controlled-release natural/organic fertilizer. The company is actively developing projects throughout the United States. CleanBay’s solution to reduce air, soil and water pollution provides businesses with an opportunity to offset CO2 emissions, poultry growers with an alternative use for their poultry litter, and crop farmers with a controlled-release fertilizer to increase sustainable food production and support healthy soils.

CleanBay has one shovel ready project located in Maryland and eligible for up to $250 million of tax-exempt municipal bonds, a second project close to shovel ready (anticipated Q4 2023) in Delaware, and a third project in California that received a $540 million initial resolution from the California Pollution Control Financing Authority for revenue bonds, for which the company is in the process of securing permits. As part of its broader portfolio, CleanBay has identified 17 other potential project locations across the U.S. CleanBay believes that it can rapidly develop its portfolio of bioconversion facilities to address climate change globally.

For more information, visit https://cleanbayrenewables.com.

About BurTech Acquisition Corp.

BurTech Acquisition Corp. is a blank check company whose business purpose is to effect a merger, capital stock exchange, asset acquisition, stock purchase, reorganization, or similar business combination with one or more businesses or entities. BurTech is led by its Chief Executive Officer, Shahal Khan.

No Offer or Solicitation

This press release shall not constitute a solicitation of a proxy, consent, or authorization with respect to any securities or in respect of the proposed business combination. This press release shall also not constitute an offer to sell or the solicitation of an offer to buy any securities, nor shall there be any sale of securities in any states or jurisdictions in which such offer, solicitation, or sale would be unlawful prior to registration or qualification under the securities laws of any such jurisdiction. No offering of securities shall be made except by means of a prospectus meeting the requirements of Section 10 of the Securities Act of 1933, as amended, or an exemption therefrom.

Forward-Looking Statements

The disclosure herein includes certain statements that are not historical facts but are forward-looking statements for purposes of the safe harbor provisions under the U.S. Private Securities Litigation Reform Act of 1995. Forward-looking statements generally are accompanied by words such as “believe,” “may,” “will,” “estimate,” “continue,” “anticipate,” “intend,” “expect,” “should,” “would,” “plan,” “predict,” “potential,” “seem,” “seek,” “future,” “outlook,” and similar expressions that predict or indicate future events or trends or that are not statements of historical matters. These forward-looking statements include, but are not limited to, statements regarding projections, estimates and forecasts of revenue and other financial and performance metrics and projections of market opportunity and expectations, BurTech’s ability to enter into a definitive agreement or consummate a transaction with the target company and BurTech’s ability to obtain the financing necessary to consummate the potential transaction. These statements are based on various assumptions and on the current expectations of BurTech’s management and are not predictions of actual performance. These forward-looking statements are provided for illustrative purposes only and are not intended to serve as, and must not be relied on by any investor as, a guarantee, an assurance, a prediction or a definitive statement of fact or probability. Actual events and circumstances are difficult or impossible to predict and will differ from assumptions. Many actual events and circumstances are beyond the control of BurTech and the target company. These forward-looking statements are subject to a number of risks and uncertainties, including: BurTech’s ability to enter into a definitive agreement with respect to the proposed business combination or consummate a transaction with the target company; the risk that the approval of the stockholders of BurTech for the potential transaction is not obtained; failure to realize the anticipated benefits of the potential transaction, including as a result of a delay in consummating the potential transaction; the amount of redemption requests made by BurTech’s stockholders and the amount of funds remaining in BurTech’s trust account after satisfaction of such requests; those factors discussed in BurTech’s prospectus for its initial public offering dated December 10, 2021, under the heading “Risk Factors,” and other documents of BurTech filed, or to be filed, with the SEC. If the risks materialize or assumptions prove incorrect, actual results could differ materially from the results implied by these forward-looking statements. There may be additional risks that BurTech presently does not know or that BurTech currently believes are immaterial that could also cause actual results to differ from those contained in the forward-looking statements. In addition, forward-looking statements reflect BurTech’s expectations, plans or forecasts of future events and views as of the date hereof. BurTech anticipates that subsequent events and developments will cause BurTech’s assessments to change. However, while BurTech may elect to update these forward-looking statements at some point in the future, BurTech specifically disclaims any obligation to do so. These forward-looking statements should not be relied upon as representing BurTech’s assessments as of any date subsequent to the date of this press release. Accordingly, undue reliance should not be placed upon the forward-looking statements.

For more information, visit https://BurTechacq.us/.


Contacts

Camille Chetrit
BurTech Acquisition Corp.
+1 2404235984

Andy Hallmark
Director of Corporate Communications
CleanBay Renewables
This email address is being protected from spambots. You need JavaScript enabled to view it.

DUBAI, United Arab Emirates--(BUSINESS WIRE)--Dubai Electricity and Water Authority (DEWA) has invited researchers and scientists to submit their research papers to participate in the first Middle East and North Africa Solar Conference 2023, which DEWA will organise from 15 to 18 November 2023. DEWA receives the applications until 30 April 2023 through https://mbrsic.ae/en/mena-sc


The research papers focus on a wide range of topics, including unconventional and new concepts for future technologies; silicon photovoltaic materials and devices; Perovskite and organic materials and solar cells; PV module and system reliability in MENA region; solar resources for PV and forecasting; and power electronics and grid integration.

HE Saeed Mohammed Al Tayer, MD & CEO of DEWA, highlighted that the conference is the first scientific and technical conference of its kind in the region that specialises in photovoltaic systems. Al Tayer noted that the conference will be held in conjunction with the Water, Energy, Technology, and Environment Exhibition (WETEX) and the Dubai Solar Show 2023. DEWA organises the largest exhibition for water, energy, sustainability and innovation technologies in the region and one of the largest specialised exhibitions in the world. Holding the two events simultaneously is an additional momentum to gather all global decision-makers, officials, and researchers to showcase the latest innovative technologies, practices and experiments in sustainability and renewable and clean energy.

Waleed Bin Salman, Executive Vice President of Business Support and Excellence at DEWA, explained that the MENA Solar Conference 2023 focuses on all areas of photovoltaic systems, devices, and materials, from basic science to commercial applications. The conference includes a series of specialised panel discussions, with the participation of several experts and specialists worldwide. A specialised technical committee will evaluate the research papers to be highlighted during the conference.

More information on MENA Solar Conference and how to participate are available on https://mbrsic.ae/en/mena-sc

*Source: AETOSWire


Contacts

Dubai Electricity and Water Authority
Khuloud Al Ali, +971563974965
This email address is being protected from spambots. You need JavaScript enabled to view it.

DALLAS--(BUSINESS WIRE)--Pioneer Natural Resources Company (NYSE:PXD) ("Pioneer" or "the Company") announced today that the Company is not contemplating a significant business combination or other acquisition transaction.


About Pioneer

Pioneer is a large independent oil and gas exploration and production company, headquartered in Dallas, Texas, with operations in the United States. For more information, visit www.pxd.com.


Contacts

Investors
Tom Fitter - 972-969-1821
Greg Wright - 972-969-1770
Chris Leypoldt - 972-969-5834

Media and Public Affairs
Christina Voss - 972-969-5706

CALGARY, Alberta--(BUSINESS WIRE)--Pembina Pipeline Corporation ("Pembina" or "the Company") (TSX: PPL; NYSE: PBA) has filed its audited consolidated financial statements for the year ended December 31, 2022, related management's discussion, and analysis and its annual information form for the year ended December 31, 2022 with Canadian securities regulatory authorities. Pembina has also filed its Form 40-F for the year ended December 31, 2022 with the U.S. Securities and Exchange Commission.


Copies of the filed documents are available at www.sedar.com, www.sec.gov (for the Form 40-F) and in the Investors section of our website at www.pembina.com. Shareholders may also request a printed copy of the audited consolidated financial statements and related management’s discussion and analysis free of charge by contacting Investor Relations at This email address is being protected from spambots. You need JavaScript enabled to view it. or 1-855-880-7404.

About Pembina

Pembina Pipeline Corporation is a leading energy transportation and midstream service provider that has served North America's energy industry for more than 65 years. Pembina owns an integrated network of hydrocarbon liquids and natural gas pipelines, gas gathering and processing facilities, oil and natural gas liquids infrastructure and logistics services, and an export terminals business. Through our integrated value chain, we seek to provide safe and reliable energy solutions that connect producers and consumers across the world, support a more sustainable future and benefit our customers, investors, employees and communities. For more information, please visit www.pembina.com.

Purpose of Pembina: We deliver extraordinary energy solutions so the world can thrive.

Pembina is structured into three Divisions: Pipelines Division, Facilities Division and Marketing & New Ventures Division.

Pembina's common shares trade on the Toronto and New York stock exchanges under PPL and PBA, respectively. For more information, visit www.pembina.com.


Contacts

For further information:
Investor Relations
(403) 231-3156 | 1-855-880-7404
e-mail: This email address is being protected from spambots. You need JavaScript enabled to view it.
www.pembina.com

Initiated 2023 earnings guidance and reaffirmed long-term EPS growth rate target


PORTLAND, Ore.--(BUSINESS WIRE)--Northwest Natural Holding Company, (NYSE: NWN) (NW Natural Holdings), reported financial results and highlights including:

  • Reported net income of $86.3 million (or $2.54 per share) for 2022, an increase of $7.6 million or 10%, compared to net income of $78.7 million (or $2.56 per share) for 2021
  • Added 8,600 natural gas meters over the last 12 months equating to a 1.1% growth rate
  • Invested $338.6 million in our gas and water utility systems to support growth and greater reliability and resiliency
  • Scored second in the West for customer satisfaction among large utilities in the 2022 J.D. Power Gas Utility Residential Customer Satisfaction Study, making this the 19th consecutive year customers have ranked NW Natural among the top two utilities
  • New rates went into effect on Nov. 1, 2022 related to Oregon and Washington NW Natural general rate cases
  • Closed our largest water and wastewater acquisition to date in Yuma, Arizona increasing NW Natural Water's customer base by approximately 70% and bringing total connections to approximately 62,500 at Dec. 31, 2022
  • Demonstrating continued success, in 2023 NW Natural Water signed agreements to add over 2,800 water and wastewater connections in key states in its service territory
  • Expect renewable natural gas (RNG) facilities, in which NW Natural Renewables is investing, to begin producing commercial volumes in the second quarter of 2023
  • Honored as one of the 2022 World's Most Ethical Companies® by Ethisphere1
  • Increased our dividend for the 67th consecutive year to an annual indicated dividend rate of $1.94 per share
  • Initiated 2023 earnings guidance in the range of $2.55 to $2.75 per share and reaffirmed long-term earnings per share growth rate target of 4% to 6%

"In 2022, NW Natural Holdings demonstrated our continued commitment toward decarbonization, diversification and growth and delivered strong financial performance," said David H. Anderson, president and CEO of NW Natural Holdings. "It was a transformative year on many fronts. We grew our gas and water utilities, began operation of the first RNG facility under the landmark Oregon Senate Bill 98 - producing RNG on behalf of our gas utility customers, closed our largest water and wastewater acquisition to date, and began construction of the first RNG facilities we’re investing in through our competitive RNG business. We’re proud to operate three growing businesses that provide essential services."

For 2022, NW Natural Holdings reported net income of $86.3 million (or $2.54 per share), an increase of $7.6 million or 10%, compared to $78.7 million (or $2.56 per share) for 2021. Results reflected higher revenues in Oregon and Washington for our natural gas utility, customer growth, and lower pension expense, partially offset by higher operations and maintenance expenses, depreciation, and general tax expenses. Net income from our other activities decreased primarily due to higher interest expense. Earnings per share were also affected by issuing common shares in 2022.

1 “World’s Most Ethical Companies” and “Ethisphere” names and marks are registered trademarks of Ethisphere LLC.

KEY INITIATIVES AND EVENTS

New Rates Effective from NW Natural's Oregon General Rate Case

New rates in Oregon were effective beginning Nov. 1, 2022. The OPUC approved the multi-party settlements in NW Natural's general rate case increasing the revenue requirement $59.4 million including final adjustments for capital projects placed into service and the depreciation study. The order included a capital structure of 50% common equity and 50% long-term debt, return on equity of 9.4%, cost of capital of 6.836%, and rate base of $1.76 billion, or an increase of $320 million since the last rate case.

Second Year of Washington Multi-year Rate Case Goes into Effect

Washington rates increased $3.0 million on Nov. 1, 2022 as the second year of the Washington general rate case went into effect. In 2021, the Washington Utilities and Transportation Commission issued an order concluding NW Natural's general rate case filed in December 2020. The order provides for an annual revenue requirement increase over two years, consisting of a $5.0 million increase in the first year beginning Nov. 1, 2021 and up to an incremental $3.0 million increase in the second year beginning Nov. 1, 2022.

NW Natural Renewables Poised to See RNG Facilities Begin Operations

NW Natural Renewables Holdings, LLC (NW Natural Renewables), a competitive RNG business, is investing a combined $50 million in two RNG facilities owned by EDL. Substantial completion and commissioning of the facilities is anticipated in the second quarter of 2023.

NW Natural Water Continues Steady Pace of Acquisitions

In October 2022, NW Natural Water closed its acquisition of the Far West water and wastewater utilities (referred to as Foothills Utilities post acquisition) in Yuma, Arizona adding 25,000 connections and expanding Water's service territory into a fifth state. In addition to Far West, NW Natural Water recently signed other agreements to acquire water and wastewater utilities serving more than 2,800 connections with key additions to its newly acquired Arizona territory and growing Texas assets. Complimenting this acquisition activity, NW Natural Water signed an agreement to support a realty management company as it builds out the water and wastewater infrastructure for a new multi-family development on the west side of Houston.

ANNUAL RESULTS

The following financial comparisons are between the annual results for 2022 and 2021 with individual year-over-year drivers below presented on an after-tax basis using a statutory tax rate of 26.5%, unless otherwise noted.

NW Natural Holdings' annual results by business segment are summarized in the table below:


2022


2021


Change

In thousands, except per share data

Amount


Per Share


Amount


Per Share


Amount


Per Share

Net income:


Natural Gas Distribution segment

$

79,690

$

2.34


$

68,988

$

2.24


$

10,702


$

0.10


Other


6,613


0.20


9,678


0.32


(3,065

)


(0.12

)

Consolidated

$

86,303


$

2.54


$

78,666


$

2.56


$

7,637


$

(0.02

)


Diluted Shares


33,984


30,752


3,232


Natural Gas Distribution Segment

Natural Gas Distribution (NGD) segment net income increased $10.7 million (or $0.10 per share) reflecting new rates in Oregon that went into effect on Nov. 1, 2022, new rates in Washington that went into effect on Nov. 1, 2021 and Nov. 1, 2022, and customer growth, partially offset by higher operating expenses. Earnings per share was affected by issuing 4.4 million of common shares during 2022.

Margin increased $19.2 million reflecting new rates, which contributed $11.0 million; the amortization of deferrals approved in the rate case, including COVID and cybersecurity, contributed $2.1 million; and customer growth of 1.1% over the last 12 months provided $4.5 million. In addition, margin increased $1.5 million due to higher usage from colder comparative weather for customers not covered by the weather normalization mechanism, net of the loss from the Oregon gas cost incentive sharing mechanism. Weather was 1% colder than average for 2022, compared to 12% warmer than average for 2021.

Operations and maintenance expense increased $12.3 million as a result of higher contractor labor for safety and reliability projects, expenses related to information technology maintenance and support, amortization expense related to cloud-computing arrangements and deferrals, and professional service fees.

Depreciation expense and general taxes increased $3.2 million as we continue to invest in our natural gas utility system and facilities.

Other income, net increased $9.3 million driven by lower pension costs primarily related to higher returns and lower interest costs.

Interest expense increased $2.5 million due to a combination of higher interest rates on commercial paper, mitigated by a lower outstanding balance, and incremental long-term debt issued to fund capital expenditures, partially offset by higher Allowance for Funds Used During Construction (AFUDC).

Other

Net income from our other businesses decreased $3.1 million (or $0.12 per share) reflecting lower asset management revenues primarily related to a 2021 cold weather event, and higher interest expense primarily due to incremental debt issued.

FOURTH QUARTER RESULTS

The following financial comparisons are between the fourth quarter of 2022 and 2021 with individual year-over-year drivers presented on an after-tax basis using a statutory tax rate of 26.5%, unless otherwise noted.

NW Natural Holdings' fourth quarter results by business segment are summarized in the table below:


Three Months Ended December 31,


2022


2021


Change

In thousands, except per share data

Amount


Per Share


Amount


Per Share


Amount


Per Share

Net income:


Natural gas distribution segment

$

47,159

$

1.34

$

39,741

$

1.29

$

7,418


$

0.05


Other


777


0.02


787


0.03


(10

)


(0.01

)

Consolidated

$

47,936


$

1.36


$

40,528


$

1.32


$

7,408


$

0.04


Diluted Shares


35,294


30,883


4,411


Natural Gas Distribution Segment

Natural gas distribution segment net income increased $7.4 million (or $0.05 per share) reflecting new rates in Oregon that went into effect on Nov. 1, 2022 and new rates in Washington that went into effect on Nov. 1, 2021 and Nov. 1, 2022, partially offset by higher operating expenses. Earnings per share was affected by issuing common shares during 2022.

Margin increased $12.6 million primarily due to new rates, which contributed $8.9 million; the amortization of deferrals approved in the rate case contributed $2.1 million; and customer growth of 1.1% over the last 12 months contributed $1.6 million.

Operations and maintenance expense increased $4.1 million as a result of higher information technology costs, contractor labor for safety and reliability projects, and professional service fees.

Depreciation and general taxes collectively increased by $1.8 million due to additional capital investments in the distribution system. In addition, we placed two significant information technology projects into service in September 2022.

Other income, net reflected a benefit of $2.8 million primarily from lower pension expense.

Interest expense increased $2.3 million due to a higher interest rate on commercial paper and higher long-term debt balance.

BALANCE SHEET AND CASH FLOWS

For 2022, the Company generated $147.7 million in operating cash flow and invested $338.6 million in natural gas utility capital expenditures to support growth, safety, and technology and facility upgrades; and water & wastewater utility capital expenditures to support growth and safety. In addition, the Company invested $94.3 million in water and wastewater acquisitions. Net cash provided by financing activities was $301.6 million for 2022 primarily due to issuing long-term debt and equity.

2023 GUIDANCE AND LONG-TERM TARGETS

NW Natural Holdings is initiating 2023 earnings guidance in the range of $2.55 to $2.75 per share. This guidance assumes continued customer growth, average weather conditions, and no significant changes in prevailing regulatory policies, mechanisms, or outcomes, or significant local, state or federal laws, legislation or regulations.

NW Natural Holdings' long-term earnings per share growth rate target is 4% to 6% compounded annually from 2022 through 2027.

We expect NW Natural capital expenditures for 2023 to be in the range of $310 million to $350 million and for the five-year period from 2023 to 2027 to range from $1.3 billion to $1.5 billion. We expect NW Natural Water to invest approximately $25 million in 2023 related to maintenance capital expenditures for water and wastewater utilities owned as of Dec. 31, 2022, and for the five-year period to invest approximately $90 million to $110 million.

The timing and amount of the capital expenditures and projects for 2023 or additional investments in our infrastructure during or after 2023 could change based on customer growth, significant changes in prevailing regulatory policies or outcomes, or significant local, state or federal laws, legislation or regulations, or cost estimates. Required funds for the investments are expected to be internally generated or financed with long-term debt or equity, as appropriate.

67 YEARS OF INCREASING DIVIDENDS

On Nov. 15, 2022, NW Natural Holdings paid its 67th consecutive annual dividend increase. In January 2023, the board of directors of NW Natural Holdings declared a quarterly dividend of 48.50 cents per share on the Company’s common stock. The dividend was paid on Feb. 15, 2023 to shareholders of record on Jan. 31, 2023. The Company’s current indicated annual dividend rate is $1.94 per share. Future dividends are subject to board of director discretion and approval.

CONFERENCE CALL AND WEBCAST

As previously announced, NW Natural Holdings will host a conference call and webcast today to discuss its fourth quarter and annual 2022 financial and operating results.

Date and Time:

Friday, February 24

8 a.m. PT (11 a.m. ET)

Phone Numbers:

United States 1-844-200-6205

Canada 1-833-950-0062

International 1-929-526-1599

Passcode 193311

The call will also be webcast in a listen-only format for the media and general public and can be accessed at ir.nwnaturalholdings.com. A replay of the conference call will be available on our website and by dialing 1-866-813-9403 (U.S.), 1-226-828-7578 (Canada), and +44-204-525-0658 (international). The replay access code is 343562.

ABOUT NW NATURAL HOLDINGS

Northwest Natural Holding Company, (NYSE: NWN) (NW Natural Holdings), is headquartered in Portland, Oregon and, with its predecessors, has been doing business for nearly 165 years. It owns NW Natural Gas Company (NW Natural), NW Natural Water Company (NW Natural Water), NW Natural Renewables Holdings (NW Natural Renewables), and other business interests. We have a longstanding commitment to safety, environmental stewardship and the energy transition, and taking care of our employees and communities. Learn more in our latest ESG Report at nwnatural.com/about-us/the-company/sustainability.

NW Natural is a local distribution company that currently provides natural gas service to approximately 2.5 million people in more than 140 communities through nearly 795,000 meters in Oregon and Southwest Washington with one of the most modern pipeline systems in the nation. NW Natural consistently leads the industry with high J.D. Power & Associates customer satisfaction scores. NW Natural owns and operates 21.6 Bcf of underground gas storage capacity in Oregon.

NW Natural Water provides water distribution and wastewater services to an estimated 155,000 people through approximately 62,500 connections for communities throughout the Pacific Northwest, Texas and Arizona. Learn more at nwnaturalwater.com.

NW Natural Renewables is a unregulated business committed to leading in the energy transition by providing cost-effective solutions to support decarbonization in the utility, commercial, industrial and transportation sectors. Learn more at nwnaturalrenewables.com.

Additional information is available at nwnaturalholdings.com.

FORWARD-LOOKING STATEMENTS

This press release, and other presentations made by NW Holdings from time to time, may contain forward-looking statements within the meaning of the U.S. Private Securities Litigation Reform Act of 1995. Forward-looking statements can be identified by words such as "anticipates," "assumes," “continues,” “could,” "intends," "plans," "seeks," "believes," "estimates," "expects" and similar references to future periods. Examples of forward-looking statements include, but are not limited to, statements regarding the following: plans, objectives, assumptions, estimates, expectations, timing, goals, strategies, commitments, future events, investments, timing and amount of capital expenditures, targeted capital structure, risks, risk profile, stability, acquisitions and timing, approval, completion and integration thereof, the likelihood and success associated with any transaction, utility system and infrastructure investments, system modernization, reliability and resiliency, global, national and local economies, customer and business growth, continued expansion of service territories, customer satisfaction ratings, weather, performance and service during weather events, customer rates or rate recovery and the timing and magnitude of potential rate changes and the potential outcome of rate cases, environmental remediation cost recoveries, environmental initiatives, decarbonization and the role of natural gas and the gas delivery system, including decarbonization goals and timelines, energy efficiency measures, use of renewable sources, renewable natural gas purchases, projects, investments and other renewable initiatives, including the construction of RNG facilities, and timing, magnitude and completion thereof, unregulated renewable natural gas strategy and initiatives, renewable hydrogen projects or investments and timing, magnitude, approvals and completion thereof, procurement of renewable natural gas or hydrogen for customers, technology and policy innovations, strategic goals and visions, the water and wastewater acquisition, partnerships, and investment strategy and financial effects of water and wastewater acquisitions, expected growth and safety benefits of facility upgrade investments, diversity, equity and inclusion initiatives, operating plans of third parties, financial results, including estimated income, availability and sources of liquidity, expenses, positions, revenues, returns, cost of capital, timing, and earnings, earnings guidance and estimated future growth rates, future dividends, commodity costs and sourcing asset management activities, performance, timing, outcome, or effects of regulatory proceedings or mechanisms or approvals, including OPUC approval of the Oregon general rate case settlements, regulatory prudence reviews, anticipated regulatory actions or filings, accounting treatment of future events, effects of legislation or changes in laws or regulations, effects, extent, severity and duration of COVID-19, and any resulting economic disruption therefrom, geopolitical uncertainty and other statements that are other than statements of historical facts.

Forward-looking statements are based on current expectations and assumptions regarding its business, the economy, geopolitical factors, and other future conditions. Because forward-looking statements relate to the future, they are subject to inherent uncertainties, risks and changes in circumstances that are difficult to predict. Actual results may differ materially from those contemplated by the forward-looking statements. You are therefore cautioned against relying on any of these forward-looking statements. They are neither statements of historical fact nor guarantees or assurances of future operational, economic or financial performance. Important factors that could cause actual results to differ materially from those in the forward-looking statements are discussed by reference to the factors described in Part I, Item 1A "Risk Factors", and Part II, Item 7 and Item 7A "Management's Discussion and Analysis of Financial Condition and Results of Operations" and "Quantitative and Qualitative Disclosure about Market Risk" in the most recent Annual Report on Form 10-K and in Part I, Items 2 and 3 "Management's Discussion and Analysis of Financial Condition and Results of Operations" and "Quantitative and Qualitative Disclosures About Market Risk", and Part II, Item 1A, "Risk Factors", in the quarterly reports filed thereafter, which, among others, outline legal, regulatory and legislative risks, COVID-19 risks, macroeconomic and geopolitical risks, growth and strategic risks, operational risks, and environmental risks.

All forward-looking statements made in this report and all subsequent forward-looking statements, whether written or oral and whether made by or on behalf of NW Holdings or NW Natural, are expressly qualified by these cautionary statements. Any forward-looking statement speaks only as of the date on which such statement is made, and NW Holdings and NW Natural undertake no obligation to publicly update any forward-looking statement, whether as a result of new information, future developments or otherwise, except as may be required by law. New factors emerge from time to time and it is not possible to predict all such factors, nor can it assess the impact of each such factor or the extent to which any factor, or combination of factors, may cause results to differ materially from those contained in any forward-looking statements.

NON-GAAP FINANCIAL MEASURES

In addition to presenting the results of operations and earnings amounts in total, certain financial measures are expressed in cents per share, which are non-GAAP financial measures. All references to EPS are on the basis of diluted shares. Such non-GAAP financial measures are used to analyze our financial performance because we believe they provide useful information to our investors and creditors in evaluating our financial condition and results of operations. Our non-GAAP financial measures should not be considered a substitute for, or superior to, measures calculated in accordance with U.S. GAAP. Moreover, these non-GAAP financial measures have limitations in that they do not reflect all the items associated with the operations of the business as determined in accordance with GAAP. Other companies may calculate similarly titled non-GAAP financial measures differently than how such measures are calculated in this report, limiting the usefulness of those measures for comparative purposes. A reconciliation of each non-GAAP financial measure to the most directly comparable GAAP financial measure is provided in the tables above.

NORTHWEST NATURAL HOLDINGS

Consolidated Income Statement and Financial Highlights (Unaudited)

Fourth Quarter and Annual Period


Three Months Ended


Twelve Months Ended


December 31,


December 31,

In thousands, except per share amounts, customer, and degree day data

2022


2021


Change


2022


2021


Change

Operating revenues

$

375,253


$

294,090


28%

$

1,037,353


$

860,400


21%


Operating expenses:


Cost of gas


168,222


113,645


48


429,635


292,314


47

Operations and maintenance


63,262


54,660


16


224,667


204,227


10

Environmental remediation


4,439


3,846


15


12,389


9,938


25

General taxes


10,366


9,289


12


41,031


38,633


6

Revenue taxes


15,789


12,514


26


41,826


34,740


20

Depreciation


31,142


28,855


8


116,707


113,534


3

Other operating expenses


806


1,103


(27)


3,621


3,897


(7)

Total operating expenses


294,026


223,912


31


869,876


697,283


25

Income from operations


81,227


70,178


16


167,477


163,117


3

Other income (expense), net


295


(4,204

)

(107)


1,203


(12,559

)

(110)

Interest expense, net


17,091


11,157


53


53,247


44,486


20

Income before income taxes


64,431


54,817


18


115,433


106,072


9

Income tax expense


16,495


14,289


15


29,130


27,406


6

Net income

$

47,936


$

40,528


18

$

86,303


$

78,666


10


Common shares outstanding:


Average diluted for period


35,294


30,883


33,984


30,752


End of period


35,525


31,129


35,525


31,129


Per share information:


Diluted earnings per share

$

1.36


$

1.31


$

2.54


$

2.56


Dividends paid per share


0.4850


0.4825


1.9325


1.9225


Book value per share, end of period


33.09


30.04


33.09


30.04


Market closing price, end of period


47.59


48.78


47.59


48.78


Capital structure, end of period:


Common stock equity


42.4

%


39.5

%


42.4

%


39.5

%


Long-term debt


45.0


44.0


45.0


44.0


Short-term debt (including current maturities of long-term debt)


12.6


16.5


12.6


16.5


Total


100.0

%


100.0

%


100.0

%


100.0

%


Natural Gas Distribution segment operating statistics:


Meters - end of period


794,497


785,897


1.1%


794,497


785,897


1.1%

Volumes - therms:


Residential and commercial sales


271,289


247,166


766,592


703,054


Industrial sales and transportation


125,548


131,546


485,745


481,721


Total volumes sold and delivered


396,837


378,712


1,252,337


1,184,775


Operating revenues:


Residential and commercial sales

$

328,512


$

259,871


$

881,370


$

730,794


Industrial sales and transportation


26,430


19,827


86,810


65,299


Other distribution revenues


577


429


1,944


1,707


Other regulated services


4,906


4,766


19,628


19,087


Total operating revenues


360,425


284,893


989,752


816,887


Less: Cost of gas


168,183


113,701


429,861


292,538


Environmental remediation expense


4,444


3,846


12,389


9,938


Revenue taxes


15,720


12,457


41,627


34,600


Margin, net

$

172,078


$

154,889


$

505,875


$

479,811


Degree days:


Average (25-year average)


1,046


1,052


2,686


2,692


Actual


1,121


931


20%


2,712


2,378


14%

Percent colder (warmer) than average weather


7

%


(12

)%


1

%


(12

)%


Contacts

Investor Contact:
Nikki Sparley
Phone: 503-721-2530
Email: This email address is being protected from spambots. You need JavaScript enabled to view it.

Media Contact:
David Roy
Phone: 503-610-7157
Email: This email address is being protected from spambots. You need JavaScript enabled to view it.


Read full story here

Nearly 1,700 crews work around the clock to restore power quickly and safely throughout northern Illinois

Video footage of crews restoring outages: https://vimeo.com/801412568/35e12af7cd

CHICAGO--(BUSINESS WIRE)--Despite the challenge of working in icy conditions, ComEd crews have restored power to nearly 134,000 customers throughout the communities it serves after severe ice storms moved through northern Illinois Wednesday and Thursday.

The storms damaged trees and equipment, causing power outages for approximately 216,000 customers. Nearly 1,700 ComEd and contractor crews will be working around the clock to restore power to customers. ComEd expects that power will be restored to 80 percent of customers by 11 p.m. Thursday, Feb. 23. To support this restoration goal, ComEd has called upon utilities from across the region, and 900 additional crew members will arrive in Illinois today to support safe and swift recovery efforts.

“At ComEd, our hard-working field forces train for challenging conditions, and that training has certainly been put to the test today as they work around the clock to safely restore power to our customers in these icy and windy conditions,” said Terence R. Donnelly, president and COO of ComEd. “We recognize that any outage is frustrating to our customers, especially during freezing conditions, and we thank them for their patience as we work to restore the remaining outages as quickly as we can.”

The combination of widespread ice and high winds has led to a multi-day recovery effort to restore all the customers affected by this storm. Layers of ice on trees, roads and equipment create additional hazards for utility crews leading to additional outages and longer restoration times well after the storm has passed. While many impacted customers have been restored, some customer outages in pockets with the most significant damage may last until late Saturday night, Feb. 25, or early Sunday morning, Feb. 26. As of 9 a.m. Thursday, Feb. 23, nearly 82,000 customers remain without service.

ComEd has been investing in power grid upgrades and tree trimming to minimize the impact of storms. Since smart grid upgrades began in 2011, ComEd has avoided more than 19 million power outages – saving more than $3.3 billion in outage-related costs – and improved overall reliability by more than 80 percent. In 2022, ComEd delivered its best reliability ever and was recognized with the ReliabilityOne Award for having the most resilient power grid in the U.S.

ComEd prioritizes attention on repairs that will bring back the greatest number of customers, and focuses on critical services, such as law enforcement, fire departments, hospitals and senior centers. Crews then move to restoration of individual outages.

The following tips and information encourage customers to stay safe following severe weather:

  • If you encounter a downed power line, immediately call ComEd at 1-800-EDISON-1 (1-800-334-7661).
  • Spanish-speaking customers should call 1-800-95-LUCES (1-800-955-8237).
  • Never approach a downed power line. Always assume a power line is energized and extremely dangerous.
  • Check on elderly and other family members and neighbors to ensure their safety and make alternate arrangements in the event of an outage.

Customers can sign up for Outage Alerts at ComEd.com/Alerts or text OUT to 26633 to report their outage and receive restoration information about when their power may be restored.

ComEd also offers a mobile app for iPhone® and Android™® smart phones that gives customers the ability to report power outages and manage their accounts. In addition, customers can report outages through ComEd’s Facebook and Twitter pages.

ComEd is a unit of Chicago-based Exelon Corporation (NASDAQ: EXC), a Fortune 200 energy company with approximately 10 million electricity and natural gas customers – the largest number of customers in the U.S. ComEd powers the lives of more than 4 million customers across northern Illinois, or 70 percent of the state’s population. For more information visit ComEd.com and connect with the company on Facebook, Twitter, Instagram and YouTube.


Contacts

ComEd Media Relations
312-394-3500

Fourth Quarter


  • Reported net income attributable to HF Sinclair stockholders of $587.0 million, or $2.92 per diluted share, and adjusted net income of $597.8 million, or $2.97 per diluted share
  • Reported EBITDA of $990.9 million and adjusted EBITDA of $1,004.1 million
  • Returned $475.2 million to shareholders through dividends and share repurchases
  • Announced $0.05 increase in regular quarterly dividend to $0.45 per share

Full-Year 2022

  • Reported net income attributable to HF Sinclair stockholders of $2,922.7 million, or $14.28 per diluted share, and adjusted net income of $3,014.9 million, or $14.73 per diluted share
  • Reported EBITDA of $4,619.8 million and adjusted EBITDA of $4,734.2 million
  • Returned $1,627.6 million to shareholders through dividends and share repurchase

DALLAS--(BUSINESS WIRE)--HF Sinclair Corporation (NYSE:DINO) (“HF Sinclair” or the “Company”) today reported fourth quarter net income attributable to HF Sinclair stockholders of $587.0 million, or $2.92 per diluted share, for the quarter ended December 31, 2022, compared to a net loss of $(39.5) million, or $(0.24) per diluted share, for the quarter ended December 31, 2021. Excluding the adjustments shown in the accompanying earnings release table, adjusted net income attributable to HF Sinclair stockholders for the fourth quarter of 2022 was $597.8 million, or $2.97 per diluted share, compared to an adjusted net loss of $(17.6) million, or $(0.11) per diluted share, for the fourth quarter of 2021.

HF Sinclair’s CEO, Michael Jennings, commented, “HF Sinclair reported strong fourth quarter and full year results, led by solid contributions from our Refining and Lubricants and Specialty Products segments. We delivered on our cash return commitment to shareholders by returning over $1.6 billion in share repurchases and dividends for the full year of 2022, well in excess of our target of $1 billion during the first 12 months post-Sinclair acquisition. We made significant progress on the integration of the acquired Sinclair businesses, realizing over $100 million in annual run-rate synergies, as we transitioned into a stronger, more diversified company. We continued to advance our commitment to sustainability with the completion and commencement of operations of our renewable diesel investments. Despite the tight supply environment in 2022, our continued focus on operational excellence allowed us to safely increase throughputs to meet customer demand for transportation fuels and lubricants.”

Refining segment income before interest and income taxes was $758.8 million for the fourth quarter of 2022 compared to a loss of $(63.5) million in the fourth quarter of 2021. The segment reported EBITDA of $863.8 million for the fourth quarter of 2022 compared to $25.0 million for the fourth quarter of 2021. This increase was primarily driven by higher refining gross margins in both the West and Mid-Continent regions and higher sales volumes year over year primarily due to the acquisition of the Puget Sound refinery and acquired Sinclair businesses, which resulted in higher refining segment earnings in the quarter. Consolidated refinery gross margin was $23.47 per produced barrel, a 170% increase compared to $8.70 for the fourth quarter of 2021. Despite winter storm impacts in December, crude oil charge averaged 628,160 barrels per day (“BPD”) for the fourth quarter of 2022 compared to 421,000 BPD for the fourth quarter of 2021.

Renewables segment loss before interest and income taxes was $(34.7) million for the fourth quarter of 2022 compared to $(27.6) million for the fourth quarter 2021. The segment reported EBITDA of $(16.4) million for the fourth quarter of 2022 compared to $(26.9) million for the fourth quarter of 2021. Excluding the lower of cost or market inventory valuation charge of $9.6 million, segment Adjusted EBITDA in the fourth quarter of 2022 was $(6.9) million. Total sales volumes were 54 million gallons for the fourth quarter of 2022. The Cheyenne renewable diesel unit (“RDU”) was mechanically complete in the fourth quarter of 2021 and operational in the first quarter of 2022, the pre-treatment unit (“PTU”) at our Artesia, New Mexico facility was completed and operational in the first quarter of 2022 and the Artesia RDU was completed and operational in the second quarter of 2022. Also, effective with the Sinclair acquisition that closed on March 14, 2022, the Renewables segment includes the Sinclair RDU.

Marketing segment income before interest and income taxes was $16.9 million and reported EBITDA was $23.4 million for the fourth quarter of 2022. Total branded fuel sales volumes were 336 million gallons for the fourth quarter 2022.

Lubricants and Specialty Products segment income before interest and income taxes was $44.6 million for the fourth quarter of 2022 compared to $53.7 million in the fourth quarter of 2021. The segment reported EBITDA of $66.6 million for the fourth quarter of 2022 compared to $74.9 million in the fourth quarter of 2021. This decrease was largely driven by FIFO impact from consumption of higher priced feedstock inventory.

Holly Energy Partners, L.P. (“HEP”) reported EBITDA of $88.6 million for the fourth quarter of 2022 compared to $70.8 million in the fourth quarter of 2021 and Adjusted EBITDA of $115.7 million for the fourth quarter of 2022 compared to $79.7 million for the fourth quarter of 2021.

For the fourth quarter of 2022, net cash provided by operations totaled $915.0 million. At December 31, 2022, the Company's cash and cash equivalents totaled $1,665.1 million, a $217.7 million increase over cash and cash equivalents of $1,447.4 million at September 30, 2022. During the fourth quarter of 2022, the Company announced and paid a regular dividend of $0.40 per share to shareholders totaling $80.5 million and spent $394.7 million on share repurchases. Additionally, the Company's consolidated debt was $3,255.5 million. The Company's debt, exclusive of HEP debt, which is nonrecourse to HF Sinclair, was $1,699.1 million at December 31, 2022.

HF Sinclair also announced today that its Board of Directors declared a regular quarterly dividend in the amount of $0.45 per share, an increase of $0.05 over its previous dividend of $0.40 per share. The dividend is payable on March 17, 2023 to holders of record of common stock on March 7, 2023.

The Company has scheduled a webcast conference call for today, February 24, 2023, at 8:30 AM Eastern Time to discuss fourth quarter financial results. This webcast may be accessed at: https://events.q4inc.com/attendee/250565072. An audio archive of this webcast will be available using the above noted link through March 10, 2023.

HF Sinclair Corporation, headquartered in Dallas, Texas, is an independent energy company that produces and markets high-value light products such as gasoline, diesel fuel, jet fuel, renewable diesel and other specialty products. HF Sinclair owns and operates refineries located in Kansas, Oklahoma, New Mexico, Wyoming, Washington and Utah and markets its refined products principally in the Southwest U.S., the Rocky Mountains extending into the Pacific Northwest and in other neighboring Plains states. HF Sinclair supplies high-quality fuels to more than 1,500 branded stations and licenses the use of the Sinclair brand at more than 300 additional locations throughout the country. In addition, subsidiaries of HF Sinclair produce and market base oils and other specialized lubricants in the U.S., Canada and the Netherlands, and export products to more than 80 countries. Through its subsidiaries, HF Sinclair produces renewable diesel at two of its facilities in Wyoming and also at its facility in Artesia, New Mexico. HF Sinclair also owns a 47% limited partner interest and a non-economic general partner interest in Holly Energy Partners, L.P., a master limited partnership that provides petroleum product and crude oil transportation, terminalling, storage and throughput services to the petroleum industry, including HF Sinclair subsidiaries.

The following is a “safe harbor” statement under the Private Securities Litigation Reform Act of 1995: The statements in this press release relating to matters that are not historical facts are “forward-looking statements” based on management’s beliefs and assumptions using currently available information and expectations as of the date hereof, are not guarantees of future performance and involve certain risks and uncertainties, including those contained in our filings with the Securities and Exchange Commission (the “SEC”). Forward-looking statements use words such as “anticipate,” “project,” “will,” “expect,” “plan,” “goal,” “forecast,” “strategy,” “intend,” “should,” “would,” “could,” “believe,” “may,” and similar expressions and statements regarding our plans and objectives for future operations. Although we believe that the expectations reflected in these forward-looking statements are reasonable, we cannot assure you that our expectations will prove correct. Therefore, actual outcomes and results could materially differ from what is expressed, implied or forecast in such statements. Any differences could be caused by a number of factors, including, but not limited to, the Company’s and HEP’s ability to successfully integrate the Sinclair Oil Corporation (now known as Sinclair Oil LLC) and Sinclair Transportation Company LLC businesses acquired from The Sinclair Companies (now known as REH Company) (collectively, the “Sinclair Transactions”) with their existing operations and fully realize the expected synergies of the Sinclair Transactions or on the expected timeline; the Company's ability to successfully integrate the operation of the Puget Sound refinery with its existing operations; the demand for and supply of crude oil and refined products, including uncertainty regarding the effects of the continuing coronavirus (“COVID-19”) pandemic on future demand and increasing societal expectations that companies address climate change; risks and uncertainties with respect to the actions of actual or potential competitive suppliers and transporters of refined petroleum products or lubricant and specialty products in the Company’s markets; the spread between market prices for refined products and market prices for crude oil; the possibility of constraints on the transportation of refined products or lubricant and specialty products; the possibility of inefficiencies, curtailments or shutdowns in refinery operations or pipelines, whether due to reductions in demand, accidents, unexpected leaks or spills, unscheduled shutdowns, infection in the workforce, weather events, civil unrest, expropriation of assets, and other economic, diplomatic, legislative, or political events or developments, terrorism, cyberattacks, or other catastrophes or disruptions affecting our operations, production facilities, machinery, pipelines and other logistics assets, equipment, or information systems, or any of the foregoing of our suppliers, customers, or third-party providers, and any potential asset impairments resulting from, or the failure to have adequate insurance coverage for or receive insurance recoveries from, such actions; the effects of current and/or future governmental and environmental regulations and policies, including the effects of current and/or future restrictions on various commercial and economic activities in response to the COVID-19 pandemic and increases in interest rates; the availability and cost of financing to the Company; the effectiveness of the Company’s capital investments and marketing strategies; the Company’s and HEP’s efficiency in carrying out and consummating construction projects, including the Company's ability to complete announced capital projects on time and within capital guidance; the Company's and HEP’s ability to timely obtain or maintain permits, including those necessary for operations or capital projects; the ability of the Company to acquire refined or lubricant product operations or pipeline and terminal operations on acceptable terms and to integrate any existing or future acquired operations; the possibility of terrorist or cyberattacks and the consequences of any such attacks; uncertainty regarding the effects and duration of global hostilities, including the Russia-Ukraine war, and any associated military campaigns which may disrupt crude oil supplies and markets for the Company's refined products and create instability in the financial markets that could restrict the Company's ability to raise capital; general economic conditions, including uncertainty regarding the timing, pace and extent of an economic recovery in the United States; a prolonged economic slowdown due to the COVID-19 pandemic, inflation and labor costs which could result in an impairment of goodwill and/or long-lived asset impairments; and other financial, operational and legal risks and uncertainties detailed from time to time in the Company’s and HEP’s SEC filings. The forward-looking statements speak only as of the date made and, other than as required by law, we undertake no obligation to publicly update or revise any forward-looking statements, whether as a result of new information, future events or otherwise.

RESULTS OF OPERATIONS

Financial Data (all information in this release is unaudited)


Three Months Ended
December 31,


Change from 2021


2022


2021


Change


Percent


(In thousands, except per share data)

Sales and other revenues

$

8,984,927


$

5,622,667


$

3,362,260


60

%

Operating costs and expenses:


Cost of products sold:


Cost of products sold (exclusive of lower of cost or market inventory valuation adjustment)


7,222,833


4,958,160


2,264,673


46


Lower of cost or market inventory valuation adjustment


9,573


8,739


834


10


7,232,406


4,966,899


2,265,507


46


Operating expenses


646,741


430,858


215,883


50


Selling, general and administrative expenses


102,511


111,225


(8,714

)


(8

)

Depreciation and amortization


176,169


134,198


41,971


31


Total operating costs and expenses


8,157,827


5,643,180


2,514,647


45


Income (loss) from operations


827,100


(20,513

)


847,613


(4,132

)


Other income (expense):


Earnings of equity method investments


7,001


3,557


3,444


97


Interest income


17,517


941


16,576


1,762


Interest expense


(56,978

)


(30,955

)


(26,023

)


84


Gain on business interruption insurance settlement


15,202


15,202


Gain on early extinguishment of debt


604


604


Gain (loss) on foreign currency transactions


(2,415

)


1,288


(3,703

)


(288

)

Gain on sale of assets and other


4,992


2,532


2,460


97


(14,077

)


(22,637

)


8,560


(38

)

Income (loss) before income taxes


813,023


(43,150

)


856,173


(1,984

)

Income tax expense (benefit)


188,197


(26,046

)


214,243


(823

)

Net income (loss)


624,826


(17,104

)


641,930


(3,753

)

Less net income attributable to noncontrolling interest


37,799


22,426


15,373


69


Net income (loss) attributable to HF Sinclair stockholders

$

587,027


$

(39,530

)


$

626,557


(1,585

)%


Income (loss) per share:


Basic

$

2.92


$

(0.24

)


$

3.16


(1,317

)%

Diluted

$

2.92


$

(0.24

)


$

3.16


(1,317

)%

Cash dividends declared per common share

$

0.40


$


$

0.40


%

Average number of common shares outstanding:


Basic


199,459


162,721


36,738


23

%

Diluted


199,459


162,721


36,738


23

%


EBITDA

$

990,854


$

98,636


$

892,218


905

%

Adjusted EBITDA

$

1,004,124


$

126,026


$

878,098


697

%


Years Ended
December 31,


Change from 2021


2022


2021


Change


Percent


(In thousands, except per share data)

Sales and other revenues

$

38,204,839


$

18,389,142


$

19,815,697


108

%

Operating costs and expenses:


Cost of products sold:


Cost of products sold (exclusive of lower of cost or market inventory valuation adjustment)


30,680,013


15,567,052


15,112,961


97


Lower of cost or market inventory valuation adjustment


52,412


(310,123

)


362,535


(117

)


30,732,425


15,256,929


15,475,496


101


Operating expenses


2,334,893


1,517,478


817,415


54


Selling, general and administrative expenses


426,485


362,010


64,475


18


Depreciation and amortization


656,787


503,539


153,248


30


Total operating costs and expenses


34,150,590


17,639,956


16,510,634


94


Income (loss) from operations


4,054,249


749,186


3,305,063


441


Other income (expense):


Earnings (loss) of equity method investments


(260

)


12,432


(12,692

)


(102

)

Interest income


30,179


4,019


26,160


651


Interest expense


(175,628

)


(125,175

)


(50,453

)


40


Gain on business interruption insurance settlement


15,202


15,202


Gain on tariff settlement


51,500


(51,500

)


(100

)

Gain on early extinguishment of debt


604


604


Loss on foreign currency transactions


(1,637

)


(2,938

)


1,301


(44

)

Gain on sale of assets and other


13,337


98,128


(84,791

)


(86

)


(118,203

)


37,966


(156,169

)


(411

)

Income before income taxes


3,936,046


787,152


3,148,894


400


Income tax expense


894,872


123,898


770,974


622


Net income


3,041,174


663,254


2,377,920


359


Less net income attributable to noncontrolling interest


118,506


104,930


13,576


13


Net income attributable to HF Sinclair stockholders

$

2,922,668


$

558,324


$

2,364,344


423

%


Earnings per share:


Basic

$

14.28


$

3.39


$

10.89


321

%

Diluted

$

14.28


$

3.39


$

10.89


321

%

Cash dividends declared per common share

$

1.20


$

0.35


$

0.85


243

%

Average number of common shares outstanding:


Basic


202,566


162,569


39,997


25

%

Diluted


202,566


162,569


39,997


25

%


EBITDA

$

4,619,776


$

1,306,917


$

3,312,859


253

%

Adjusted EBITDA

$

4,734,160


$

915,665


$

3,818,495


417

%

Balance Sheet Data


Years Ended December 31,


2022


2021


(In thousands)

Cash and cash equivalents

$

1,665,066


$

234,444

Working capital

$

3,502,790


$

1,696,990

Total assets

$

18,125,483


$

12,916,613

Total debt

$

3,255,472


$

3,072,737

Total equity

$

10,017,572


$

6,294,465

Segment Information

Our operations are organized into five reportable segments, Refining, Renewables, Marketing, Lubricants and Specialty Products and HEP. Our operations that are not included in one of these five reportable segments are included in Corporate and Other. Intersegment transactions are eliminated in our consolidated financial statements and are included in Eliminations. Corporate and Other and Eliminations are aggregated and presented under the Corporate, Other and Eliminations column.

As a result of the Sinclair Transactions that closed on March 14, 2022, the operations of the acquired Sinclair businesses are reported in the Refining, Renewables, Marketing and HEP segments.

The Refining segment represents the operations of our El Dorado, Tulsa, Navajo and Woods Cross refineries and HF Sinclair Asphalt Company LLC (“Asphalt”). Also, effective with our acquisition that closed on November 1, 2021, the Refining segment includes our Puget Sound refinery, and effective with our acquisition that closed on March 14, 2022, includes our Parco and Casper refineries. Refining activities involve the purchase and refining of crude oil and wholesale marketing of refined products, such as gasoline, diesel fuel and jet fuel. These petroleum products are primarily marketed in the Mid-Continent, Southwest and Rocky Mountains extending into the Pacific Northwest geographic regions of the United States. Asphalt operates various asphalt terminals in Arizona, New Mexico and Oklahoma.

The Renewables segment represents the operations of the Cheyenne RDU, which was mechanically complete in the fourth quarter of 2021 and operational in the first quarter of 2022, the PTU at our Artesia, New Mexico facility, which was completed and operational in the first quarter of 2022 and the Artesia RDU, which was completed and operational in the second quarter of 2022. Also, effective with our acquisition that closed on March 14, 2022, the Renewables segment includes the Sinclair RDU.

Effective with our acquisition that closed on March 14, 2022, the Marketing segment includes branded fuel sales to more than 1,300 Sinclair branded sites in the United States and licensing fees for the use of the Sinclair brand at more than 300 additional locations throughout the country. Additionally, the Marketing segment includes branded fuel sales to 131 non-Sinclair branded sites from legacy HollyFrontier agreements.

The Lubricants and Specialty Products segment represents Petro-Canada Lubricants Inc.’s (“PCLI”) production operations, located in Mississauga, Ontario, that includes lubricant products such as base oils, white oils, specialty products and finished lubricants, and the operations of our Petro-Canada Lubricants business that includes the marketing of products to both retail and wholesale outlets through a global sales network with locations in Canada, the United States, Europe and China. Additionally, the Lubricants and Specialty Products segment includes specialty lubricant products produced at our Tulsa refineries that are marketed throughout North America and are distributed in Central and South America and the operations of Red Giant Oil Company LLC, one of the largest suppliers of locomotive engine oil in North America. Also, the Lubricants and Specialty Products segment includes Sonneborn, a producer of specialty hydrocarbon chemicals such as white oils, petrolatums and waxes with manufacturing facilities in the United States and Europe.

The HEP segment includes all of the operations of HEP, which owns and operates logistics and refinery assets consisting of petroleum product and crude oil pipelines, terminals, tankage, loading rack facilities and refinery processing units in the Mid-Continent, Southwest and Rocky Mountains geographic regions of the United States. The HEP segment also includes 50% ownership interests in each of the Osage Pipeline (“Osage”) , the Cheyenne Pipeline and Cushing Connect, a 25.06% ownership interest in the Saddle Butte Pipeline and a 49.995% ownership interest in the Pioneer Pipeline. Revenues from the HEP segment are earned through transactions with unaffiliated parties for pipeline transportation, rental and terminalling operations as well as revenues relating to pipeline transportation services provided for our refining operations. Due to certain basis differences, our reported amounts for the HEP segment may not agree to amounts reported in HEP’s periodic public filings.


Refining


Renewables


Marketing


Lubricants
and
Specialty
Products


HEP


Corporate,
Other and
Eliminations


Consolidated
Total


(In thousands)

Three Months Ended December 31, 2022

Sales and other revenues:


Revenues from external customers


$

6,937,534


$

255,689


$

1,031,898


$

729,916


$

29,890


$


$

8,984,927

Intersegment revenues


1,044,841


162,205


295


112,620


(1,319,961

)


$

7,982,375


$

417,894


$

1,031,898


$

730,211


$

142,510


$

(1,319,961

)


$

8,984,927

Cost of products sold (exclusive of lower of cost or market inventory adjustment)


$

6,561,147


$

391,646


$

1,008,042


$

555,287


$


$

(1,293,289

)


$

7,222,833

Lower of cost or market inventory valuation adjustment


$


$

9,573


$


$


$


$


$

9,573

Operating expenses


$

517,024


$

32,178


$


$

67,545


$

53,629


$

(23,635

)


$

646,741

Selling, general and administrative expenses


$

39,302


$

1,023


$

414


$

41,070


$

4,258


$

16,444


$

102,511

Depreciation and amortization


$

105,005


$

18,222


$

6,545


$

22,021


$

22,880


$

1,496


$

176,169

Income (loss) from operations


$

759,897


$

(34,748

)


$

16,897


$

44,288


$

61,743


$

(20,977

)


$

827,100

Income (loss) before interest and income taxes


$

758,844


$

(34,663

)


$

16,897


$

44,550


$

68,771


$

(1,915

)


$

852,484

Net income attributable to noncontrolling interest


$


$


$


$


$

2,010


$

35,789


$

37,799

Earnings of equity method investments


$


$


$


$


$

7,001


$


$

7,001

Capital expenditures


$

57,996


$

14,481


$

2,479


$

10,334


$

7,770


$

13,504


$

106,564


Contacts

Atanas H. Atanasov, Executive Vice President and Chief Financial Officer
Craig Biery, Vice President, Investor Relations
HF Sinclair Corporation
214-954-6510


Read full story here

  • Estimated to abate 204,000 metric tons of carbon dioxide (CO2) emissions each year, equivalent to annual emissions from about 44,000 fuel burning cars
  • Will stimulate local economy by bringing an estimated $30 million in new revenue to the community, along with creating approximately 200 construction jobs

SOUTH BEND, Ind.--(BUSINESS WIRE)--#PPA--Global solar leader Lightsource bp and AEP Energy Partners (AEPEP), a subsidiary of American Electric Power (Nasdaq: AEP) and one of the largest wholesale energy suppliers in the country, have signed a power purchase agreement (PPA) for a 188 megawatt (dc) solar project located in New Carlisle about 10 miles west of South Bend, Indiana.

Once complete, the Honeysuckle Solar project will generate enough clean energy annually to power 27,000 U.S. homes and will reduce carbon dioxide emissions by 204,000 metric tons each year.

“AEP Energy Partners is proud to provide customers with integrated, carbon-free energy that fulfills their sustainability goals, delivers long-term price stability, and benefits the environment. Our partnership with Lightsource bp demonstrates our commitment to the development of new renewable resources that both empower local communities and support a cleaner, brighter energy future,” said Greg Hall, Executive Vice President & Chief Commercial Officer, AEP.

Lightsource bp will finance, build, own and operate the facility and sell the solar energy it generates to AEP Energy Partners under a long-term PPA. Construction of the project has been initiated on site, with commercial operation starting in 2024. South Bend based Inovateus Solar LLC is the construction contractor for the facility, with a focus on utilizing local labor for the mechanical, electrical and civil work on site.

“This power purchase agreement is a great example of how energy buyers with sustainability goals such as AEP Energy Partners can work with us to spur the buildout of new solar projects that will improve the health and energy security of communities across America while helping strengthen local economies. As the owner and operator of the Honeysuckle solar farm, we look forward to bringing economic and environmental benefits to the region, along with fostering community partnerships,” said Kevin Smith, Lightsource bp’s CEO of the Americas.

Economic benefits

The Honeysuckle solar farm will:

  • Create approximately 200 direct construction jobs, primarily local, in addition to hundreds of U.S. jobs across the supply chain
  • Support domestic manufacturers and low carbon products, with ultra-low carbon solar panels from First Solar, smart solar trackers from Array Technologies and steel from Nucor
  • Bring $250 million of new, privately funded renewable energy infrastructure to Indiana
  • Provide an estimated $30 million boost to the local community over the project life – additional funding for local schools and other services without a tax increase on its citizens
  • Deliver a $3 million economic development payment to St. Joseph County to be allocated by county officials as they determine best serves the community.

Protecting the environment

Lightsource bp and AEP Energy Partners have a common mission to deliver affordable, reliable electricity to communities, while protecting the environment. While the primary purpose of solar is to reduce carbon emissions from electricity generation in order to mitigate climate change, Lightsource bp extends the benefits of solar energy further through their Responsible Solar approach. The goal is to build multiuse solar projects on which clean energy generation, agriculture, habitat and biodiversity enhancement share the land under and around the solar panels.

As part of this Responsible Solar approach, an action plan is underway for the Honeysuckle Solar project to achieve biodiversity net gains and foster pollinator habitat – ensuring that Honeysuckle will be a pollinator friendly solar farm.

Learn more about multiuse solar.

About Lightsource bp

Lightsource bp is a global leader in the development and management of solar energy and energy storage projects and a 50:50 joint venture with bp. For more than a decade, Lightsource bp has delivered affordable, safe and sustainable energy to businesses and communities around the world. Their team includes nearly 1,000 industry experts, working in 19 countries, providing full scope development for projects, from initial site selection, financing and permitting to long-term management of solar projects and energy sales to their customers. Lightsource bp in the U.S. is headquartered in San Francisco with development offices in Denver, Austin, Philadelphia and Atlanta and staff in more than 25 states. Since 2019, the team has brought into operation or initiated construction on 3.2 gigawatts of U.S. solar projects with capital costs of nearly $4 billion across 11 states in America. For more information visit www.lightsourcebp.com/us.

About AEP and AEP Energy Partners

American Electric Power (Nasdaq: AEP) subsidiaries AEP Renewables, AEP Energy, OnSite Partners, and AEP Energy Partners, deliver a wide array of innovative competitive energy solutions nationwide. As one of the largest wholesale suppliers in the country, AEP Energy Partners specializes in offering customized wholesale power supply products based on the specific needs of customers’ electric systems within ERCOT, MISO, PJM and SPP. AEP Energy Partners also sells renewable energy through long-term contracts with utilities, electric cooperatives, municipalities and corporate customers. With a commitment to a clean energy future, AEP’s competitive businesses currently own over 1,500 megawatts of wind, solar and energy storage on both a utility scale and distributed scale basis. Solving energy problems for customers, AEP OnSite Partners and its competitive affiliates own and operate over 75 behind-the-meter projects in 22 different states and have an active development pipeline across the U.S. As a competitive retail electricity and natural gas supplier, AEP Energy serves over 700,000 residential and business customers in 28 service territories in six states and Washington, D.C. Based in Columbus, Ohio, Chicago, Illinois and San Diego, California, AEP’s family of competitive companies takes pride in making it easy for customers and partners to buy, manage and use energy. Learn more about AEP Energy Partners.


Contacts

Media:
Mary Grikas
This email address is being protected from spambots. You need JavaScript enabled to view it.

Sarah Devine
This email address is being protected from spambots. You need JavaScript enabled to view it.
614/716-2011

  • Reported net income attributable to HEP of $68.5 million or $0.54 per unit
  • Announced quarterly distribution of $0.35 per unit
  • Reported EBITDA of $88.6 million and Adjusted EBITDA of $115.7 million

DALLAS--(BUSINESS WIRE)--Holly Energy Partners, L.P. (“HEP” or the “Partnership”) (NYSE: HEP) today reported financial results for the fourth quarter of 2022. Net income attributable to HEP for the fourth quarter was $68.5 million ($0.54 per basic and diluted limited partner unit) compared to $45.6 million ($0.43 per basic and diluted limited partner unit) for the fourth quarter of 2021.


Distributable cash flow was $85.8 million for the fourth quarter of 2022, an increase of $22.7 million, or 36.1%, compared to the fourth quarter of 2021. HEP declared a quarterly cash distribution of $0.35 on January 20, 2023.

The increase in net income attributable to HEP was mainly due to net income from Sinclair Transportation Company LLC ("Sinclair Transportation"), which was acquired on March 14, 2022, and pipeline revenues, partially offset by higher interest expense.

Commenting on our 2022 fourth quarter results, Michael Jennings, Chief Executive Officer and President, stated, "HEP delivered another excellent quarter, supported by record volumes across our integrated system. We continue to generate stable earnings and cash flow, and expect to achieve our leverage target of 3.5 times in mid-2023. Once that is reached, we look forward to evaluating incremental cash return to unitholders consistent with our previously announced capital allocation strategy."

Fourth Quarter 2022 Revenue Highlights

Revenues for the fourth quarter of 2022 were $142.5 million, an increase of $24.0 million compared to the fourth quarter of 2021. The increase was mainly due to revenues on our recently acquired Sinclair Transportation assets, higher volumes on our crude and product pipelines, and rate increases that went into effect on July 1, 2022.

  • Revenues from our refined product pipelines were $30.4 million, an increase of $7.7 million, on shipments averaging 184.4 thousand barrels per day ("mbpd") compared to 135.2 mbpd for the fourth quarter of 2021. The revenue and volume increases were mainly due to volumes on our recently acquired Sinclair Transportation product pipelines, higher volumes on our Navajo and Woods Cross product pipelines, and rate increases that went into effect on July 1, 2022. Revenues did not increase in proportion to volumes due to our recognition of a significant portion of the Sinclair Transportation refined product pipeline tariffs as interest income under sales-type lease accounting.
  • Revenues from our intermediate pipelines were $8.4 million, an increase of $0.8 million on shipments averaging 137.4 mbpd compared to 105.5 mbpd for the fourth quarter of 2021. The increase in volumes was mainly due to higher throughputs on our intermediate pipelines servicing HF Sinclair Corporation's ("HF Sinclair") Navajo refinery and the recently acquired Sinclair Transportation intermediate pipelines, and revenues increased mainly due to rate increases that went into effect on July 1, 2022 as well as revenues on the recently acquired Sinclair Transportation intermediate pipelines.
  • Revenues from our crude pipelines were $36.5 million, an increase of $5.8 million, on shipments averaging 622.2 mbpd compared to 455.0 mbpd for the fourth quarter of 2021. The increase in volumes and revenues was mainly attributable to our recently acquired Sinclair Transportation crude pipelines, our Cushing Connect pipeline, higher volumes on our crude pipeline systems in New Mexico, Texas, Wyoming and Utah as well as rate increases that went into effect on July 1, 2022. Revenues did not increase in proportion to volumes due to our recognition of most of the Cushing Connect pipeline tariffs and a significant portion of the Sinclair Transportation crude pipeline tariffs as interest income under sales-type lease accounting.
  • Revenues from terminal, tankage and loading rack fees were $41.8 million, an increase of $7.9 million compared to the fourth quarter of 2021. Refined products and crude oil terminalled in the facilities averaged 666.6 mbpd compared to 460.4 mbpd for the fourth quarter of 2021. Volumes increased mainly due to volumes on our recently acquired Sinclair Transportation assets and higher throughputs at HF Sinclair's Tulsa refinery. Revenues increased mainly due to revenues on our recently acquired Sinclair Transportation assets, higher butane blending revenues, higher revenues on our Tulsa assets, and rate increases that went into effect on July 1, 2022.
  • Revenues from refinery processing units were $25.5 million, an increase of $1.8 million compared to the fourth quarter of 2021, and throughputs averaged 71.2 mbpd compared to 68.8 mbpd for the fourth quarter of 2021. The increase in volumes was mainly due to increased throughput for our Woods Cross processing units. Revenues increased mainly due to higher throughput at our Woods Cross refinery processing units as well as rate increases that went into effect on July 1, 2022.

Year Ended December 31, 2022 Revenue Highlights

Revenues for the year ended December 31, 2022, were $547.5 million, an increase of $53.0 million compared to the year ended December 31, 2021. The increase was mainly attributable to revenues on our recently acquired Sinclair Transportation assets, increased revenues from our UNEV assets, higher volumes on our crude pipelines in New Mexico, Texas, Wyoming and Utah as well as rate increases that went into effect on July 1, 2022, partially offset by lower revenues on our Cheyenne assets as a result of the conversion of HF Sinclair's Cheyenne refinery to renewable diesel production. The year ended December 31, 2021 included the recognition of the $10 million termination fee related to the termination of HF Sinclair's minimum volume commitment on our Cheyenne assets.

  • Revenues from our refined product pipelines were $113.2 million, an increase of $5.8 million, on shipments averaging 181.3 mbpd compared to 158.1 mbpd for the year ended December 31, 2021. The volume and revenue increases were mainly due to higher volumes on our recently acquired Sinclair Transportation assets and higher volumes on our UNEV pipeline. We recognized a significant portion of the Sinclair Transportation refined product pipeline tariffs as interest income under sales-type lease accounting.
  • Revenues from our intermediate pipelines were $32.2 million, an increase of $2.1 million compared to the year ended December 31, 2021. Shipments averaged 129.3 mbpd compared to 125.2 mbpd for the year ended December 31, 2021. The increase in volumes was mainly due to higher throughputs on our intermediate pipelines servicing HF Sinclair's Tulsa and Navajo refineries and the recently acquired Sinclair Transportation intermediate pipelines, and the increase in revenues was mainly due to the recently acquired Sinclair Transportation intermediate pipelines.
  • Revenues from our crude pipelines were $140.0 million, an increase of $14.4 million compared to the year ended December 31, 2021. Shipments averaged 601.3 mbpd compared to 408.6 mbpd for the year ended December 31, 2021. The increase in volumes was mainly attributable to our Cushing Connect pipeline, which went into service in September 2021, volumes on our recently acquired Sinclair Transportation crude pipelines and higher volumes on our crude pipeline systems in New Mexico, Texas, Wyoming and Utah. The increase in revenues was mainly due to our recently acquired Sinclair Transportation crude pipelines and higher volumes on our crude pipelines in New Mexico, Texas, Wyoming and Utah. Revenues did not increase in proportion to volumes due to our recognition of most of the Cushing Connect pipeline tariffs and a significant portion of the Sinclair Transportation crude pipeline tariffs as interest income under sales-type lease accounting.
  • Revenues from terminal, tankage and loading rack fees were $167.8 million, an increase of $25.5 million compared to the year ended December 31, 2021. Refined products and crude oil terminalled in the facilities averaged 598.2 mbpd compared to 442.9 mbpd for the year ended December 31, 2021. Volumes increased mainly due to volumes on our recently acquired Sinclair Transportation assets and higher throughputs at HF Sinclair's Tulsa refinery. Revenues increased mainly due to revenues on our recently acquired Sinclair Transportation assets, higher butane blending revenues and higher revenues on our Tulsa assets. In addition, the year ended December 31, 2021 included the recognition of the $10 million termination fee related to the termination of HF Sinclair's minimum volume commitment on our Cheyenne assets as a result of the conversion of the HF Sinclair Cheyenne refinery to renewable diesel production.
  • Revenues from refinery processing units were $94.2 million, an increase of $5.1 million compared to the year ended December 31, 2021. Throughputs averaged 70.2 mbpd compared to 69.6 mbpd for the year ended December 31, 2021. The increase in volumes was mainly due to increased throughput for our Woods Cross processing units. Revenues increased mainly due to higher recovery of natural gas costs as well as higher throughputs.

Operating Costs and Expenses Highlights

Operating costs and expenses were $82.6 million and $326.7 million for the three months and year ended December 31, 2022, respectively, representing an increase of $13.4 million and $38.7 million from the three months and year ended December 31, 2021, respectively. The increase for the three months ended December 31, 2022 was mainly due to operating costs and expenses associated with our recently acquired Sinclair Transportation assets, higher employee costs and higher utility costs, partially offset by lower maintenance and property tax costs. The increase for the year ended December 31, 2022 was mainly due to operating costs and expenses associated with our recently acquired Sinclair Transportation assets and higher employee costs, utility costs, natural gas costs, and maintenance costs, partially offset by lower general services costs and a goodwill impairment charge recognized in the year ended December 31, 2021.

Interest Expense and Interest Income Highlights

Interest expense was $25.6 million and $82.6 million for the three months and year ended December 31, 2022, respectively, representing increases of $12.4 million and $28.7 million over the same periods of 2021. The increases were mainly due to our April 2022 issuance of $400 million aggregate principal amount of 6.375% senior unsecured notes maturing in April 2027, the proceeds of which were used to partially repay outstanding borrowings under our senior secured credit facility following the funding of the cash portion of the Sinclair Transportation acquisition. In addition, market interest rates increased on our senior secured revolving credit facility.

Interest income for the three months and year ended December 31, 2022, totaled $30.2 million and $91.4 million, representing increases of $20.3 million and $61.5 million compared to the three months and year ended December 31, 2021. The increases were mainly due to higher sales-type lease interest income from our recently acquired Sinclair Transportation pipelines and terminals and our Cushing Connect pipeline, which was placed into service at the end of the third quarter of 2021.

Equity in Earnings of Equity Method Investments Highlights

Equity in earnings of equity method investments was a gain of $7.0 million for the three months ended December 31, 2022 and a loss of $0.3 million for the year ended December 31, 2022, representing an increase of $3.4 million and a decrease of $12.7 million compared to the three months and year ended December 31, 2021. The increase for the three months ended December 31, 2022 was mainly due to the addition of equity in earnings from Pioneer Investments Corp., which was acquired as part of our Sinclair Transportation acquisition.

The decrease for the year ended December 31, 2022 was mainly due to lower earnings from our equity method investment in Osage Pipe Line Company, LLC ("Osage") due to HEP's 50% share of incurred and estimated environmental remediation and recovery expenses, net of insurance proceeds received to date, of $17.6 million associated with a release of crude oil that occurred in the third quarter of 2022. Any additional insurance recoveries will be recorded as they are received. If our insurance policy pays out in full, our share of the remaining insurance coverage is expected to be $9.5 million. The pipeline resumed operations in the third quarter of 2022 and remediation efforts are underway. The decrease in equity in earnings from Osage was partially offset by the addition of equity in earnings from Pioneer Investments Corp., which was acquired as part of our Sinclair Transportation acquisition.

We have scheduled a webcast conference call today at 8:30 AM Eastern Time to discuss financial results. This webcast may be accessed at:

https://events.q4inc.com/attendee/250565072

An audio archive of this webcast will be available using the above noted link through March 10, 2023.

About Holly Energy Partners, L.P.

Holly Energy Partners, L.P. (“HEP” or the “Partnership”), headquartered in Dallas, Texas, provides petroleum product and crude oil transportation, terminalling, storage and throughput services to the petroleum industry, including subsidiaries of HF Sinclair Corporation. The Partnership, through its subsidiaries and joint ventures, owns and/or operates petroleum product and crude pipelines, tankage and terminals in Colorado, Idaho, Iowa, Kansas, Missouri, Nevada, New Mexico, Oklahoma, Texas, Utah, Washington and Wyoming, as well as refinery processing units in Kansas and Utah.

HF Sinclair Corporation (“HF Sinclair”), headquartered in Dallas, Texas, is an independent energy company that produces and markets high value light products such as gasoline, diesel fuel, jet fuel, renewable diesel and other specialty products. HF Sinclair owns and operates refineries located in Kansas, Oklahoma, New Mexico, Washington, Wyoming and Utah and markets its refined products principally in the Southwest U.S., the Rocky Mountains extending into the Pacific Northwest and in other neighboring Plains states. HF Sinclair supplies high-quality fuels to more than 1,500 branded stations and licenses the use of the Sinclair brand at more than 300 additional locations throughout the country. In addition, subsidiaries of HF Sinclair produce and market base oils and other specialized lubricants in the U.S., Canada and the Netherlands, and exports products to more than 80 countries. Through its subsidiaries, HF Sinclair produces renewable diesel at two of its facilities in Wyoming and also at its facility in Artesia, New Mexico. HF Sinclair also owns a 47% limited partner interest and a non-economic general partner interest in HEP.

The statements in this press release contain various "forward-looking statements" within the meaning of the federal securities laws, including statements about our expectations for future operating results, our expected leverage ratio, and our capital allocation strategy. These forward-looking statements are identified as any statement that does not relate strictly to historical or current facts. When used in this press release, words such as “anticipate,” “project,” “expect,” “will,” “plan,” “goal,” “forecast,” “strategy,” “intend,” “should,” “would,” “could,” “believe,” “may,” and similar expressions and statements regarding our plans and objectives for future operations are intended to identify forward-looking statements. These forward-looking statements are based on our beliefs and assumptions and those of our general partner using currently available information and expectations as of the date hereof, are not guarantees of future performance and involve certain risks and uncertainties, including those contained in our filings with the Securities and Exchange Commission (the “SEC”). Although we and our general partner believe that such expectations reflected in such forward-looking statements are reasonable, neither we nor our general partner can give assurance that our expectations will prove to be correct. All statements concerning our expectations for future results of operations are based on forecasts for our existing operations and do not include the potential impact of any future acquisitions. Our forward-looking statements are subject to a variety of risks, uncertainties and assumptions. If one or more of these risks or uncertainties materialize, or if underlying assumptions prove incorrect, our actual results may vary materially from those anticipated, estimated, projected or expected. Certain factors could cause actual results to differ materially from results anticipated in the forward-looking statements. These factors include, but are not limited to:

  • the demand for and supply of crude oil and refined products, including uncertainty regarding the effects of the continuing COVID-19 pandemic on future demand and increasing societal expectations that companies address climate change;
  • risks and uncertainties with respect to the actual quantities of petroleum products and crude oil shipped on our pipelines and/or terminalled, stored or throughput in our terminals and refinery processing units;
  • the economic viability of HF Sinclair, our other customers and our joint ventures’ other customers, including any refusal or inability of our or our joint ventures’ customers or counterparties to perform their obligations under their contracts;
  • the demand for refined petroleum products in the markets we serve;
  • our ability to purchase operations and integrate the operations we have acquired or may acquire, including the recently acquired Sinclair Transportation business;
  • our ability to complete previously announced or contemplated acquisitions;
  • the availability and cost of additional debt and equity financing;
  • the possibility of temporary or permanent reductions in production or shutdowns at refineries utilizing our pipelines, terminal facilities and refinery processing units, due to reductions in demand, accidents, unexpected leaks or spills, unscheduled shutdowns, infection in the workforce, weather events, civil unrest, expropriation of assets, and other economic, diplomatic, legislative, or political events or developments, terrorism, cyberattacks, or other catastrophes or disruptions affecting our operations, terminal facilities, machinery, pipelines and other logistics assets, equipment, or information systems, or any of the foregoing of our suppliers, customers, or third-party providers or lower gross margins due to the economic impact of the COVID-19 pandemic, inflation and labor costs, and any potential asset impairments resulting from, or the failure to have adequate insurance coverage for or receive insurance recoveries from, such actions;
  • the effects of current and future government regulations and policies, including the effects of current and future restrictions on various commercial and economic activities in response to the COVID-19 pandemic and increases in interest rates;
  • delay by government authorities in issuing permits necessary for our business or our capital projects;
  • our and our joint venture partners' ability to complete and maintain operational efficiency in carrying out routine operations and capital construction projects;
  • the possibility of terrorist or cyberattacks and the consequences of any such attacks;
  • uncertainty regarding the effects and duration of global hostilities, including the Russia-Ukraine war, and any associated military campaigns which may disrupt crude oil supplies and markets for refined products and create instability in the financial markets that could restrict our ability to raise capital;
  • general economic conditions, including economic slowdowns caused by a local or national recession or other adverse economic condition, such as periods of increased or prolonged inflation;
  • the impact of recent or proposed changes in the tax laws and regulations that affect master limited partnerships; and
  • other financial, operational and legal risks and uncertainties detailed from time to time in our SEC filings.

The forward-looking statements speak only as of the date made and, other than as required by law, we undertake no obligation to publicly update or revise any forward-looking statements, whether as a result of new information, future events or otherwise.

RESULTS OF OPERATIONS (Unaudited)

Income, Distributable Cash Flow and Volumes

The following tables present income, distributable cash flow and volume information for the three months and the years ended December 31, 2022 and 2021.


Three Months Ended December 31,


Change from


2022


2021


2021


(In thousands, except per unit data)

Revenues


Pipelines:


Affiliates – refined product pipelines

$

22,843


$

12,831


$

10,012


Affiliates – intermediate pipelines


8,358


7,537


821


Affiliates – crude pipelines


21,609


19,527


2,082


52,810


39,895


12,915


Third parties – refined product pipelines


7,541


9,876


(2,335

)

Third parties – crude pipelines


14,855


11,159


3,696


75,206


60,930


14,276


Terminals, tanks and loading racks:


Affiliates


34,312


29,080


5,232


Third parties


7,494


4,801


2,693


41,806


33,881


7,925


Affiliates - refinery processing units


25,498


23,682


1,816


Total revenues


142,510


118,493


24,017


Operating costs and expenses


Operations


53,629


44,298


9,331


Depreciation and amortization


24,695


21,906


2,789


General and administrative


4,258


2,973


1,285


82,582


69,177


13,405


Operating income


59,928


49,316


10,612


Equity in earnings of equity method investments


7,001


3,557


3,444


Interest expense, including amortization


(25,607

)


(13,223

)


(12,384

)

Interest income


30,193


9,928


20,265


Gain on sale of assets and other


27


185


(158

)


11,614


447


11,167


Income before income taxes


71,542


49,763


21,779


State income tax benefit (expense)


(28

)


28


(56

)

Net income


71,514


49,791


21,723


Allocation of net income attributable to noncontrolling interests


(3,032

)


(4,147

)


1,115


Net income attributable to Holly Energy Partners

$

68,482


$

45,644


$

22,838


Limited partners’ earnings per unit – basic and diluted

$

0.54


$

0.43


$

0.11


Weighted average limited partners’ units outstanding


126,440


105,440


21,000


EBITDA(1)

$

88,619


$

70,817


$

17,802


Adjusted EBITDA(1)

$

115,659


$

79,737


$

35,922


Distributable cash flow(2)

$

85,846


$

63,097


$

22,749


Volumes (bpd)


Pipelines:


Affiliates – refined product pipelines


157,236


81,272


75,964


Affiliates – intermediate pipelines


137,440


105,499


31,941


Affiliates – crude pipelines


445,391


334,103


111,288


740,067


520,874


219,193


Third parties – refined product pipelines


27,178


53,958


(26,780

)

Third parties – crude pipelines


176,765


120,902


55,863


944,010


695,734


248,276


Terminals and loading racks:


Affiliates


636,398


407,261


229,137


Third parties


30,164


53,091


(22,927

)


666,562


460,352


206,210


Affiliates – refinery processing units


71,168


68,810


2,358


Total for pipelines, terminals and refinery processing unit assets (bpd)


1,681,740


1,224,896


456,844


Contacts

John Harrison, Senior Vice President,
Chief Financial Officer and Treasurer
Craig Biery, Vice President, Investor Relations
Holly Energy Partners, L.P.
214-954-6511


Read full story here

LONDON--(BUSINESS WIRE)--The world’s leading maritime organisations and companies have released an open letter calling on United Nations Secretary-General Antonio Guterres to urgently prioritise the evacuation of 331 seafarers and 62 ships that remain trapped in Ukrainian ports.


The 34 signatories, including the International Chamber of Shipping, NKY Line, the Union of Greek Shipowners, Danish Shipping, and seafarer charities, called the situation an ‘unacceptable risk to life.’

In February 2022, 112 vessels crewed by more than 2,000 seafarers were berthed in Ukranian ports across the Black Sea and the Sea of Azov. Since then, 1,700 have been safely evacuated and have been able to return to their families or return to their work of keeping global trade flowing.

The remaining 331 seafarers from countries such as Bangladesh, Philippines, Turkey, Syria, China, Egypt, Lebanon, Greece, Indonesia, Ghana, India, Azerbaijan and Georgia, remain to maintain the safety and protect against environmental harm. No other industry have non-combatants in the area over a year on from the start of the conflict, as they can only leave when the ships leave.

Some of the ports where these seafarers remain have resumed operability, facilitating the Black Sea Grain Initiative. Shipping has been integral in carrying out this UN-brokered humanitarian effort, with crews sailing along the borders of the conflict zone to ensure the world continues to receive vital grain deliveries. However, ships who are not able to transport grain are excluded and remain trapped.

Since the onset of the war, shipping companies, charities, and unions have continually called for the safe and immediate evacuation of the trapped seafarers. They have also worked in coordination with international organisations to facilitate the evacuation effort, supported the trapped seafarers’ families, and provided the seafarers with provisions including food, clean water, and medical supplies.

To mark the one-year anniversary of the war in Ukraine, the shipping community sent this open letter to UNSG Guterres, calling on him to use his diplomatic abilities to evacuate the remaining seafarers ships.

- ENDS -

Notes to editors:

About ICS

The International Chamber of Shipping (ICS) is the principal international trade association for merchant shipowners and operators, representing all sectors and trades and over 80% of the world merchant fleet.

www.ics-shipping.org


Contacts

Katerina Dimitropoulos, Communications Manager, ICS
This email address is being protected from spambots. You need JavaScript enabled to view it. / +44 7494 363434

  • 2022 GAAP EPS of $3.27, compared to $3.83 in 2021
  • 2022 Adjusted EPS (Non-GAAP) of $3.71, compared to $3.46 in 2021
  • 2023 GAAP and Adjusted (Non-GAAP) EPS guidance of $3.55 to $3.75
  • Declares quarterly dividend of $0.6125 per share
  • Updates five-year $11.6B capital plan through 2027

KANSAS CITY, Mo.--(BUSINESS WIRE)--Evergy, Inc. (NASDAQ: EVRG) today announced full year 2022 GAAP earnings of $753 million, or $3.27 per share, compared to GAAP earnings of $880 million, or $3.83 per share, for the full year 2021. Fourth quarter 2022 GAAP earnings were $7.5 million, or $0.03 per share, compared to earnings of $53.4 million, or $0.23 per share, for the fourth quarter of 2021.


Evergy’s full year 2022 adjusted earnings (non-GAAP) and adjusted earnings per share (non-GAAP) were $854 million and $3.71, respectively, compared to $795 million and $3.46 in 2021, resulting in a 7.2% year-over-year increase, and a 12.4% increase over the $3.30 midpoint of the original 2021 adjusted EPS (Non-GAAP) guidance range.

Fourth quarter 2022 adjusted earnings (non-GAAP) and adjusted earnings per share (non-GAAP) were $69 million and $0.30, respectively, compared to $33 million and $0.14, respectively, in fourth quarter 2021. Adjusted earnings (non-GAAP) and adjusted earnings per share (non-GAAP) are reconciled to GAAP earnings in the financial table included in this release.

For the year, adjusted earnings (non-GAAP) per share were driven by higher weather-normalized demand, favorable weather, and higher transmission margin, partially offset by higher depreciation and amortization expense and higher interest expense.

"We are pleased with our strong results in 2022, exceeding the top end of our earnings per share guidance range while continuing to advance our objectives of affordability, reliability, and sustainability," said David Campbell, Evergy president and chief executive officer. "We're proud of our ongoing improvements in employee safety and customer satisfaction. In 2023, we look forward to working with Kansas regulators and stakeholders on our first general rate reviews since Evergy’s formation in 2018. We remain laser-focused on our culture of operational excellence that has provided significant savings to our customers and communities."

Earnings Guidance

The Company issued its 2023 GAAP EPS guidance range of $3.55 to $3.75, along with its 2023 adjusted EPS (Non-GAAP) guidance range of $3.55 to $3.75. Additionally, the Company reaffirmed its long-term adjusted EPS (Non-GAAP) annual growth target of 6% to 8% through 2025 from the $3.30 midpoint of the original 2021 adjusted EPS (Non-GAAP) guidance range. Adjusted EPS (non-GAAP) guidance is reconciled to GAAP EPS guidance in the financial table included in this release.

Dividend Declaration

The Board of Directors declared a dividend on the Company’s common stock of $0.6125 per share payable on March 22, 2023. The dividends are payable to shareholders of record as of March 9, 2023.

Capital Investment Plan

The Company updated its five-year capital investment plan to $11.6 billion from 2023 through 2027. The investment plan is highlighted by over $6.6 billion of transmission and distribution spend to modernize grid infrastructure and improve resiliency and reliability, as well as $2.1 billion of new renewables and other generation to advance the company’s on-going fleet transition and increase the share of low-cost, emissions-free generation.

Earnings Conference Call

Evergy management will host a conference call Friday, February 24, with the investment community at 9:00 a.m. ET (8:00 a.m. CT). To view the webcast and presentation slides, please go to investors.evergy.com. To access via phone, investors and analysts will need to register using this link where they will be provided a phone number and access code.

Members of the media are invited to listen to the conference call and then contact Gina Penzig with any follow-up questions.

This earnings announcement, a package of detailed fourth-quarter financial information, the Company's annual report on Form 10-K for the period ended December 31, 2022, and other filings the Company has made with the Securities and Exchange Commission are available on the Company's website at http://investors.evergy.com.

Adjusted Earnings (non-GAAP) and Adjusted Earnings Per Share (non-GAAP)

Effective in the third quarter of 2022, the calculation of adjusted earnings (non-GAAP) and adjusted EPS (non-GAAP) excludes the revenues collected from customers for the return on investment of the retired Sibley Station in the current period and the 2022 deferral of the cumulative amount of revenues collected since December 2018 to be refunded to customers. Effective in the fourth quarter of 2022, the calculation of adjusted earnings (non-GAAP) and adjusted EPS (non- GAAP) excludes the transmission revenues collected from customers in the current period and the 2022 deferral of the cumulative amount of transmission revenues collected since 2018 through Evergy Kansas Central's FERC Transmission Formula Rate (TFR) to be refunded to customers as a result of a December 2022 FERC order. Management believes that this is a representative measure of Evergy's recurring earnings, assists in the comparability of results and is consistent with how management reviews performance.

Evergy's adjusted earnings (non-GAAP) and adjusted EPS (non-GAAP) for 2021 have been recast, as applicable, to conform to the current year presentation. Evergy's adjusted earnings (non-GAAP) and adjusted EPS (non-GAAP) for 2022 were $853.8 million or $3.71 per share. For 2021, Evergy's adjusted earnings (non-GAAP) and adjusted EPS (non-GAAP) were $795.2 million or $3.46 per share.

In addition to net income attributable to Evergy, Inc. and diluted EPS, Evergy's management uses adjusted earnings (non-GAAP) and adjusted EPS (non-GAAP) to evaluate earnings and EPS without (i.) the income or costs resulting from non-regulated energy marketing margins from the February 2021 winter weather event; (ii.) gains or losses related to equity investments subject to a restriction on sale; (iii.) the revenues collected from customers for the return on investment of the retired Sibley Station in the current period and the 2022 deferral of the cumulative amount of revenues collected since December 2018 for future refunds to customers; (iv.) the estimated impairment loss on Sibley Unit 3 and other regulatory disallowances; (v.) the mark-to-market impacts of economic hedges related to Evergy Kansas Central's non-regulated 8% ownership share of Jeffrey Energy Center (JEC); (vi.) the transmission revenues collected from customers through Evergy Kansas Central's FERC TFR to be refunded to customers in accordance with a December 2022 FERC order; and (vii.) costs resulting from executive transition, severance, advisor expenses and COVID-19 vaccine incentives.

Adjusted earnings (non-GAAP) and adjusted EPS (non-GAAP) are intended to aid an investor's overall understanding of results. Management believes that adjusted earnings (non-GAAP) provides a meaningful basis for evaluating Evergy's operations across periods because it excludes certain items that management does not believe are indicative of Evergy's ongoing performance or that can create period to period earnings volatility.

Adjusted earnings (non-GAAP) and adjusted EPS (non-GAAP) are used internally to measure performance against budget and in reports for management and the Evergy Board of Directors. Adjusted earnings (non-GAAP) and adjusted EPS (non-GAAP) are financial measures that are not calculated in accordance with GAAP and may not be comparable to other companies' presentations or more useful than the GAAP information provided elsewhere in this report.

Evergy, Inc

Consolidated Earnings and Diluted Earnings Per Share

(Unaudited)


Earnings (Loss)


Earnings (Loss) per Diluted Share


Earnings (Loss)


Earnings (Loss) per Diluted Share

Three Months Ended December 31

2022


2021


(millions, except per share amounts)

Net income attributable to Evergy, Inc.

$

7.5


$

0.03


$

53.4


$

0.23


Non-GAAP reconciling items:


Non-regulated energy marketing margin related to February 2021 winter weather event, pre-tax(a)


0.5


Sibley Station return on investment, pre-tax(b)


13.2


0.06


(3.1

)


(0.01

)

Mark-to-market impact of JEC economic hedges, pre-tax(c)


(0.9

)


Non-regulated energy marketing costs related to February 2021 winter weather event, pre-tax(d)


0.4


2.0


0.01


Executive transition costs, pre-tax(e)


1.5


0.01


0.2


Severance costs, pre-tax(f)


2.3


0.01


Advisor expenses, pre-tax(g)


2.3


0.01


3.2


0.01


COVID-19 vaccine incentive, pre-tax(h)


1.2


0.01


Sibley impairment loss and other regulatory disallowances, pre-tax(i)


28.9


0.13


Restricted equity investment (gains) losses, pre-tax(j)


(27.7

)


(0.12

)

TFR refund, pre-tax(k)


30.8


0.13


(2.5

)


(0.01

)

Income tax expense (benefit)(l)


(17.4

)


(0.08

)


5.7


0.02


Adjusted earnings (non-GAAP)

$

68.6


$

0.30


$

32.9


$

0.14


Earnings (Loss)


Earnings (Loss) per Diluted Share


Earnings (Loss)


Earnings (Loss) per Diluted Share

Year Ended December 31

2022


2021


(millions, except per share amounts)

Net income attributable to Evergy, Inc.

$

752.7


$

3.27


$

879.7


$

3.83


Non-GAAP reconciling items:


Non-regulated energy marketing margin related to February 2021 winter weather event, pre-tax(a)


2.1


0.01


(94.5

)


(0.41

)

Sibley Station return on investment, pre-tax(b)


51.4


0.22


(12.4

)


(0.05

)

Mark-to-market impact of JEC economic hedges, pre-tax(c)


(11.2

)


(0.05

)


Non-regulated energy marketing costs related to February 2021 winter weather event, pre-tax(d)


1.3


0.01


7.9


0.03


Executive transition costs, pre-tax(e)


2.2


0.01


10.8


0.05


Severance costs, pre-tax(f)


2.3


0.01


2.8


0.01


Advisor expenses, pre-tax(g)


5.4


0.02


11.6


0.05


COVID-19 vaccine incentive, pre-tax(h)


1.2


0.01


Sibley impairment loss and other regulatory disallowances, pre-tax(i)


34.9


0.15


Restricted equity investment losses (gains), pre-tax(j)


16.3


0.07


(27.7

)


(0.12

)

TFR refund, pre-tax(k)


25.0


0.11


(9.9

)


(0.05

)

Income tax (benefit) expense (l)


(28.6

)


(0.12

)


25.7


0.11


Adjusted earnings (non-GAAP)

$

853.8


$

3.71


$

795.2


$

3.46


(a)

Reflects non-regulated energy marketing margins related to the February 2021 winter weather event that are included in operating revenues on the consolidated statements of comprehensive income.

(b)

Reflects revenues collected from customers for the return on investment of the retired Sibley Station in the current period and the 2022 deferral of the cumulative amount of revenues collected since December 2018 that are included in operating revenues on the consolidated statements of comprehensive income.

(c)

Reflects mark to market gains or losses related to forward contracts for natural gas and electricity entered into as economic hedges against fuel price volatility related to Evergy Kansas Central's non-regulated 8% ownership share of JEC that are included in operating revenues on the consolidated statements of comprehensive income.

(d)

Reflects non-regulated energy marketing incentive compensation costs related to the February 2021 winter weather event that are included in operating and maintenance expense on the consolidated statements of comprehensive income.

(e)

Reflects costs associated with executive transition including inducement bonuses, severance agreements and other transition expenses that are included in operating and maintenance expense on the consolidated statements of comprehensive income.

(f)

Reflects severance costs incurred associated with certain severance programs at the Evergy Companies that are included in operating and maintenance expense on the consolidated statements of comprehensive income.

(g)

Reflects advisor expenses incurred associated with strategic planning that are included in operating and maintenance expense on the consolidated statements of comprehensive income.

(h)

Reflects incentive compensation costs incurred associated with employees becoming fully vaccinated against COVID-19 that are included in operating and maintenance expense on the consolidated statements of comprehensive income.

(i)

Reflects the impairment loss on Sibley Unit 3 and costs related to certain meter replacements that were disallowed in the 2022 Evergy Metro and Evergy Missouri West rate cases that are included in Sibley Unit 3 impairment loss and other regulatory disallowances on the consolidated statements of comprehensive income.

(j)

Reflects (gains) losses related to equity investments which were subject to a restriction on sale that are included in investment earnings on the consolidated statements of comprehensive income.

(k)

Reflects transmission revenues collected from customers in the current period and the 2022 deferral of the cumulative amount of transmission revenues collected since 2018 through Evergy Kansas Central's FERC TFR to be refunded to customers in accordance with a December 2022 FERC order that are included in operating revenues on the consolidated statements of comprehensive income.

(l)

Reflects an income tax effect calculated at a statutory rate of approximately 22%, with the exception of certain non-deductible items.

GAAP to Non-GAAP Earnings Guidance


Original 2021
Earnings per

Diluted Share

Guidance

2023
Earnings per

Diluted Share

Guidance

Net income attributable to Evergy, Inc.

$3.14 - $3.34

$3.55 - $3.75

Non-GAAP reconciling items:


Advisor expense, pre-tax(a)

0.05

-

Executive transition cost, pre-tax(b)

0.03

-

Income tax benefit(c)

(0.02)

-

Adjusted earnings (non-GAAP)

$3.20 - $3.40

$3.55 - $3.75

(a)

Reflects our advisor expense incurred associated with strategic planning.

(b)

Reflects costs associated with certain executive transition costs at the Evergy Companies.

(c)

Reflects an income tax effect calculated at a statutory rate of approximately 26% with the exception of certain non-deductible items.

About Evergy

Evergy, Inc. (NASDAQ: EVRG), serves 1.7 million customers in Kansas and Missouri. Evergy’s mission is to empower a better future. Our focus remains on producing, transmitting and delivering reliable, affordable, and sustainable energy for the benefit of our stakeholders. Today, about half of Evergy’s power comes from carbon-free sources, creating more reliable energy with less impact to the environment. We value innovation and adaptability to give our customers better ways to manage their energy use, to create a safe, diverse and inclusive workplace for our employees, and to add value for our investors. Headquartered in Kansas City, our employees are active members of the communities we serve.

For more information about Evergy, visit us at http://investors.evergy.com.

Forward Looking Statements

Statements made in this document that are not based on historical facts are forward-looking, may involve risks and uncertainties, and are intended to be as of the date when made. Forward-looking statements include, but are not limited to, statements relating to Evergy's strategic plan, including, without limitation, those related to earnings per share, dividend, operating and maintenance expense and capital investment goals; the outcome of legislative efforts and regulatory and legal proceedings; future energy demand; future power prices; plans with respect to existing and potential future generation resources; the availability and cost of generation resources and energy storage; target emissions reductions; and other matters relating to expected financial performance or affecting future operations. Forward-looking statements are often accompanied by forward-looking words such as “anticipates,” “believes,” “expects,” “estimates,” “forecasts,” “should,” “could,” “may,” “seeks,” “intends,” “proposed,” “projects,” “planned,” “target,” “outlook,” “remain confident,” “goal,” “will” or other words of similar meaning. Forward-looking statements involve risks, uncertainties and other factors that could cause actual results to differ materially from the forward-looking information.

In connection with the safe harbor provisions of the Private Securities Litigation Reform Act of 1995, Evergy, Inc., Evergy Kansas Central, Inc. and Evergy Metro, Inc. (collectively, the Evergy Companies) are providing a number of risks, uncertainties and other factors that could cause actual results to differ from the forward-looking information. These risks, uncertainties and other factors include, but are not limited to: economic and weather conditions and any impact on sales, prices and costs; changes in business strategy or operations; the impact of federal, state and local political, legislative, judicial and regulatory actions or developments, including deregulation, re-regulation, securitization and restructuring of the electric utility industry; decisions of regulators regarding, among other things, customer rates and the prudency of operational decisions such as capital expenditures and asset retirements; changes in applicable laws, regulations, rules, principles or practices, or the interpretations thereof, governing tax, accounting and environmental matters, including air and water quality and waste management and disposal; the impact of climate change, including increased frequency and severity of significant weather events and the extent to which counterparties are willing to do business with, finance the operations of or purchase energy from the Evergy Companies due to the fact that the Evergy Companies operate coal-fired generation; prices and availability of electricity and natural gas in wholesale markets; market perception of the energy industry and the Evergy Companies; the impact of the Coronavirus (COVID-19) pandemic on, among other things, sales, results of operations, financial condition, liquidity and cash flows, and also on operational issues, such as supply chain issues and the availability and ability of the Evergy Companies’ employees and suppliers to perform the functions that are necessary to operate the Evergy Companies; changes in the energy trading markets in which the Evergy Companies participate, including retroactive repricing of transactions by regional transmission organizations (RTO) and independent system operators; financial market conditions and performance, including changes in interest rates and credit spreads and in availability and cost of capital and the effects on derivatives and hedges, nuclear decommissioning trust and pension plan assets and costs; impairments of long-lived assets or goodwill; credit ratings; inflation rates; the transition to a replacement for the London Interbank Offered Rate (LIBOR) benchmark interest rate; effectiveness of risk management policies and procedures and the ability of counterparties to satisfy their contractual commitments; impact of physical and cybersecurity breaches, criminal activity, terrorist attacks, acts of war and other disruptions to the Evergy Companies’ facilities or information technology infrastructure or the facilities and infrastructure of third-party service providers on which the Evergy Companies rely; impact of the Russian, Ukrainian conflict on the global energy market; ability to carry out marketing and sales plans; cost, availability, quality and timely provision of equipment, supplies, labor and fuel; ability to achieve generation goals and the occurrence and duration of planned and unplanned generation outages; delays and cost increases of generation, transmission, distribution or other projects; the Evergy Companies’ ability to manage their transmission and distribution development plans and transmission joint ventures; the inherent risks associated with the ownership and operation of a nuclear facility, including environmental, health, safety, regulatory and financial risks; workforce risks, including those related to the Evergy Companies’ ability to attract and retain qualified personnel, maintain satisfactory relationships with their labor unions and manage costs of, or changes in, wages, retirement, health care and other benefits; disruption, costs and uncertainties caused by or related to the actions of individuals or entities, such as activist shareholders or special interest groups, that seek to influence Evergy’s strategic plan, financial results or operations; the impact of changing expectations and demands of our customers, regulators, investors and stakeholders, including heightened emphasis on environmental, social and governance concerns; the possibility that strategic initiatives, including mergers, acquisitions and divestitures, and long-term financial plans, may not create the value that they are expected to achieve in a timely manner or at all; difficulties in maintaining relationships with customers, employees, regulators or suppliers; and other risks and uncertainties.

This list of factors is not all-inclusive because it is not possible to predict all factors. You should also carefully consider the information contained in the Evergy Companies’ other filings with the Securities and Exchange Commission (SEC). Additional risks and uncertainties are discussed in the Annual Report on Form 10-K for the year ended December 31, 2022, filed by the Evergy Companies with the SEC, and from time to time in current reports on Form 8-K and quarterly reports on Form 10-Q filed by the Evergy Companies with the SEC. Each forward-looking statement speaks only as of the date of the particular statement. The Evergy Companies undertake no obligation to publicly update or revise any forward-looking statement, whether as a result of new information, future events or otherwise, except as required by law.


Contacts

Investor Contact:
Pete Flynn
Director, Investor Relations
Phone: 816-652-1060
This email address is being protected from spambots. You need JavaScript enabled to view it.

Media Contact:
Gina Penzig
Manager, External Communications
Phone: 785-508-2410
This email address is being protected from spambots. You need JavaScript enabled to view it.
Media line: 888-613-0003

LEMONT,Ill.--(BUSINESS WIRE)--Many owners of electric cars have wished for a battery pack that could power their vehicle for more than a thousand miles on a single charge. Researchers at the Illinois Institute of Technology (IIT) and U.S. Department of Energy’s Argonne National Laboratory have developed a lithium-air battery that could make that dream a reality. The team’s new battery design could also one day power domestic airplanes and long-haul trucks.


The main new component in this lithium-air battery is a solid electrolyte instead of the usual liquid variety. Batteries with solid electrolytes are not subject to the safety issue with the liquid electrolytes used in lithium-ion and other battery types, which can overheat and catch fire.

More importantly, the team’s lithium-air solid electrolyte design can potentially boost the battery’s energy density by as much as four times above lithium-ion batteries, which translates into longer driving range.

The team’s new solid electrolyte is composed of a ceramic polymer material made from relatively inexpensive elements in nanoparticle form. This new solid enables chemical reactions that produce lithium oxide on discharge.

In past lithium-air designs, the lithium in a lithium metal anode moves through a liquid electrolyte to combine with oxygen during the discharge, yielding lithium peroxide or superoxide at the cathode. The lithium peroxide or superoxide is then broken back down into its lithium and oxygen components during the charge. This chemical reaction stores and releases energy on demand.

The chemical reaction yielding lithium oxide involves four electrons stored per oxygen molecule, whereas that for lithium superoxide or peroxide only involves one or two electrons. More electrons stored translates into higher energy density.

The team’s lithium-air design is the first lithium-air test cell that has achieved a four-electron reaction at room temperature. It also operates with oxygen supplied by air from the surrounding environment. The capability to run with air avoids the need for oxygen tanks to operate, a problem with earlier designs.

With further development, the team expects their new battery design could reach a record energy density of 1,200 watt-hours per kilogram, nearly four times better than lithium-ion batteries.


Contacts

Christopher J. Kramer
Head of Media Relations
Argonne National Laboratory
This email address is being protected from spambots. You need JavaScript enabled to view it.
Office: 630.252.5580

California Resources Corporation Raises its Share Repurchase Program by Nearly 30% to $1.1 Billion and Meaningfully Advances its Carbon Management Business

LONG BEACH, Calif.--(BUSINESS WIRE)--California Resources Corporation (NYSE: CRC), an independent oil and natural gas company committed to energy transition in the sector, today reported fourth quarter and full year 2022 operational and financial results.


"CRC continued to deliver as we closed out 2022 with record operating cash flow which allowed us to return $372 million to shareholders. Given our positive outlook on 2023 free cash flow generation, we are increasing our Share Repurchase Program to $1.1 billion, a $250 million or nearly 30% increase, with approximately $640 million remaining on our authorization as of December 31, 2022 after taking into account this increase. Our 2023 development plans will utilize current permits in-hand and focus on workovers and maintenance opportunities to maximize cash flow per share," said Mac McFarland, CRC’s President and Chief Executive Officer.

"We continued to build off the momentum we generated throughout the year. In late 2022 and the start of 2023, our Carbon Management Business signed two carbon dioxide management agreements (CDMAs) to sequester 470,000 metric tons (MT) of carbon dioxide (CO2). Further, we announced the formation of a consortium of organizations across industry, technology, academia, national labs, community, government, and labor to create the California Direct Air Capture (DAC) Hub, reinforcing our dedication and commitment to California’s energy transition. For the balance of 2023, we will continue developing our Carbon Management Business, while making strides in our CalCapture project, filing additional Class VI permits with the EPA and advancing numerous additional CDMAs."

Annual Highlights

  • Reported net income attributable to common stock of $524 million, or $6.75 per diluted share. When adjusted for items analysts typically exclude from estimates including noncash mark to market gains and gains on asset divestitures, the Company’s adjusted net income1 was $384 million, or $4.95 per diluted share
  • Generated operating cash flow of $690 million, adjusted EBITDAX1 of $852 million, free cash flow1 of $311 million, and E&P, Corporate and Other Free Cash Flow1 of $362 million in 2022
  • Returned $372 million to shareholders in 2022, $59 million in dividends and $313 million through the Share Repurchase Program, while maintaining a strong cash balance of $307 million
  • Produced an average of 55,000 barrels of oil per day throughout the year, with total drilling and completions and workover capital expenditures of $278 million in 2022
  • Increased the Share Repurchase Program by $250 million to $1.1 billion, extended the program term through June 30, 2024, and repurchased ~14% of the Company's common stock since program inception
  • Advanced the Carbon Management Business in California on several fronts:
    • Formed a joint venture with Brookfield Renewables,
    • Submitted Class VI permits to EPA for an additional 94 MMT of CO2 reservoirs,
    • Executed two CDMAs to sequester 470,000 MT of CO2 per annum at CTV I and CTV III reservoirs, and
    • Made substantial progress on CalCapture Project with targeted Final Investment Decision (FID) in early 2024
  • Through its subsidiary CTV Direct, formed in February 2023 a consortium of organizations across industry, technology, academia, national labs, community, government, and labor that is intended to create California's first DAC Hub

Fourth Quarter 2022 Highlights

Financial

  • Reported net income of $83 million, or $1.11 per diluted share. When adjusted for items analysts typically exclude from estimates including mark-to-market adjustments and gains on asset divestitures, the Company’s adjusted net income1 was $93 million, or $1.24 per diluted share
  • Generated net cash provided by operating activities of $114 million, adjusted EBITDAX1 of $208 million and free cash flow1 of $39 million
  • Ended the quarter with $307 million of cash on hand and an undrawn RBL credit facility representing $765 million of total liquidity2
  • Declared a quarterly dividend of $0.2825 per share of common stock, totaling ~$20 million payable on March 16, 2023 to shareholders of record on March 6, 2023, with subsequent quarterly dividends subject to final determination and Board approval
  • Repurchased 1,521,190 common shares for $66 million during the fourth quarter of 2022; repurchased an aggregate 11,456,260 shares for $461 million since the inception of the Share Repurchase Program through December 31, 2022

Operations

  • Produced an average of 91,000 net barrels of oil equivalent per day (Boe/d), including 55,000 barrels of oil per day (Bo/d), with E&P capital expenditures of $81 million during the quarter
  • Operated one drilling rig in the San Joaquin Basin and two drilling rigs in the Los Angeles Basin; drilled 23 wells (23 online in 4Q22)
  • Operated 36 maintenance rigs in the fourth quarter

2023 Guidance and Capital Program3

CRC expects its 2023 capital program to range between $200 and $245 million. The program includes $154 to $184 million of adjusted capital for oil and natural gas development4, $15 to $25 million of adjusted capital for carbon management projects4 and $31 to $36 million for corporate and other activities, including procuring long-lead time items for planned maintenance at CRC's Elk Hills power plant in 2024. The foregoing amounts related to carbon management projects does not include amounts funded by Brookfield through the Carbon TerraVault JV. See Part II, Item 8 – Financial Statements and Supplementary Data, Note 8 Investment in Unconsolidated Subsidiary and Related Party Transactions for more information on CRC's joint venture with Brookfield. The actual amount of spending under CRC's 2023 capital program will depend on a variety of factors including regulatory and permitting status.

CRC expects to produce between 85,000 and 91,000 Boe/d3 (~60% oil) in 2023. CRC plans to run a development program averaging 1.5 rigs in 2023 for drilling locations for which we already have permits and will otherwise focus on workover and maintenance activity to offset base decline following the ongoing impact of the Kern County EIR litigation.

On a go-forward basis utilizing a 1.5 rig program, CRC would expect to spend ~$155 million in E&P drilling and completions and workover capital. This level of spending excludes one-time items and CMB capital which is expected to be funded by projected CTV JV contributions.


CRC GUIDANCE3

Total
2023E


CMB
2023E


E&P, Corp. & Other
2023E

Net Total Production (MBoe/d)

85 - 91


85 - 91

Net Oil Production (MBbl/d)

51 - 55


51 - 55

Operating Costs ($ millions)

$845 - $895


$845 - $895

CMB Expenses5 ($ millions)

$25 - $35


$25 - $35


Adjusted General and Administrative Expenses1 ($ millions)

$195 - $225


$10 - $15


$185 - $210

Total Capital ($ millions)

$200 - $245


$5 - $15


$195 - $230

Adjusted Total Capital4 ($ millions)

$200 - $245


$15 - $25


$185 - $220

Drilling & Completions

$66 - $76


$66 - $76

Workovers

$44 - $54


$44 - $54

Adjusted Facilities

$44 - $54


$44 - $54

Corporate & Other

$31 - $36


$31 - $36

Adjusted CMB

$15 - $25


$15 - $25


Free Cash Flow1 ($ millions)

$330 - $440


($60) - ($80)


$410 - $500


Natural Gas Trading, Net ($ millions)

$60 - $70


$60 - $70

Net Electricity ($ millions)

$80 - $120


$80 - $120

Transportation Expense ($ millions)

$50 - $70


$50 - $70

ARO Settlement Payments* ($ millions)

$55 - $60


$55 - $60

Taxes Other Than on Income* ($ millions)

$175 - $185


$175 - $185

Interest and Debt Expense* ($ millions)

$55 - $60


$55 - $60

Cash Income Taxes* ($ millions)

$80 - $100


$80 - $100


Commodity Realizations:


Oil - % of Brent:

97% - 99%


97% - 99%

NGL - % of Brent:

58% - 64%


58% - 64%

Natural Gas - % of NYMEX:

150% - 250%


150% - 250%

*Notes:

  • 2023E ARO Settlement Payments: ~25% of estimated annual amount is paid every quarter
  • 2023E Taxes Other Than on Income: ~30% of estimated annual amount is paid in 1Q and 4Q, respectively
  • 2023E Interest Expense: ~46% of estimated annual amount is paid in cash in 1Q and 3Q, respectively
  • Cash Income Taxes aren’t paid evenly throughout 2023

First Quarter 2023 Guidance and Capital Program3

CRC expects its first quarter 2023 capital program to range between $57 and $69 million assuming normal operating conditions. This includes $2 to $4 million for carbon management projects.

At this level of spending, CRC expects to produce between 89,000 and 91,000 Boe/d3 (~59% oil) in the first quarter of 2023 and plans to run 3 drilling rigs in the Long Beach and San Joaquin basins developing drilling locations for which we already have permits. CRC will also focus on workover activity throughout 2023 to offset base decline following the impact of the Kern County EIR litigation.

CRC sells all of its natural gas not used in its operations into the California market where the majority of these sales are done via bid in monthly method. Given the recent natural gas environment, CRC expects the first quarter of 2023 to benefit on a net basis, particularly in its natural gas revenue and natural gas marketing segments. CRC also expects to see higher costs related to purchased natural gas and energy operating costs, but as CRC is net long natural gas, the benefit will exceed the higher costs.


CRC GUIDANCE3

Total
1Q23E

CMB
1Q23E

E&P, Corp. & Other
1Q23E

Net Total Production (MBoe/d)

89 - 91


89 - 91

Net Oil Production (MBbl/d)

53 - 54


53 - 54

Operating Costs ($ millions)

$260 - $270


$260 - $270

CMB Expenses5 ($ millions)

$5 - $10


$5 - $10


Adjusted General and Administrative Expenses1 ($ millions)

$50 - $58


$3 - $5


$47 - $53

Total Capital ($ millions)

$57 - $69


$2 - $4


$55 - $65

Adjusted Total Capital4 ($ millions)

$57 - $69


$2 - $4


$55 - $65

Free Cash Flow1 ($ millions)

$151 - $180


($15) - ($24)


$175 - $195


Natural Gas Trading, Net ($ millions)

$35 - $45


$35 - $45

Net Electricity ($ millions)

$25 - $35


$25 - $35

Transportation Expense ($ millions)

$14 - $16


$14 - $16


Commodity Realizations:


Oil - % of Brent:

97% - 99%


97% - 99%

NGL - % of Brent:

63% - 65%


63% - 65%

Natural Gas - % of NYMEX*:

400% - 500%


400% - 500%

*Note: January and February natural gas average realized prices were ~$47.50 and ~$10.00 per Mcf, respectively.

Fourth Quarter & Full Year 2022 E&P Operational Results

In November 2020, the SEC amended Regulation S-K to, among other things, provide companies with the option to discuss material changes to results of operations between the current and immediately preceding quarter. CRC has elected to discuss its results of operations on a sequential-quarter basis. CRC believes this approach provides more meaningful and useful information to measure its performance from the immediately preceding quarter. In accordance with this final rule, CRC is not required to include a comparison of the current quarter and the same prior-year quarter.

Total daily net production for the three months ended December 31, 2022, compared to the three months ended September 30, 2022 decreased by approximately 1 MBoe/d, or 1%. This decrease is predominately a result of CRC's natural decline and lower development drilling, partially offset by production-sharing contracts (PSCs), which positively impacted CRC's net oil production in the three months ended December, 2022 by approximately 1 MBoe/d, compared to the three months ended September 30, 2022.

Total daily net production for the year ended December 31, 2022, compared to the year ended December 31, 2021 decreased by approximately 9 MBoe/d, or 9%. The decrease was predominately a result of CRC's natural decline and lower development drilling which accounted for approximately 4 MBoe/d and divestitures of certain Ventura basin and Lost Hills assets which accounted for approximately 5 MBoe/d. See Part II, Item 8 – Financial Statements and Supplementary Data, Note 3 Divestitures and Acquisitions of CRC's 2022 10-K for more information on CRC's divestitures in 2022.

During the fourth quarter of 2022, CRC operated an average of one drilling rig in the San Joaquin Basin and two drilling rigs in the Los Angeles Basin. During the quarter, CRC drilled 23 net wells and brought online 23 wells. See Attachment 3 for further information on CRC's production results by basin and Attachment 5 for further information on CRC's drilling activity.

Fourth Quarter & Full Year 2022 Financial Results


4th Quarter


3rd Quarter


Total Year


Total Year

($ and shares in millions, except per share amounts)

2022


2022


2022


2021


Statements of Operations:


Revenues


Total operating revenues

$

682


$

1,125


$

2,707


$

1,889


Operating Expenses


Total operating expenses


549


536


1,954


1,720


Gain on asset divestitures


(1

)


2


59


124


Operating Income

$

132


$

591


$

812


$

293


Net Income Attributable to Common Stock

$

83


$

426


$

524


$

612


Net income attributable to common stock per share - basic

$

1.14


$

5.75


$

6.94


$

7.46


Net income attributable to common stock per share - diluted

$

1.11


$

5.58


$

6.75


$

7.37


Adjusted net income1

$

93


$

111


$

384


$

506


Adjusted net income1 per share - diluted

$

1.24


$

1.45


$

4.95


$

6.10


Weighted-average common shares outstanding - basic


72.7


74.1


75.5


82.0


Weighted-average common shares outstanding - diluted


75.0


76.3


77.6


83.0


Adjusted EBITDAX1

$

208


$

234


$

852


$

860


Review of Fourth Quarter & Full Year 2022 Financial Results

Realized oil prices, excluding the effects of cash settlements on CRC's commodity derivative contracts, decreased by $10.81 per barrel from $97.96 per barrel in the third quarter of 2022 to $87.15 per barrel in the fourth quarter of 2022. Crude realizations decreased in the fourth quarter of 2022 relative to the third quarter of 2022 as California refining margins tightened significantly leaving those refiners less motivated to secure incremental barrels.

For the year ended December 31, 2022, realized oil prices, excluding the effects of cash settlements on CRC's commodity derivative contracts, increased by $27.83 per barrel to $98.26 from $70.43 per barrel in the same period of 2021. Capital and production discipline across domestic and international producers generally offset continued COVID-19 lockdowns in China, reduced energy demand across much of Europe and the release of meaningful quantities of oil from the United States Strategic Petroleum Reserve.

Realized oil prices, including the effects of cash settlements on CRC's commodity derivative contracts, decreased by $1.12 from $62.45 in the third quarter of 2022 to $61.33 in the fourth quarter of 2022.

For the year ended December 31, 2022, realized oil prices, including the effects of cash settlements on CRC's commodity derivative contracts, increased by $5.75 to $61.80 from $56.05 per barrel in the same period of 2021. See Attachment 4 for further information on prices.

Adjusted EBITDAX1 for the fourth quarter of 2022 and for the year ended December 31, 2022, was $208 million and $852 million, respectively. See table below for the Company's net cash provided by operating activities, capital investments and free cash flow1 during the same periods.


FREE CASH FLOW1


Management uses free cash flow, which is defined by CRC as net cash provided by operating activities less capital investments, as a measure of liquidity. The following table presents a reconciliation of CRC's net cash provided by operating activities to free cash flow. CRC supplemented its non-GAAP measure of free cash flow with free cash flow of CRC's exploration and production and corporate items (Free Cash Flow for E&P, Corporate & Other) which it believes is a useful measure for investors to understand the results of its core oil and gas business. CRC defines Free Cash Flow for E&P, Corporate & Other as consolidated free cash flow less results attributable to its carbon management business (CMB).


4th Quarter


3rd Quarter


Total Year


Total Year

($ millions)

2022


2022


2022


2021


Net cash provided by operating activities

$

114


$

235


$

690


$

660


Capital investments


(75

)


(107

)


(379

)


(194

)

Free cash flow1


39


128


311


466


E&P, corporate & other free cash flow1

$

61


$

139


$

362


$

472


CMB free cash flow1

$

(22

)

$

(11

)

$

(51

)

$


The following table presents key operating data for CRC's oil and gas operations, on a per BOE basis, for the periods presented below. Energy operating costs consist of purchased natural gas used to generate electricity for CRC's operations and steam for its steamfloods, purchased electricity and internal costs to generate electricity used in CRC's operations. Gas processing costs include costs associated with compression, maintenance and other activities needed to run CRC's gas processing facilities at Elk Hills. Non-energy operating costs equal total operating costs less energy operating costs and gas processing costs. Purchased natural gas used to generate steam in CRC's steamfloods was reclassified from non-energy operating costs to energy operating costs beginning in the third quarter of 2022. All prior periods have been updated to conform to this presentation.


OPERATING COSTS PER BOE


The reporting of PSCs creates a difference between reported operating costs, which are for the full field, and reported volumes, which are only CRC's net share, inflating the per barrel operating costs. The following table presents operating costs after adjusting for the excess costs attributable to PSCs.


4th Quarter


3rd Quarter


Total Year


Total Year

($ per Boe)

2022


2022


2022


2021

Energy operating costs

$

9.56


$

10.96


$

9.76


$

7.01


Gas processing costs


0.48


0.49


0.52


0.54


Non-energy operating costs


13.82


13.82


13.47


11.84


Operating costs

$

23.86


$

25.27


$

23.75


$

19.39


Excess costs attributable to PSCs

$

(1.90

)


(2.16

)


$

(2.23

)


(1.83

)

Operating costs, excluding effects of PSCs (a)

$

21.96


$

23.11


$

21.52


$

17.56


(a)

Operating costs, excluding effects of PSCs is a non-GAAP measure.


Energy operating costs for the fourth quarter of 2022 were $80 million, or $9.56 per Boe, which was a decrease of $13 million or 14% from $93 million, or $10.96 per Boe, for the third quarter of 2022. This decrease was primarily a result of lower production and lower electricity and natural gas prices.

Energy operating costs for the year ended December 31, 2022 were $323 million, or $9.76 per Boe, which was an increase of $68 million or 27% from $255 million, or $7.01 per Boe, in the same period of 2021. The increase was predominantly a result of higher prices for purchased natural gas, which CRC uses to generate electricity for its operations and steam for its steamfloods, and for purchased electricity.

Non-energy operating costs for the fourth quarter of 2022 were $116 million, or $13.82 per Boe, which was a decrease of $1 million or 1% from $117 million, or $13.82 per Boe, for the third quarter of 2022. This decrease was primarily a result of lower surface maintenance.

Non-energy operating costs for the year ended December 31, 2022 were $445 million, or 13.47 per Boe, which was an increase of $15 million or 3% from $430 million, or 11.84 per Boe, in the same period of 2021. This increase was primarily a result of increased surface and downhole maintenance activity in 2022.

Sustainability & Carbon Management Update

In December 2022, Carbon TerraVault JV entered into a CDMA with Lone Cypress, an independent energy company focused on the development of low-carbon hydrogen generation facilities and energy infrastructure, to sequester 100,000 MT of CO2 per annum from a newly constructed blue hydrogen plant at the Elk Hills Field in Kern County.

Also in December 2022, CRC received an A- from CDP for its 2022 climate disclosure, securing a score at CDP’s Leadership Level for the fourth year in a row. This accomplishment is further evidence of CRC’s commitment to maintaining a strong ESG and sustainability platform.

In January 2023, CTV entered into a CDMA with Grannus, an independent clean-tech company that is building a portfolio of blue ammonia and hydrogen production facilities to supply the agriculture, mobility and marine fuel markets, to sequester 370,000 MT of CO2 per annum at CTV III from a new blue ammonia and hydrogen plant to be constructed in Northern California. Called the Grannus Blue Ammonia and Hydrogen Project, the project aims to be California’s first blue ammonia and hydrogen facility producing 150,000 MT per annum of blue ammonia and 10,000 MT per annum of blue hydrogen.

In February 2023, CRC assembled a consortium of organizations across industry, technology, academia, national labs, community, government, and labor, to pursue U.S. Department of Energy (DOE) funding under its Regional DAC Hubs Initiative to create the California DAC Hub, the state’s first full-scale DAC plus storage (DAC+S) network of regional DAC+S hubs. DAC+S is a solution that can remove and then permanently store atmospheric CO2 using low carbon emission energy and provide economic benefits to surrounding communities.

The California DAC Hub is expected to accelerate California’s progress to achieve its carbon neutrality goal while prioritizing the surrounding under-represented California communities in several areas including: air quality improvements, increased renewable energy use and enhanced water management including water reclamation and production of new water sources. Further, CRC expects that the hub will provide high quality union jobs while enhancing local area education programs in science, technology and math (STEM) along with energy transition.

Balance Sheet and Liquidity Update

CRC's aggregate commitment under the Revolving Credit Facility was $602 million as of December 31, 2022. The borrowing base for the Revolving Credit Facility is redetermined semi-annually and was reaffirmed at $1.2 billion on October 25, 2022.

As of December 31, 2022, CRC had liquidity of $765 million, which consisted of $307 million in unrestricted cash and $458 million of available borrowing capacity under its Revolving Credit Facility which is net of $144 million of letters of credit.

Acquisitions and Divestitures

On February 1, 2022, CRC sold its 50% non-operated working interest in certain horizons within its Lost Hills field, located in the San Joaquin basin, recognizing a gain of $49 million. CRC retained an option to capture, transport and store 100% of the CO2 from steam generators across the Lost Hills field for future carbon management projects. CRC also retained 100% of the deep rights and related seismic data.

In June 2022, CRC sold its commercial office building located in Bakersfield, California for net proceeds of $13 million, recognizing no gain or loss on sale.

During the year ended December 31, 2022, CRC recognized a gain of $11 million related to the sale of certain Ventura basin assets. The closing of the sale of CRC's remaining assets in the Ventura basin is subject to final approval from the State Lands Commission, which it expects to receive prior to the end of the first quarter of 2023. These remaining assets, consisting of property, plant and equipment and associated asset retirement obligations, are classified as held for sale on CRC's consolidated balance sheet as of December 31, 2022.

Also in 2022, CRC sold non-core assets recognizing a $1 million loss and acquired properties for carbon management activities for ~$17 million.

Shareholder Return Strategy

CRC continues to prioritize shareholder returns and therefore dedicates a significant portion of its free cash flow to shareholders in the form of dividends and share repurchases.


Contacts

Joanna Park (Investor Relations)
818-661-3731
This email address is being protected from spambots. You need JavaScript enabled to view it.

Richard Venn (Media)
818-661-6014
This email address is being protected from spambots. You need JavaScript enabled to view it.


Read full story here

SAN ANTONIO--(BUSINESS WIRE)--NuStar Energy L.P. (NYSE: NS) announced today that members of management will participate in meetings with members of the investment community at the Barclays Select Series: Midstream Corporate Access Day on Monday, February 27, 2023. The materials to be discussed in the meetings will be available on the partnership’s website by 8:30 a.m. Eastern Time, Monday, February 27, 2023.


NuStar Energy L.P., a publicly traded master limited partnership based in San Antonio, Texas, is one of the largest independent liquids terminal and pipeline operators in the nation. NuStar currently has approximately 9,500 miles of pipeline and 63 terminal and storage facilities that store and distribute crude oil, refined products, renewable fuels, ammonia and specialty liquids. The partnership’s combined system has approximately 49 million barrels of storage capacity, and NuStar has operations in the United States and Mexico. For more information, visit NuStar Energy L.P.’s website at www.nustarenergy.com and its Sustainability page at https://sustainability.nustarenergy.com/.


Contacts

Investors, Pam Schmidt, Vice President, Investor Relations
Investor Relations: 210-918-INVR (4687)
or
Media, Mary Rose Brown, Executive Vice President and Chief Administrative Officer,
Corporate Communications: 210-918-2314

Francisco J. Leon to Succeed Mark A. McFarland as President and Chief Executive Officer

McFarland to Continue as a Non-Executive Director and Chair the Board of Carbon TerraVault, CRC’s Carbon Management Business, to Oversee its Continued Growth

LONG BEACH, Calif.--(BUSINESS WIRE)--California Resources Corporation (NYSE: CRC) (“CRC” or the “Company”) announced today a strategic realignment of the Company’s business operations and structure. The Company intends to reduce costs to align with activity levels, increase its financial flexibility and optimize its portfolio of assets. The Company believes that the combination of these actions will allow it to continue to strengthen shareholder returns. The Company is also repositioning the business to capitalize on future opportunities with Carbon TerraVault. In conjunction with this strategic realignment, the Company also announced that Francisco Leon, currently Chief Financial Officer, will succeed Mark A. (“Mac”) McFarland as President and Chief Executive Officer and join the Company’s Board of Directors, effective at the Company’s 2023 Annual Meeting in April.


“As demonstrated by our 2022 year-end financial results, CRC has a very resilient and valuable portfolio of assets,” Mr. Leon said. “While the Company’s financial performance has been strong, our market has evolved and therefore we are adjusting accordingly by optimizing our capital plan and increasing our focus on reducing costs. We believe our revised plan will enhance shareholder returns while positioning the Company for continued success into the future.”

The revised plan realigns CRC’s operating strategy while adjusting the Company’s corporate and management structure as set forth below:

  • Revised Corporate Structure - CRC will adjust its corporate operating structure to facilitate the separate operations of its E&P and carbon management businesses. This change will allow investors and other CRC stakeholders to garner a better awareness and understanding of the Company’s discrete businesses as CRC’s leadership continues efforts to maximize shareholder value across the portfolio of assets.
  • Accelerate Carbon Management Business - CRC will manage its carbon management business on a standalone basis over time, providing the flexibility to consider strategic options including a potential separation from the E&P business. This is a natural evolution given the great strides made in 2022, including the formation of Carbon TerraVault’s joint venture with Brookfield Renewable. The joint venture was formed to create a partnership focused on carbon capture and sequestration development, along with carbon management service agreements with parties such as Lone Cypress Energy and Grannus, LLC, to provide permanent carbon storage. In 2023, CRC is focused on signing up additional emitter projects, advancing CalCapture and the California Direct Air Capture Hub, and submitting additional Class VI permit applications. CRC has also established a separate board for the Carbon TerraVault subsidiary to focus on growing and developing the carbon management business.
  • Leadership Changes - With the revised corporate structure, Mr. Leon will assume the CEO position, effective at the Company’s Annual Meeting. As CFO, Mr. Leon has been instrumental in the creation of the Company’s carbon management business. He also has a deep knowledge and understanding of CRC’s extensive E&P business. As such, Mr. Leon is extremely well positioned to lead CRC in the years ahead. In May, Mr. McFarland will transition to his former role as a non-executive director and will also serve as non-executive Chair of the newly formed Board of the Carbon TerraVault subsidiary. Two existing CRC non-executive directors, Andrew Bremner and James Chapman, will also serve on that subsidiary board. The Company has an ongoing search for a new CFO.
  • Future E&P Development Activity - The Company will reduce its rig count to 1.5 in 2023 with a drilling program focused on developing the highest-returning projects with permits-in-hand in conjunction with a continued focus on well servicing and downhole maintenance to reduce the base production decline to approximately 5 to 7 percent. At the planned rig pace, CRC can enhance the operational and capital efficiency of its rig program and maximize the Company’s ability to return capital to shareholders. On a go-forward basis utilizing a 1.5 rig program, CRC expects to spend ~$155 million in E&P drilling and completions and workover capital. This level of spending excludes one-time items and CMB capital which is anticipated to be funded by projected CTV JV contributions over time.
  • Focus on Cost Reductions and Value Enhancing Portfolio Optimizations – CRC’s leadership team, working closely with the Special Finance Committee of the Board, is focused on cost reduction initiatives across the Company that align with the projected level of activity and revised strategic direction. CRC is targeting a 5% - 10% reduction in non- energy operating costs (excluding downhole maintenance) and Adj. E&P Corp & Other G&A1 on a combined basis by year end. These cost reduction initiatives in conjunction with increased downhole maintenance target maintaining margins and driving higher cash flows. CRC’s leadership team and Board have successfully implemented similar strategies and believe the Company is well positioned to identify and achieve cost reductions while maintaining the high operational standards that CRC has achieved. In addition, CRC will continue to pursue the monetization of its Huntington Beach surface acreage as well as other real estate surface ownership in its portfolio.
  • Enhance the Company’s Financial Flexibility - CRC is intending to amend and extend or replace its existing reserve-based lending credit facility, as well as refinance its $600 million senior unsecured notes. This is expected to allow the Company to lengthen its debt maturities and provide financial flexibility to increase the Company’s ongoing shareholder return program. Further, this flexibility is expected to support the potential separation of the carbon management business. Finally, operating Carbon TerraVault on a standalone basis will broaden capital sourcing options for the carbon management business.
  • Boost Shareholder Return Program - CRC intends to optimize capital allocation and focus on cost reduction opportunities in 2023 to drive cash flow generation that it believes will allow it to increase shareholder returns. To that end, CRC’s Board has authorized a nearly 30% increase to its shareholder repurchase program for a total of $1.1 billion, with ~$640 million remaining on its authorization as of December 31, 2022, and after taking account the increase. In 2023, CRC is positioning to return approximately 100% of free cash flow through buybacks and dividends.
  • CRC’s strategy is repeatable with a focus on maximizing cash flow per share - So long as the current conditions persist, the Company expects to repeat its strategy. This means continuously focusing its activity on locations where the Company has permits in hand, re-aligning costs with activity levels and maintaining its financial flexibility. CRC believes that the repeatable nature of the strategy will allow the Company to continue prioritizing returning cash to shareholders through share repurchases and dividends.

“I am honored to assume the CEO role,” Mr. Leon said. “Over the last few years, the Company has significantly improved its financial profile and optimized its operating portfolio, providing a strong foundation for growth and value creation. Now, as we face new opportunities and challenges, I look forward to working with Mac and the rest of the Board and management team to execute on our new strategic direction to drive cash flow generation, advance and accelerate our carbon management business, and increase our financial flexibility to return more capital to shareholders. I am confident that if we continue to elect to run a lower capital plan (~$155 million of drilling and completion capital) we can make the appropriate reductions to our cost structure that we expect will help ensure we deliver improving operating and financial metrics on a per share basis.”

“I am extremely proud of all that our talented team has accomplished over the past two years, successfully transforming the Company into a lean and efficient operator with robust cash flows,” Mr. McFarland said. “We achieved these results while launching an exciting new business in carbon management.” He continued, “Francisco has been a fabulous partner, with extensive knowledge of CRC’s E&P business while being instrumental in the creation of our carbon business. As such, he is uniquely positioned to lead the Company in its next phase of strategic development.”

“While Mac is stepping down from a day-to-day role at CRC, I look forward to working closely with him as a CRC board member and in his role as Chair of the Board of Carbon TerraVault to accelerate CRC’s carbon management business and help California achieve its ambitious energy transition goals,” said TJ Thom Cepak, Chair of the Company’s Board of Directors.

In a separate release today, the Company disclosed its fourth quarter and full year 2022 financial results. The Company will host a conference call with investors and analysts today at 10:00 a.m. PT / 1:00 p.m. ET to review its financial results.

(1)


Represents a non-GAAP measure. For all historical non-GAAP financial measures for CRC please see the Investor Relations page at www.crc.com for a reconciliation to the nearest GAAP equivalent and other additional information. See slide 35 of CRC’s 4Q22 earnings presentation for reconciliation.

About Francisco J. Leon

Francisco Leon has served as EVP and CFO of California Resources Corporation since 2020. From 2014 to 2020, he was VP of Business Development, Portfolio Management and Strategic Planning at CRC. He also served as Director of Global Acquisitions and California Resource Assessment / Evaluation at Occidental Petroleum. He began his career at Petrie Parkman in 2001. Mr. Leon holds a bi-national Bachelor of Arts degree in International Business from San Diego State University and CETYS Universidad in Mexico and an Masters of Business Administration from the University of Texas McCombs School of Business.

About Mark A. (Mac) McFarland

Mr. McFarland has served as President and Chief Executive Officer of California Resources Corporation since March 2021 and has served on its Board of Directors since October 2020. Beginning in October 2020, he served as Chairman and then Executive Chair of the Board and interim Chief Executive Officer prior to his appointment as President and Chief Executive Officer in March 2021. He previously served as Executive Chairman of GenOn Energy, Inc., an independent power producer, and currently serves as a Director on the Company’s Board. Prior to that, he was the President and Chief Executive Officer of GenOn and served on its Board of Managers. Mr. McFarland served in a succession of management roles, including Chief Executive Officer, Chief Commercial Officer and Executive Vice President, Corporate Development and Strategy of Energy Future Holdings, at Luminant Holding Company, a subsidiary of Energy Future Holdings Corporation, and a large independent power producer. Earlier in his career, Mr. McFarland served in various roles at Exelon Corporation, including as Senior Vice President, Corporate Development. Mr. McFarland earned his Masters of Business Administration from the University of Delaware and a Bachelor of Science degree in Civil Engineering (Environmental Concentration) from Virginia Polytechnic Institute and State University.

About California Resources Corporation (CRC)

California Resources Corporation (CRC) is an independent oil and natural gas company committed to energy transition in the sector. CRC has some of the lowest carbon intensity production in the US and CRC is focused on maximizing the value of its land, mineral and technical resources for decarbonization by developing CCS and other emissions reducing projects. For more information about CRC, please visit www.crc.com.

About Carbon TerraVault (CTV)

Carbon TerraVault Holdings, LLC (CTV), a subsidiary of CRC, will provide services that include the capture, transport and storage of carbon dioxide for its customers. CTV is engaged in developing a series of CCS projects that inject carbon dioxide (CO2) captured from industrial sources into depleted underground reservoirs and permanently store CO2 deep underground. For more information about CTV, please visit www.carbonterravault.com.

Forward-Looking Statements

Certain of the statements contained in this document should be considered forward-looking statements. These forward-looking statements may be identified by words such as “may,” “will,” “expect,” “intend,” “anticipate,” “believe,” “estimate,” “plan,” “project,” “could,” “should,” “would,” “continue,” “seek,” “target,” “guidance,” “outlook,” “forecast” and other similar words. Such statements include, but are not limited to, statements about the actions the Company may take to realign its strategy, the Company’s ability to reduce permitting uncertainty, the implications of the Company’s leadership changes, the Company’s ability to amend its debt agreements and strengthen its financial flexibility, the growth of the Company’s carbon management business, the Company’s shareholder return program, the Company’s plans, objectives, expectations, intentions, estimates and strategies for the future, and other statements that are not historical facts. These forward-looking statements are based on the Company’s current objectives, beliefs and expectations, and they are subject to significant risks and uncertainties that may cause actual results and financial position and timing of certain events to differ materially from the information in the forward-looking statements. These risks and uncertainties include, but are not limited to, legislative or regulatory changes; availability or timing of, or conditions imposed on, permits and approvals; changes in business strategy and the Company’s capital plan; the Company’s ability to realize the benefits contemplated by the business strategies and initiatives related to energy transaction, including carbon capture and storage projects and other renewable energy efforts; the Company’s ability to successfully identify, develop and finance carbon capture and storage projects and other renewable energy efforts, including those in connection with the Carbon TerraVault JV; changes in the Company’s share repurchase program and its ability to repurchase shares under its debt agreements; insufficient cash flow to fund the Company’s capital plan and other planned investments, stock repurchases and dividends; and the other risks and uncertainties set forth in the Company’s Annual Report on Form 10-K for the year ended December 31, 2022 (especially in Part I, Item 1A. Risk Factors and Part II, Item 7. Management’s Discussion and Analysis of Financial Condition and Results of Operations) and in the Company’s other filings with the SEC. There may be other factors of which the Company is not currently aware that may affect matters discussed in the forward-looking statements and may also cause actual results to differ materially from those discussed. The Company does not assume any obligation to publicly update or supplement any forward-looking statement to reflect actual results, changes in assumptions or changes in other factors affecting these forward-looking statements other than as required by law. Any forward-looking statements speak only as of the date hereof or as of the dates indicated in the statement.


Contacts

Joanna Park
Investor Relations
818-661-3731
This email address is being protected from spambots. You need JavaScript enabled to view it.

Richard Venn
Media
818-661-6014
This email address is being protected from spambots. You need JavaScript enabled to view it.

SCHAUMBURG, Ill.--(BUSINESS WIRE)--#SEKOLogistics--SEKO Logistics (SEKO), a leading global logistics provider, has announced its appointment of Alfred Hofmann as Senior Vice President, Global Ocean Freight. In this role, Hofmann will lead SEKO’s global ocean freight team in advancing and executing division and overall company strategies. Under his leadership, he will provide guidance on business goals and implementation plans, help maintain relationships with SEKO’s network of global ocean carriers and have profit and loss (P&L) operating authority.


An esteemed veteran of the logistics industry, Hofmann joins SEKO after a 36-year-long tenure at Kuehne+Nagel, a global freight and logistics company based in Switzerland, where he served in many leadership roles. Among other positions, Hofmann served as executive vice president of Ocean Freight APAC and president of South Asia Pacific. In those roles, he led the expansion of all business units in the region. Most recently, he served as an executive advisor and consultant to Kuehne+Nagel and was actively involved in carrier relationships. In 2015, attesting to his expertise in the region, Hofmann received well-earned recognition when he was inducted into the Supply Chain Asia Awards Hall of Fame.

“I am beyond thrilled that Alfred is joining the SEKO team in this role,” said Steen Christensen, chief operating officer, International at SEKO. “He is a highly recognized leader in global logistics and is known by many for his expansive expertise in ocean freight. Alfred’s deep understanding of the APAC region, in particular, brings a valuable benefit to our customers and partners as we continue to strengthen our ocean freight forwarding offerings and capabilities.”

SEKO’s ocean logistics, global sea freight and shipping network encompasses more than 40 countries worldwide, including all of the world’s major seaports. A Non-Vessel Operating Common Carrier (NVOCC), SEKO is not locked into strict sailing schedules providing the flexibility to schedule ocean freight on a variety of steamship lines to work within any schedule and budget. Strong working relationships with the largest ocean carriers in the world enables SEKO to offer flexible routing and multiple ocean transportation options for both part container (LCL) and full container (FCL) movements. SEKO also boasts sophisticated tracking and tracing capability thanks to MySEKO, an exclusive online customer portal and software for freight rate management. MySEKO allows customers to track ocean and sea freight from origin to destination, providing access to view and upload all necessary documentation, and to receive status updates via email and configurable reports.

“SEKO has become a trailblazer not only in the logistics industry, but particularly in ocean freight forwarding, and I have been long impressed with their growth and constant dedication to their customers. I am very excited to join the team and get started advancing their Ocean Freight strategies,” said Hofmann.

Hofmann is based in SEKO’s APAC regional headquarters in Hong Kong and reports to Christensen, as well as James Gagne, CEO of SEKO.

To learn more about SEKO Logistics, visit: www.sekologistics.com.

About SEKO Logistics

Built on nearly 50 years of logistics expertise, SEKO Logistics is the no-nonsense global end-to-end logistics partner – from shipper to consumer. SEKO delivers client-first service, expert reliability and tech-driven shipping solutions that turn customers’ supply chains into a competitive advantage. With over 150 offices in more than 60 countries, SEKO helps you move at the speed of global commerce. Learn more at www.sekologistics.com.


Contacts

Kellie Clock
This email address is being protected from spambots. You need JavaScript enabled to view it.
231-571-0718

Offshore Source Logo

Offshore Source keeps you updated with relevant information concerning the Offshore Energy Sector.

Any views or opinions represented on this website belong solely to the author and do not represent those of the people, institutions or organizations that Offshore Source or collaborators may or may not have been associated with in a professional or personal capacity, unless explicitly stated.

Corporate Offices

Technology Systems Corporation
8502 SW Kansas Ave
Stuart, FL 34997

info@tscpublishing.com