Business Wire News

FRAMINGHAM, Mass.--(BUSINESS WIRE)--#carbonreduction--Ameresco, Inc. (NYSE:AMRC), a leading clean technology integrator specializing in energy efficiency and renewable energy, today announced that it will release its fourth quarter and full year 2022 financial results after the close of the market on Monday, February 27, 2023. The earnings press release will be available on the “Investor Relations” section of the Company’s website at www.ameresco.com. The Company will host an earnings conference call at 4:30 p.m. ET the same day.


In conjunction with its earnings conference call and press release, the Company will provide supplemental information concerning the financial results. The supplemental information on a Current Report on Form 8-K will be posted to the “Investor Relations” section of the Company's website.

Participants may access the earnings conference call by pre-registering here at least fifteen minutes in advance. A live, listen-only webcast of the conference call will also be available over the Internet. Individuals wishing to listen can access the call through the “Investor Relations” section of the Company’s website at www.ameresco.com. If you are unable to listen to the live call, an archived webcast will be available on the Company’s website for one year.

About Ameresco, Inc.

Founded in 2000, Ameresco, Inc. (NYSE:AMRC) is a leading independent clean technology integrator of comprehensive services, energy efficiency, infrastructure upgrades, asset sustainability and renewable energy solutions for businesses and organizations throughout North America and Europe. Ameresco’s sustainability services include upgrades to a facility’s energy infrastructure and the development, construction and operation of renewable energy plants. Ameresco has successfully completed energy saving, environmentally responsible projects with Federal, state and local governments, healthcare and educational institutions, housing authorities, and commercial and industrial customers. With its corporate headquarters in Framingham, MA, Ameresco has more than 1,000 employees providing local expertise in the United States, Canada, and Europe. For more information, visit www.ameresco.com.


Contacts

Media Relations
Leila Dillon, 508.661.2264, This email address is being protected from spambots. You need JavaScript enabled to view it.

Investor Relations
Eric Prouty, Advisiry Partners, 212.750.5800, This email address is being protected from spambots. You need JavaScript enabled to view it.
Lynn Morgen, Advisiry Partners, 212.750.5800, This email address is being protected from spambots. You need JavaScript enabled to view it.

FORT WORTH, Texas--(BUSINESS WIRE)--MorningStar Partners, L.P., which will be renamed “TXO Energy Partners, L.P.” (“TXO”), announced today the pricing of its initial public offering of 5,000,000 common units representing limited partner interests in TXO (the “common units”) at price to the public of $20.00 per common unit. TXO has granted the underwriters an option to purchase up to an additional 750,000 common units at the initial public offering price, less underwriting discounts and commissions. TXO’s common units are expected to begin trading on the New York Stock Exchange under the ticker symbol “TXO.” The offering is expected to close on January 31, 2023, subject to customary closing conditions.


TXO expects to receive net proceeds of approximately $88.0 million, after deducting underwriting discounts and commissions and excluding any exercise of the underwriters’ option to purchase additional common units. TXO intends to use the net proceeds to repay a portion of the amounts outstanding under its revolving credit facility.

Upon the closing of the offering, the public will own an approximate 17% limited partner interest in TXO, or an approximate 83% limited partner interest if the underwriters exercise, in full, their option to purchase additional common units.

Raymond James, Stifel, Janney Montgomery Scott and Capital One Securities are acting as joint book-running managers for the offering. The offering of these securities is being made only by means of a prospectus meeting the requirements of Section 10 of the Securities Act of 1933, as amended. When available, a copy of the final prospectus may be obtained from any of the following sources:

Raymond James & Associates, Inc.

Attention: Syndicate

880 Carillon Parkway

St. Petersburg, Florida 33716

Telephone: (800) 248-8863

Email: This email address is being protected from spambots. You need JavaScript enabled to view it.

Stifel, Nicolaus & Company, Incorporated

Attention: Syndicate Department

One South Street, 15th Floor

Baltimore, MD 21202

Telephone: (443) 224-1988

Email: This email address is being protected from spambots. You need JavaScript enabled to view it.


Janney Montgomery Scott LLC

Attention: Equity Capital Markets Group

60 State Street

Boston, MA 02109

Telephone: 617-557-2971

Email: This email address is being protected from spambots. You need JavaScript enabled to view it.


Capital One Securities, Inc.

Attention: ECM Syndicate Operations

201 St. Charles Avenue, Suite 1830

New Orleans, LA 70170

Telephone: 800-666-9174

Email: This email address is being protected from spambots. You need JavaScript enabled to view it.

Important Information

A registration statement relating to these securities has been filed with, and declared effective by, the Securities and Exchange Commission (the “SEC”) on January 26, 2023. This press release does not constitute an offer to sell or the solicitation of an offer to buy securities, and shall not constitute an offer, solicitation or sale in any jurisdiction in which such offer, solicitation or sale would be unlawful prior to registration or qualification under the securities laws of that jurisdiction.

About TXO Energy Partners, L.P.

TXO Energy Partners, L.P. is a master limited partnership focused on the acquisition, development, optimization and exploitation of conventional oil, natural gas, and natural gas liquid reserves in North America. TXO’s current acreage positions are concentrated in the Permian Basin of West Texas and New Mexico and the San Juan Basin of New Mexico and Colorado.

Cautionary Statement Concerning Forward-Looking Statements

Certain statements contained in this press release constitute “forward-looking statements” within the meaning of the Private Securities Litigation Reform Act of 1995. These forward-looking statements include the words such as “possible,” “if,” “will” and “expect” and contain statements regarding the size, timing or results of the initial public offering. These forward-looking statements represent TXO’s expectations or beliefs concerning future events, and it is possible that the results described in this press release will not be achieved, and they are subject to risks, uncertainties and other factors, many of which are outside of TXO’s control, that could cause actual results to differ materially from the results discussed in the forward-looking statements.

Any forward-looking statement speaks only as of the date on which it is made, and, except as required by law, TXO does not undertake any obligation to update or revise any forward-looking statement, whether as a result of new information, future events or otherwise. New factors emerge from time to time, and it is not possible for TXO to predict all such factors. When considering these forward-looking statements, you should keep in mind the risk factors and other cautionary statements in the prospectus filed with the SEC in connection with TXO’s initial public offering. The risk factors and other factors noted in TXO’s prospectus could cause its actual results to differ materially from those contained in any forward-looking statement. You are cautioned not to place undue reliance on these forward-looking statements.


Contacts

TXO Energy Partners, L.P.
Investor Relations Contact: This email address is being protected from spambots. You need JavaScript enabled to view it.

Companies Improve on Renewable Energy But Need Major Improvement on Equity and Impacts on Underserved Communities.

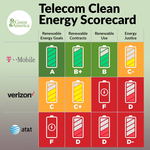
WASHINGTON--(BUSINESS WIRE)--The three major U.S. telecommunications companies are significantly underperforming when it comes to energy justice, according to a new report by Green America. AT&T, Verizon, and T-Mobile each received C or D grades in the organization’s latest report, which investigates energy use in the sector and assesses the companies’ energy procurement on key principles of energy and environmental justice.


Calling for a Just, Clean Transition, part two, found that while telecom companies have made several of the largest corporate clean energy purchases ever since Green America launched its Hang Up on Fossil Fuels Campaign in 2018, the industry still has a long way to go to reach 100% renewable energy. And all of the companies must do more to ensure that their energy purchases support energy justice. It is not enough to simply purchase renewable energy. Companies also need to ensure that energy purchases support energy justice by benefiting communities most harmed by fossil fuels and incorporating these communities and workers into the process of siting and construction decisions.

The report includes a scorecard grading each company on renewable energy goals, renewable contracts, renewable use, and energy justice.

An overview version of the report is also available.

Dan Howells, climate campaigns director at Green America, said: It is encouraging that the big telecoms are making progress in adopting renewable energy to protect the planet. Yet, T-Mobile, Verizon and AT&T all could be doing more to put new wind and solar power on the grid. And all three companies need to use their market power to advance energy justice and protect communities as well.”

The report finds that companies can improve their energy justice scores by contracting for energy from companies that make improvements around the following RFP criteria: Decision-making power, Sourcing and Siting, Energy Burdens, Economic Opportunities (entrepreneurship), and Economic Opportunities (inclusive workplaces).

Elizabeth Silleck La Rue, report author and CEO of Silleck Consulting Services, LLC, said: “Systemic inequities won't reverse themselves; it will take genuine, intentional, and sustained effort to create a renewable energy industry that fairly distributes decision-making power, benefits and burdens. Where the fast-growing and increasingly critical telecommunications and renewable energy industries intersect, there's an opportunity to level the notoriously imbalanced power dynamics that plague the energy sector. Let's take it."

Fossil fuel extraction, combustion, and waste disproportionately harm communities of color, leading to significant environment and health impacts. In the transition to renewables, it is also essential to ensure that jobs in wind and solar benefit impacted and underserved communities. Currently, women of all races, and Black, Latino, and Indigenous peoples are underrepresented in the clean energy workforce. When solar and wind facilities are built in or near vulnerable communities, those communities must have key roles in the process and obtain benefits from the installations.

Part one of the report was released in 2022 and outlined the steps companies need to take to improve on energy justice. The report can be found at https://reports.greenamerica.org/energy-justice.

ABOUT GREEN AMERICA

Green America is the nation’s leading green economy organization. Founded in 1982, Green America provides the economic strategies, organizing power and practical tools for businesses, investors, and consumers to solve today’s social and environmental problems. http://www.GreenAmerica.org


Contacts

Max Karlin for Green America, (703) 276-3255, or This email address is being protected from spambots. You need JavaScript enabled to view it.

NEW YORK--(BUSINESS WIRE)--Golar LNG Partners LP, an indirect subsidiary of New Fortress Energy Inc. (NASDAQ: NFE), has declared a cash distribution of $0.546875 per unit of 8.75% Series A Cumulative Redeemable Preferred Units for the period from November 15, 2022 through February 14, 2023. This will be payable on February 15, 2023 to all Series A preferred unitholders of record as of February 7, 2023.


About New Fortress Energy Inc.

New Fortress Energy Inc. (NASDAQ: NFE) is a global energy infrastructure company founded to address energy poverty and accelerate the world’s transition to reliable, affordable, and clean energy. The company owns and operates natural gas and liquefied natural gas (LNG) infrastructure and an integrated fleet of ships and logistics assets to rapidly deliver turnkey energy solutions to global markets. Collectively, the company’s assets and operations reinforce global energy security, enable economic growth, enhance environmental stewardship and transform local industries and communities around the world.


Contacts

Investors
Patrick Hughes
This email address is being protected from spambots. You need JavaScript enabled to view it.

Media
Jake Suski
+1 (516) 268-7403
This email address is being protected from spambots. You need JavaScript enabled to view it.

Significant New Investments and Innovative Opportunities Envisioned for State


NEW YORK--(BUSINESS WIRE)--Equinor and bp today jointly bid into New York’s third offshore wind solicitation (NY3), building on their strong commitment to deliver renewable energy for New Yorkers, create sustainable jobs, boost the economy across the state, and support a just transition to renewable energy.

Equinor and bp’s bid, submitted to the New York State Energy Research and Development Authority (NYSERDA) in response to the state’s most recent offshore wind energy solicitation, would provide New York with renewable energy from the Beacon Wind 2 lease area located approximately 60 miles off the eastern tip of Long Island.

Capable of producing 1,360 megawatts of offshore wind energy, Beacon Wind 2 has the potential to power approximately one million New York homes, generate more than $11 billion in new economic activity in the state over the project lifecycle, and create thousands of jobs. Power from Beacon Wind 2 would complement the 3.3 GWs of potential offshore wind generating capacity for New York State currently under development by Equinor and bp with the Empire Wind 1 and 2 and Beacon Wind 1 projects. As one of the most mature projects offered for NY3, Beacon Wind 2 is well on track to help New York realize its ambition to generate at least 70% of the state’s electricity from renewable energy sources by 2030.

Beacon Wind recently purchased the site of the Astoria Gas Turbines, with the potential to bring offshore wind from Beacon Wind 1 and Beacon Wind 2 directly to New York City, transforming the site into The Astoria Gateway for Renewable Energy, giving Queens a leading role in the state’s energy transition.

Equinor and bp’s proposal includes new manufacturing plants capable of creating game-changing renewable energy career opportunities in the Capital Region, establishing a new vision for the creation of a manufacturing hub in the Region. The proposal includes a facility to produce cable components for offshore wind projects both locally and around the world. Additionally, working with offshore wind turbine manufacturers, Equinor and bp propose to support the establishment of state-of-the-art facilities to manufacture wind turbine components, such as blades and nacelles, in New York State. These significant new manufacturing and supply chain initiatives build on the companies’ current investments in New York’s supply chain, solidifying the state’s leadership position in developing a homegrown offshore wind industry.

“Equinor and bp are eager to build on the significant experience gained through our work in New York over the past five years to bring more offshore wind energy to the state,” said Molly Morris, President, Equinor Wind US. “The commitments and opportunities that we have outlined in this bid are informed by our team’s ongoing efforts to develop offshore wind for the state. Our deep understanding of the workers, communities and economic opportunities related to this new industry allows us to invest in New York where it matters most. There is a tremendous opportunity here to harness the project maturity, efficiencies, and knowledge related to our current work, and we welcome the chance to deepen our work with New York to bring these exciting new initiatives to bear and help the state reach the next level of its renewable energy goals.”

bp senior vice president offshore wind Matthias Bausenwein said: “This bid is another example of bp and Equinor in action to produce cleaner energy and help states meet their offshore wind goals. We’re already progressing 3.3 GWs of planned offshore wind projects for New Yorkers. Our Beacon Wind 2 bid would allow us to produce even more renewable energy for the state while further investing in its economy, workforce and manufacturing sector.

bp and Equinor have the skills, resources and experience to deliver on this vision. Together with the state, we can produce the energy New Yorkers need in the way they want it.”

The bid incorporates substantial support for New York’s goal of ensuring that offshore wind benefits all New Yorkers. Equinor and bp’s proposal includes investing $50 million in pioneering a regional collaborative of community organizations, NGOs, community and state colleges and training facilities to help workers gain the skills and support needed, to participate in, and benefit from, New York’s growing offshore wind industry. Funds would be dedicated to providing awareness, mentorship and coaching, and accessibility and job opportunities in historically marginalized communities - including industry workforce training programs, minority/women-owned business enterprise (MWBE) capacity building programs, and programs at educational institutions statewide.

The companies’ proposal further deepens their commitment to boosting New York’s port infrastructure and sustaining hundreds of long-term jobs and substantial economic activity. In addition, it includes options to accelerate New York’s renewable energy transition with energy storage to help curtail emissions, support grid resilience, as well as the potential for bp pulse, bp's global electrification business, to install up to 1,000 ultra-fast electric vehicle (EV) charge points in New York State by 2030.

If accepted, the proposal would bring Equinor and bp’s total community benefit and environmental monitoring commitments in New York to over $150 million, which includes approximately $90 million in investments in community benefits, workforce development and environmental initiatives already underway as part of the Empire 1 and 2, and Beacon 1 projects.

Equinor Renewables US

Equinor is one of the largest offshore wind developers in the world. Its work in the United States includes the development of two lease areas off of New York, Empire Wind and Beacon Wind. The projects plan to provide New York State with 3.3 gigawatts (GWs) of energy—enough to power nearly two million homes—including more than 2 GWs from Empire Wind and 1,230 megawatts from Beacon Wind 1. www.equinor.com/NY

bp in the US

bp’s ambition is to become a net zero company by 2050 or sooner, and to help the world get to net zero. bp has a larger economic footprint in the United States than anywhere else in the world, investing more than $130 billion in the economy and supporting about 245,000 jobs. For more information on bp in the US, visit www.bp.com/us.

About Beacon Wind

Beacon Wind is being developed by Equinor and bp and planned for an area of 128,000 acres in federal waters between Cape Cod and Long Island. The lease area was acquired in 2019 and is being developed in two phases. Beacon Wind 1 is on track to deliver over 1.2 GW of renewable energy directly to New York City in the late 2020s – enough to power around 1 million homes. Beacon Wind 2 has the capacity to generate at least another 1.2 GW of clean energy for consumers in the US Northeast. www.beaconwind.com

About Empire Wind

Empire Wind is being developed by Equinor and bp through their 50-50 strategic partnership in the US. Empire Wind will power more than 1 million homes and generate 2.1 GW of power. For more information, please visit www.empirewind.com.


Contacts

Media Contact:
Lauren Shane, senior communications manager, Equinor Renewables US
This email address is being protected from spambots. You need JavaScript enabled to view it.
+1-917-392-4252

Brian Young, Senior Consultant Communications, Equinor US
+1-917-915-6461
This email address is being protected from spambots. You need JavaScript enabled to view it.

DUBLIN--(BUSINESS WIRE)--The "Biofuels (Bioethanol and Biodiesel): Global Strategic Business Report" report has been added to ResearchAndMarkets.com's offering.


The global market for Biofuels (Bioethanol and Biodiesel) estimated at US$173.7 Billion in the year 2020, is projected to reach a revised size of US$225.1 Billion by 2027, growing at a CAGR of 3.8% over the analysis period 2020-2027.

Bioethanol, one of the segments analyzed in the report, is projected to record 4% CAGR and reach US$165.2 Billion by the end of the analysis period. After an early analysis of the business implications of the pandemic and its induced economic crisis, growth in the Biodiesel segment is readjusted to a revised 3.2% CAGR for the next 7-year period.

The U.S. Market is Estimated at $50.8 Billion, While China is Forecast to Grow at 3.6% CAGR

The Biofuels (Bioethanol and Biodiesel) market in the U.S. is estimated at US$50.8 Billion in the year 2020. China, the world's second largest economy, is forecast to reach a projected market size of US$40.2 Billion by the year 2027 trailing a CAGR of 3.6% over the analysis period 2020 to 2027.

Among the other noteworthy geographic markets are Japan and Canada, each forecast to grow at 3.5% and 3.2% respectively over the 2020-2027 period. Within Europe, Germany is forecast to grow at approximately 3.8% CAGR.

Select Competitors (Total 122 Featured) -

  • Aemetis, Inc.
  • BlueFire Renewables, Inc.
  • Copersucar S.A.
  • Green Plains, Inc.
  • Renewable Energy Group, Inc.
  • Royal DSM NV
  • Western Dubuque Biodiesel, LLC

What`s New for 2022?

  • Global competitiveness and key competitor percentage market shares
  • Market presence across multiple geographies - Strong/Active/Niche/Trivial
  • Online interactive peer-to-peer collaborative bespoke updates
  • Access to digital archives and Research Platform
  • Complimentary updates for one year

Key Topics Covered:

I. METHODOLOGY

II. EXECUTIVE SUMMARY

1. MARKET OVERVIEW

  • Influencer Market Insights
  • World Market Trajectories
  • Impact of Covid-19 and a Looming Global Recession
  • Biofuels (Bioethanol and Biodiesel) - Global Key Competitors Percentage Market Share in 2022 (E)
  • Competitive Market Presence - Strong/Active/Niche/Trivial for Players Worldwide in 2022 (E)

2. FOCUS ON SELECT PLAYERS

3. MARKET TRENDS & DRIVERS

4. GLOBAL MARKET PERSPECTIVE

III. MARKET ANALYSIS

IV. COMPETITION

For more information about this report visit https://www.researchandmarkets.com/r/29wskh


Contacts

ResearchAndMarkets.com
Laura Wood, Senior Press Manager
This email address is being protected from spambots. You need JavaScript enabled to view it.

For E.S.T Office Hours Call 1-917-300-0470
For U.S./ CAN Toll Free Call 1-800-526-8630
For GMT Office Hours Call +353-1-416-8900

Developers of South Fork Wind and Sunrise Wind Submit Joint Proposal in New York’s Third Competitive Offshore Wind Solicitation

NEW YORK--(BUSINESS WIRE)--Ørsted and Eversource today announced they have submitted a joint proposal in response to New York State’s third round of offshore wind solicitations. Delivering clean, renewable power for at least 1 million New York homes, this submission includes multiple bids with different configurations that will generate billions of dollars in economic activity in the state economy, create thousands of new jobs, advance environmental justice, prioritize disadvantaged communities and minority- and women-owned business enterprises (MWBEs), and integrate clean energy solutions to further support the achievement of New York’s climate goals.


Together, Ørsted and Eversource are building South Fork Wind, New York’s first offshore wind farm, which broke ground early last year and will be operational with 130 MW in 2023, and Sunrise Wind, a 924 MW project that will deliver clean energy to New York in late 2025. As the New York leader in offshore wind, the joint venture has developed extensive partnerships across the state and consulted with dozens of community organizers, labor leaders, and local elected officials to develop a bid for a new project that best meets the needs of New Yorkers.

Under Governor Hochul’s leadership, New York will build upon its nation-leading pipeline of contracted offshore wind projects. Already, the state has become a leader in developing an offshore wind supply chain, begun training the future offshore wind workforce, and committed $500 million in investments for offshore wind ports, manufacturing and supply chain infrastructure to support this growing industry. In July of 2022, Governor Hochul announced New York’s third competitive offshore wind solicitation for a minimum of 2,000 MW of offshore wind, which will power at least 1.5 million additional New York homes with clean, affordable energy. This third solicitation marks additional progress toward achieving New York State’s Climate Act mandate to secure 70 percent of the State’s electricity from renewable energy by 2030 and at least 9,000 megawatts of offshore wind by 2035.

The joint venture between Ørsted, the leading U.S. offshore wind energy partner, and Eversource, New England’s largest energy provider and experts in regional energy transmission, was established in 2016 and together the two companies have invested in building the American offshore wind supply chain and next generation of the nation’s energy workforce. Through its industry-leading National Offshore Wind Agreement, the developers were the first in the U.S. to commit that its offshore construction would be completed by an American union workforce, emphasizing the developers’ commitment to good-paying jobs, workforce training and safety.

“We’re committed to developing projects that will create good-paying jobs, build up local communities, and generate clean, affordable energy to fight climate change,” said David Hardy, Group EVP and CEO Americas at Ørsted. “We’re confident this new proposal offers statewide, comprehensive offshore wind solutions and integrated clean energy innovation for New York, a state where we already have two advanced projects and have invested in supply chain development, workforce training and O&M capabilities. This solicitation further demonstrates New York’s leadership in offshore wind energy, and we look forward to the opportunity to build upon our strong track record here.”

“As the state’s trusted partner, we are proud to answer New York’s call for more clean, renewable offshore wind energy and today submitted a proposal that would create significant jobs, deliver local economic investment, provide meaningful workforce development solutions, and advance the movement toward greater environmental justice across the Empire State,” said Joe Nolan, Chairman, President and CEO of Eversource Energy. “Today’s proposal builds on the incredible work we are already doing in New York including building the state’s first offshore wind farm and harnesses the unmatched combination of our onshore, regional transmission expertise together with Ørsted’s considerable offshore capabilities. Together, we stand ready to deliver a better, cleaner future that all New Yorkers will be proud of.”

Through two existing projects, the Ørsted-Eversource joint venture is already making significant investments and efforts to grow New York’s clean energy workforce, develop the State’s offshore wind supply chain, and provide renewable energy to nearly 670,000 New York homes.

As part of South Fork Wind and Sunrise Wind, Ørsted and Eversource have to date:

About Ørsted

A global clean energy leader, Ørsted develops, constructs, and operates offshore and land-based wind farms, solar farms, energy storage facilities, and bioenergy plants. Ørsted is the first energy company in the world with a science-based net-zero emissions target as validated by the Science Based Targets initiative.

In the United States, the company has approximately 650 employees and a growing portfolio of clean energy assets and partnerships that includes offshore wind energy, land-based wind energy, solar, storage technologies and e-fuels. A leader across the renewable energy sector in the United States, Ørsted holds the top position in offshore wind energy with approximately 5 gigawatts in development and operates America’s first offshore wind farm, located off the coast of Block Island. Ørsted has a total U.S. land-based capacity of 5 gigawatts across wind, solar, storage technologies and e-fuels. To learn more about the Ørsted U.S. business, visit us.orsted.com or follow the company on Facebook, Instagram, and Twitter (@ØrstedUS).

About Eversource

Eversource (NYSE: ES), celebrated as a national leader for its corporate citizenship, is the #1 energy company in Newsweek’s list of America’s Most Responsible Companies for 2023 and recognized as one of America’s Most JUST Companies. Eversource transmits and delivers electricity and natural gas and supplies water to approximately 4.4 million customers in Connecticut, Massachusetts and New Hampshire. The #1 energy efficiency provider in the nation, Eversource harnesses the commitment of approximately 9,500 employees across three states to build a single, united company around the mission of safely delivering reliable energy and water with superior customer service. The company is empowering a clean energy future in the Northeast, with nationally recognized energy efficiency solutions and successful programs to integrate new clean energy resources like solar, offshore wind, electric vehicles and battery storage, into the electric system. For more information, please visit eversource.com, and follow us on Twitter, Facebook, Instagram, and LinkedIn. For more information on our water services, visit aquarionwater.com.


Contacts

Media
For Sunrise Wind:
Meaghan Wims
401-261-1641
This email address is being protected from spambots. You need JavaScript enabled to view it.

DUBLIN--(BUSINESS WIRE)--The "Hydrogen Compressor Market Size, Market Share, Application Analysis, Regional Outlook, Growth Trends, Key Players, Competitive Strategies and Forecasts, 2022 to 2030" report has been added to ResearchAndMarkets.com's offering.


Increasing in number of hydrogen fueling stations, and growing oil & gas refineries across the globe are the key factors driving the demand for Hydrogen Compressor

The global hydrogen compressor market is poised to reach US$ 3.53 Bn by 2030, expanding at a CAGR of 4.8% during the forecast period from 2022 to 2030. Increase in number of hydrogen gas pipelines, innovations in automotive industries, government policies for clean fuel, and growing demand for hydrogen fueling stations are identified as the major factors driving demand for hydrogen compressor worldwide.

However, higher initial cost, frequent maintenance, and dynamic price for raw materials are the major challenges faced by hydrogen compressor market.

Increasing demand for Hydrogen in Transportation sector is going to drive the market

Hydrogen fuel cells are considered to be one of the most emerging technology in automotive segment which is expected to create ample opportunities for hydrogen compressor market. Few manufacturers like Hitachi Ltd. and Howden Joinery Group PLC have started developing this technology in order to cater this emerging market. In the recent years, the hydrogen fueling stations are expected to be the major drivers boosting the use of hydrogen compressor. The United Kingdom is investing more in building distribution infrastructures for hydrogen fuel stations. Out of 327 operational stations worldwide, around 139 stations are based in Europe, 118 stations in Asia Pacific, 68 stations in North America, and one each in South America and Australia.

In 2018, according to International Energy Agency (IEA) there are around 12,900 units of fuel cell vehicle and 376 number of hydrogen fueling stations (HFS) globally. Out of which Europe holds 172 number of HFS, followed by Asia Pacific with 132 HFS, North America with 70 HFS, and Rest of World with 2 HFS.

Asia Pacific to Dominate, North America to Witness Strong Growth

Asia Pacific is expected to be the growing market for hydrogen fuel cells due to government policies and regulations over automotive sectors on countries like China, Japan, and India. In 2015, the Japanese government have invested around USD 460 million for the development of hydrogen stations. The hydrogen compressor market is expected to experience a tremendous demand for petrochemicals and hydrogen fuel cell vehicle industries.

In India, manufacturers are coming up with hydrogen fuel cell technology in automotive segments such as buses, and cars which are expected to create some new opportunities for hydrogen compressor market. Moreover, increase in number of automotive industries, construction industries, and SMEs in Asia Pacific region is expected to drive APAC hydrogen compressor market.

North America to witness a strong growth in hydrogen compressor, due to its wide variety of application in industries such as construction, mining, chemicals, and food processing units.

Market Segmentation

Technology

  • Single-stage
  • Multi-stage

Type

  • Oil-based
  • Oil-free

End User

  • Oil and Gas
  • Chemical Industries
  • Utility Industries
  • Other Industries

Key questions answered in this report

  • What are the key micro and macro environmental factors that are impacting the growth of Hydrogen Compressor market?
  • What are the key investment pockets with respect to product segments and geographies currently and during the forecast period?
  • Estimated forecast and market projections up to 2030.
  • Which segment accounts for the fastest CAGR during the forecast period?
  • Which market segment holds a larger market share and why?
  • Are low and middle-income economies investing in the Hydrogen Compressor market?
  • Which is the largest regional market for Hydrogen Compressor market?
  • What are the market trends and dynamics in emerging markets such as Asia Pacific, Latin America, and Middle East & Africa?
  • Which are the key trends driving Hydrogen Compressor market growth?
  • Who are the key competitors and what are their key strategies to enhance their market presence in the Hydrogen Compressor market worldwide?

Key Topics Covered:

1. Preface

2. Executive Summary

3. Hydrogen Compressor Market: Competitive Analysis

4. Hydrogen Compressor Market: Macro Analysis & Market Dynamics

5. Hydrogen Compressor Market: By Technology, 2020-2030, USD (Million)

6. Hydrogen Compressor Market: By Type, 2020-2030, USD (Million)

7. Hydrogen Compressor Market: By End User, 2020-2030, USD (Million)

8. North America Hydrogen Compressor Market, 2020-2030, USD (Million)

9. UK and European Union Hydrogen Compressor Market, 2020-2030, USD (Million)

10. Asia Pacific Hydrogen Compressor Market, 2020-2030, USD (Million)

11. Latin America Hydrogen Compressor Market, 2020-2030, USD (Million)

12. Middle East and Africa Hydrogen Compressor Market, 2020-2030, USD (Million)

13. Company Profile

Companies Mentioned

  • Hydro-Pac Inc.
  • Howden Group
  • Ariel Corporation
  • Corken Compressor
  • Atlas Copco AB
  • Burckhardt Compression AG
  • HAUG Sauer Kompressoren AG
  • Gardner Denver
  • Hitachi Ltd.

For more information about this report visit https://www.researchandmarkets.com/r/hqd476

About ResearchAndMarkets.com

ResearchAndMarkets.com is the world's leading source for international market research reports and market data. We provide you with the latest data on international and regional markets, key industries, the top companies, new products and the latest trends.


Contacts

ResearchAndMarkets.com
Laura Wood, Senior Press Manager
This email address is being protected from spambots. You need JavaScript enabled to view it.
For E.S.T Office Hours Call 1-917-300-0470
For U.S./ CAN Toll Free Call 1-800-526-8630
For GMT Office Hours Call +353-1-416-8900

KANSAS CITY, Mo.--(BUSINESS WIRE)--$CORR--CorEnergy Infrastructure Trust, Inc. (NYSE: CORR, CORRPrA) ("CorEnergy" or the "Company") today announced the tax characterization of the 2022 distributions paid to stockholders.


The following table summarizes, for income tax purposes, the nature of cash distributions paid by the Company during the year ended December 31, 2022.

Common Shareholders

Record

Date

Payable Date

Total
Distributions
Per Share

Total Ordinary
Dividends

Box 1a

Qualified
Dividends

Box 1b

Total Capital
Gain Distr.

Box 2a

Nondividend
Distr.

Box 3

2/14/2022

2/28/2022

$

0.0500

$

$

$

$

0.0500

5/17/2022

5/31/2022


0.0500


0.0500

8/17/2022

8/31/2022


0.0500


0.0500

11/16/2022

11/30/2022


0.0500


0.0500

Total 2022 Distributions

$

0.2000

$

$

$

$

0.2000


7.375% Series A Cumulative Redeemable Preferred Stock

Record

Date

Payable Date

Total
Distributions
Per Share

Total Ordinary
Dividends

Box 1a

Qualified
Dividends

Box 1b

Total Capital
Gain Distr.

Box 2a

Nondividend
Distr.

Box 3

2/14/2022

2/28/2022

$

0.4609

$

0.1653

$

$

$

0.2956

5/17/2022

5/31/2022


0.4609


0.1653


0.2956

8/17/2022

8/31/2022


0.4609


0.1653


0.2956

11/16/2022

11/30/2022


0.4609


0.1653


0.2956

Total 2022 Distributions

$

1.8436

$

0.6612

$

$

$

1.1824

Additional information regarding the tax characterization of the 2022 distributions is available at corenergy.reit.

Nothing contained herein or therein should be construed as tax advice. Consult your tax advisor for more information. Furthermore, you may not rely upon any information herein or therein for the purpose of avoiding any penalties that may be imposed under the Internal Revenue Code.

About CorEnergy Infrastructure Trust, Inc.

CorEnergy Infrastructure Trust, Inc. (NYSE: CORR, CORRPrA), is a real estate investment trust (REIT) that owns critical energy assets, such as pipelines, storage terminals, and transmission and distribution assets. For more information, please visit corenergy.reit.

Source: CorEnergy Infrastructure Trust, Inc.


Contacts

CorEnergy Infrastructure Trust, Inc.
Investor Relations
Debbie Hagen or Matt Kreps
877-699-CORR (2677)
This email address is being protected from spambots. You need JavaScript enabled to view it.

HOUSTON--(BUSINESS WIRE)--The Board of Directors of Murphy Oil Corporation (NYSE: MUR) today declared a quarterly cash dividend on the Common Stock of Murphy Oil Corporation of $0.275 per share, or $1.10 per share on an annualized basis. This represents a 120 percent increase since fourth quarter 2021 and a 10 percent increase from the previous quarter. The dividend is payable on March 1, 2023, to stockholders of record as of February 13, 2023.


ABOUT MURPHY OIL CORPORATION

As an independent oil and natural gas exploration and production company, Murphy Oil Corporation believes in providing energy that empowers people by doing right always, staying with it and thinking beyond possible. Murphy challenges the norm, taps into its strong legacy and uses its foresight and financial discipline to deliver inspired energy solutions. Murphy sees a future where it is an industry leader who is positively impacting lives for the next 100 years and beyond. Additional information can be found on the company’s website at www.murphyoilcorp.com.

FORWARD-LOOKING STATEMENTS

This news release contains forward-looking statements within the meaning of the Private Securities Litigation Reform Act of 1995. Forward-looking statements are generally identified through the inclusion of words such as “aim”, “anticipate”, “believe”, “drive”, “estimate”, “expect”, “expressed confidence”, “forecast”, “future”, “goal”, “guidance”, “intend”, “may”, “objective”, “outlook”, “plan”, “position”, “potential”, “project”, “seek”, “should”, “strategy”, “target”, “will” or variations of such words and other similar expressions. These statements, which express management’s current views concerning future events, results and plans, are subject to inherent risks, uncertainties and assumptions (many of which are beyond our control) and are not guarantees of performance. In particular, statements, express or implied, concerning the company’s future operating results or activities and returns or the company's ability and decisions to replace or increase reserves, increase production, generate returns and rates of return, replace or increase drilling locations, reduce or otherwise control operating costs and expenditures, generate cash flows, pay down or refinance indebtedness, achieve, reach or otherwise meet initiatives, plans, goals, ambitions or targets with respect to emissions, safety matters or other ESG (environmental/social/governance) matters, or pay and/or increase dividends or make share repurchases and other capital allocation decisions are forward-looking statements. Factors that could cause one or more of these future events, results or plans not to occur as implied by any forward-looking statement, which consequently could cause actual results or activities to differ materially from the expectations expressed or implied by such forward-looking statements, include, but are not limited to: macro conditions in the oil and gas industry, including supply/demand levels, actions taken by major oil exporters and the resulting impacts on commodity prices; increased volatility or deterioration in the success rate of our exploration programs or in our ability to maintain production rates and replace reserves; reduced customer demand for our products due to environmental, regulatory, technological or other reasons; adverse foreign exchange movements; political and regulatory instability in the markets where we do business; the impact on our operations or market of health pandemics such as COVID-19 and related government responses; other natural hazards impacting our operations or markets; any other deterioration in our business, markets or prospects; any failure to obtain necessary regulatory approvals; any inability to service or refinance our outstanding debt or to access debt markets at acceptable prices; or adverse developments in the U.S. or global capital markets, credit markets or economies in general. For further discussion of factors that could cause one or more of these future events or results not to occur as implied by any forward-looking statement, see “Risk Factors” in our most recent Annual Report on Form 10-K filed with the U.S. Securities and Exchange Commission (“SEC”) and any subsequent Quarterly Report on Form 10-Q or Current Report on Form 8-K that we file, available from the SEC’s website and from Murphy Oil Corporation’s website at http://ir.murphyoilcorp.com. Investors and others should note that we may announce material information using SEC filings, press releases, public conference calls, webcasts and the investors page of our website. We may use these channels to distribute material information about the company, therefore we encourage investors, the media, business partners and others interested in our company to review the information we post on our website. Murphy Oil Corporation undertakes no duty to publicly update or revise any forward-looking statements.


Contacts

Investor Contacts:
Kelly Whitley, This email address is being protected from spambots. You need JavaScript enabled to view it., 281-675-9107
Megan Larson, This email address is being protected from spambots. You need JavaScript enabled to view it., 281-675-9470
Nathan Shanor, This email address is being protected from spambots. You need JavaScript enabled to view it., 713-941-9576

DALLAS--(BUSINESS WIRE)--Pioneer Natural Resources Company (“Pioneer”) (NYSE:PXD) today announced its fourth quarter 2022 earnings news release is scheduled to be issued after the close of trading on the New York Stock Exchange on Wednesday, February 22, 2023.


A conference call is scheduled for Thursday, February 23, 2023 at 9:00 a.m. Central Time to discuss the fourth quarter results. Instructions on how to listen to the call and view the accompanying presentation are shown below.

Internet: www.pxd.com
Select “Investors” then “Quarterly Results” to listen to the discussion and view the presentation.

Telephone: Dial (866) 580-3963 confirmation code 1963876 five minutes before the call. View the presentation via Pioneer’s internet address above.

A replay of the webcast will be archived on Pioneer’s website. Alternatively, an audio replay will be available through March 23, 2023. To access the audio replay dial (866) 583-1035 and enter confirmation code 1963876.

About Pioneer

Pioneer is a large independent oil and gas exploration and production company, headquartered in Dallas, Texas, with operations in the United States. For more information, visit Pioneer’s website at www.pxd.com.


Contacts

Investors
Tom Fitter – 972-969-1821
Greg Wright – 972-969-1770
Chris Leypoldt – 972-969-5834

Media and Public Affairs
Christina Voss – 972-969-5706

Achieved 2022 Debt Reduction Goal of $650 Million While Doubling Dividend,
Grew Oil Volumes 29 Percent From First Quarter to Fourth Quarter 2022,
Completed Khaleesi, Mormont, Samurai Field Development Project With Production Exceeding Expectations,
Delivering 10 Percent Oil Production Growth With 2023 Capital Plan

HOUSTON--(BUSINESS WIRE)--Murphy Oil Corporation (NYSE: MUR) today announced its financial and operating results for the fourth quarter ended December 31, 2022, including net income attributable to Murphy of $199 million, or $1.26 net income per diluted share. Excluding discontinued operations and other items affecting comparability between periods, adjusted net income attributable to Murphy was $173 million, or $1.10 adjusted net income per diluted share.

For the full year 2022, the company recorded net income attributable to Murphy of $965 million, or $6.13 net income per diluted share. Murphy reported adjusted net income, which excludes both the results of discontinued operations and other items affecting comparability between periods, of $881 million, or $5.59 adjusted net income per diluted share.

Unless otherwise noted, the financial and operating highlights and metrics discussed in this commentary exclude noncontrolling interest (NCI). 1

Highlights for the fourth quarter include:

  • Redeemed $200 million of 5.75 percent senior notes due 2025
  • Completed the Khaleesi, Mormont, Samurai field development project with seven wells brought online

Highlights for full year 2022 include:

  • Generated net income of $965 million, with $2.2 billion of net cash provided by continuing operations
  • Produced 167 thousand barrels of oil equivalent per day (MBOEPD) with 29 percent growth in oil volumes from first quarter 2022 to fourth quarter 2022
  • Initiated production above expectations and ahead of schedule from the Khaleesi, Mormont, Samurai field development project
  • Acquired additional highly accretive working interests in non-operated Lucius and Kodiak fields for $129 million
  • Introduced and successfully implemented capital allocation framework, focusing on increasing shareholder returns tied to targeted debt reduction goals
  • Doubled the quarterly cash dividend since fourth quarter 2021 to $1.00 per share annualized
  • Completed Murphy 1.0 of capital allocation framework, reducing debt by 26 percent, or $650 million, to $1.82 billion at year-end 2022
  • Maintained reserve life of more than 11 years with total proved reserves of 697 million barrels of oil equivalent (MMBOE)
  • Continued environmental excellence with second year of zero recordable spills

Subsequent to the fourth quarter:

  • Announced an additional 10 percent increase of quarterly cash dividend to $0.275 per share, or $1.10 per share annualized

I am proud of all we accomplished at Murphy in 2022. Our meaningful progress and consistent execution were particularly evident in our offshore business, as we completed the initial phase of the Khaleesi, Mormont, Samurai field development project with production exceeding expectations throughout the year,” said Roger W. Jenkins, President and Chief Executive Officer. “Our disciplined spending, coupled with higher realized oil prices, enabled us to increase our long-standing dividend, achieve our debt reduction goal and position the company for the second phase of our capital allocation framework, Murphy 2.0. As we look ahead to 2023 and continue building on the momentum of 2022, we remain confident in our strong operational capabilities and financial positioning.”

FOURTH QUARTER 2022 RESULTS

The company recorded net income attributable to Murphy of $199 million, or $1.26 net income per diluted share, for the fourth quarter 2022. Adjusted net income, which excludes both the results of discontinued operations and certain other items that affect comparability of results between periods, was $173 million, or $1.10 adjusted net income per diluted share for the same period. Adjusted net income primarily includes the following after-tax increases of $60 million non-cash mark-to-market gain on derivative instruments and $16 million non-cash mark-to-market gain on contingent consideration, and after-tax losses of $24 million in asset retirement obligations and an $18 million write-off of previously suspended exploration wells. Details for fourth quarter results and an adjusted net income reconciliation can be found in the attached schedules.

Adjusted earnings before interest, taxes, depreciation and amortization (EBITDA) attributable to Murphy was $466 million. Adjusted earnings before interest, tax, depreciation, amortization and exploration expenses (EBITDAX) attributable to Murphy was $527 million. Details for fourth quarter EBITDA, EBITDAX, adjusted EBITDA and adjusted EBITDAX reconciliations can be found in the attached schedules.

Fourth quarter production averaged 173.6 MBOEPD and consisted of 56 percent oil volumes, or 97.0 thousand barrels of oil per day (MBOPD). Production in the quarter was impacted by 1.5 MBOEPD of primarily non-operated unplanned Gulf of Mexico downtime, 1.2 MBOEPD of winter weather impacts and 1.2 MBOEPD due to lower performance in the Tupper Montney. Details for fourth quarter production can be found in the attached schedules.

FULL YEAR 2022 RESULTS

The company recorded net income attributable to Murphy of $965 million, or $6.13 net income per diluted share, for the full year 2022. The company reported adjusted net income, which excludes both the results of discontinued operations and certain other items that affect comparability of results between periods, of $881 million, or $5.59 adjusted net income per diluted share for the same period. Adjusted net income primarily includes the following after-tax increase of $170 million non-cash mark-to-market gain on derivative instruments, and after-tax decreases of $62 million non-cash mark-to-market loss on contingent consideration and $24 million asset retirement obligation losses. Details for full year 2022 results and an adjusted net income reconciliation can be found in the attached schedules.

Adjusted EBITDA attributable to Murphy was $2.1 billion. Adjusted EBITDAX attributable to Murphy was $2.2 billion. Details for full year 2022 EBITDA, EBITDAX, adjusted EBITDA and adjusted EBITDAX reconciliations can be found in the attached schedules.

Production for full year 2022 averaged 167.0 MBOEPD and consisted of 54 percent oil volumes, or 89.9 MBOPD, with 29 percent growth in oil volumes from first quarter 2022 to fourth quarter 2022. Accrued capital expenditures (CAPEX) for full year 2022 totaled $1,016 million, excluding NCI, acquisitions and acquisition-related CAPEX. Details for full year 2022 production and CAPEX can be found in the attached tables.

FINANCIAL POSITION

As previously announced, during the fourth quarter Murphy entered into a new $800 million senior unsecured credit facility. The credit facility matures in November 2027 and was undrawn as of December 31, 2022. During the quarter, Murphy also redeemed $200 million of 5.75 percent senior notes due 2025.

Murphy had approximately $1.2 billion of liquidity as of December 31, 2022, comprised of the $800 million credit facility and $492 million of cash and cash equivalents, inclusive of NCI. The company’s total debt was $1.82 billion as of December 31, 2022, and consisted of long-term, fixed-rate notes with a weighted average maturity of 7.7 years and a weighted average coupon of 6.2 percent.

In 2022, Murphy reduced total debt by 26 percent since year-end 2021, thereby achieving its $650 million debt reduction goal while lowering annual interest obligations by approximately $42 million. The company’s steady focus on delevering has reduced total debt by 40 percent or $1.2 billion since year-end 2020.

YEAR-END 2022 PROVED RESERVES

After producing 61 MMBOE for the year, Murphy’s preliminary year-end 2022 proved reserves were 697 MMBOE, consisting of 41 percent oil and 47 percent liquids. Total proved reserves were essentially flat from year-end 2021 with a total reserve replacement of 98 percent.

The company maintained a solid reserve life of more than 11 years with 60 percent proved developed reserves.

2022 Proved Reserves – Preliminary *

Category

Net Oil
(MMBBL)

Net NGLs
(MMBBL)

Net Gas
(BCF)

Net Equiv.
(MMBOE)

Proved Developed (PD)

195

29

1,179

421

Proved Undeveloped (PUD)

92

12

1,035

276

Total Proved

287

41

2,214

697

* Proved reserves exclude noncontrolling interest and are based on preliminary year-end 2022 third-party audited volumes using SEC pricing.

OPERATIONS SUMMARY

Onshore

In the fourth quarter of 2022, the onshore business produced approximately 87 MBOEPD, which included 36 percent liquids volumes. Onshore production increased 11 percent since first quarter 2022.

Eagle Ford Shale – Production averaged 32 MBOEPD with 70 percent oil volumes and 85 percent liquids volumes. Two non-operated wells were brought online in Karnes late in the fourth quarter.

Tupper Montney – Natural gas production averaged 288 million cubic feet per day (MMCFD) in the fourth quarter.

Kaybob Duvernay – Production averaged 5 MBOEPD with 72 percent liquids volumes during the fourth quarter.

Offshore

Excluding NCI, the offshore business produced just over 86 MBOEPD for the fourth quarter, which included 82 percent oil. Total offshore production excluding NCI increased nearly 40 percent since first quarter 2022.

Gulf of Mexico – Production averaged approximately 84 MBOEPD, consisting of 81 percent oil during the fourth quarter. Murphy brought online two operated wells in the Samurai field during the fourth quarter, thereby completing the initial phase of the Khaleesi, Mormont, Samurai field development project. The company continues to achieve an average 97 percent uptime at the Murphy-operated King’s Quay floating production system since production commenced in April 2022. Also during the fourth quarter, Murphy’s operating partner brought online the Lucius #10 (Keathley Canyon 919) well.

Canada – Production averaged nearly 3 MBOEPD in the fourth quarter, consisting of 100 percent oil. The asset life extension project is ongoing for the non-operated Terra Nova floating, production, storage and offloading vessel, which is anticipated to return to production in second quarter 2023.

EXPLORATION

Gulf of Mexico – During the fourth quarter, Murphy as operator spud the Oso-1 (Atwater Valley 138) exploration well, with drilling ongoing in the first quarter 2023. Additionally, in conjunction with a Gulf of Mexico lease expiration in the fourth quarter 2022, Murphy wrote off previously suspended exploration well costs of $18 million after tax.

Mexico – As previously announced, Murphy as operator concluded drilling the Tulum-1EXP exploration well in Block 5 in the Salina Basin. The well did not find commercial hydrocarbons. Murphy plugged and abandoned the well and the partnership is evaluating the results. The net well cost of $22 million was fully expensed in the fourth quarter.

2023 CAPITAL EXPENDITURE AND PRODUCTION GUIDANCE

The 2023 CAPEX plan is expected to be in the range of $875 million to $1.025 billion. Full year 2023 production is expected to be in the range of 175.5 to 183.5 MBOEPD, consisting of approximately 99 MBOPD oil and 109 MBOEPD liquids volumes, equating to 55 percent oil and 61 percent liquids volumes, respectively. This reflects a 10 percent increase in oil volumes and 7 percent increase in total volumes from full year 2022.

Production for first quarter 2023 is estimated to be in the range of 161 to 169 MBOEPD with 92 MBOPD, or 56 percent, oil volumes. This range is impacted by planned downtime of approximately 7.1 MBOEPD, consisting of 2.0 MBOEPD of operated offshore downtime, 2.5 MBOEPD of non-operated offshore downtime and 2.6 MBOEPD of onshore downtime. Both production and CAPEX guidance ranges exclude Gulf of Mexico NCI.

2023 CAPEX by Quarter ($ MMs)

1Q 2023E

2Q 2023E

3Q 2023E

4Q 2023E

FY 2023E

$380

$305

$155

$110

$950


Accrual CAPEX, based on midpoint of guidance range and excluding NCI.

Consistent with prior years, our capital spending program is more heavily weighted to the first half of 2023, enabling Murphy to maximize annual production and free cash flow. Further, we expect lower capital spending than in 2022, while increasing overall production and more notably, oil production as compared to 2022. We continue to maintain capital discipline across the business and execute on our capital allocation framework to further strengthen our balance sheet and provide enhanced shareholder returns,” stated Jenkins.

The table below illustrates the capital allocation by area.

2023 Capital Expenditure Guidance

Area

Total CAPEX
$ MMs

Percent of
Total CAPEX

Gulf of Mexico

$335

35

US Onshore

$325

34

Canada Onshore

$130

14

Exploration

$100

11

Canada Offshore

$30

3

Other

$30

3

Murphy plans to spend approximately $335 million of 2023 CAPEX in the Gulf of Mexico for development drilling and field development projects, including executing three operated subsea tiebacks and three non-operated subsea tiebacks, and advancing the non-operated St. Malo waterflood project prior to its completion in early 2024.

Murphy has allocated $325 million of 2023 CAPEX to the Eagle Ford Shale. This includes $250 million to drill 25 wells and bring online 35 operated wells, as well as drill 11 wells and bring online 17 non-operated wells. The remaining $75 million is allotted to support field development.

The company plans to spend $130 million of its 2023 CAPEX in Canada onshore. Approximately $100 million is allocated to the Tupper Montney to drill 14 wells and bring online 16 operated wells, and the remaining $30 million supports field development in Tupper Montney and Kaybob Duvernay.

The table below details the 2023 onshore well delivery plan by quarter.

2023 Onshore Wells Online


1Q 2023


2Q 2023


3Q 2023


4Q 2023


2023 Total

Eagle Ford Shale

10


17


8


-


35

Kaybob Duvernay

-


-


-


-


-

Tupper Montney

5


3


8


-


16

Non-Op Eagle Ford Shale

7


2


4


4


17

Non-Op Placid Montney

-


-


-


-


-


Note: All well counts are shown gross. Eagle Ford Shale non-operated working interest averages 21 percent.

Approximately $30 million of CAPEX is allocated to Canada offshore, with $18 million for non-operated Hibernia development drilling, as well as $12 million for non-operated Terra Nova for field development ahead of returning to production in the second quarter 2023.

Murphy has allocated $100 million to its 2023 exploration program, with the majority of spending designated for drilling operated exploration wells in the Gulf of Mexico.

Other capital of approximately $30 million, or 3 percent of CAPEX, consists primarily of capitalized interest costs and corporate CAPEX.

Along with supporting an increased quarterly dividend to our valued shareholders, Murphy is positioned for another successful year with capital spending primarily allocated to high-returning, oil-weighted Gulf of Mexico and Eagle Ford Shale assets. At current commodity prices, our 2023 capital and production plans position us to progress into Murphy 2.0 of our capital allocation framework, which allocates 75 percent of adjusted free cash flow to debt reduction and 25 percent to enhanced shareholder returns,” stated Jenkins.

Detailed guidance for the first quarter and full year 2023 is contained in the following schedules.

FIXED PRICE FORWARD SALES CONTRACTS

Murphy maintains fixed price forward sales contracts tied to AECO pricing points to lessen its dependence on variable AECO prices. These contracts are for physical delivery of natural gas volumes at a fixed price, with no mark-to-market income adjustments. Details for the current fixed price contracts can be found in the attached schedules.

CONFERENCE CALL AND WEBCAST SCHEDULED FOR JANUARY 26, 2023

Murphy will host a conference call to discuss fourth quarter 2022 financial and operating results on Thursday, January 26, 2023, at 9:00 a.m. EST. The call can be accessed either via the Internet through the Investor Relations section of Murphy Oil’s website at http://ir.murphyoilcorp.com or via the telephone by dialing toll free 1-888-886-7786, reservation number 99312590.

FINANCIAL DATA

Summary financial data and operating statistics for fourth quarter 2022, with comparisons to the same period from the previous year, are contained in the following schedules. Additionally, a schedule indicating the impacts of items affecting comparability of results between periods, a reconciliation of EBITDA, EBITDAX, adjusted EBITDA and adjusted EBITDAX between periods, as well as guidance for the first quarter and full year 2023, are also included.

1In accordance with GAAP, Murphy reports the 100 percent interest, including a 20 percent noncontrolling interest (NCI), in its subsidiary, MP Gulf of Mexico, LLC (MP GOM). The GAAP financials include the NCI portion of revenue, costs, assets and liabilities and cash flows. Unless otherwise noted, the financial and operating highlights and metrics discussed in this news release, but not the accompanying schedules, exclude the NCI, thereby representing only the amounts attributable to Murphy.

CAPITAL ALLOCATION FRAMEWORK

This news release contains references to the company’s capital allocation framework and adjusted free cash flow. As previously disclosed, the capital allocation framework defines Murphy 1.0 as when long-term debt exceeds $1.8 billion. At this time, adjusted free cash flow is allocated to long-term debt reduction while the company continues to support the quarterly dividend. The company reaches Murphy 2.0 when long-term debt is between $1.0 billion and $1.8 billion. At this time, approximately 75 percent of adjusted free cash flow is allocated to debt reduction, with the remaining 25 percent distributed to shareholders through share buybacks and potential dividend increases. When long-term debt is at or below $1.0 billion, the company is in Murphy 3.0 and begins allocating 50 percent of adjusted free cash flow to the balance sheet, with a minimum of 50 percent of adjusted free cash flow allocated to share buybacks and potential dividend increases.

Adjusted free cash flow is defined as cash flow from operations before working capital change, less capital expenditures, distributions to NCI and projected payments, quarterly dividend and accretive acquisitions.

ABOUT MURPHY OIL CORPORATION

As an independent oil and natural gas exploration and production company, Murphy Oil Corporation believes in providing energy that empowers people by doing right always, staying with it and thinking beyond possible. Murphy challenges the norm, taps into its strong legacy and uses its foresight and financial discipline to deliver inspired energy solutions. Murphy sees a future where it is an industry leader who is positively impacting lives for the next 100 years and beyond. Additional information can be found on the company’s website at www.murphyoilcorp.com.

FORWARD-LOOKING STATEMENTS

This news release contains forward-looking statements within the meaning of the Private Securities Litigation Reform Act of 1995. Forward-looking statements are generally identified through the inclusion of words such as “aim”, “anticipate”, “believe”, “drive”, “estimate”, “expect”, “expressed confidence”, “forecast”, “future”, “goal”, “guidance”, “intend”, “may”, “objective”, “outlook”, “plan”, “position”, “potential”, “project”, “seek”, “should”, “strategy”, “target”, “will” or variations of such words and other similar expressions. These statements, which express management’s current views concerning future events, results and plans, are subject to inherent risks, uncertainties and assumptions (many of which are beyond our control) and are not guarantees of performance. In particular, statements, express or implied, concerning the company’s future operating results or activities and returns or the company's ability and decisions to replace or increase reserves, increase production, generate returns and rates of return, replace or increase drilling locations, reduce or otherwise control operating costs and expenditures, generate cash flows, pay down or refinance indebtedness, achieve, reach or otherwise meet initiatives, plans, goals, ambitions or targets with respect to emissions, safety matters or other ESG (environmental/social/governance) matters, or pay and/or increase dividends or make share repurchases and other capital allocation decisions are forward-looking statements. Factors that could cause one or more of these future events, results or plans not to occur as implied by any forward-looking statement, which consequently could cause actual results or activities to differ materially from the expectations expressed or implied by such forward-looking statements, include, but are not limited to: macro conditions in the oil and gas industry, including supply/demand levels, actions taken by major oil exporters and the resulting impacts on commodity prices; increased volatility or deterioration in the success rate of our exploration programs or in our ability to maintain production rates and replace reserves; reduced customer demand for our products due to environmental, regulatory, technological or other reasons; adverse foreign exchange movements; political and regulatory instability in the markets where we do business; the impact on our operations or market of health pandemics such as COVID-19 and related government responses; other natural hazards impacting our operations or markets; any other deterioration in our business, markets or prospects; any failure to obtain necessary regulatory approvals; any inability to service or refinance our outstanding debt or to access debt markets at acceptable prices; or adverse developments in the U.S. or global capital markets, credit markets or economies in general. For further discussion of factors that could cause one or more of these future events or results not to occur as implied by any forward-looking statement, see “Risk Factors” in our most recent Annual Report on Form 10-K filed with the U.S. Securities and Exchange Commission (“SEC”) and any subsequent Quarterly Report on Form 10-Q or Current Report on Form 8-K that we file, available from the SEC’s website and from Murphy Oil Corporation’s website at http://ir.murphyoilcorp.com. Investors and others should note that we may announce material information using SEC filings, press releases, public conference calls, webcasts and the investors page of our website. We may use these channels to distribute material information about the company, therefore we encourage investors, the media, business partners and others interested in our company to review the information we post on our website. Murphy Oil Corporation undertakes no duty to publicly update or revise any forward-looking statements.

NON-GAAP FINANCIAL MEASURES

This news release contains certain non-GAAP financial measures that management believes are useful tools for internal use and the investment community in evaluating Murphy Oil Corporation’s overall financial performance. These non-GAAP financial measures are broadly used to value and compare companies in the crude oil and natural gas industry. Not all companies define these measures in the same way. In addition, these non-GAAP financial measures are not a substitute for financial measures prepared in accordance with GAAP and should therefore be considered only as supplemental to such GAAP financial measures.


Contacts

Investor Contacts:

Kelly Whitley, This email address is being protected from spambots. You need JavaScript enabled to view it., 281-675-9107
Megan Larson, This email address is being protected from spambots. You need JavaScript enabled to view it., 281-675-9470
Nathan Shanor, This email address is being protected from spambots. You need JavaScript enabled to view it., 713-941-9576


Read full story here

HOUSTON--(BUSINESS WIRE)--USD Partners LP (NYSE: USDP) (the “Partnership”) announced today that the Board of Directors of its general partner declared a quarterly cash distribution of $0.1235 per unit for the fourth quarter of 2022 ($0.494 per unit on an annualized basis), the same amount as distributed in the prior quarter. The Partnership also announced that its Sponsor will waive the fourth quarter distribution on all of its 17.3 million units, reducing this quarterly distribution by approximately $2.1 million. The distribution is payable on February 17, 2023, to unitholders of record at the close of business on February 8, 2023.


“Despite recent volatility in global crude oil markets, we continue to project future heavy crude oil production in Western Canada will exceed pipeline egress alternatives,” said Dan Borgen, the Partnership’s Chief Executive Officer. “Canadian storage utilization levels are currently at the high end of historical averages and given the industry’s current expectations around growth in Canadian oil sands production in 2023, we believe the Partnership’s strategically located assets will be well-positioned to renew, extend or replace agreements that expired during 2022 and those that are set to expire this year. In order to support the Partnership’s current liquidity position, the Partnership’s Sponsor has decided to waive its right to the fourth quarter distribution on its 17.3 million units without impacting the distribution to the remaining unitholders.”

Fourth Quarter 2022 Earnings Release Date and Conference Call Information

The Partnership plans to report fourth quarter 2022 and full-year 2022 financial operating results after market close on Wednesday, March 1, 2023. The Partnership will host a conference call and webcast regarding fourth quarter 2022 results at 11:00 a.m. Eastern Time (10:00 a.m. Central Time) on Thursday, March 2, 2023.

To listen live over the Internet, participants are advised to log on to the Partnership’s website at www.usdpartners.com and select the “Events & Presentations” sub-tab under the “Investors” tab. To join via telephone, participants may dial (800) 225-9448 domestically or +1 (203) 518-9708 internationally, conference ID 8541298. Participants are advised to dial in at least five minutes prior to the call.

An audio replay of the conference call will be available for thirty days by dialing (800) 839-2391 domestically or +1 (402) 220-7205 internationally, conference ID 8541298. In addition, a replay of the audio webcast will be available by accessing the Partnership's website after the call is concluded.

About USD Partners LP

USD Partners LP is a fee-based, growth-oriented master limited partnership formed in 2014 by US Development Group, LLC (“USD”) to acquire, develop and operate midstream infrastructure and complementary logistics solutions for crude oil, biofuels and other energy-related products. The Partnership generates substantially all of its operating cash flows from multi-year, take-or-pay contracts with primarily investment grade customers, including major integrated oil companies, refiners and marketers. The Partnership’s principal assets include a network of crude oil terminals that facilitate the transportation of heavy crude oil from Western Canada to key demand centers across North America. The Partnership’s operations include railcar loading and unloading, storage and blending in on-site tanks, inbound and outbound pipeline connectivity, truck transloading, as well as other related logistics services. In addition, the Partnership provides customers with leased railcars and fleet services to facilitate the transportation of liquid hydrocarbons and biofuels by rail.

USD, which owns the general partner of USD Partners LP, is engaged in designing, developing, owning, and managing large-scale multi-modal logistics centers and energy-related infrastructure across North America. USD’s solutions create flexible market access for customers in significant growth areas and key demand centers, including Western Canada, the U.S. Gulf Coast and Mexico. Among other projects, USD is currently pursuing the development of a premier energy logistics terminal on the Houston Ship Channel with capacity for substantial tank storage, multiple docks (including barge and deepwater), inbound and outbound pipeline connectivity, as well as a rail terminal with unit train capabilities. For additional information, please visit texasdeepwater.com. Information on websites referenced in this release is not part of this release.

Qualified Notice to Nominees

This release serves as qualified notice to nominees as provided for under Treasury Regulation Section 1.1446-4(b)(4) and (d). Please note that we believe that 100 percent of the Partnership’s distributions to foreign investors are attributable to income that is effectively connected with a United States trade or business. Accordingly, all of the Partnership’s distributions to foreign investors are subject to federal income tax withholding at the highest effective tax rate for individuals or corporations, as applicable. Nominees, and not the Partnership, are treated as withholding agents responsible for withholding distributions received by them on behalf of foreign investors.

Cautionary Note Regarding Forward-Looking Statements

This press release contains forward-looking statements within the meaning of U.S. federal securities laws, including statements with respect to the amount and timing of the Partnership’s fourth quarter 2022 cash distribution, the ability of the Partnership and USD to achieve contract extensions, new customer agreements and expansions, and the terms and timing of such extensions, new customer agreements and expansions, if at all; industry conditions and outlook; and volumes at, and demand for, the Partnership’s terminals. Words and phrases such as “expect,” “plan,” “intent,” “believes,” “will,” “projects,” “anticipates,” “future” and similar expressions are used to identify such forward-looking statements. However, the absence of these words does not mean that a statement is not forward-looking. Forward-looking statements relating to the Partnership are based on management’s expectations, estimates and projections about the Partnership, its interests and the energy industry in general on the date this press release was issued. These statements are not guarantees of future performance and involve certain risks, uncertainties and assumptions that are difficult to predict. Therefore, actual outcomes and results may differ materially from what is expressed or forecast in such forward-looking statements. Factors that could cause actual results or events to differ materially from those described in the forward-looking statements include crude oil production levels, Canadian storage utilization levels, our ability to continue as a going concern, the impact of world health events, epidemics and pandemics, changes in general economic conditions and commodity prices, the Partnership’s ability to renew, extend or replace customer agreements on favorable terms, if at all, the Partnership’s ability and election to pay any cash distributions to its unitholders, and the Partnership’s ability comply with the terms of its senior secured credit facility and obtain any necessary waivers thereunder, as well as those factors set forth under the heading “Risk Factors” and elsewhere in the Partnership’s most recent Annual Report on Form 10-K and in the Partnership’s subsequent filings with the Securities and Exchange Commission (many of which may be amplified by the COVID-19 pandemic and the volatility in demand for and prices of crude oil, natural gas and natural gas liquids). The Partnership’s sponsor has made no commitment with respect to a waiver of distributions other than the distribution with respect to the fourth quarter of 2022. The Partnership is under no obligation (and expressly disclaims any such obligation) to update or alter its forward-looking statements, whether as a result of new information, future events or otherwise, except as required by law.

Category: Earnings


Contacts

Adam Altsuler
Executive Vice President, Chief Financial Officer
(281) 291-3995
This email address is being protected from spambots. You need JavaScript enabled to view it.

Jennifer Waller
Senior Director, Financial Reporting and Investor Relations
(832) 991-8383
This email address is being protected from spambots. You need JavaScript enabled to view it.

  • 2022 diluted earnings per share (EPS) were $3.17 compared with $2.96 per share in 2021.
  • Xcel Energy reaffirms 2023 EPS guidance of $3.30 to $3.40 per share.

MINNEAPOLIS--(BUSINESS WIRE)--Xcel Energy Inc. (NASDAQ: XEL) today reported 2022 GAAP and ongoing earnings of $1.74 billion, or $3.17 per share, compared with $1.60 billion, or $2.96 per share in the same period in 2021.


Earnings reflect capital investment recovery and other regulatory outcomes, partially offset by increases in depreciation, interest charges and operating and maintenance (O&M) expenses.

2022 was another solid year for Xcel Energy, where we delivered for our customers, our communities, our employees, and our investors. We delivered earnings of $3.17 per share, which is the 18th consecutive year we have met or beat our original earnings guidance,” said Bob Frenzel, chairman, president and CEO of Xcel Energy.

Our execution towards our clean energy future continues to lead the industry with regulatory approval in Colorado and the Upper Midwest of our plans to dramatically increase the renewable energy available to our customers while retiring all of our coal-fired plants. And as a result of the energy tax provisions in the Inflation Reduction Act, we are able to reduce the cost to our customers over the assets’ lives by billions of dollars as we power the nation’s clean energy transition.

Xcel Energy also delivered strong reliability for our customers and communities in 2022 despite increasingly volatile weather causing high energy demand events during hotter-than-normal summers in Colorado and the Upper Midwest, and Winter Storm Elliott which knocked out critical electric and gas service across the country.”

At 9:00 a.m. CDT today, Xcel Energy will host a conference call to review financial results. To participate in the call, please dial in 5 to 10 minutes prior to the start and follow the operator’s instructions.

US Dial-In:

1-866-580-3963

International Dial-In:

400-120-0558

Conference ID:

9804128

The conference call also will be simultaneously broadcast and archived on Xcel Energy’s website at www.xcelenergy.com. To access the presentation, click on Investors under Company. If you are unable to participate in the live event, the call will be available for replay through Jan. 30.

Replay Numbers


US Dial-In:

1-866-583-1035

Access Code:

9804128

Except for the historical statements contained in this report, the matters discussed herein are forward-looking statements that are subject to certain risks, uncertainties and assumptions. Such forward-looking statements, including those relating to 2023 EPS guidance, long-term EPS and dividend growth rate objectives, future sales, future expenses, future tax rates, future operating performance, estimated base capital expenditures and financing plans, projected capital additions and forecasted annual revenue requirements with respect to rider filings, expected rate increases to customers, expectations and intentions regarding regulatory proceedings, and expected impact on our results of operations, financial condition and cash flows of resettlement calculations and credit losses relating to certain energy transactions, as well as assumptions and other statements are intended to be identified in this document by the words “anticipate,” “believe,” “could,” “estimate,” “expect,” “intend,” “may,” “objective,” “outlook,” “plan,” “project,” “possible,” “potential,” “should,” “will,” “would” and similar expressions. Actual results may vary materially. Forward-looking statements speak only as of the date they are made, and we expressly disclaim any obligation to update any forward-looking information. The following factors, in addition to those discussed in Xcel Energy’s Annual Report on Form 10-K for the fiscal year ended Dec. 31, 2021 and subsequent filings with the Securities and Exchange Commission, could cause actual results to differ materially from management expectations as suggested by such forward-looking information: uncertainty around the impacts and duration of the COVID-19 pandemic, including potential workforce impacts resulting from vaccination requirements, quarantine policies or government restrictions, and sales volatility; operational safety, including our nuclear generation facilities and other utility operations; successful long-term operational planning; commodity risks associated with energy markets and production; rising energy prices and fuel costs; qualified employee work force and third-party contractor factors; violations of our Codes of Conduct; ability to recover costs and our subsidiaries’ ability to recover costs from customers; changes in regulation; reductions in our credit ratings and the cost of maintaining certain contractual relationships; general economic conditions, including recessionary conditions, inflation rates, monetary fluctuations, supply chain constraints and their impact on capital expenditures and/or the ability of Xcel Energy Inc. and its subsidiaries to obtain financing on favorable terms; availability or cost of capital; our customers’ and counterparties’ ability to pay their debts to us; assumptions and costs relating to funding our employee benefit plans and health care benefits; our subsidiaries’ ability to make dividend payments; tax laws; effects of geopolitical events, including war and acts of terrorism; cyber security threats and data security breaches; seasonal weather patterns; changes in environmental laws and regulations; climate change and other weather; natural disaster and resource depletion, including compliance with any accompanying legislative and regulatory changes; costs of potential regulatory penalties; regulatory changes and/or limitations related to the use of natural gas as an energy source; and our ability to execute on our strategies or achieve expectations related to environmental, social and governance matters, including as a result of evolving legal, regulatory, and other standards, processes, and assumptions, the pace of scientific and technological developments, increased costs, the availability of requisite financing, and changes in carbon markets.

This information is not given in connection with any sale, offer for sale or offer to buy any security.

XCEL ENERGY INC. AND SUBSIDIARIES

CONSOLIDATED STATEMENTS OF INCOME (UNAUDITED)

(amounts in millions, except per share data)


Three Months Ended Dec. 31


Twelve Months Ended Dec. 31


2022


2021


2022


2021


Operating revenues


Electric


$

2,868


$

2,562


$

12,123


$

11,205


Natural gas


1,157


768


3,080


2,132


Other


28


25


107


94


Total operating revenues


4,053


3,355


15,310


13,431


Operating expenses


Electric fuel and purchased power


1,233


1,090


5,005


4,733


Cost of natural gas sold and transported


776


478


1,910


1,081


Cost of sales — other


12


10


44


38


Operating and maintenance expenses


664


569


2,491


2,321


Conservation and demand side management expenses


72


82


331


304


Depreciation and amortization


606


535


2,413


2,121


Taxes (other than income taxes)


165


158


688


630


Total operating expenses


3,528


2,922


12,882


11,228


Operating income


525


433


2,428


2,203


Other income (expense), net


7


(13

)


5


Earnings from equity method investments


9


15


36


62


Allowance for funds used during construction — equity


22


20


75


73


Interest charges and financing costs


Interest charges — includes other financing costs of $8, $8, $32 and $29, respectively


248


214


953


842


Allowance for funds used during construction — debt


(9

)


(8

)


(28

)


(26

)

Total interest charges and financing costs


239


206


925


816


Income before income taxes


324


262


1,601


1,527


Income tax benefit


(55

)


(53

)


(135

)


(70

)

Net income


$

379


$

315


$

1,736


$

1,597


Weighted average common shares outstanding:


Basic


549


541


547


539


Diluted


549


542


547


540


Earnings per average common share:


Basic


$

0.69


$

0.58


$

3.18


$

2.96


Diluted


0.69


0.58


3.17


2.96


XCEL ENERGY INC. AND SUBSIDIARIES
Notes to Investor Relations Earnings Release (Unaudited)

Due to the seasonality of Xcel Energy’s operating results, quarterly financial results are not an appropriate base from which to project annual results.

Non-GAAP Financial Measures

The following discussion includes financial information prepared in accordance with generally accepted accounting principles (GAAP), as well as certain non-GAAP financial measures such as ongoing return on equity (ROE), ongoing earnings and ongoing diluted EPS. Generally, a non-GAAP financial measure is a measure of a company’s financial performance, financial position or cash flows that adjusts measures calculated and presented in accordance with GAAP. Xcel Energy’s management uses non-GAAP measures for financial planning and analysis, for reporting of results to the Board of Directors, in determining performance-based compensation and communicating its earnings outlook to analysts and investors. Non-GAAP financial measures are intended to supplement investors’ understanding of our performance and should not be considered alternatives for financial measures presented in accordance with GAAP. These measures are discussed in more detail below and may not be comparable to other companies’ similarly titled non-GAAP financial measures.

Ongoing ROE

Ongoing ROE is calculated by dividing the net income or loss of Xcel Energy or each subsidiary, adjusted for certain nonrecurring items, by each entity’s average stockholder’s equity. We use these non-GAAP financial measures to evaluate and provide details of earnings results.

Earnings Adjusted for Certain Items (Ongoing Earnings and Ongoing Diluted EPS)

GAAP diluted EPS reflects the potential dilution that could occur if securities or other agreements to issue common stock (i.e., common stock equivalents) were settled. The weighted average number of potentially dilutive shares outstanding used to calculate Xcel Energy Inc.’s diluted EPS is calculated using the treasury stock method. Ongoing earnings reflect adjustments to GAAP earnings (net income) for certain items. Ongoing diluted EPS for Xcel Energy is calculated by dividing net income or loss, adjusted for certain items, by the weighted average fully diluted Xcel Energy Inc. common shares outstanding for the period. Ongoing diluted EPS for each subsidiary is calculated by dividing the net income or loss for such subsidiary, adjusted for certain items, by the weighted average fully diluted Xcel Energy Inc. common shares outstanding for the period.

We use these non-GAAP financial measures to evaluate and provide details of Xcel Energy’s core earnings and underlying performance. We believe these measurements are useful to investors to evaluate the actual and projected financial performance and contribution of our subsidiaries. For the three and twelve months ended Dec. 31, 2022 and 2021, there were no such adjustments to GAAP earnings and therefore GAAP earnings equal ongoing earnings for these periods.

Note 1. Earnings Per Share Summary

Xcel Energy’s 2022 earnings were $3.17 per share compared to $2.96 per share in 2021. The increase was driven by regulatory outcomes, partially offset by higher depreciation, O&M expenses and interest charges. Costs for natural gas significantly increased in 2022 due to market conditions. However, fluctuations in electric and natural gas revenues associated with changes in fuel and purchased power and/or natural gas sold and transported generally do not significantly impact earnings (changes in revenues are offset by the related variation in costs). Summarized diluted EPS for Xcel Energy:


Three Months Ended Dec. 31


Twelve Months Ended Dec. 31

Diluted Earnings (Loss) Per Share


2022


2021


2022


2021


PSCo


$

0.31


$

0.27


$

1.33


$

1.22


NSP-Minnesota


0.29


0.22


1.23


1.12


SPS


0.12


0.11


0.64


0.59


NSP-Wisconsin


0.04


0.05


0.23


0.20


Earnings from equity method investments — WYCO


0.01


0.01


0.04


0.05


Regulated utility (a)


0.78


0.65


3.47


3.18


Xcel Energy Inc. and Other


(0.09

)


(0.06

)


(0.29

)


(0.22

)

Total (a)


$

0.69


$

0.58


$

3.17


$

2.96


(a)

Amounts may not add due to rounding.

PSCo — Earnings increased $0.11 per share for 2022, driven by regulatory outcomes and favorable weather. Higher revenues were partially offset by higher depreciation, O&M expenses and interest charges.

NSP-Minnesota — Earnings increased $0.11 per share for 2022 compared to 2021, driven by regulatory rate outcomes, partially offset by additional depreciation and O&M expenses.

SPS — Earnings increased $0.05 per share for 2022, largely related to regulatory rate outcomes, strong sales growth and favorable weather, partially offset by higher depreciation and O&M expenses.

NSP-Wisconsin — Earnings increased $0.03 per share for 2022 compared to 2021. The increase is due to regulatory rate outcomes and sales growth, partially offset by higher depreciation and O&M expenses.

Xcel Energy Inc. and Other — Earnings decreased $0.07 per share year-to-date due to higher interest charges and decreased earnings from Energy Impact Partners (EIP) investments.

Components significantly contributing to changes in 2022 EPS compared with 2021:

Diluted Earnings (Loss) Per Share


Three Months
Ended Dec. 31


Twelve Months
Ended Dec. 31

GAAP and ongoing diluted EPS — 2021


$

0.58


$

2.96


Components of change — 2022 vs. 2021


Higher electric revenues, net of electric fuel and purchased power


0.22


0.89


Higher natural gas revenues, net of cost of natural gas sold and transported


0.12


0.16


Lower ETR (a)


0.03


0.15


Higher depreciation and amortization


(0.10

)


(0.40

)

Higher O&M expenses


(0.13

)


(0.24

)

Higher interest expense


(0.05

)


(0.15

)

Higher taxes (other than income taxes)


(0.01

)


(0.08

)

Other (net)


0.03


(0.12

)

GAAP and ongoing diluted EPS — 2022


$

0.69


$

3.17


(a)

Includes production tax credits (PTCs) and plant regulatory amounts, which are primarily offset as a reduction to electric revenues.

ROE for Xcel Energy and its utility subsidiaries:

2022


PSCo


NSP-
Minnesota


SPS


NSP-
Wisconsin


Operating
Companies


Xcel Energy

GAAP and ongoing ROE


8.23

%


8.76

%


9.36

%


10.57

%


8.74

%


10.76

%

2021


PSCo


NSP-
Minnesota


SPS


NSP-
Wisconsin


Operating
Companies


Xcel Energy

GAAP and ongoing ROE


8.23

%


8.45

%


9.22

%


9.92

%


8.58

%


10.58

%

Note 2. Regulated Utility Results

Estimated Impact of Temperature Changes on Regulated Earnings — Unusually hot summers or cold winters increase electric and natural gas sales, while mild weather reduces electric and natural gas sales. The estimated impact of weather on earnings is based on the number of customers, temperature variances, the amount of natural gas or electricity historically used per degree of temperature and excludes any incremental related operating expenses that could result due to storm activity or vegetation management requirements. As a result, weather deviations from normal levels can affect Xcel Energy’s financial performance. However, sales true-up and decoupling mechanisms in Minnesota and Colorado predominately mitigate the positive and adverse impacts of weather.

Normal weather conditions are defined as either the 10, 20 or 30-year average of actual historical weather conditions. The historical period of time used in the calculation of normal weather differs by jurisdiction, based on regulatory practice. To calculate the impact of weather on demand, a demand factor is applied to the weather impact on sales. Extreme weather variations, windchill and cloud cover may not be reflected in weather-normalized estimates.

Weather — Estimated impact of temperature variations on EPS compared with normal weather conditions:


Three Months Ended Dec. 31


Twelve Months Ended Dec. 31


2022 vs.
Normal


2021 vs.
Normal


2022 vs. 2021


2022 vs.
Normal


2021 vs.
Normal


2022 vs. 2021

Retail electric

$

0.007


$

(0.026

)


$

0.033


$

0.138


$

0.096


$

0.042

Decoupling and sales true-up


(0.007

)


0.011


(0.018

)


(0.061

)


(0.066

)


0.005

Electric total

$


$

(0.015

)


$

0.015


$

0.077


$

0.030


$

0.047

Firm natural gas


0.018


(0.030

)


0.048


0.037


(0.025

)


0.062

Total

$

0.018


$

(0.045

)


$

0.063


$

0.114


$

0.005


$

0.109

Sales — Sales growth (decline) for actual and weather-normalized sales in 2022 compared to 2021:


Three Months Ended Dec. 31


PSCo


NSP-Minnesota


SPS


NSP-Wisconsin


Xcel Energy

Actual


Electric residential


3.7

%


(0.4

)%


12.8

%


0.4

%


2.9

%

Electric C&I


1.3


7.0


2.2


2.5


Total retail electric sales


2.0


(0.1

)


7.7


1.7


2.6


Firm natural gas sales


26.4


15.0


N/A


11.3


21.8


Three Months Ended Dec. 31


PSCo


NSP-Minnesota


SPS


NSP-Wisconsin


Xcel Energy

Weather-normalized


Electric residential


(3.4

) %


(2.6

)%


1.2

%


(1.9

)%


(2.3

)%

Electric C&I


0.3


6.7


2.1


2.1


Total retail electric sales


(0.9

)


(0.8

)


5.7


1.0


0.9


Firm natural gas sales


(4.5

)


4.5


N/A


2.4


(1.4

)


Twelve Months Ended Dec. 31


PSCo


NSP-Minnesota


SPS


NSP-Wisconsin


Xcel Energy

Actual


Electric residential


(1.5

)%


(1.2

)%


6.5

%


1.1

%


(0.1

)%

Electric C&I


1.7


8.9


3.3


3.3


Total retail electric sales


(0.5

)


0.8


8.4


2.6


2.3


Firm natural gas sales


5.4


18.3


N/A


17.3


10.1


Twelve Months Ended Dec. 31


PSCo


NSP-Minnesota


SPS


NSP-Wisconsin


Xcel Energy

Weather-normalized


Electric residential


(3.6

)%


(0.2

)%


0.8

%


%


(1.3

)%

Electric C&I


(0.3

)


2.1


8.4


3.4


3.2


Total retail electric sales


(1.4

)


1.3


6.9


2.4


1.8


Firm natural gas sales


(3.1

)


5.5


N/A


5.8


0.1


Weather-normalized electric sales growth (decline) — year-to-date

  • PSCo — Residential sales declined due to decreased use per customer, partially offset by a 1.1% increase in customers. C&I sales decline was attributable to decreased use per customer, primarily in the manufacturing sector (largely due to an alternative generation arrangement with a significant customer), partially offset by strong small C&I sales in the food services and health care sectors.
  • NSP-Minnesota — Residential sales decline reflects a decreased use per customer, partially offset by a 1.1% increase in customers. Growth in C&I sales was primarily due to higher use per customer, particularly in the manufacturing, real estate and leasing, and food service sectors.
  • SPS — Residential sales growth was primarily attributable to a 0.9% increase in customers, partially offset by lower use per customer. C&I sales increased due to higher use per customer, primarily driven by the energy sector.
  • NSP-Wisconsin — C&I sales growth was associated with higher use per customer, experienced primarily in the transportation and manufacturing sectors.

Weather-normalized natural gas sales growth (decline) — year-to-date

  • Natural gas sales reflect growth in NSP-Minnesota and NSP-Wisconsin attributable primarily to increased residential use per customer and customer growth as well as increases in C&I sales due to higher use per customer. These increases were offset by a reduction in PSCo natural gas sales, primarily driven by declines in residential use per customer.

Electric Margin — Electric margin is presented as electric revenues less electric fuel and purchased power expenses. Expenses incurred for electric fuel and purchased power are generally recovered through various regulatory recovery mechanisms. As a result, changes in these expenses are generally offset in operating revenues.

Electric revenues and fuel and purchased power expenses are impacted by fluctuations in the price of natural gas, coal and uranium. These price fluctuations generally have minimal impact on earnings impact due to fuel recovery mechanisms. In addition, electric customers receive a credit for PTCs generated, which reduce electric revenue and income taxes.

Electric revenues, fuel and purchased power and margin:


Three Months Ended Dec. 31


Twelve Months Ended Dec. 31

(Millions of Dollars)


2022


2021


2022


2021


Electric revenues


$

2,868


$

2,562


$

12,123


$

11,205


Electric fuel and purchased power


(1,233

)


(1,090

)


(5,005

)


(4,733

)

Electric margin


$

1,635


$

1,472


$

7,118


$

6,472


Change in electric margin:

(Millions of Dollars)


Three Months
Ended Dec. 31,
2022 vs. 2021


Twelve Months
Ended Dec. 31,
2022 vs. 2021

Regulatory rate outcomes (Minnesota, Colorado, Texas, New Mexico and Wisconsin)


$

146


$

506


Revenue recognition for the Texas rate case surcharge (a)


85


Sales and demand (b)


2


80


Non-fuel riders


16


64


Wholesale transmission (net)


25


50


Estimated impact of weather (net of decoupling/sales true-up)


11


33


PTCs flowed back to customers (offset by lower ETR)


(30

)


(150

)

Other (net)


(7

)


(22

)

Total increase


$

163


$

646


(a)

Recognition of revenue from the Texas rate case outcome is largely offset by recognition of previously deferred costs.

(b)

Sales excludes weather impact, net of decoupling in Colorado and proposed sales true-up mechanism in Minnesota.

Natural Gas Margin — Natural gas margin is presented as natural gas revenues less the cost of natural gas sold and transported. Expenses incurred for the cost of natural gas sold are generally recovered through various regulatory recovery mechanisms. As a result, changes in these expenses are generally offset in operating revenues.

Natural gas expense varies with changing sales and the cost of natural gas. However, fluctuations in the cost of natural gas generally have minimal earnings impact due to cost recovery mechanisms.

Natural gas revenues, cost of natural gas sold and transported and margin:


Three Months Ended Dec. 31


Twelve Months Ended Dec. 31

(Millions of Dollars)


2022


2021


2022


2021


Natural gas revenues


$

1,157


$

768


$

3,080


$

2,132


Cost of natural gas sold and transported


(776

)


(478

)


(1,910

)


(1,081

)

Natural gas margin


$

381


$

290


$

1,170


$

1,051


Change in natural gas margin:

(Millions of Dollars)


Three Months
Ended Dec. 31,
2022 vs. 2021


Twelve Months
Ended Dec. 31,
2022 vs. 2021

Regulatory rate outcomes (Minnesota, Colorado, Wisconsin, North Dakota)


$

45


$

61


Estimated impact of weather


35


46


Conservation revenue (offset in expenses)


4


13


Infrastructure and integrity riders


2


9


Winter Storm Uri disallowances


(20

)

Other (net)


5


10


Total increase


$

91


$

119


O&M Expenses — O&M expenses increased $170 million year-to-date due to the following approximately equal drivers: inflation and impacts of supply chain constraints; operational activities (vegetation management, repairs/maintenance and storms); costs for technology and customer programs; insurance-related costs; recognition of previously deferred amounts related to the 2021 Texas rate case; and other.

Depreciation and Amortization — Depreciation and amortization increased $292 million year-to-date. The increase was primarily driven by capital investment, recognition of previously deferred costs related to the Texas Electric Rate Case and several wind farms going into service.

Other Income (Exp


Contacts

Paul Johnson, Vice President - Treasurer & Investor Relations
(612) 215-4535

For news media inquiries only, please call Xcel Energy Media Relations
(612) 215-5300

Xcel Energy website address: www.xcelenergy.com


Read full story here
SAN ANTONIO--(BUSINESS WIRE)--NuStar Energy L.P. (NYSE: NS) today announced that its Board of Directors has declared a fourth quarter 2022 common unit distribution of $0.40 per unit. The fourth quarter common unit distribution will be paid on February 14, 2023 to holders of record as of February 8, 2023.


NuStar Energy L.P.’s Board of Directors also declared a fourth quarter 2022 Series A preferred unit distribution of $0.71889 per unit, a Series B preferred unit distribution of $0.64871 per unit and a Series C preferred unit distribution of $0.72602 per unit. The preferred unit distributions will be paid on March 15, 2023 to holders of record as of March 1, 2023.

A conference call with management is scheduled for 10:00 a.m. CT on Wednesday, February 1, 2023, to discuss the financial and operational results for the fourth quarter of 2022. Persons interested in listen-only participation may access the conference call directly at https://edge.media-server.com/mmc/p/bgpdnpyj. Persons interested in Q&A participation may pre-register for the conference call and obtain a dial-in number and passcode at https://register.vevent.com/register/BI757a142163514824bfe28118ca3c0731. A recorded version will be available two hours after the conclusion of the conference call at https://edge.media-server.com/mmc/p/bgpdnpyj.

The conference call may also be accessed through the “Investors” section of NuStar Energy L.P.’s website at https://investor.nustarenergy.com.

NuStar Energy L.P., a publicly traded master limited partnership based in San Antonio, Texas, is one of the largest independent liquids terminal and pipeline operators in the nation. NuStar currently has approximately 9,500 miles of pipeline and 63 terminal and storage facilities that store and distribute crude oil, refined products, renewable fuels, ammonia and specialty liquids. The partnership’s combined system has approximately 49 million barrels of storage capacity, and NuStar has operations in the United States and Mexico. For more information, visit NuStar Energy L.P.’s website at www.nustarenergy.com and its Sustainability page at https://sustainability.nustarenergy.com/.

This release serves as qualified notice to nominees under Treasury Regulation Sections 1.1446-4(b)(4) and (d) and 1.1446(f). Please note that 100% of NuStar Energy L.P.’s distributions to foreign investors are attributable to income that is effectively connected with a United States trade or business. 100% of the distribution is in excess of cumulative net income for purposes of Treasury Regulation Section 1.1446(f)-4(c)(2)(iii). Accordingly, all of NuStar Energy L.P.’s distributions to foreign investors are subject to federal income tax withholding at the highest effective tax rate for individuals and corporations, as applicable. Nominees, and not NuStar Energy L.P., are treated as the withholding agents responsible for withholding on the distributions received by them on behalf of foreign investors.


Contacts

Investors, Pam Schmidt, Vice President, Investor Relations
Investor Relations: 210-918-INVR (4687)
or
Media, Mary Rose Brown, Executive Vice President and Chief Administrative Officer,
Corporate Communications: 210-918-2314 / 210-410-8926

TULSA, Okla.--(BUSINESS WIRE)--NGL Energy Partners LP (NYSE: NGL) announced today that NGL plans to issue its fiscal third quarter ended December 31, 2022 earnings press release post-market close on Thursday, February 9, 2023. Members of NGL’s management team intend to host an earnings call following this release on Thursday, February 9, 2023 at 4:30 pm CT to discuss its financial results. Analysts, investors, and other interested parties may join the webcast via the event link: https://www.webcaster4.com/Webcast/Page/2808/47555 or by dialing (888) 506-0062 and providing access code: 893513. An archived audio replay of the call will be available for 14 days, which can be accessed by dialing (877) 481-4010 and providing replay passcode 47555.


About NGL Energy Partners LP

NGL Energy Partners LP, a Delaware limited partnership is a diversified midstream energy company that transports, stores, markets and provides other logistics services for crude oil, natural gas liquids and other products and transports, treats and disposes of produced water generated as part of the oil and natural gas production process. For further information, visit the Partnership’s website at www.nglenergypartners.com.

This release is a qualified notice under Treasury Regulation Section 1.1446-4(b). Brokers and nominees should treat 100% of NGL Energy Partners LP’s distributions to foreign investors as being attributable to income that is effectively connected with a United States trade or business. Therefore, distributions to foreign investors are subject to federal income tax withholding at the highest applicable effective tax rate.


Contacts

NGL Energy Partners LP
Brad Cooper, 918.481.1119
Executive Vice President & Chief Financial Officer
This email address is being protected from spambots. You need JavaScript enabled to view it.
or
David Sullivan, 918.481.1119
Vice President – Finance
This email address is being protected from spambots. You need JavaScript enabled to view it.

SAN RAMON, Calif.--(BUSINESS WIRE)--Chevron Corporation (NYSE: CVX) today announced Mark A. Nelson, executive vice president, Strategy, Policy & Development, has been named vice chairman and executive vice president, Strategy, Policy & Development, effective February 1, 2023. In this new corporate officer role, Nelson will continue leading Chevron’s Strategy & Sustainability, Corporate Affairs, and Business Development functions, and take on additional corporate responsibilities.


“Throughout his career, and as a senior leader, Mark has made significant contributions to the company’s success,” said Michael K. Wirth, Chevron’s chairman and chief executive officer. “He has worked in every segment of our business, and his results-driven approach positions him well to help execute our strategy and represent Chevron more broadly.”

Nelson previously served as executive vice president of Downstream & Chemicals, vice president, Midstream, Strategy & Policy, and vice president of Corporate Strategic Planning.

Chevron is one of the world’s leading integrated energy companies. We believe affordable, reliable and ever-cleaner energy is essential to achieving a more prosperous and sustainable world. Chevron produces crude oil and natural gas; manufactures transportation fuels, lubricants, petrochemicals and additives; and develops technologies that enhance our business and the industry. We are focused on lowering the carbon intensity in our operations and growing lower carbon businesses along with our traditional business lines. More information about Chevron is available at www.chevron.com.


Contacts

Sean McCormack
+1 (925) 842 7474

DALLAS--(BUSINESS WIRE)--Eagle Materials Inc. (NYSE: EXP) today reported financial results for the third quarter of fiscal 2023 ended December 31, 2022. Notable items for the quarter are highlighted below (unless otherwise noted, all comparisons are with the prior year’s fiscal third quarter):


Third Quarter Fiscal 2023 Highlights

  • Record Revenue of $511 million, up 10%
  • Record Net Earnings of $117 million, up 14%, and Net Earnings per share of $3.20, up 26%
  • Adjusted EBITDA of $199 million, up 14%
    • Adjusted EBITDA is a non-GAAP financial measure calculated by excluding non-routine items and certain non-cash expenses in the manner described in Attachment 6
  • Repurchased 824,000 shares of Eagle’s common stock for $103 million

Commenting on the results, Michael Haack, President and CEO, said, “We are pleased to announce another exceptional quarter at Eagle. In the third quarter, we achieved record revenue of $511 million and record EPS of $3.20, and we expanded gross margins by 110 bps to 31.0%. Third quarter performance was led by our Gypsum Wallboard business, in which margins expanded 400 bps. Construction activity remained healthy across our markets, despite delayed projects in the Midwest and Texas due to wet and extreme cold weather, which affected cement production and shipments. Utilization rates remained high across our network. During the quarter, we generated strong free cash flow and repurchased 824,000 shares of our common stock. Cash returned to shareholders in the quarter was approximately $113 million, bringing total cash returned to $342 million in the first nine months of the fiscal year.”

“We also continued to make strides towards our environmental stewardship goals, including expanding the production and sale of our eco-friendly Portland Limestone Cement during the quarter.”

Mr. Haack concluded, “Eagle’s heartland geographic footprint is well-positioned for long-term growth, supported by population-growth trends, shortages of residential units, and a multi-year federal highway bill further enhanced by state-level infrastructure spending. In the near term, we expect the strength in private non-residential and infrastructure construction activity to lessen the impact of affordability-driven headwinds in single-family residential construction.”

Segment Financial Results

Heavy Materials: Cement, Concrete and Aggregates

Revenue in the Heavy Materials sector, which includes Cement, Concrete and Aggregates, as well as Joint Venture and intersegment Cement revenue, was up 3% to $311 million. Heavy Materials operating earnings declined 11% to $75 million, primarily because of lower Cement sales volume partially offset by higher Cement net sales prices. Cement sales volume was affected by lower cement inventory levels compared with the prior-year period as well as difficult weather conditions during this quarter.

Cement revenue for the quarter, including Joint Venture and intersegment revenue, was down 2% to $256 million, and operating earnings were down 9% to $72 million. The decline reflects lower Cement sales volume partially offset by higher net sales prices. The average net Cement sales price for the quarter increased 13% to $134.36 per ton. Cement sales volume for the quarter was 1.7 million tons, down 13% versus the prior-year period.

Concrete and Aggregates revenue increased 30% to $55 million, reflecting higher sales volume and Concrete pricing as well as the contribution of approximately $10 million from the acquired business in northern Colorado. Operating earnings for Concrete and Aggregates decreased 35% to $3 million, primarily reflecting higher input costs.

Light Materials: Gypsum Wallboard and Paperboard

Revenue in the Light Materials sector, which includes Gypsum Wallboard and Paperboard, increased 23% to $235 million, reflecting higher Wallboard and Paperboard sales volume and prices. Gypsum Wallboard sales volume increased 5% to 728 million square feet (MMSF), while the average Gypsum Wallboard net sales price increased 25% to $238.51 per MSF.

Paperboard sales volume for the quarter was down 5% to 77,000 tons. The average Paperboard net sales price was $594.93 per ton, up 2%, consistent with the pricing provisions in our long-term sales agreements.

Operating earnings in the sector were $95 million, up 51%, reflecting increased Wallboard sales volume and pricing and a sharp reduction in raw material costs, notably recycled fiber.

Details of Financial Results

We conduct one of our cement plant operations through a 50/50 joint venture, Texas Lehigh Cement Company LP (the Joint Venture). We use the equity method of accounting for our 50% interest in the Joint Venture. For segment reporting purposes only, we proportionately consolidate our 50% share of the Joint Venture’s revenue and operating earnings, which is consistent with the way management organizes the segments within the Company for making operating decisions and assessing performance.

In addition, for segment reporting purposes, we report intersegment revenue as part of a segment’s total revenue. Intersegment sales are eliminated on the consolidated income statement. Refer to Attachment 3 for a reconciliation of these amounts.

About Eagle Materials Inc.

Eagle Materials Inc. manufactures and distributes Portland Cement, Gypsum Wallboard, Recycled Paperboard and Concrete and Aggregates from more than 70 facilities across the US. Eagle’s corporate headquarters is in Dallas, Texas.

Eagle’s senior management will conduct a conference call to discuss the financial results, forward looking information and other matters at 8:30 a.m. Eastern Time (7:30 a.m. Central Time) on Thursday, January 26, 2023. The conference call will be webcast on the Eagle website, eaglematerials.com. A replay of the webcast and the presentation will be archived on the website for one year.

Forward-Looking Statements. This press release contains forward-looking statements within the meaning of Section 27A of the Securities Act of 1933, Section 21E of the Securities Exchange Act of 1934 and the Private Securities Litigation Reform Act of 1995. Forward-looking statements may be identified by the context of the statement and generally arise when the Company is discussing its beliefs, estimates or expectations as to future events. These statements are not historical facts or guarantees of future performance but instead represent only the Company’s belief at the time the statements were made regarding future events which are subject to certain risks, uncertainties and other factors, many of which are outside the Company’s control. Actual results and outcomes may differ materially from what is expressed or forecast in such forward-looking statements. The principal risks and uncertainties that may affect the Company’s actual performance include the following: the cyclical and seasonal nature of the Company’s businesses; fluctuations in public infrastructure expenditures; adverse weather conditions; the fact that our products are commodities and that prices for our products are subject to material fluctuation due to market conditions and other factors beyond our control; the availability and fluctuations in the cost of raw materials; changes in the costs of energy, including, without limitation, natural gas, coal and oil, and the nature of our obligations to counterparties under energy supply contracts, such as those related to market conditions (for example, spot market prices), governmental orders and other matters; changes in the cost and availability of transportation; unexpected operational difficulties, including unexpected maintenance costs, equipment downtime and interruption of production; material nonpayment or non-performance by any of our key customers; inability to timely execute announced capacity expansions; difficulties and delays in the development of new business lines; governmental regulation and changes in governmental and public policy (including, without limitation, climate change and other environmental regulation); possible outcomes of pending or future litigation or arbitration proceedings; changes in economic conditions or the nature or level of activity in any one or more of the markets or industries in which the Company or its customers are engaged; severe weather conditions (such as winter storms, tornados and hurricanes) and their effects on our facilities, operations and contractual arrangements with third parties; competition; cyber-attacks or data security breaches; increases in capacity in the gypsum wallboard and cement industries; changes in the demand for residential housing construction or commercial construction or construction projects undertaken by state or local governments; the availability of acquisitions or other growth opportunities that meet our financial return standards and fit our strategic focus; risks related to pursuit of acquisitions, joint ventures and other transactions or the execution or implementation of such transactions, including the integration of operations acquired by the Company; general economic conditions, including inflation and recessionary conditions; and changes in interest rates and the resulting effects on the Company and demand for our products. For example, increases in interest rates, decreases in demand for construction materials or increases in the cost of energy (including, without limitation, natural gas, coal and oil) or the cost of our raw materials could affect the revenue and operating earnings of our operations. In addition, changes in national or regional economic conditions and levels of infrastructure and construction spending could also adversely affect the Company’s result of operations. Finally, any forward-looking statements made by the Company are subject to the risks and impacts associated with natural disasters, pandemics or other unforeseen events, including, without limitation, the COVID-19 pandemic and responses thereto designed to contain its spread and mitigate its public health effects, as well as their impact on economic conditions, capital and financial markets. These and other factors are described in the Company’s Annual Report on Form 10-K for the fiscal year ended March 31, 2022 and subsequent quarterly and annual reports upon filing. These reports are filed with the Securities and Exchange Commission. All forward-looking statements made herein are made as of the date hereof, and the risk that actual results will differ materially from expectations expressed herein will increase with the passage of time. The Company undertakes no duty to update any forward-looking statement to reflect future events or changes in the Company’s expectations.

Attachment 1 Statement of Consolidated Earnings
Attachment 2 Revenue and Earnings by Lines of Business
Attachment 3 Sales Volume, Average Net Sales Prices and Intersegment and Cement Revenue
Attachment 4 Consolidated Balance Sheets
Attachment 5 Depreciation, Depletion and Amortization by Lines of Business
Attachment 6 Reconciliation of Non-GAAP Financial Measures

Attachment 1


Eagle Materials Inc.

Statement of Consolidated Earnings

(dollars in thousands, except per share data)

(unaudited)


Quarter Ended
December 31,


Nine Months Ended
December 31,


2022


2021


2022


2021


Revenue

$

511,487


$

462,941


$

1,677,942


$

1,448,405


Cost of Goods Sold


352,717


324,355


1,174,067


1,027,967


Gross Profit


158,770


138,586


503,875


420,438


Equity in Earnings of Unconsolidated JV


11,377


8,555


23,631


24,785


Corporate General and Administrative Expenses


(12,497

)


(12,851

)


(37,944

)


(32,986

)

Loss on Early Retirement of Senior Notes


-


-


-


(8,407

)

Other Non-Operating Income


2,210


3,207


911


5,941


Earnings before Interest and Income Taxes


159,860


137,497


490,473


409,771


Interest Expense, net


(8,932

)


(5,651

)


(24,842

)


(24,891

)


Earnings before Income Taxes


150,928


131,846


465,631


384,880


Income Tax Expense


(33,744

)


(29,367

)


(104,447

)


(84,949

)


Net Earnings

$

117,184


$

102,479


$

361,184


$

299,931


NET EARNINGS PER SHARE


Basic

$

3.23


$

2.56


$

9.72


$

7.30


Diluted

$

3.20


$

2.53


$

9.66


$

7.23


AVERAGE SHARES OUTSTANDING


Basic


36,336,056


40,049,456


37,149,927


41,096,702


Diluted


36,605,982


40,458,049


37,395,586


41,493,339

 
Attachment 2


Eagle Materials Inc.

Revenue and Earnings by Lines of Business

(dollars in thousands)

(unaudited)


Quarter Ended
December 31,


Nine Months Ended
December 31,


2022


2021


2022


2021

Revenue*


Heavy Materials:


Cement (Wholly Owned)

$

220,974


$

228,448


$

754,853


$

724,354


Concrete and Aggregates


55,176


42,384


186,407


139,888


276,150


270,832


941,260


864,242


Light Materials:


Gypsum Wallboard


212,016


163,584


652,981


502,836


Gypsum Paperboard


23,321


28,525


83,701


81,327


235,337


192,109


736,682


584,163


Total Revenue

$

511,487


$

462,941


$

1,677,942


$

1,448,405


Segment Operating Earnings


Heavy Materials:


Cement (Wholly Owned)

$

60,938


$

71,281


$

209,811


$

206,348


Cement (Joint Venture)


11,377


8,555


23,631


24,785


Concrete and Aggregates


2,692


4,115


15,700


16,998


75,007


83,951


249,142


248,131


Light Materials:


Gypsum Wallboard


87,335


60,841


261,164


190,425


Gypsum Paperboard


7,805


2,349


17,200


6,667


95,140


63,190


278,364


197,092


Sub-total


170,147


147,141


527,506


445,223


Corporate General and Administrative Expense


(12,497

)


(12,851

)


(37,944

)


(32,986

)

Loss on Early Retirement of Senior Notes


-


-


-


(8,407

)

Other Non-Operating Income


2,210


3,207


911


5,941


Earnings before Interest and Income Taxes

$

159,860


$

137,497


$

490,473


$

409,771


* Excluding Intersegment and Joint Venture Revenue listed on Attachment 3

Attachment 3


Eagle Materials Inc.

Sales Volume, Average Net Sales Prices and Intersegment and Cement Revenue

(unaudited)


Sales Volume


Quarter Ended
December 31,


Nine Months Ended
December 31,


2022


2021


Change


2022


2021


Change


Cement (M Tons):


Wholly Owned

1,527


1,748


-13

%


5,313


5,583


-5

%

Joint Venture

172


215


-20

%


524


614


-15

%


1,699


1,963


-13

%


5,837


6,197


-6

%


Concrete (M Cubic Yards)

353


317


+11


1,210


1,063


+14

%


Aggregates (M Tons)

626


341


+84

%


2,333


1,183


+97


Gypsum Wallboard (MMSFs)

728


695


+5


2,309


2,194


+5

%


Paperboard (M Tons):


Internal

39


36


+8


115


109


+6

External

38


45


-16

%


131


143


-8

%


77


81


-5

%


246


252


-2

%


Average Net Sales Price*


Quarter Ended
December 31,


Nine Months Ended
December 31,


2022


2021


Change


2022


2021


Change


Cement (Ton)

$

134.36


$

118.44


+13%


$

131.44


$

117.49


+12%

Concrete (Cubic Yard)

$

134.42


$

122.36


+10%


$

132.46


$

120.17


+10%

Aggregates (Ton)

$

11.70


$

10.38


+13%


$

11.21


$

10.25


+9%

Gypsum Wallboard (MSF)

$

238.51


$

191.41


+25%


$

230.01


$

186.16


+24%

Paperboard (Ton)

$

594.93


$

585.54


+2%


$

603.73


$

535.55


+13%


*Net of freight and delivery costs billed to customers.


Intersegment and Cement Revenue


Quarter Ended
December 31,


Nine Months Ended
December 31,


2022


2021


2022


2021

Intersegment Revenue:


Cement

$

7,719


$

5,301


$

26,371


$

18,357

Paperboard


24,453


21,238


71,819


59,501


$

32,172


$

26,539


$

98,190


$

77,858


Cement Revenue:


Wholly Owned

$

220,974


$

228,448


$

754,853


$

724,354

Joint Venture


27,620


27,406


79,065


77,023


$

248,594


$

255,854


$

833,918


$

801,377

Attachment 4


Eagle Materials Inc.

Consolidated Balance Sheets

(dollars in thousands)

(unaudited)


December 31,


March 31,


2022


2021


2022*

ASSETS


Current Assets –


Cash and Cash Equivalents


$

60,937


$

17,392


$

19,416


Accounts and Notes Receivable, net


172,543


170,661


176,276


Inventories


247,155


211,978


236,661


Federal Income Tax Receivable


5,466


8,890


7,202


Prepaid and Other Assets


5,177


6,426


3,172


Total Current Assets


491,278


415,347


442,727


Property, Plant and Equipment, net


1,641,638


1,626,990


1,616,539


Investments in Joint Venture


85,268


79,434


80,637


Operating Lease Right of Use Asset


20,651


23,923


23,856


Notes Receivable


8,556


8,486


8,485


Goodwill and Intangibles


467,703


389,002


387,898


Other Assets


15,076


16,939


19,510


$

2,730,170


$

2,560,121


$

2,579,652


LIABILITIES AND STOCKHOLDERS’ EQUITY


Current Liabilities –


Accounts Payable


$

106,571


$

99,465


$

113,679


Accrued Liabilities


85,723


87,206


86,754


Current Portion of Long-Term Debt


10,000


-


-


Operating Lease Liabilities


6,006


7,004


7,118


Total Current Liabilities


208,300


193,675


207,551


Long-term Liabilities


62,545


67,578


67,911


Bank Credit Facility


130,000


100,000


200,000


Bank Term Loan


185,000


-


-


2.500% Senior Unsecured Notes due 2031


739,215


737,949


738,265


Deferred Income Taxes


239,596


238,671


232,369


Stockholders’ Equity –


Preferred Stock, Par Value $0.01; Authorized 5,000,000


Shares; None Issued


-


-


-


Common Stock, Par Value $0.01; Authorized 100,000,000

Shares; Issued and Outstanding 36,242,274; 39,766,043 and

38,710,929 Shares, respectively


362


398


387


Capital in Excess of Par Value


-


-


-


Accumulated Other Comprehensive Losses


(3,105

)


(3,359

)


(3,175

)

Retained Earnings


1,168,257


1,225,209


1,136,344


Total Stockholders’ Equity


1,165,514


1,222,248


1,133,556


$

2,730,170


$

2,560,121


$

2,579,652


*From audited financial statements

Attachment 5


Eagle Materials Inc.

Depreciation, Depletion and Amortization by Lines of Business

(dollars in thousands)

(unaudited) 


The following table presents Depreciation, Depletion and Amortization by lines of business for the quarters ended December 31, 2022 and 2021: 


Depreciation, Depletion and Amortization


Quarter Ended
December 31,


2022


2021


Cement

$

20,582


$

19,933


Concrete and Aggregates


4,402


2,294


Gypsum Wallboard


5,387


5,598


Paperboard


3,738


3,685


Corporate and Other


706


684


$

34,815


$

32,194


Attachment 6 


Eagle Materials Inc.

Reconciliation of Non-GAAP Financial Measures

(dollars in thousands)

(unaudited)

EBITDA and Adjusted EBITDA

We present Earnings before Interest, Taxes, Depreciation and Amortization (EBITDA) and Adjusted EBITDA to provide more consistent comparison of operating performance from period to period. EBITDA is a non-GAAP financial measure that provides supplemental information regarding the operating performance of our business without regard to financing methods, capital structures or historical cost basis. Adjusted EBITDA is also a non-GAAP financial measure that further excludes the impact from non-routine items and stock-based compensation. Management uses EBITDA and Adjusted EBITDA as alternative bases for comparing the operating performance of Eagle from period to period and for purposes of its budgeting and planning processes. Adjusted EBITDA may not be comparable to similarly titled measures of other companies because other companies may not calculate Adjusted EBITDA in the same manner. Neither EBITDA nor Adjusted EBITDA should be considered in isolation or as an alternative to net income, cash flow from operations or any other measure of financial performance or liquidity in accordance with GAAP. The following shows the calculations of EBITDA and Adjusted EBITDA and reconciles them to net earnings in accordance with GAAP for the quarters ended December 31, 2022 and 2021:


Quarter Ended
December 31,


2022

2021


Net Earnings, as reported

$

117,184

$

102,479


Income Tax Expense


33,744


29,367


Interest Expense


8,932


5,651


Depreciation, Depletion and Amortization


34,815


32,194


EBITDA

$

194,675

$

169,691


Stock-based Compensation


4,088


4,261


Adjusted EBITDA

$

198,763

$

173,952


Contacts

For additional information, contact at 214-432-2000.

Michael R. Haack
President and Chief Executive Officer

D. Craig Kesler
Executive Vice President and Chief Financial Officer

Robert S. Stewart
Executive Vice President, Strategy, Corporate Development and Communications

HOUSTON--(BUSINESS WIRE)--Oceaneering International, Inc. (“Oceaneering”) (NYSE:OII) announces that it will report financial results for the fourth quarter of 2022 on Thursday, February 23, 2023, after the close of trading on the New York Stock Exchange. The earnings release will be available on Oceaneering’s website at oceaneering.com.

Oceaneering also has scheduled a conference call and webcast related to its fourth quarter results for Friday, February 24, 2023, at 10:00 a.m. Central Time. Interested parties may listen to the call through a webcast link posted in the Investor Relations section of Oceaneering’s website. A replay of the conference call will be made available on the website approximately two hours after the live call concludes.

Oceaneering is a global technology company delivering engineered services and products and robotic solutions to the offshore energy, defense, aerospace, manufacturing, and entertainment industries.

For more information on Oceaneering, please visit oceaneering.com.


Contacts

Mark Peterson
Vice President, Corporate Development and Investor Relations
Oceaneering International, Inc.
713-329-4507
This email address is being protected from spambots. You need JavaScript enabled to view it.

  • Reported net income attributable to Valero stockholders of $3.1 billion, or $8.15 per share, for the fourth quarter and $11.5 billion, or $29.04 per share, for the year
  • Reported adjusted net income attributable to Valero stockholders of $3.2 billion, or $8.45 per share, for the fourth quarter and $11.6 billion, or $29.16 per share, for the year
  • Reduced debt by $2.7 billion in 2022, bringing Valero’s aggregate debt reduction since the second half of 2021 to $4.0 billion
  • Successfully commenced operations of the new DGD Port Arthur plant in the fourth quarter

SAN ANTONIO--(BUSINESS WIRE)--Valero Energy Corporation (NYSE: VLO, “Valero”) today reported net income attributable to Valero stockholders of $3.1 billion, or $8.15 per share, for the fourth quarter of 2022, compared to $1.0 billion, or $2.46 per share, for the fourth quarter of 2021. Excluding the adjustments shown in the accompanying earnings release tables, adjusted net income attributable to Valero stockholders was $3.2 billion, or $8.45 per share, for the fourth quarter of 2022, compared to $988 million, or $2.41 per share, for the fourth quarter of 2021.


For 2022, net income attributable to Valero stockholders was $11.5 billion, or $29.04 per share, compared to $930 million, or $2.27 per share, in 2021. Excluding the adjustments shown in the accompanying earnings release tables, adjusted net income attributable to Valero stockholders was $11.6 billion, or $29.16 per share, in 2022, compared to $1.2 billion, or $2.81 per share, in 2021.

Refining

The Refining segment reported operating income of $4.3 billion for the fourth quarter of 2022, compared to $1.3 billion for the fourth quarter of 2021. Adjusted operating income for the fourth quarter of 2022 was $4.4 billion, compared to $1.1 billion for the fourth quarter of 2021. Refining throughput volumes averaged 3.0 million barrels per day in the fourth quarter of 2022.

“Our refineries operated at a 97 percent capacity utilization rate in the fourth quarter, which is the highest utilization rate for our system since 2018,” said Joe Gorder, Valero’s Chairman and Chief Executive Officer, “I am also proud to report that 2022 was Valero’s best year ever for combined employee and contractor safety, which is a testament to our long-standing commitment to safe, reliable and environmentally responsible operations.”

Renewable Diesel

The Renewable Diesel segment, which consists of the Diamond Green Diesel (DGD) joint venture, reported $261 million of operating income for the fourth quarter of 2022, compared to $150 million for the fourth quarter of 2021. Segment sales volumes averaged 2.4 million gallons per day in the fourth quarter of 2022, which was 851 thousand gallons per day higher than the fourth quarter of 2021. The higher sales volumes were due to the impact of additional volumes from the DGD St. Charles plant expansion and the fourth quarter 2022 startup of the DGD Port Arthur plant.

Ethanol

The Ethanol segment reported $7 million of operating income for the fourth quarter of 2022, compared to $474 million for the fourth quarter of 2021. Adjusted operating income for the fourth quarter of 2022 was $69 million, compared to $475 million for the fourth quarter of 2021. Ethanol production volumes averaged 4.1 million gallons per day in the fourth quarter of 2022, which was 340 thousand gallons per day lower than the fourth quarter of 2021. The higher operating income in the fourth quarter of 2021 was primarily attributed to high ethanol prices due to strong demand and low inventories.

Corporate and Other

General and administrative expenses were $282 million in the fourth quarter of 2022, compared to $286 million in the fourth quarter of 2021. General and administrative expenses were $934 million for the year. The effective tax rate for 2022 was 22 percent.

Investing and Financing Activities

Net cash provided by operating activities was $4.1 billion in the fourth quarter of 2022. Included in this amount was a $9 million unfavorable change in working capital and $142 million of net cash provided by operating activities associated with the other joint venture member’s share of DGD, excluding changes in DGD’s working capital. Excluding these items, adjusted net cash provided by operating activities was $4.0 billion in the fourth quarter of 2022.

Net cash provided by operating activities in 2022 was $12.6 billion. Included in this amount was a $1.6 billion unfavorable impact from working capital and $436 million of net cash provided by operating activities associated with the other joint venture member’s share of DGD, excluding changes in DGD’s working capital. Excluding these items, adjusted net cash provided by operating activities in 2022 was $13.8 billion.

Capital investments totaled $640 million in the fourth quarter of 2022, of which $349 million was for sustaining the business, including costs for turnarounds, catalysts and regulatory compliance. Excluding capital investments attributable to the other joint venture member’s share of DGD and those related to other variable interest entities, capital investments attributable to Valero were $538 million in the fourth quarter of 2022 and $2.3 billion in 2022, which was higher than the annual guidance primarily due to spend timing on the Port Arthur Coker project and the accelerated completion of the DGD Port Arthur plant.

Valero returned 45 percent of adjusted net cash provided by operating activities to stockholders in 2022.

Valero continues to target a long-term total payout ratio between 40 and 50 percent of adjusted net cash provided by operating activities. Valero defines total payout ratio as the sum of dividends and stock buybacks divided by net cash provided by operating activities adjusted for changes in working capital and DGD’s net cash provided by operating activities, excluding changes in its working capital, attributable to the other joint venture member’s share of DGD.

Valero further reduced its debt by $442 million in the fourth quarter. This reduction, combined with a series of debt reduction and refinancing transactions completed since the second half of 2021, have collectively reduced Valero’s debt by over $4.0 billion.

Liquidity and Financial Position

Valero ended 2022 with $9.2 billion of total debt, $2.4 billion of finance lease obligations and $4.9 billion of cash and cash equivalents, compared to $13.0 billion of total debt, $1.6 billion of finance lease obligations and $2.3 billion of cash and cash equivalents at the end of the first quarter of 2021. The debt to capitalization ratio, net of cash and cash equivalents, was approximately 21 percent as of December 31, 2022, down from the pandemic high of 40 percent as of March 31, 2021.

Strategic Update

The DGD project adjacent to the Port Arthur refinery (DGD Port Arthur plant), which has a production capacity of 470 million gallons per year of renewable diesel and 20 million gallons per year of renewable naphtha, was commissioned and started up in the fourth quarter. The project was completed under budget and ahead of the original schedule. Total annual DGD production capacity is now approximately 1.2 billion gallons of renewable diesel and 50 million gallons of renewable naphtha.

Refinery optimization projects that are expected to reduce costs and improve margin capture are progressing on schedule. The Port Arthur Coker project is expected to be completed in the second quarter of 2023 and to increase the refinery’s throughput capacity, while also improving turnaround efficiency.

BlackRock and Navigator’s carbon sequestration project is still expected to begin startup activities in late 2024. Valero expects to be the anchor shipper with eight of its ethanol plants connected to this system, which is expected to result in the production of a lower carbon intensity ethanol product that should significantly improve the margin profile and competitive positioning of the ethanol business.

“We continue to advance other low-carbon opportunities, such as sustainable aviation fuel, renewable hydrogen, and additional renewable naphtha and carbon sequestration projects,” said Gorder. “Our gated process helps ensure these projects meet our minimum return threshold.”

Conference Call

Valero’s senior management will hold a conference call at 10 a.m. ET today to discuss this earnings release and to provide an update on operations and strategy.

About Valero

Valero Energy Corporation, through its subsidiaries (collectively, “Valero”), is a multinational manufacturer and marketer of petroleum-based and low-carbon liquid transportation fuels and petrochemical products, and it sells its products primarily in the United States (“U.S.”), Canada, the United Kingdom (“U.K.”), Ireland and Latin America. Valero owns 15 petroleum refineries located in the U.S., Canada and the U.K. with a combined throughput capacity of approximately 3.2 million barrels per day. Valero is a joint venture member in Diamond Green Diesel Holdings LLC, which owns two renewable diesel plants located in the U.S. Gulf Coast region with a production capacity of approximately 1.2 billion gallons per year, and Valero owns 12 ethanol plants located in the U.S. Mid-Continent region with a combined production capacity of approximately 1.6 billion gallons per year. Valero manages its operations through its Refining, Renewable Diesel, and Ethanol segments. Please visit investorvalero.com for more information.

Valero Contacts

Investors:
Homer Bhullar, Vice President – Investor Relations and Finance, 210-345-1982
Eric Herbort, Director – Investor Relations, 210-345-3331
Gautam Srivastava, Senior Manager – Investor Relations, 210-345-3992

Media:
Lillian Riojas, Executive Director – Media Relations and Communications, 210-345-5002

Safe-Harbor Statement

Statements contained in this release and the accompanying tables that state Valero’s or management’s expectations or predictions of the future are forward-looking statements intended to be covered by the safe harbor provisions of the Securities Act of 1933 and the Securities Exchange Act of 1934. The words “believe,” “expect,” “should,” “estimates,” “intend,” “target,” “will,” “plans,” “forecast,” and other similar expressions identify forward-looking statements. Forward-looking statements in this release and the accompanying tables include those relating to Valero’s greenhouse gas emissions targets, expected timing of completion and performance of projects, future market and industry conditions, future operating and financial performance, and management of future risks. It is important to note that actual results could differ materially from those projected in such forward-looking statements based on numerous factors, including those outside of Valero’s control, such as legislative or political changes or developments, market dynamics, cyberattacks, weather events, and other matters affecting Valero’s operations or the demand for Valero’s products. These factors also include, but are not limited to, the uncertainties that remain with respect to the Russia-Ukraine conflict, the impact of inflation on margins and costs, economic activity levels, the COVID-19 pandemic, variants of the COVID-19 virus, governmental and societal responses thereto, and the adverse effects the foregoing may have on Valero’s business or economic conditions generally. For more information concerning these and other factors that could cause actual results to differ from those expressed or forecasted, see Valero’s annual report on Form 10-K, quarterly reports on Form 10‑Q, and other reports filed with the Securities and Exchange Commission and available on Valero’s website at www.valero.com.

Use of Non-GAAP Financial Information

This earnings release and the accompanying earnings release tables include references to financial measures that are not defined under U.S. generally accepted accounting principles (GAAP). These non-GAAP measures include adjusted net income attributable to Valero stockholders, adjusted earnings per common share – assuming dilution, Refining margin, Renewable Diesel margin, Ethanol margin, adjusted Refining operating income, adjusted Renewable Diesel operating income, adjusted Ethanol operating income, adjusted net cash provided by operating activities, and capital investments attributable to Valero. These non-GAAP financial measures have been included to help facilitate the comparison of operating results between periods. See the accompanying earnings release tables for a reconciliation of non-GAAP measures to their most directly comparable GAAP measures. Note (h) to the earnings release tables provides reasons for the use of these non-GAAP financial measures.


VALERO ENERGY CORPORATION

EARNINGS RELEASE TABLES

FINANCIAL HIGHLIGHTS

(millions of dollars, except per share amounts)

(unaudited)


Three Months Ended
December 31,


Year Ended
December 31,


2022


2021


2022


2021

Statement of income data


Revenues

$

41,746


$

35,903


$

176,383


$

113,977


Cost of sales:


Cost of materials and other (a) (b)


34,811


31,849


150,770


102,714


Operating expenses (excluding depreciation and

amortization expense reflected below) (b)


1,638


1,558


6,389


5,776


Depreciation and amortization expense (c)


622


586


2,428


2,358


Total cost of sales


37,071


33,993


159,587


110,848


Asset impairment loss (d)


61


61


Other operating expenses


26


18


66


87


General and administrative expenses (excluding

depreciation and amortization expense reflected below) (e)


282


286


934


865


Depreciation and amortization expense


11


12


45


47


Operating income


4,295


1,594


15,690


2,130


Other income (expense), net (f)


92


(163

)


179


16


Interest and debt expense, net of capitalized interest


(137

)


(152

)


(562

)


(603

)

Income before income tax expense


4,250


1,279


15,307


1,543


Income tax expense (g)


1,018


169


3,428


255


Net income


3,232


1,110


11,879


1,288


Less: Net income attributable to noncontrolling interests


119


101


351


358


Net income attributable to Valero Energy Corporation

stockholders

$

3,113


$

1,009


$

11,528


$

930


Earnings per common share

$

8.15


$

2.47


$

29.05


$

2.27


Weighted-average common shares outstanding (in millions)


380


408


395


407


Earnings per common share – assuming dilution

$

8.15


$

2.46


$

29.04


$

2.27


Weighted-average common shares outstanding –

assuming dilution (in millions)


381


408


396


407


See Notes to Earnings Release Tables.


VALERO ENERGY CORPORATION

EARNINGS RELEASE TABLES

FINANCIAL HIGHLIGHTS BY SEGMENT

(millions of dollars)

(unaudited)


Refining


Renewable
Diesel


Ethanol


Corporate
and
Eliminations


Total

Three months ended December 31, 2022


Revenues:


Revenues from external customers

$

39,566


$

1,066


$

1,114


$


$

41,746

Intersegment revenues


32


528


233


(793

)


Total revenues


39,598


1,594


1,347


(793

)


41,746

Cost of sales:


Cost of materials and other


33,280


1,221


1,095


(785

)


34,811

Operating expenses (excluding depreciation and

amortization expense reflected below)


1,398


77


161


2


1,638

Depreciation and amortization expense


565


35


22


622

Total cost of sales


35,243


1,333


1,278


(783

)


37,071

Asset impairment loss (d)


61


61

Other operating expenses


25


1


26

General and administrative expenses (excluding

depreciation and amortization expense reflected

below)


282


282

Depreciation and amortization expense


11


11

Operating income by segment

$

4,330


$

261


$

7


$

(303

)


$

4,295


Three months ended December 31, 2021


Revenues:


Revenues from external customers

$

33,521


$

684


$

1,698


$


$

35,903

Intersegment revenues


7


253


174


(434

)


Total revenues


33,528


937


1,872


(434

)


35,903

Cost of sales:


Cost of materials and other (a)


30,342


714


1,224


(431

)


31,849

Operating expenses (excluding depreciation and

amortization expense reflected below)


1,358


48


153


(1

)


1,558

Depreciation and amortization expense


543


23


20


586

Total cost of sales


32,243


785


1,397


(432

)


33,993

Other operating expenses


15


2


1


18

General and administrative expenses (excluding

depreciation and amortization expense reflected

below)


286


286

Depreciation and amortization expense


12


12

Operating income by segment

$

1,270


$

150


$

474


$

(300

)


$

1,594


See Operating Highlights by Segment.

See Notes to Earnings Release Tables.


VALERO ENERGY CORPORATION

EARNINGS RELEASE TABLES

FINANCIAL HIGHLIGHTS BY SEGMENT

(millions of dollars)

(unaudited)


Refining


Renewable
Diesel


Ethanol


Corporate
and
Eliminations


Total

Year ended December 31, 2022


Revenues:


Revenues from external customers

$

168,154


$

3,483


$

4,746


$


$

176,383

Intersegment revenues


56


2,018


740


(2,814

)


Total revenues


168,210


5,501


5,486


(2,814

)


176,383

Cost of sales:


Cost of materials and other (a)


144,588


4,350


4,628


(2,796

)


150,770

Operating expenses (excluding depreciation and

amortization expense reflected below)


5,509


255


625


6,389

Depreciation and amortization expense (c)


2,247


122


59


2,428

Total cost of sales


152,344


4,727


5,312


(2,796

)


159,587

Asset impairment loss (d)


61


61

Other operating expenses


63


3


66

General and administrative expenses (excluding

depreciation and amortization expense reflected

below) (e)


934


934

Depreciation and amortization expense


45


45

Operating income by segment

$

15,803


$

774


$

110


$

(997

)


$

15,690


Year ended December 31, 2021


Revenues:


Revenues from external customers

$

106,947


$

1,874


$

5,156


$


$

113,977

Intersegment revenues


14


468


433


(915

)


Total revenues


106,961


2,342


5,589


(915

)


113,977

Cost of sales:


Cost of materials and other (a) (b)


97,759


1,438


4,428


(911

)


102,714

Operating expenses (excluding depreciation and

amortization expense reflected below) (b)


5,088


134


556


(2

)


5,776

Depreciation and amortization expense (c)


2,169


58


131


2,358

Total cost of sales


105,016


1,630


5,115


(913

)


110,848

Other operating expenses


83


3


1


87

General and administrative expenses (excluding

depreciation and amortization expense reflected

below)


865


865

Depreciation and amortization expense


47


47

Operating income by segment

$

1,862


$

709


$

473


$

(914

)


$

2,130


See Operating Highlights by Segment.

See Notes to Earnings Release Tables.


VALERO ENERGY CORPORATION

EARNINGS RELEASE TABLES

RECONCILIATION OF NON-GAAP MEASURES TO MOST COMPARABLE AMOUNTS

REPORTED UNDER U.S. GAAP (h)

(millions of dollars)

(unaudited)


Three Months Ended
December 31,


Year Ended
December 31,


2022


2021


2022


2021

Reconciliation of net income attributable to Valero Energy

Corporation stockholders to adjusted net income

attributable to Valero Energy Corporation stockholders


Net income attributable to Valero Energy Corporation

stockholders

$

3,113


$

1,009


$

11,528


$

930


Adjustments:


Modification of renewable volume obligation (RVO) (a)


(220

)


(104

)


(1

)

Income tax expense related to modification of RVO


49


23


Modification of RVO, net of taxes


(171

)


(81

)


(1

)

Gain on sale of ethanol plant (c)


(23

)


Income tax expense related to gain on sale of ethanol plant


5


Gain on sale of ethanol plant, net of taxes


(18

)


Asset impairment loss (d)


61


61


Income tax benefit related to asset impairment loss


(14

)


(14

)


Asset impairment loss, net of taxes


47


47


Environmental reserve adjustment (e)


20


Income tax benefit related to environmental reserve adjustment


(5

)


Environmental reserve adjustment, net of taxes


15


Pension settlement charge (f)


58


58


Income tax benefit related to pension settlement charge


(13

)


(13

)


Pension settlement charge, net of taxes


45


45


Loss (gain) on early redemption and retirement of debt (f)


(38

)


193


(14

)


193


Income tax (benefit) expense related to loss (gain) on early

redemption and retirement of debt


9


(43

)


3


(43

)

Loss (gain) on early redemption and retirement of debt,

net of taxes


(29

)


150


(11

)


150


Foreign withholding tax (g)


51


51


Change in estimated useful life of ethanol plant (c)


48


Income tax benefit related to the change in estimated useful

life of ethanol plant


(11

)

Change in estimated useful life of ethanol plant,

net of taxes


37


Gain on sale of MVP interest (f)


(62

)

Income tax expense related to gain on sale of MVP interest


14


Gain on sale of MVP interest, net of taxes


(48

)

Diamond Pipeline asset impairment loss (f)


24


Income tax benefit related to Diamond Pipeline asset

impairment loss


(5

)

Diamond Pipeline asset impairment loss, net of taxes


19


Income tax expense related to changes in statutory tax rates (g)


64


Total adjustments


114


(21

)


48


221


Adjusted net income attributable to

Valero Energy Corporation stockholders

$

3,227


$

988


$

11,576


$

1,151


See Notes to Earnings Release Tables.


VALERO ENERGY CORPORATION

EARNINGS RELEASE TABLES

RECONCILIATION OF NON-GAAP MEASURES TO MOST COMPARABLE AMOUNTS

REPORTED UNDER U.S. GAAP (h)

(millions of dollars)

(unaudited)


Three Months Ended
December 31,


Year Ended
December 31,


2022


2021


2022


2021

Reconciliation of earnings per common share –

assuming dilution to adjusted earnings per common

share – assuming dilution


Earnings per common share – assuming dilution

$

8.15


$

2.46


$

29.04


$

2.27


Adjustments:


Modification of RVO (a)


(0.42

)


(0.20

)


Gain on sale of ethanol plant (c)


(0.05

)


Asset impairment loss (d)


0.13


0.12


Environmental reserve adjustment (e)


0.04


Pension settlement charge (f)


0.12


0.11


Loss (gain) on early redemption and retirement of debt (f)


(0.08

)


0.37


(0.03

)


0.37


Foreign withholding tax (g)


0.13


0.13


Change in estimated useful life of ethanol plant (c)


0.09


Gain on sale of MVP interest (f)


(0.12

)

Diamond Pipeline asset impairment loss (f)


0.04


Income tax expense related to changes in statutory tax rates (g)


0.16


Total adjustments


0.30


(0.05

)


0.12


0.54


Adjusted earnings per common share – assuming dilution

$

8.45


$

2.41


$

29.16


$

2.81


See Notes to Earnings Release Tables.


VALERO ENERGY CORPORATION

EARNINGS RELEASE TABLES

RECONCILIATION OF NON-GAAP MEASURES TO MOST COMPARABLE AMOUNTS

REPORTED UNDER U.S. GAAP (h)

(millions of dollars)

(unaudited)


Three Months Ended

December 31,


Year Ended

December 31,


2022


2021


2022


2021

Reconciliation of operating income by segment to segment

margin, and reconciliation of operating income by segment

to adjusted operating income by segment


Refining segment


Refining operating income

$

4,330


$

1,270


$

15,803


$

1,862


Adjustments:


Modification of RVO (a)


(220

)


(104

)


(1

)

Operating expenses (excluding depreciation and

amortization expense reflected below) (b)


1,398


1,358


5,509


5,088


Depreciation and amortization expense


565


543


2,247


2,169


Other operating expenses


25


15


63


83


Refining margin

$

6,318


$

2,966


$

23,518


$

9,201


Refining operating income

$

4,330


$

1,270


$

15,803


$

1,862


Adjustments:


Modification of RVO (a)


(220

)


(104

)


(1

)

Other operating expenses


25


15


63


83


Adjusted Refining operating income

$

4,355


$

1,065


$

15,762


$

1,944


Renewable Diesel segment


Renewable Diesel operating income

$

261


$

150


$

774


$

709


Adjustments:


Operating expenses (excluding depreciation and

amortization expense reflected below)


77


48


255


134


Depreciation and amortization expense


35


23


122


58


Other operating expenses


2


3


Renewable Diesel margin

$

373


$

223


$

1,151


$

904


Renewable Diesel operating income

$

261


$

150


$

774


$

709


Adjustment: Other operating expenses


2


3


Adjusted Renewable Diesel operating income

$

261


$

152


$

774


$

712


See Notes to Earnings Release Tables.


Contacts

Valero Contacts
Investors:
Homer Bhullar, Vice President – Investor Relations and Finance, 210-345-1982
Eric Herbort, Director – Investor Relations, 210-345-3331
Gautam Srivastava, Senior Manager – Investor Relations, 210-345-3992

Media:
Lillian Riojas, Executive Director – Media Relations and Communications, 210-345-5002


Read full story here
Offshore Source Logo

Offshore Source keeps you updated with relevant information concerning the Offshore Energy Sector.

Any views or opinions represented on this website belong solely to the author and do not represent those of the people, institutions or organizations that Offshore Source or collaborators may or may not have been associated with in a professional or personal capacity, unless explicitly stated.

Corporate Offices

Technology Systems Corporation
8502 SW Kansas Ave
Stuart, FL 34997

info@tscpublishing.com