Business Wire News

AUSTIN, Texas--(BUSINESS WIRE)--USA Compression Partners, LP (NYSE: USAC) (“USA Compression” or the “Partnership”) announced today its financial and operating results for fourth-quarter 2022.


Fourth-Quarter 2022 Highlights

  • Record total revenues of $190.1 million for fourth-quarter 2022, compared to $159.9 million for fourth-quarter 2021.
  • Net income was $8.4 million for fourth-quarter 2022, compared to $3.1 million for fourth-quarter 2021.
  • Net cash provided by operating activities was $82.1 million for fourth-quarter 2022, compared to $81.1 million for fourth-quarter 2021.
  • Adjusted EBITDA of $113.0 million for fourth-quarter 2022, compared to $99.2 million for fourth-quarter 2021.
  • Distributable Cash Flow of $60.6 million for fourth-quarter 2022, compared to $52.0 million for fourth-quarter 2021.
  • Paid cash distribution of $0.525 per common unit for fourth-quarter 2022, consistent with fourth-quarter 2021.
  • Distributable Cash Flow Coverage was 1.18x for fourth-quarter 2022, compared to 1.02x for fourth-quarter 2021.

“Our fourth-quarter results were indicative of the vital importance of natural gas compression within the midstream and broader energy-market value chain. We again experienced sequential-quarter increases in revenues, Adjusted EBITDA, and revenue-generating horsepower, along with continued improvements to pricing,” commented Eric D. Long, USA Compression’s President and Chief Executive Officer. “Additionally, our fourth-quarter results featured a quarterly record for revenue. This record quarterly result was made possible by sequential-quarter improvements to our fleet utilization, which surpassed a 91-percent exit rate for the fourth quarter, and by continued improvements to our quarter-over-quarter average price per horsepower per month. Our fourth-quarter performance further reduced our leverage ratio while generating distribution coverage of 1.18 times, representing a more than 10% improvement over third-quarter 2022.”

Expansion capital expenditures were $46.1 million, maintenance capital expenditures were $3.7 million, and cash interest expense, net was $36.2 million for the fourth-quarter 2022.

On January 12, 2023, the Partnership announced a fourth-quarter cash distribution of $0.525 per common unit, which corresponds to an annualized distribution rate of $2.10 per common unit. The distribution was paid on February 3, 2023, to common unitholders of record as of the close of business on January 23, 2023.

Operational and Financial Data


Three Months Ended


Year Ended


December 31,
2022


September 30,
2022


December 31,
2021


December 31,
2022


December 31,
2021

Operational data:


Fleet horsepower (at period end) (1)


3,716,854


3,711,205


3,689,018


3,716,854


3,689,018


Revenue-generating horsepower (at period end) (2)


3,199,548


3,128,845


2,964,206


3,199,548


2,964,206


Average revenue-generating horsepower (3)


3,171,899


3,090,910


2,950,623


3,067,279


2,951,013


Revenue-generating compression units (at period end)


4,116


4,034


3,942


4,116


3,942


Horsepower utilization (at period end) (4)


91.8

%


90.9

%


82.7

%


91.8

%


82.7

%

Average horsepower utilization (for the period) (4)


91.3

%


90.3

%


82.9

%


88.6

%


82.7

%


Financial data ($ in thousands, except per horsepower data):


Total revenues

$

190,112


$

179,613


$

159,943


$

704,598


$

632,645


Average revenue per revenue-generating horsepower per month (5)

$

17.81


$

17.53


$

16.62


$

17.35


$

16.60


Net income

$

8,366


$

9,612


$

3,105


$

30,318


$

10,279


Operating income

$

46,693


$

45,103


$

36,336


$

169,293


$

140,872


Net cash provided by operating activities

$

82,099


$

49,209


$

81,057


$

260,590


$

265,425


Gross margin

$

64,237


$

61,388


$

49,698


$

233,585


$

199,487


Adjusted gross margin (6)

$

124,119


$

120,160


$

108,945


$

470,262


$

438,256


Adjusted gross margin percentage (7)


65.3

%


66.9

%


68.1

%


66.7

%


69.3

%

Adjusted EBITDA (6)

$

112,991


$

109,156


$

99,205


$

425,978


$

398,380


Adjusted EBITDA percentage (7)


59.4

%


60.8

%


62.0

%


60.5

%


63.0

%

Distributable Cash Flow (6)

$

60,596


$

55,181


$

52,039


$

221,499


$

209,128


____________________________________

(1)

Fleet horsepower is horsepower for compression units that have been delivered to the Partnership (and excludes units on order). As of December 31, 2022, the Partnership had 165,000 large horsepower on order for delivery during 2023.

(2)

Revenue-generating horsepower is horsepower under contract for which the Partnership is billing a customer.

(3)

Calculated as the average of the month-end revenue-generating horsepower for each of the months in the period.

(4)

Horsepower utilization is calculated as (i) the sum of (a) revenue-generating horsepower; (b) horsepower in the Partnership’s fleet that is under contract but is not yet generating revenue; and (c) horsepower not yet in the Partnership’s fleet that is under contract but not yet generating revenue and that is subject to a purchase order, divided by (ii) total available horsepower less idle horsepower that is under repair.


Horsepower utilization based on revenue-generating horsepower and fleet horsepower was 86.1%, 84.3%, and 80.4% at December 31, 2022, September 30, 2022, and December 31, 2021, respectively.


Average horsepower utilization based on revenue-generating horsepower and fleet horsepower was 85.4%, 83.4%, and 80.0% for the three months ended December 31, 2022, September 30, 2022, and December 31, 2021, respectively. Average horsepower utilization based on revenue-generating horsepower and fleet horsepower was 82.9% and 79.8% for the years ended December 31, 2022 and 2021, respectively.

(5)

Calculated as the average of the result of dividing the contractual monthly rate, excluding standby or other temporary rates, for all units at the end of each month in the period by the sum of the revenue-generating horsepower at the end of each month in the period.

(6)

Adjusted gross margin, Adjusted EBITDA, and Distributable Cash Flow are all non-U.S. generally accepted accounting principles (“Non-GAAP”) financial measures. For the definition of each measure, as well as reconciliations of each measure to its most directly comparable financial measures calculated and presented in accordance with GAAP, see “Non-GAAP Financial Measures” below.

(7)

Adjusted gross margin percentage and Adjusted EBITDA percentage are calculated as a percentage of revenue.

Liquidity and Long-Term Debt

As of December 31, 2022, the Partnership was in compliance with all covenants under its $1.6 billion revolving credit facility. As of December 31, 2022, the Partnership had outstanding borrowings under the revolving credit facility of $646.0 million, $954.0 million of availability and, subject to compliance with the applicable financial covenants, available borrowing capacity of $333.1 million. As of December 31, 2022, the outstanding aggregate principal amount of the Partnership’s 6.875% senior notes due 2026 and 6.875% senior notes due 2027 was $725.0 million and $750.0 million, respectively.

Full-Year 2023 Outlook

USA Compression is providing its full-year 2023 guidance as follows:

  • Net income range of $75.0 million to $95.0 million;
  • A forward-looking estimate of net cash provided by operating activities is not provided because the items necessary to estimate net cash provided by operating activities, in particular the change in operating assets and liabilities, are not accessible or estimable at this time. The Partnership does not anticipate changes in operating assets and liabilities to be material, but changes in accounts receivable, accounts payable, accrued liabilities, and deferred revenue could be significant, such that the amount of net cash provided by operating activities would vary substantially from the amount of projected Adjusted EBITDA and Distributable Cash Flow;
  • Adjusted EBITDA range of $490.0 million to $510.0 million; and
  • Distributable Cash Flow range of $260.0 million to $280.0 million.

Conference Call

The Partnership will host a conference call today beginning at 11:00 a.m. Eastern Time (10:00 a.m. Central Time) to discuss fourth-quarter 2022 performance. The call will be broadcast live over the internet. Investors may participate by audio webcast, or if located in the U.S. or Canada, by phone. A replay will be available shortly after the call via the “Events” page of USA Compression’s Investor Relations website.

By Webcast:


Connect to the webcast via the “Events” page of USA Compression’s Investor Relations website at https://investors.usacompression.com. Please log in at least 10 minutes in advance to register and download any necessary software.


By Phone:


Dial (888) 440-5655 at least 10 minutes before the call and ask for the USA Compression Partners Earnings Call.

About USA Compression Partners, LP

USA Compression Partners, LP is a growth-oriented Delaware limited partnership that is one of the nation’s largest independent providers of natural gas compression services in terms of total compression fleet horsepower. USA Compression partners with a broad customer base composed of producers, processors, gatherers, and transporters of natural gas and crude oil. USA Compression focuses on providing natural gas compression services to infrastructure applications primarily in high-volume gathering systems, processing facilities, and transportation applications. More information is available at usacompression.com.

Non-GAAP Financial Measures

This news release includes the Non-GAAP financial measures of Adjusted gross margin, Adjusted EBITDA, Distributable Cash Flow, and Distributable Cash Flow Coverage Ratio.

Adjusted gross margin is defined as revenue less cost of operations, exclusive of depreciation and amortization expense. Management believes Adjusted gross margin is useful to investors as a supplemental measure of the Partnership’s operating profitability. Adjusted gross margin is primarily impacted by the pricing trends for service operations and cost of operations, including labor rates for service technicians, volume, and per-unit costs for lubricant oils, quantity and pricing of routine preventative maintenance on compression units, and property tax rates on compression units. Adjusted gross margin should not be considered an alternative to, or more meaningful than, gross margin or any other measure presented in accordance with GAAP. Moreover, the Partnership’s Adjusted gross margin, as presented, may not be comparable to similarly titled measures of other companies. Because the Partnership capitalizes assets, depreciation and amortization of equipment is a necessary element of its cost structure. To compensate for the limitations of Adjusted gross margin as a measure of the Partnership’s performance, management believes it important to consider gross margin determined under GAAP, as well as Adjusted gross margin, to evaluate the Partnership’s operating profitability.

Management views Adjusted EBITDA as one of its primary tools for evaluating the Partnership’s results of operations, and the Partnership tracks this item on a monthly basis as an absolute amount and as a percentage of revenue compared to the prior month, year-to-date, prior year, and budget. The Partnership defines EBITDA as net income (loss) before net interest expense, depreciation and amortization expense, and income tax expense (benefit). The Partnership defines Adjusted EBITDA as EBITDA plus impairment of compression equipment, impairment of goodwill, interest income on capital leases, unit-based compensation expense (benefit), severance charges, certain transaction expenses, loss (gain) on disposition of assets, and other. Adjusted EBITDA is used as a supplemental financial measure by management and external users of the Partnership’s financial statements, such as investors and commercial banks, to assess:

  • the financial performance of the Partnership’s assets without regard to the impact of financing methods, capital structure, or the historical cost basis of the Partnership’s assets;
  • the viability of capital expenditure projects and the overall rates of return on alternative investment opportunities;
  • the ability of the Partnership’s assets to generate cash sufficient to make debt payments and pay distributions; and
  • the Partnership’s operating performance as compared to those of other companies in its industry without regard to the impact of financing methods and capital structure.

Management believes Adjusted EBITDA provides useful information to investors because, when viewed in conjunction with the Partnership’s GAAP results and the accompanying reconciliations, it may provide a more complete assessment of the Partnership’s performance as compared to considering solely GAAP results. Management also believes that external users of the Partnership’s financial statements benefit from having access to the same financial measures that management uses to evaluate the results of the Partnership’s business.

Adjusted EBITDA should not be considered an alternative to, or more meaningful than, net income (loss), operating income (loss), cash flows from operating activities, or any other measure presented in accordance with GAAP. Moreover, the Partnership’s Adjusted EBITDA, as presented, may not be comparable to similarly titled measures of other companies.

Distributable Cash Flow is defined as net income (loss) plus non-cash interest expense, non-cash income tax expense (benefit), depreciation and amortization expense, unit-based compensation expense (benefit), impairment of compression equipment, impairment of goodwill, certain transaction expenses, severance charges, loss (gain) on disposition of assets, proceeds from insurance recovery, and other, less distributions on the Partnership’s Series A Preferred Units (“Preferred Units”) and maintenance capital expenditures.

Distributable Cash Flow should not be considered an alternative to, or more meaningful than, net income (loss), operating income (loss), cash flows from operating activities, or any other measure presented in accordance with GAAP. Moreover, the Partnership’s Distributable Cash Flow, as presented, may not be comparable to similarly titled measures of other companies.​

Management believes Distributable Cash Flow is an important measure of operating performance because it allows management, investors, and others to compare the cash flows that the Partnership generates (after distributions on the Partnership’s Preferred Units but prior to any retained cash reserves established by the Partnership’s general partner and the effect of the Distribution Reinvestment Plan) to the cash distributions that the Partnership expects to pay its common unitholders.

Distributable Cash Flow Coverage Ratio is defined as the period’s Distributable Cash Flow divided by distributions declared to common unitholders in respect of such period. Management believes Distributable Cash Flow Coverage Ratio is an important measure of operating performance because it permits management, investors, and others to assess the Partnership’s ability to pay distributions to common unitholders out of the cash flows the Partnership generates. The Partnership’s Distributable Cash Flow Coverage Ratio, as presented, may not be comparable to similarly titled measures of other companies.

This news release also contains a forward-looking estimate of Adjusted EBITDA and Distributable Cash Flow projected to be generated by the Partnership for its 2023 fiscal year. A forward-looking estimate of net cash provided by operating activities and reconciliations of the forward-looking estimates of Adjusted EBITDA and Distributable Cash Flow to net cash provided by operating activities are not provided because the items necessary to estimate net cash provided by operating activities, in particular the change in operating assets and liabilities, are not accessible or estimable at this time. The Partnership does not anticipate changes in operating assets and liabilities to be material, but changes in accounts receivable, accounts payable, accrued liabilities, and deferred revenue could be significant, such that the amount of net cash provided by operating activities would vary substantially from the amount of projected Adjusted EBITDA and Distributable Cash Flow.

See “Reconciliation of Non-GAAP Financial Measures” for Adjusted gross margin reconciled to gross margin, Adjusted EBITDA reconciled to net income and net cash provided by operating activities, and net income and net cash provided by operating activities reconciled to Distributable Cash Flow and Distributable Cash Flow Coverage Ratio.

Forward-Looking Statements

Some of the information in this news release may contain forward-looking statements. These statements can be identified by the use of forward-looking terminology including “may,” “believe,” “expect,” “intend,” “anticipate,” “estimate,” “continue,” “if,” “project,” “outlook,” “will,” “could,” “should,” or other similar words or the negatives thereof, and include the Partnership’s expectation of future performance contained herein, including as described under “Full-Year 2023 Outlook.” These statements discuss future expectations, contain projections of results of operations or of financial condition, or state other “forward-looking” information. You are cautioned not to place undue reliance on any forward-looking statements, which can be affected by assumptions used or by known risks or uncertainties. Consequently, no forward-looking statements can be guaranteed. When considering these forward-looking statements, you should keep in mind the risk factors noted below and other cautionary statements in this news release. The risk factors and other factors noted throughout this news release could cause actual results to differ materially from those contained in any forward-looking statement. Known material factors that could cause the Partnership’s actual results to differ materially from the results contemplated by such forward-looking statements include:

  • changes in general economic conditions, including inflation or supply chain disruptions and changes in economic conditions of the crude oil and natural gas industries, including any impact from the ongoing military conflict involving Russia and Ukraine;
  • changes in the long-term supply of and demand for crude oil and natural gas, including as a result of the severity and duration of world health events, including the COVID-19 pandemic, related economic repercussions, actions taken by governmental authorities and other third parties in response to such events, and the resulting disruption in the oil and gas industry and impact on demand for oil and gas;
  • competitive conditions in the Partnership’s industry, including competition for employees in a tight labor market;
  • changes in the availability and cost of capital, including changes to interest rates;
  • renegotiation of material terms of customer contracts;
  • actions taken by the Partnership’s customers, competitors, and third-party operators;
  • operating hazards, natural disasters, epidemics, pandemics (such as COVID-19), weather-related impacts, casualty losses, and other matters beyond the Partnership’s control;
  • operational challenges relating to COVID-19 and efforts to mitigate the spread of the virus, including logistical challenges, protecting the health and well-being of the Partnership’s employees, remote work arrangements, performance of contracts, and supply chain disruptions;
  • the deterioration of the financial condition of the Partnership’s customers, which may result in the initiation of bankruptcy proceedings with respect to certain customers;
  • the restrictions on the Partnership’s business that are imposed under the Partnership’s long-term debt agreements;
  • information technology risks, including the risk from cyberattacks;
  • the effects of existing and future laws and governmental regulations;
  • the effects of future litigation;
  • the Partnership’s ability to realize the anticipated benefits of acquisitions; and
  • other factors discussed in the Partnership’s filings with the SEC.

All forward-looking statements speak only as of the date of this news release and are expressly qualified in their entirety by the foregoing cautionary statements. Unless legally required, the Partnership undertakes no obligation to update publicly any forward-looking statements, whether as a result of new information, future events, or otherwise. Unpredictable or unknown factors not discussed herein also could have material adverse effects on forward-looking statements.


USA COMPRESSION PARTNERS, LP

CONDENSED CONSOLIDATED STATEMENTS OF OPERATIONS

(In thousands, except for per unit amounts Unaudited)


Three Months Ended


Year Ended


December 31,
2022


September 30,
2022


December 31,
2021


December 31,
2022


December 31,
2021

Revenues:


Contract operations

$

180,558


$

171,019


$

153,503


$

673,214


$

609,450


Parts and service


5,297


4,901


3,250


15,729


11,228


Related party


4,257


3,693


3,190


15,655


11,967


Total revenues


190,112


179,613


159,943


704,598


632,645


Costs and expenses:


Cost of operations, exclusive of depreciation and amortization


65,993


59,453


50,998


234,336


194,389


Depreciation and amortization


59,882


58,772


59,247


236,677


238,769


Selling, general, and administrative


17,436


14,663


13,470


61,278


56,082


Loss (gain) on disposition of assets


(443

)


1,118


(276

)


1,527


(2,588

)

Impairment of compression equipment


551


504


168


1,487


5,121


Total costs and expenses


143,419


134,510


123,607


535,305


491,773


Operating income


46,693


45,103


36,336


169,293


140,872


Other income (expense):


Interest expense, net


(37,991

)


(35,142

)


(32,966

)


(138,050

)


(129,826

)

Other


23


27


19


91


107


Total other expense


(37,968

)


(35,115

)


(32,947

)


(137,959

)


(129,719

)

Net income before income tax expense


8,725


9,988


3,389


31,334


11,153


Income tax expense


359


376


284


1,016


874


Net income


8,366


9,612


3,105


30,318


10,279


Less: distributions on Preferred Units


(12,187

)


(12,188

)


(12,187

)


(48,750

)


(48,750

)

Net loss attributable to common unitholders’ interests

$

(3,821

)


$

(2,576

)


$

(9,082

)


$

(18,432

)


$

(38,471

)


Weighted average common units outstanding – basic and diluted


98,051


97,968


97,151


97,780


97,068


Basic and diluted net loss per common unit

$

(0.04

)


$

(0.03

)


$

(0.09

)


$

(0.19

)


$

(0.40

)


Distributions declared per common unit for respective periods

$

0.525


$

0.525


$

0.525


$

2.10


$

2.10


USA COMPRESSION PARTNERS, LP

SELECTED BALANCE SHEET DATA

(In thousands, except unit amounts Unaudited)


December 31, 2022

Selected Balance Sheet data:


Total assets

$

2,665,724


Long-term debt, net

$

2,106,649


Total partners’ deficit

$

(116,299

)


Common units outstanding


98,227,656


USA COMPRESSION PARTNERS, LP

CONDENSED CONSOLIDATED STATEMENTS OF CASH FLOWS

(In thousands — Unaudited)


Three Months Ended


Year Ended


December 31,
2022


September 30,
2022


December 31,
2021


December 31,
2022


December 31,
2021

Net cash provided by operating activities

$

82,099


$

49,209


$

81,057


$

260,590


$

265,425


Net cash used in investing activities


(43,530

)


(43,545

)


(15,522

)


(129,945

)


(39,188

)

Net cash used in financing activities


(38,540

)


(5,658

)


(65,785

)


(130,610

)


(226,239

)


Contacts

Investor Contacts:

USA Compression Partners, LP

Mike Pearl
Chief Financial Officer
(832) 823-7306
This email address is being protected from spambots. You need JavaScript enabled to view it.

Julie McEwen
Controller
(512) 369-1389
This email address is being protected from spambots. You need JavaScript enabled to view it.


Read full story here

Company is one of only two U.S. electric utilities to be named to prestigious list

ORANGE, Conn.--(BUSINESS WIRE)--AVANGRID, Inc. (NYSE: AGR), a leading sustainable energy company and member of the Iberdrola Group, has announced it is one of two U.S. electric utilities to be named to the 2023 Sustainability Yearbook, S&P Global’s annual and comprehensive listing of the world’s most sustainable companies. This is the company’s third consecutive year appearing on the prestigious list.


“AVANGRID has and continues to demonstrate leadership in all aspects of ESG,” said Pedro Azagra, CEO of AVANGRID. “We believe that our strong track record of ESG commitments and execution against our goals ensures that we are a key company to lead the clean energy transition. We also benefit from the leadership Iberdrola, whose expertise is illustrated by their rank within the top 5% of S&P Global ESG Scores in the 2023 Yearbook. Our commitment to sustainability influences all of our actions, investments and strategies.”

To be included in the Yearbook, companies are assessed using the industry specific Corporate Sustainability Assessment (CSA) questionnaire and methodology reflecting a company’s score compared to its industry peers. Companies must be in the top 15% of their industry and achieve an S&P Global Sustainability Score within 30% of their industry’s top-performing company. AVAGNRID’s earned a CSA score that is in the 90th percentile relative to peers and is two times the electric utility average. AVANGRID earned an overall ESG score of 75 out of 100.

The 2023 edition of the Yearbook is the result of the analysis of 61 different industries and a detailed assessment of more than 7,800 companies, for which more than 14 million data points were collected. The results of this assessment help investors identify companies that are successfully addressing the opportunities and risks of the global sustainability challenge.

“AVANGRID continuously demonstrates that clean energy is not just a beneficial outcome for the environment, but also for society,” said Laney Brown, vice president of sustainability at AVANGRID. “Our ESG position is not new, and we’re proud of what we’ve accomplished—we are consistently recognized for our governance and compliance work, we’ve maintained emissions intensity levels that are six-times lower than the US average for more than six years, and we’re aggressively moving forward with carbon reduction. Being named a Yearbook member is an honor and demonstrates our actions are making an impactful difference.”

AVANGRID’s sustainability strategy is organized into five key areas of focus:

  • Reducing the company’s carbon footprint;
  • Conscious action on social investment;
  • Creating a more sustainable and diverse supply chain;
  • Investing in its people; and
  • Operating with the highest ethical and governance standards.

The full Sustainability Yearbook 2023 is available at www.spglobal.com/esg/csa/yearbook/ and AVANGRID’s ESG rating can be found here.

About AVANGRID: AVANGRID, Inc. (NYSE: AGR) aspires to be the leading sustainable energy company in the United States. Headquartered in Orange, CT with approximately $40 billion in assets and operations in 24 U.S. states, AVANGRID has two primary lines of business: Avangrid Networks and Avangrid Renewables. Avangrid Networks owns and operates eight electric and natural gas utilities, serving more than 3.3 million customers in New York and New England. Avangrid Renewables owns and operates a portfolio of renewable energy generation facilities across the United States. AVANGRID employs more than 7,000 people and has been recognized by JUST Capital in 2021, 2022 and 2023 as one of the JUST 100 companies – a ranking of America’s best corporate citizens. In 2023, AVANGRID ranked first within the utility sector for its commitment to the environment. The company supports the U.N.’s Sustainable Development Goals and was named among the World’s Most Ethical Companies in 2022 for the fourth consecutive year by the Ethisphere Institute. AVANGRID is a member of the group of companies controlled by Iberdrola, S.A. For more information, visit www.avangrid.com


Contacts

MEDIA:
Sarah Warren
This email address is being protected from spambots. You need JavaScript enabled to view it.
585-794-9253

Global supply/demand dynamics in refined products markets are being driven by two critically important factors. The first is the reluctance of refiners to expand capacity in the face of climate policy and ESG headwinds. The second is a growing gap between policymakers’ aggressive energy-transition goals and the global pivot to a renewed focus on energy security. These developments have far-reaching implications, not only for refinery owners but also for E&Ps, midstreamers, exporters, policymakers, and energy-industry investors.   


HOUSTON--(BUSINESS WIRE)--#Crudeoil--RBN Energy and its Refined Fuels Analytics (“RFA”) practice today announced the release of “Future of Fuels,” a comprehensive report on the key factors influencing petroleum market dynamics — prices and price relationships, petroleum supply and demand, alternative fuels, and refining capacity and utilization.

The report’s analysis, forecasts and accompanying datasets address the short- and long-term outlook for the refining industry and a wide range of specific topics, such as the advantages U.S. refineries have over many of their international counterparts; the growing significance of export markets; the ongoing impacts of the Russia-Ukraine war on Russian refineries and exports; the Chinese government’s strategy regarding the buildout of refining capacity and exports; the decline in heavy oil production in the Western Hemisphere and the resulting narrowing in heavy-vs.-light differentials; and the unique set of challenges that refiners in each regional market face.

Future of Fuels provides a detailed look at U.S. and global refining capacity, including a detailed discussion of refinery project start-ups, restarts and shutdowns; the types of crude (heavy, medium, light) that capacity additions are designed to process; and changes in regional product make capacity.

The report also does a deep dive into global and regional demand trends for gasoline, diesel, jet, biodiesel, renewable diesel (RD) and sustainable aviation fuels (SAF) — including an assessment of the special dynamics driving the incentives-dependent biodiesel, RD and SAF markets; the margins for producing RD; and the availability of biofuel feedstocks. Finally, it includes a remarkably comprehensive set of supporting production, pricing and other data, all in downloadable Excel files.

For more information about the new Future of Fuels report and RBN’s Refined Fuels Analytics unit, click here.

About RBN Energy

RBN Energy is a leading energy market consultancy and analytics company based in Houston, Texas. The company provides a broad range of consulting services and information products concerning crude oil, refined products, natural gas, natural gas liquids and renewable energy sources. Our mission is to make sense out of the complex and sometimes quite opaque energy markets to create a deep understanding for our clients. To learn more about RBN Energy, please visit www.rbnenergy.com.


Contacts

TJ Braziel
This email address is being protected from spambots. You need JavaScript enabled to view it.
(888) 613-8874

CMTA engineered the first solar PV system funded by a performance contract in the state of North Carolina.


LOUISVILLE, Ky.--(BUSINESS WIRE)--In a major milestone for Clinton City Schools, the district recently completed the installation of a solar photovoltaic (PV) system, the first solar PV system funded by a performance contract in the state of North Carolina. CMTA, a Legence company, provided the engineering services for a comprehensive guaranteed energy-saving performance contract, the firm’s first in North Carolina.

John Lowe, Executive Director of Technology and Auxiliary Services for Clinton City Schools, energized the new system on January 20th at approximately 1:15pm to officially "turn it on." The PV install includes 107.83 kW of solar photovoltaic array on Sunset Avenue Elementary School's 800 Wing. During periods of low electricity consumption at the school, such as weekends, the new system will export power to Duke Energy, generating credits for the school’s electricity bills. During peak output of the system, it will provide 35% of the power drawn by all lighting systems in the entire district.

“It is exciting to see this component along with other components of the Energy Performance Savings Contract come together and come online,” Lowe said. “It’s been a long endeavor that required agreements from the county commissioners and approval from the LGC (Local Government Commission). So, it’s good to finally see a lot of these components coming to fruition.”

CMTA is working with Clinton City Schools on a performance contract that comprises seven facilities and a total of 566,076 square feet.

The district has taken a major step toward pursuing greater energy efficiency and becoming more environmentally friendly. Not only does this approach save the district money on electricity costs over time, but it also makes their buildings more attractive and desirable, thanks to greater property values associated with renewable-energy installations.

About CMTA

CMTA, a Legence company, specializes in creating and maintaining high-performing facilities and energy systems by providing energy solutions, energy consulting and engineering, and performance contracting services. CMTA is recognized as a leader in sustainable facility design and energy efficiency retrofits, often providing performance contracting and consulting engineering services together as part of larger multi-disciplinary comprehensive solutions. For more information, please visit www.cmta.com.


Contacts

Molly Lauck
National Communications
This email address is being protected from spambots. You need JavaScript enabled to view it.

DEER PARK, Texas--(BUSINESS WIRE)--Taurus Industrial Group (“Taurus”), a portfolio company of SCF Partners (“SCF”), is pleased to announce its acquisition of Bolttech Mannings, Inc. (“BMI”), a leading provider of technical bolting, heat treating, leak sealing, and non-destructive testing services to the North American power generation, downstream, and industrial markets. BMI’s service offerings, geographic footprint, and customer relationships are highly synergistic with those of Taurus and help increase its presence in key industry sectors.


“We’re excited to add Bolttech to the Taurus Industrial Group family,” says Hari Gopu, CEO of Taurus. “With BMI’s strong capabilities and complimentary offerings, we’ll now be able to offer our core customers additional, and complimentary, capabilities across technical bolting and torquing, heat treating, leak sealing, and hot tapping services as well as expand our offerings to new blue-chip customers in the power, energy and industrial markets.”

“BMI is a key addition to the leading industrial services platform the Taurus team has built,” says Garrett Jackson, Director at SCF Partners and Taurus board member. “We look forward to supporting management‘s efforts to capitalize on the significant cross-selling opportunities and continue building out a broader service offering that meets the evolving needs of our customers.”

About Bolttech Mannings

Bolttech Mannings, with its subsidiaries Red Flame Industries, AM Inspection, and Global Tooling Services, has been a leader in specialty industrial bolting and torquing, hot tapping, and thermal technologies for a variety of industries for nearly 35 years. BMI’s dedicated technicians have experience in the power generation, steel, natural gas transmission, and petrochemical industries. The company has differentiated itself by providing the world’s most efficient full line of OEM industrial bolting tools, induction, combustion and resistance products. Learn more at www.bolttechmannings.com.

About Taurus Industrial Group

Taurus Industrial Group brings together familiar and highly regarded service providers with an outstanding combination of people and know-how, safely delivering high-performance solutions to operators in the ever-growing industrial and energy landscape. From engineering to implementation, the Taurus companies provide services for electrical and power systems, automation and control instrumentation, civil and mechanical projects, rotating and reciprocating equipment maintenance, piping and structural steel fabrication, refractory, scaffolding, insulation, paint and coatings. With principal offices in Houston, Texas, and localized service facilities in Corpus Christi, Port Lavaca, Freeport, Deer Park, Orange, Baton Rouge and Decatur (IL), the Taurus companies cover the US Gulf Coast and Midwest with capability, reliability and strength. Learn more at www.taurusig.com.


Contacts

Daniel Frayne
This email address is being protected from spambots. You need JavaScript enabled to view it.

Three Ultra-scalable, minimal footprint modules deliver massive computing power in compact 3U form to support demanding battlefield workloads

SAN DIEGO--(BUSINESS WIRE)--#AI--General Micro Systems (GMS), the world’s leading technology-independent supplier of computing engines in boxes, boards and servers, today launched its X9 Venom Xeon D Host 3U VITA 65 OpenVPX single-board computer. Aligned to the SOSA™ (Sensor Open Standard Architecture) Technical Standard, this family of high-performance modules support the demanding needs of next-generation warfare with massive, flexible I/O and compute capabilities in multiple configurations. These single-board computers are powered by up to 20 Intel® Xeon® D-2700 HCC (formerly Ice Lake D) cores, and unprecedented bandwidth via inter-chassis and front-panel connectivity with Thunderbolt™ 4, PCIe Gen 4, USB, and 100 GbE ports.


“Developed specifically to meet battlefield requirements for instant communications, faster data-driven decisions, and rapid upgrades, the X9 Venom Xeon D Host single-board computers deliver more compute, bandwidth, I/O and memory than any other industry provider,” said Ben Sharfi, CEO and chief architect, GMS. “Our Xeon D Host single-board computers include huge data pipes with CPU offload, multiple GPUs for artificial intelligence or graphics, and long-haul fiber via Ethernet or Thunderbolt 4—all in a much smaller, ruggedized and SOSA-compliant form factor, unlike any competitor. In fact, there are no competitors for this compact solution.”

What makes these single-board computers (SBCs) most unique is the compact combination of so much ultra-speed I/O at 40Gbits/s or 100Gbits/s, up to three processors per module, and the breadth of modular, application-specific I/O that interfaces with all manner of defense systems and platforms.

The combination of the X9 Venom Xeon D Host’s CPU and optional twin GPUs, PCI Express Gen 4, Thunderbolt 4, and front panel 100G fiber—plus multiple M.2 storage and I/O sites—makes Venom the fastest, smallest and most powerful compute and I/O processors anywhere in the world. The modules are designed for extended temperature, long life, conduction- or optional convection-cooling, and operate from a single 12 VDC supply. All versions are OpenVPX, VITA 65, SOSA, and U.S. Army CMOSS-aligned or compliant, with backplane profiles available to best fit the processing and I/O options.

Available in three configurations (standard “D”, “NET” and “NAS”), these single-board computers bring unprecedented flexibility to military applications:

  • Single slot 3UVPX Venom D with two M.2 storage sites, two PCIe-Mini sites, two Thunderbolt™ 4 ports with optional 100 W power, and four 100 GbE ports (two to front panel)
  • Dual slot 3UVPX-NAS for network-attached storage (NAS), including six M.2 storage sites for up to 40GB of RAID, two PCIe-Mini sites, two Thunderbolt ports each with 100 W power, four 100GbE (two to front panel) and optional dual GPU or quad 100GbE or dual Thunderbolt 4 ports
  • Dual slot 3UVPX-NET, or high-speed I/O, including two M.2 storage sites, two Thunderbolt ports each with 100 W power, and up to ten 100 GbE ports (eight to front panel), plus optional dual GPU or dual Thunderbolt 4 ports

Based on open standards, all X9 Venom Xeon D Host configurations include:

  • Intel Xeon D high core count (HCC) CPU up to 20 cores and 64GB DDR4 ECC DRAM, supporting up to 40 parallel threads
  • Virtual machine computer/server capability providing 20 clients or disparate processes
  • Up to 10x 100 GbE ports for massive sensor pipeline or inter-board communication for parallel processing
  • Direct-to-drive and software RAID for NVMe drives
  • 100Gb Ethernet I/O supporting Remote Direct Memory Access (RDMA) over converged Ethernet (RoCE) which offloads local or distant CPUs for “atomic” burst data transactions

Folded “Origami” leads to unprecedented capabilities

To realize the incredible slot density fundamental to the X9 Venom Xeon D Host family, GMS pioneered, patented and refined a technique that takes a feature-rich, server-sized monolithic motherboard and “folds” it into stackable 3U-sized modules. Each module is carefully groomed for timing, signal integrity, EMI mitigation and maximum performance.

The X9 Venom PCBs are interconnected via ultra-high-speed board-to-board connectors that route signals such as PCIe Gen 4 between, and through, the modules with no speed degradation. GMS-unique technology allows nearly 40 lanes of PCIe to be routed effectively between all three boards.

“If open standards compliant modules like OpenVPX, SOSA, CMOSS, HOST and more are required to comply with the MOSA (modular open standards approach) DoD mandate, the X9 Venom Xeon D Host family is the single best embedded computer to meet the high-performance computing and networking requirements of the modern battlefield,” Sharfi said “GMS’ Venom SBCs do more in one or two slots than the other guys using a whole chassis.”

Visit GMS this week at AFCEA West 2023 in San Diego

The X9 Venom Xeon D Host is one of several technologies GMS will feature at AFCEA West 2023 in San Diego (booth 1636) February 14-16.

About General Micro Systems:

General Micro Systems (GMS) is the rugged server company. The company is known as the industry expert in highest-density, modular, compute-intensive, and rugged small form-factor embedded computing systems, servers, and switches. These powerful systems are ideal for demanding C5ISR defense, aerospace, medical, industrial, and energy exploration applications. GMS is an IEC, ISO, AS9100, NIST-800-171, and MIL-SPEC supplier with infrastructure and operations for long-life, spec-controlled, and configuration-managed programs.

Designed from the ground up to provide the highest performance and functionality in the harshest environments on the planet, the company’s highly customizable products include GMS Rugged DNA™ with patented RuggedCool™ and Diamond RuggedCool™ cooling technology. GMS uses processors from Intel® and NVIDIA®. For more information, visit www.gms4sbc.com.

General Micro Systems and the General Micro Systems logo are trademarks of General Micro Systems, Inc. All other product or service names are the property of their respective owners.

©2023 General Micro Systems, Inc. All Rights Reserved


Contacts

Press contacts:
Chris A. Ciufo
General Micro Systems
360-921-7556
This email address is being protected from spambots. You need JavaScript enabled to view it.

Kelly Wanlass
HCI Marketing and Communcations, Inc.
801-602-4723
This email address is being protected from spambots. You need JavaScript enabled to view it.

NEW BRAUNFELS, Texas--(BUSINESS WIRE)--TaskUs (Nasdaq: TASK), a provider of outsourced digital services and next-generation customer experience to fast-growing technology companies, has made a long-term commitment to support a partnership between Watershed, an enterprise climate platform, and renewables marketplace Ever.green to launch the first fixed-price virtual power purchase agreement (VPPA). Through the VPPA, TaskUs and other customers are contributing to the financing of a new solar plant in Laredo, Texas that will add clean energy to a grid that largely relies on coal and gas.


Supporting the fixed-price VPPA allows TaskUs to lock in long-term costs, as well as make significant progress towards its ambitious environmental goals. The Texas power grid experiences high emissions intensity owing to a reliance on coal and gas and the new solar plant will allow TaskUs and other companies to realize significant carbon reduction impact with their investments. The solar energy produced by this plant is expected to lead to over 13,000 tons of CO2 avoided every year—equivalent to taking nearly 3,000 gas-powered cars off the road annually. This partnership is a blueprint for many more projects of its kind funded collectively by Watershed customers.

"At TaskUs we take our sustainability efforts seriously with the understanding that every action we take as a company will have an impact on the environment, our society, and collective future,” said Jon Wouters, TaskUs' Division Vice President of Global Facilities, Growth, and Sustainability. “Working with Watershed helps us more quickly realize long-term environmental goals, which are a critical piece of our overall ESG commitments. We are excited to see the positive impact of this collaboration.”

"The fixed-price VPPA lets Watershed customers lock in years of renewable energy production that would not exist without their commitments," said Watershed co-founder Taylor Francis. "What's more, as corporate offsetting comes under intensified regulatory and media scrutiny, VPPA customers will have the assurance that they're funding only the highest-quality projects."

The VPPA participation is illustrative of TaskUs' ESG goals, which continue to be a key consideration for company operations. As a fully cloud-based organization, TaskUs is able to take an asset-light approach to working with customers. The company also focuses on achieving maximized efficiency in its facilities by managing improved seat utilization across its global footprint. TaskUs' sites in 14 countries have various local initiatives to encourage recycling, efficient energy usage, water conservation, and efforts to limit the presence and use of single-use plastics, among others.

To learn more about TaskUs, visit https://www.taskus.com or the following social media accounts:

About TaskUs

TaskUs is a provider of outsourced digital services and next-generation customer experience to fast-growing technology companies, helping its clients represent, protect and grow their brands. Leveraging a cloud-based infrastructure, TaskUs serves clients in the fastest-growing sectors, including social media, e-commerce, gaming, streaming media, food delivery and ridesharing, HiTech, FinTech and HealthTech. As of September 30, 2022, TaskUs had approximately 48,700 employees across twenty-eight locations in 14 countries, including the United States, the Philippines, and India.


Contacts

Media Contact
This email address is being protected from spambots. You need JavaScript enabled to view it.

Investor Contact
Alan Katz, Investor Relations
This email address is being protected from spambots. You need JavaScript enabled to view it.

Novata’s General Partner Advisory Committee is a group of leading private investment firms who embody purpose and authenticity in their approach to ESG

NEW YORK--(BUSINESS WIRE)--Novata, a leading ESG data management platform built for private markets, today announced that Wafra Inc. (“Wafra”) is joining Novata’s General Partner Advisory Committee (GPAC). Wafra is a global alternative investment manager that invests across a range of alternative assets, including private equity, real estate and real assets. Novata, a public benefit corporation backed by the Ford Foundation, Hamilton Lane, S&P Global and Omidyar Network, provides customers with a clear pathway for selecting ESG metrics, data collection into a secure database, and data insights and analytics tools to inform investment decisions.


The Novata GPAC, a group of leading private investment firms committed to ESG, provides critical guidance and recommendations to the Novata ecosystem on a range of issues, including effective ESG measurement and benchmarking tools. Wafra is aligned with Novata in their mission to advance effective ESG data collection and monitoring in private markets.

“At Wafra, we believe integrating material ESG considerations in our investment process helps to holistically manage financial risk and identify opportunities to create additional value for our clients,” said Avantika Saisekar, Head of Sustainable Investing at Wafra. “We are pleased to join the Novata GPAC to support the development of consistent ESG monitoring practices and empower alternative investors to build long-term sustainable businesses.”

With mounting pressure from regulators, investors, customers, and employees to increase data transparency, Novata’s platform, specifically tailored for private markets, is the simple first step for firms looking to tackle ESG data collection.

“We are pleased to welcome Wafra, an industry leader in ESG, to the Novata GPAC,” said Alex Friedman, CEO and Co-Founder at Novata. “Operating with a long-term view is core to Wafra’s business and aligns with Novata’s mission to enable a more sustainable and inclusive form of capitalism.”

Learn more about Novata’s GPAC here.

About Wafra

Wafra is a global alternative investment manager with over $31 billion of assets under management. Wafra invests across a range of alternative assets, including private equity, real estate and real assets. By providing flexible and accretive capital solutions and focusing on the long-term partnerships, Wafra aligns and partners with global asset owners, companies and management teams. Headquartered in New York, Wafra has additional offices in London, Kuwait and Bermuda. For more information, please visit www.wafra.com.

About Novata

Novata is a public benefit corporation created to enable the private markets to achieve a more sustainable and inclusive form of capitalism. Novata helps private equity firms and private companies to navigate the complex ESG landscape more easily by providing a technology platform that simplifies the process of selecting reporting metrics, provides clear and simple guidance for painless data collection, hosts a cutting-edge secure contributory database to store data, and offers unique tools for analysis and seamless reporting to key stakeholders, including limited partners and regulators. Novata was formed as a partnership of the Ford Foundation, S&P Global, Hamilton Lane and Omidyar Network and is majority-controlled by mission-driven organizations and its employees. For more information, please visit https://www.novata.com/.

Follow Novata on LinkedIn.


Contacts

Media Inquiries:

Katrina Allen
Edelman Smithfield
+1 (917) 640-2753
This email address is being protected from spambots. You need JavaScript enabled to view it.

Katie Stueber
Novata
This email address is being protected from spambots. You need JavaScript enabled to view it.

WAKEFIELD, Mass.--(BUSINESS WIRE)--TÜV SÜD, a leading global technical service provider, is pleased to announce the appointment of Dr. Fabian Schober as the new CEO of TÜV SÜD in Americas, effective immediately.


Dr. Schober brings a wealth of experience and expertise to this role, having held several senior leadership positions within TÜV SÜD since 2008. After starting in Corporate M&A, he served as the CFO of TÜV SÜD Rail and then the CFO of the Real Estate & Infrastructure division. In January 2017, Dr. Schober assumed the role of CFO of the Americas region, where he has been highly successful. Dr. Schober has a PhD from the University of St. Gallen and completed the General Management Program at the Harvard School of Business.

TÜV SÜD is confident that Dr. Schober's leadership and expertise will be instrumental in driving the company's growth and success in the Americas. He will be based in the company's regional headquarters in Wakefield, MA.

"We are thrilled to welcome Dr. Schober to this new role at TÜV SÜD," said Ishan Palit, Global COO and Member of the Board of Management at TÜV SÜD. "His proven track record in the region and deep experience in the industry make him the ideal leader to drive our growth and success in this important market."

Founded in 1866 as a steam boiler inspection association, the TÜV SÜD Group has evolved into a global enterprise. More than 25,000 employees work at over 1,000 locations in about 50 countries to continually improve technology, systems and expertise. They contribute significantly to making technical innovations such as Industry 4.0, autonomous driving and renewable energy safety and reliability. http://www.tuvsud.com/en-us


Contacts

Media Relations:
Jim Regan
TÜV SÜD America Inc.
401 Edgewater Drive, Suite 500
Wakefield, MA 01880
Phone: +1 339 235-6844
Email: This email address is being protected from spambots. You need JavaScript enabled to view it.
Website: https://www.tuvsud.com/en-us

Eleven Ocean Innovators Chosen Worldwide

AUSTIN, Texas--(BUSINESS WIRE)--Terradepth, a leading provider of ocean data solutions, has been selected to participate in the World Economic Forum’s (WEF) prestigious Ocean Data Challenge, a program aimed at enhancing sustainable ocean management and building the blue economy. One of only 11 Challenge winners, Terradepth will become part of the WEF UpLink Innovation Network, including a mentoring program and partnering opportunities.


WEF announced the Ocean Data Challenge winners at its 2023 Annual Meeting in Davos, Switzerland. The Challenge was created by WEF in response to the United Nations’ proclamation that 2021–2030 be a Decade of Ocean Science for Sustainable Development and has called for creation of a global ocean data ecosystem to connect businesses, organizations, and government data providers.

“Terradepth is proud to be recognized by the World Economic Forum as an innovator in creating technologies that play critical roles in deepening our understanding of ocean environments," said Joe Wolfel, CEO of Terradepth. “We look forward to working alongside some of the most influential players in the ocean science community.”

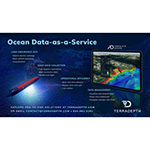
The Ocean Data Challenge selected Terradepth for its innovation in scaling ocean data collection and ocean data dissemination. Terradepth is accomplishing this by developing long endurance autonomous underwater vehicles (AUVs) that revolutionize the economics of ocean data collection and reduce its environmental impact. Additionally, as an ocean data-as-a-service (ODaaS) provider, Terradepth has spearheaded efforts to deploy low-logistics AUVs configured with multiple sensors to conduct seafloor hydrographic and geophysical surveys for a fraction of the cost of traditional surveys.

Terradepth has also developed an ocean data management solution, known as Absolute Ocean (AO). AO offers greater operational efficiencies for ocean data accessibility and is a secure, easy-to-use, cloud-native geospatial solution. AO provides high-level visualization, analysis, collaboration, and management of ocean data for both internal and external project stakeholders. Available as software-as-a-service (SaaS), AO is being used for projects ranging from environmental monitoring and engineering design to offshore energy and telecommunications infrastructure inspection.

“A vital resource for initiatives like the Ocean Data Challenge, the fully integrated AO solution provides unique insight into the ocean and seafloor for stakeholders that in the past only had access to static images, as well as the ability to manage and archive ocean data in one place for enterprise-wide access and global collaboration,” said Wolfel.

As an Ocean Data Challenge participant, Terradepth will team with other winners to focus on furthering ocean knowledge to:

  • Advance ocean data analytics
  • Generate data designed to drive decisions
  • Develop commercial uses for public or open-source data resources
  • Build novel means of data collection

The Challenge is managed by the WEF UpLink and Friends of Ocean Action initiatives. UpLink is an open platform created to connect change-makers and entrepreneurs with the goal of forging new approaches to the world’s most pressing challenges. Friends of Ocean Action is a coalition of over 70 ocean leaders who are fast-tracking solutions to issues facing ocean ecosystems.

For more information on the Ocean Data Challenge, to request a demonstration of Absolute Ocean, or to learn more about Terradepth AUV activities, go to terradepth.com, or visit booth C15 at Oceanology International Americas being held February 14–16 in San Diego, California.

About Terradepth

Terradepth is an ocean data-as-a-service company focused on scaling ocean data collection and dissemination, enabling unprecedented exploration of the underwater environment. This is accomplished by environmentally friendly survey and monitoring operations that collect ocean data at the edge, combined with an immersive, cloud-native geospatial data management solution for ocean data visualization, collaboration and analysis. These capabilities enable better and faster ocean decisions. www.terradepth.com


Contacts

This email address is being protected from spambots. You need JavaScript enabled to view it.

LUGANO, Switzerland & WESTLAKE VILLAGE, Calif.--(BUSINESS WIRE)--Energy Vault Holdings, Inc. (NYSE: NRGV) (“Energy Vault” or the “Company”), a leader in sustainable grid-scale energy storage solutions, announced today that the Company will release its earnings results for the fourth quarter and full year ended December 31, 2022 on Tuesday, March 7, 2023 followed by a conference call at 4:30 PM ET.

Participants may access the call at 1-877-704-4453, international callers may use 1-201-389-0920, and request to join the Energy Vault Holdings earnings call. A live webcast will also be available at https://investors.energyvault.com/events-and-presentations/events.

A telephonic replay of the call will be available shortly after the conclusion of the call and until March 21, 2023. Participants may access the replay at 1-844-512-2921, international callers may use 1-412-317-6671 and enter access code 13735828. An archived replay of the call will also be available on the investors portion of the Energy Vault website at https://investors.energyvault.com/.

About Energy Vault

Energy Vault® develops and deploys utility-scale energy storage solutions designed to transform the world's approach to sustainable energy storage. The company's comprehensive offerings include proprietary gravity-based storage, battery storage, and green hydrogen energy storage technologies. Each storage solution is supported by the Company’s hardware technology-agnostic energy management system software and integration platform. Unique to the industry, Energy Vault’s innovative technology portfolio delivers customized short and long duration energy storage solutions to help utilities, independent power producers, and large industrial energy users significantly reduce levelized energy costs while maintaining power reliability. Utilizing eco-friendly materials with the ability to integrate waste materials for beneficial reuse, Energy Vault’s EVx™ gravity-based energy storage technology is facilitating the shift to a circular economy while accelerating the global clean energy transition for its customers. Please visit www.energyvault.com for more information.


Contacts

Investors:
This email address is being protected from spambots. You need JavaScript enabled to view it.

Media:
This email address is being protected from spambots. You need JavaScript enabled to view it.

The Cooperation Framework aims to boost climate business and food security through a co-investing program of up to AED5.5 billion (US$1.5 billion) for private sector-led projects.


ABU DHABI, United Arab Emirates--(BUSINESS WIRE)--Abu Dhabi Fund for Development (ADFD) and the International Finance Corporation (IFC), a member of the World Bank Group, signed a Memorandum of Cooperation during the World Government Summit to support investments in emerging markets related to the clean energy transition, climate mitigation and adaptation, the adoption of clean technologies, and food security amongst others.

The cooperation framework aims to strengthen the strategic collaboration between the two organizations in several key areas, including through co-investing of up to AED5.5 billion (US$1.5 billion) to private sector-led projects.

The new cooperation also paves the way for an enhanced exchange of knowledge that leverages best practices and global expertise of both parties. The agreement was signed by His Excellency Mohamed Saif Al Suwaidi, Director General of Abu Dhabi Fund for Development; and Mr. Makhtar Diop, Managing Director of IFC.

H.E. Al Suwaidi stated that the strategic partnership with the International Finance Corporation presented promising opportunities for attaining the sustainable development goals of developing countries. “The cooperation framework will boost investment in climate and food security projects in crucial sectors such as renewable energy and food security. It will also help stimulate economic activity in both the national private sector and in developing countries, enabling countries to achieve their development goals and programs,” he said.

Makhtar Diop, IFC's Managing Director said: “To tackle climate change, ensure food security, and address unemployment, we need a strong private sector. We are joining forces with ADFD to co-finance private sector projects that address the most pressing challenges of our time.”

Through the Memorandum of Cooperation ADFD and IFC will work to enhance cooperation and exchange of experiences, especially in supporting small and medium enterprises to promote economic development by encouraging the growth of private business enterprises in developing countries.

*Source: AETOSWire


Contacts

Ameera Alali
This email address is being protected from spambots. You need JavaScript enabled to view it.

HATBORO, Pa.--(BUSINESS WIRE)--Fluitron, a leading manufacturer of integrated hydrogen gas compression, storage, and dispensing systems, today announced the appointment of Charles (Chuck) Smith, as Plant Manager of its Hatboro, Pa. facility. Fluitron is a portfolio company of Ara Partners, a decarbonization-focused private equity firm.


Smith brings more than 30 years of plant operations and engineering experience to Fluitron, having previously held senior plant and product management roles at SP Industries, FAIST Light Metals, Mueller Water Products, Kaiser Aluminum and Emerson Process Management. He is a graduate of the U.S. Navy Nuclear Power School and holds both a B.S. in Workforce Education and Development from Southern Illinois University, Carbondale and an M.B.A. from Western Governor’s University.

"I'm extremely enthusiastic about the opportunities that lie ahead for Fluitron as it takes a leadership position in global decarbonization and continues working to strengthen the Hydrogen supply chain," said Smith. "Fluitron has a rich history and an enthusiastic workforce that is well-poised to accelerate productivity in this highly-dynamic stage of development of the global hydrogen industry."

Today’s announcement builds on the announcements of a number of recent innovations at Fluitron, including the introduction of a commercialized one (1) ton-per-day hydrogen gas processing system at 520 bar and the manufacturing, testing, installation and PESO (Petroleum and Explosives Safety Organization) approval for the first domestically-built hydrogen dispenser in India.

“We are delighted to have someone of Chuck’s caliber join the team at Fluitron,” said Fluitron President and CEO Linh Austin. “He is a recognized leader in the manufacturing space and will take our new state of the art manufacturing facility to new heights.”

About Fluitron
Fluitron is a global leader in precision technology for clean energy. With over 45 years of experience, Fluitron has grown to become a trusted partner for industrial gas compression technologies. Setting the bar in creating equipment that safely handles hydrogen and other specialized gases, Fluitron has the expertise to deliver the technology critical to your mission. For more information, www.fluitron.com.


Contacts

Media Contact:

Wilson Craig
Mindshare PR
+1 408-516-6182
This email address is being protected from spambots. You need JavaScript enabled to view it.

Former Congresswoman and House Agriculture Committee Member Will Bring Relevant Perspectives to REX’s Alternative Energy Businesses and Carbon Sequestration Project

DAYTON, Ohio--(BUSINESS WIRE)--REX American Resources Corporation (NYSE: REX) (“REX” or “the Company”) today announced that Cheri Bustos, 61, has been appointed to its Board of Directors, effective immediately. Bustos will serve as an Independent Director and will increase the size of the Board to nine members, including six independent members.


"We are pleased to welcome Cheri to the REX American Resources Board," said Stuart Rose, Executive Chairman of the Board of Directors. ”As a highly respected journalist, successful non-profit executive, and extremely effective member of Congress, Cheri brings a rare combination of highly sought-after skills. I am confident that her ability to provide sound leadership and insight based on her experience, including serving on the House Agriculture Committee for 10 years, will make her a strong addition to our Board and support our goals for our alternative energy businesses and further progress with our carbon sequestration project."

Bustos, stated, “I am honored to be a part of REX’s diverse and collaborative Board of Directors and look forward to sharing my experience and business perspective with the Board and REX management team. REX’s commitment to innovation and its long-term record of success as a public company has been exemplary, and I am confident we have the right strategy in place to execute on our opportunities and simultaneously deliver value to our stockholders.”

Bustos served five terms in the U.S. House of Representatives as the Congresswoman from Illinois's 17th Congressional District. She left office last month. She served on the powerful Appropriations Committee and on its Energy and Water Subcommittee. She also served on the House Agriculture Committee and chaired its General Farm Commodities and Risk Management Subcommittee. She was a member of House Leadership for more than half of her tenure in Congress. Prior to serving in Congress, Bustos was a Vice President of a multi billion-dollar non-profit health system. Bustos began her career as a journalist, becoming a highly respected investigative reporter and newspaper editor. She is a graduate of the University of Maryland at College Park and holds a Master’s in Public Affairs Reporting from the University of Illinois at Springfield. Bustos comes from a long line of family farmers and is a life-long resident of the state of Illinois.

About REX American Resources Corporation

REX American Resources has interests in six ethanol production facilities, which in aggregate shipped approximately 699 million gallons of ethanol over the twelve-month period ended October 31, 2022. REX’s effective ownership of the trailing twelve-month gallons shipped (for the twelve months ended October 31, 2022) by the ethanol production facilities in which it has ownership interests was approximately 277 million gallons. Further information about REX is available at www.rexamerican.com.


Contacts

Douglas Bruggeman
Chief Financial Officer
937/276‑3931

Joseph Jaffoni, Norberto Aja
JCIR
212/835-8500
This email address is being protected from spambots. You need JavaScript enabled to view it.

 The Project is named after Dorothy Vaughan, one of NASA’s “Human Computers”

ALBANY, N.Y.--(BUSINESS WIRE)--$SLNH #SLNH--Soluna Holdings, Inc. (“SHI” or the “Company”), (NASDAQ: SLNH), the parent company of Soluna Computing, Inc. (“SCI”), a developer of green data centers for Bitcoin mining and other intensive computing has announced Project Dorothy, its 50 MW flagship green data center co-located at a wind farm in Texas, has been featured in a Black History Month segment from KLBK News in Lubbock, Texas. The segment can be found here. The news clip from KLBK features a quick video tour of the data center and wind farm which clearly capture the essence of innovation embodied in the project.


All of Soluna’s renewable computing data centers are named after influential women in science. This project is named after Dorothy Vaughan, an African American mathematician and “human computer” who worked for the National Advisory Committee for Aeronautics and NASA in 1939. Dorothy Vaughan led a team of women human computers that would go on to change our understanding of space forever. Their work helped send America’s first satellites–the SCOUT vehicle rockets–into space.

“Dorothy Vaughan was a tenacious leader and humbly triumphant. Her legacy inspires us as we work to catalyze a clean energy future.” said Michael Toporek, CEO of Soluna Holdings, Inc.

Learn more about the logistics of this facility here.

About Soluna Holdings, Inc (SLNH)

Soluna Holdings, Inc. is the leading developer of green data centers that convert excess renewable energy into global computing resources. Soluna builds modular, scalable data centers for computing intensive, batchable applications such as Bitcoin mining, AI and machine learning. Soluna provides a cost-effective alternative to battery storage or transmission lines. Soluna uses technology and intentional design to solve complex, real-world challenges. Up to 30% of the power of renewable energy projects can go to waste. Soluna’s data centers enable clean electricity asset owners to ‘Sell. Every. Megawatt.’

For more information about Soluna, please visit www.solunacomputing.com or follow us on LinkedIn at linkedin.com/solunaholdings and Twitter @SolunaHoldings.


Contacts

Michael Toporek
CEO
Soluna Holdings, Inc.
This email address is being protected from spambots. You need JavaScript enabled to view it.

ST. CATHARINES, Ontario--(BUSINESS WIRE)--#yourmarinecarrierofchoice--Algoma Central Corporation (TSX: ALC) (TSX: ALC.DB.A) today announced that it will report its financial results for the year ended December 31, 2022 before market open on February 27, 2023. Our fiscal 2022 earnings release and full financial results will be available on the Company's website and on SEDAR.


Algoma owns and operates the largest fleet of dry and liquid bulk carriers operating on the Great Lakes - St. Lawrence Seaway, including self-unloading dry-bulk carriers, gearless dry-bulk carriers and product tankers. Since 2010 we have introduced 10 new build vessels to our domestic dry-bulk fleet, with two under construction and expected to arrive in 2024, making us the youngest, most efficient and environmentally sustainable fleet on the Great Lakes. Each new vessel reduces carbon emissions on average by 40% versus the ship replaced. Algoma also owns ocean self-unloading dry-bulk vessels operating in international markets and a 50% interest in NovaAlgoma, which owns and operates the world's largest fleet of pneumatic cement carriers and a global fleet of mini-bulk vessels serving regional markets. Algoma truly is Your Marine Carrier of Choice™. For more information about Algoma, visit the Company's website at www.algonet.com


Contacts

Gregg A. Ruhl
President & CEO
905-687-7890

Peter D. Winkley, CPA, CA
E.V.P. & Chief Financial Officer
905-687-7897

TORONTO--(BUSINESS WIRE)--Electra Battery Materials Corporation (NASDAQ: ELBM; TSX-V: ELBM) (“Electra”, or the “Company”) announced that it has closed its previously announced private placement offering (the “Note Offering”) of US$51 million principal amount of 8.99% senior secured convertible notes due February 2028 (the “Notes”).


As part of the transaction, the Company purchased and cancelled all of the outstanding approximately US$36 million principal amount of the Company’s existing 6.95% senior secured notes due 2026 (the “2026 Notes”) at par, plus accrued and unpaid interest through the date of the closing. The net proceeds of the Note Offering of approximately US$14 million will be used for capital expenditures associated with the expansion and recommissioning of the Company’s hydrometallurgical cobalt refinery, including buildings, equipment, infrastructure, and other direct costs, as well as engineering and project management costs.

The initial conversion rate of the Notes is 403.2140 common shares of the Company (“Common Shares”) per US$1,000, equivalent to an initial conversion price of approximately US$2.48 per Common Share, subject to certain adjustments set forth in the indenture governing the Notes (the “Note Indenture”), reflecting a premium of approximately 17.5% to the 30-day volume weighted average price of the Common Shares prior to the date the Note Offering was announced.

The Notes bear interest at 8.99% per annum, subject to adjustment in certain circumstances described in the Note Indenture, payable in cash semi-annually in arrears in February and August of each year, provided that during the first 12 months of the term of the Notes, the Company may pay interest through the issuance of Common Shares at an increased annual interest rate of 11.125%.

Cantor Fitzgerald & Co. (“CF&Co”) acted as sole placement agent for the Note Offering and received a cash fee equal to 4% of the difference between the principal amount of Notes and the outstanding principal amount of 2026 Notes, a portion of which was satisfied by the issuance of 27,500 Common Shares at a price of US$2.18, as well as a fee of 50,000 Common Shares.

The Notes, the Warrants, the underlying Common Shares and the Common Shares have not been registered under the United States Securities Act of 1933, as amended (the “U.S. Securities Act”), or any applicable U.S. state securities laws, and may not be offered or sold in the United States absent registration or an available exemption from the registration requirement of the U.S. Securities Act and applicable U.S. state securities laws.

The Noteholders received an aggregate of 10,796,054 warrants to purchase Common Shares (“Warrants”) exercisable for five years at US$2.48 in connection with the Note Offering. The initial Noteholders also received a royalty of an aggregate of 0.6% of revenues for five years from the commencement of commercial production, subject to certain allowable deductions in the first year of the term.

Upon any early conversion of Notes, the Company will make an interest make-whole payment equal to the lesser of the two years of interest payments or interest payable to maturity, which may be made in cash or shares at the Company’s election. There are also payments required in the event of a fundamental change, such as a change of control. In accordance with the policies of the TSX Venture Exchange (“TSXV”), for as long as the Company is listed on the TSXV, aggregate consideration that is deemed “interest” under the Note Offering is capped at 24% per year absent TSXV approval. In addition, provided the Company is not listed on TSXV, certain price-based adjustment mechanisms will apply to the Notes and the Warrants. Should such adjustments be required or should the Noteholders become entitled to aggregate deemed interest in conflict with TSXV policies, the Company has agreed to seek to obtain approval from the TSXV to make such adjustments or allow such payments to be made, or in the alternative, take other measures up to and including seeking an alternative Canadian listing venue.

Additional information with respect to the attributes of the Notes, the Warrants and royalty can be found in the Company’s news release dated February 8, 2023, the Note Indenture, the indenture governing the Warrants, and a material change report to be filed in connection with the Note Offering, each of which will be made publicly available on SEDAR and EDGAR.

This press release shall not constitute an offer to sell or the solicitation of an offer to buy, nor shall there be any sale of the securities in any jurisdiction in which such offer, solicitation or sale would be unlawful.

About Electra Battery Materials

Electra is a processor of low-carbon, ethically-sourced battery materials.

Neither the TSX Venture Exchange nor its Regulation Services Provider (as that term is defined in policies of the TSX Venture Exchange) accepts responsibility for the adequacy or accuracy of this release.

Cautionary Note Regarding Forward-Looking Statements

This news release may contain forward-looking statements and forward-looking information (together, “forward-looking statements”) within the meaning of applicable securities laws and the United States Private Securities Litigation Reform Act of 1995. All statements, other than statements of historical facts, are forward-looking statements. Generally, forward-looking statements can be identified by the use of terminology such as “plans”, “expects', “estimates”, “intends”, “anticipates”, “believes” or variations of such words, or statements that certain actions, events or results “may”, “could”, “would”, “might”, “occur” or “be achieved”. Such forward-looking statements include, without limitation, statements regarding the attributes and terms of the Notes and related agreements and the expected use of proceeds of the Offering. Forward-looking statements involve risks, uncertainties and other factors that could cause actual results, performance, and opportunities to differ materially from those implied by such forward-looking statements. Factors that could cause actual results to differ materially from these forward-looking statements are set forth in the management discussion and analysis and other disclosures of risk factors for Electra Battery Materials Corporation, filed on SEDAR at www.sedar.com and with on EDGAR at www.sec.gov. Although Electra Battery Materials Corporation believes that the information and assumptions used in preparing the forward-looking statements are reasonable, undue reliance should not be placed on these statements, which only apply as of the date of this news release, and no assurance can be given that such events will occur in the disclosed times frames or at all. Except where required by applicable law, Electra Battery Materials Corporation disclaims any intention or obligation to update or revise any forward-looking statement, whether as a result of new information, future events or otherwise.


Contacts

Joe Racanelli Vice President, Investor Relations
This email address is being protected from spambots. You need JavaScript enabled to view it. 1.416.900.3891

MILPITAS, Calif.--(BUSINESS WIRE)--SolarEdge Technologies, Inc. (Nasdaq: SEDG), a global leader in smart energy technology, today announced its financial results for the fourth quarter 2022 and full year ended December 31, 2022.

Fourth Quarter 2022 Highlights

  • Record revenues of $890.7 million
  • Record revenues from solar segment of $837.0 million
  • GAAP gross margin of 29.3%
  • Non-GAAP gross margin of 30.2%
  • Gross margin from solar segment of 32.4%
  • GAAP operating loss of $5.2 million
  • Record non-GAAP operating profit of $149.6 million
  • GAAP net income of $20.8 million
  • Record non-GAAP net income of $171.5 million
  • GAAP net diluted earnings per share (“EPS”) of $0.36
  • Record non-GAAP net diluted EPS of $2.86
  • 3.14 Gigawatts (AC) of inverters shipped
  • 217.6 MWh of batteries shipped

Full Year 2022 Highlights

  • Record revenues of $3.11 billion, up 58% year over year from 2021
  • Record revenues from solar segment of $2.92 billion, up 63% year over year from 2021
  • GAAP gross margin of 27.2%
  • Non-GAAP gross margin of 28.2%
  • Gross margin from solar segment of 29.8%
  • GAAP net income of $93.8 million
  • Record Non-GAAP net income of $351.2 million
  • GAAP net diluted earnings per share (“EPS”) of $1.65
  • Record Non-GAAP net diluted EPS of $5.95
  • 10.5 Gigawatts (AC) of inverters shipped
  • 889 MWh of batteries shipped

“We are pleased with our fourth quarter results that conclude a challenging yet very successful year. The global economic and geopolitical events coupled with post pandemic dynamics created an unprecedented demand for solar energy in general and our products in particular,” said Zvi Lando, Chief Executive Officer of SolarEdge. “I am proud that our extraordinary global team of employees was able to overcome the hurdles we faced and conclude a record year in almost every element of our operations. We are excited about the opportunities of the year ahead and expect to continue our profitable growth momentum.”

Fourth Quarter 2022 Summary

The Company reported record revenues of $890.7 million, up 6% from $836.7 million in the prior quarter and up 61% from $551.9 million in the same quarter last year.

Revenues from the solar segment were a record $837.0 million, up 6% from $788.6 million in the prior quarter and up 66% from $502.7 million in the same quarter last year.

GAAP gross margin was 29.3%, up from 26.5% in the prior quarter and up from 29.1% in the same quarter last year.

Non-GAAP gross margin was 30.2%, up from 27.3% in the prior quarter and down from 30.3% in the same quarter last year.

Gross margin from the solar segment was 32.4%, up from 28.3% in the prior quarter and down from 32.8% in the same quarter last year.

GAAP operating expenses were $266.2 million, up 93% from $137.6 million in the prior quarter and up 123% from $119.5 million in the same quarter last year.

Non-GAAP operating expenses were $119.0 million, up 10% from $108.3 million in the prior quarter and up 26% from $94.1 million in the same quarter last year.

GAAP operating loss was $5.2 million, down from operating income of $84.4 million in the prior quarter and down from operating income of $41.0 million in the same quarter last year.

Non-GAAP operating income was a record $149.6 million, up 24% from $120.2 million in the prior quarter and up 105% from $72.9 million in the same quarter last year.

GAAP net income was $20.8 million, down 16% from $24.7 million in the prior quarter and down 49% from $41.0 million in the same quarter last year.

Non-GAAP net income was a record $171.5 million, up 217% from $54.1 million in the prior quarter and up 173% from $62.8 million in the same quarter last year.

GAAP net diluted EPS was $0.36, down from $0.43 in the prior quarter and down from $0.74 in the same quarter last year.

Non-GAAP net diluted EPS was a record $2.86, up from $0.91 in the prior quarter and up from $1.10 in the same quarter last year.

Cash flow from operating activities was $111.3 million, up from $5.6 million in the prior quarter and up from $89.6 million in the same quarter last year.

As of December 31, 2022, cash, cash equivalents, bank deposits, restricted bank deposits and marketable securities totaled $1.04 billion, net of debt, compared to $937.6 million on September 30, 2022.

Full Year 2022 Summary

Total record revenues of $3.11 billion, up 58% from $1.96 billion in the prior year.

GAAP gross margin was 27.2%, down from 32.0% in the prior year.

Non-GAAP gross margin was 28.2%, down from 33.5% in the prior year.

GAAP operating income was $166.1 million, down 20% from $207.1 million in the prior year.

Non-GAAP operating income was a record $441.7 million, up 37% from $321.4 million in the prior year.

GAAP net income was $93.8 million, down 45% from $169.2 million in the prior year.

Non-GAAP net income was a record $351.2 million, up 29% from $272.9 million in the prior year.

GAAP net diluted EPS was $1.65, down from $3.06 in the prior year.

Non-GAAP net diluted EPS was a record $5.95, up from $4.81 in the prior year.

Cash flow from operating activities of $31.3 million, down from $214.1 million in the prior year.

Outlook for the First Quarter 2023

The Company also provides guidance for the first quarter ending March 31, 2023 as follows:

  • Revenues to be within the range of $915 million to $945 million
  • Non-GAAP gross margin expected to be within the range of 28% to 31%
  • Non-GAAP operating profit to be within the range of $150 million to $170 million
  • Revenues from the solar segment to be within the range of $875 million to $905 million
  • Gross margin from the solar segment expected to be within the range of 31% to 34%

Conference Call

The Company will host a conference call to discuss these results at 4:30 p.m. ET on Monday, February 13, 2023. The call will be available, live, to interested parties by dialing 866-952-8559. For international callers, please dial +1 785-424-1744. The Conference ID is SEDG. To avoid a delay in connecting to the call, please dial in 10 minutes prior to the start time. A live webcast will also be available in the Investors Relations section of the Company’s website at: http://investors.solaredge.com

A replay of the webcast will be available in the Investor Relations section of the Company’s web site approximately two hours after the conclusion of the call and will remain available for approximately 30 calendar days.

About SolarEdge

SolarEdge is a global leader in smart energy technology. By leveraging world-class engineering capabilities and with a relentless focus on innovation, SolarEdge creates smart energy solutions that power our lives and drive future progress. SolarEdge developed an intelligent inverter solution that changed the way power is harvested and managed in photovoltaic (PV) systems. The SolarEdge DC optimized inverter seeks to maximize power generation while lowering the cost of energy produced by the PV system. Continuing to advance smart energy, SolarEdge addresses a broad range of energy market segments through its PV, storage, EV charging, batteries, electric vehicle powertrains, and grid services solutions. SolarEdge is online at www.solaredge.com

Use of Non-GAAP Financial Measures

The Company has presented certain non-GAAP financial measures in this release, such as non-GAAP net income, non-GAAP net diluted EPS, non-GAAP gross margin, non-GAAP operating expenses, non-GAAP operating income and non-GAAP gross margin from sale of solar products. Generally, a non-GAAP financial measure is a numerical measure of a company's performance, financial position, or cash flows that either exclude or include amounts that are not normally excluded or included in the most directly comparable measure calculated and presented in accordance with generally accepted accounting principles in the United States, or GAAP. Reconciliation of each non-GAAP financial measure to the most directly comparable GAAP financial measure can be found in the accompanying tables to this release. These non-GAAP financial measures do not reflect a comprehensive system of accounting, differ from GAAP measures with the same captions and may differ from non-GAAP financial measures with the same or similar captions that are used by other companies. As such, these non-GAAP measures should be considered as a supplement to, and not as a substitute for, or superior to, financial measures calculated in accordance with GAAP.

The Company uses these non-GAAP financial measures to analyze its operating performance and future prospects, develop internal budgets and financial goals, and to facilitate period-to-period comparisons. The Company believes that these non-GAAP financial measures reflect an additional way of viewing aspects of its operations that, when viewed with its GAAP results, provide a more complete understanding of factors and trends affecting its business.

Safe Harbor Statement under the Private Securities Litigation Reform Act of 1995

This release contains forward looking statements which are made pursuant to the safe harbor provisions of the Private Securities Litigation Reform Act of 1995. These forward-looking statements include information, among other things, concerning: our possible or assumed future results of operations; future demands for solar energy solutions; business strategies; technology developments; financing and investment plans; dividend policy; competitive position; industry and regulatory environment; general economic conditions; potential growth opportunities; and the effects of competition. These forward-looking statements are often characterized by the use of words such as “anticipate,” “believe,” “could,” “seek,” “estimate,” “expect,” “intend,” “may,” “plan,” “potential,” “predict,” “project,” “should,” “will,” “would” or similar expressions and the negative or plural of those terms and other like terminology.

Forward-looking statements are only predictions based on our current expectations and our projections about future events. These forward-looking statements involve known and unknown risks, uncertainties and other factors that may cause our actual results, levels of activity, performance or achievements to be materially different from those expressed or implied by the forward-looking statements. Given these factors, you should not place undue reliance on these forward-looking statements. These factors include, but are not limited to, the matters discussed in the section entitled “Risk Factors” of our Annual Report on Form 10-K for the year ended December 31, 2021, filed on February 22, 2022 and our quarterly reports filed on Form 10-Q, Current Reports on Form 8-K and other reports filed with the SEC. All information set forth in this release is as of February 13, 2023. The Company undertakes no duty or obligation to update any forward-looking statements contained in this release as a result of new information, future events or changes in its expectations.

SOLAREDGE TECHNOLOGIES INC.

CONDENSED CONSOLIDATED STATEMENTS OF INCOME

(in thousands, except per share data)


Three Months Ended
December 31,


Year Ended
December 31,


2022


2021


2022


2021


Unaudited


Revenues


$

890,702


$

551,915


$

3,110,279


$

1,963,865


Cost of revenues


629,655


391,424


2,265,631


1,334,547


Gross profit


261,047


160,491


844,648


629,318


Operating expenses:


Research and development


78,959


64,326


289,814


219,633


Sales and marketing


42,663


33,248


159,680


119,000


General and administrative


30,013


21,879


112,496


82,196


Goodwill impairment and other operating expenses, net


114,575


116,538


1,350


Total operating expenses


266,210


119,453


678,528


422,179


Operating income (loss)


(5,163

)


41,038


166,120


207,139


Financial income (expense), net


56,101


(6,324

)


3,316


(19,915

)

Other income


186


7,719


Income before income taxes


51,124


34,714


177,155


187,224


Income tax benefit (expense)


(30,295

)


6,240


(83,376

)


(18,054

)

Net income


$

20,829


$

40,954


$

93,779


$

169,170


SOLAREDGE TECHNOLOGIES INC.

CONDENSED CONSOLIDATED BALANCE SHEETS

(in thousands, except per share data)


December 31,


2022


2021


ASSETS


CURRENT ASSETS:


Cash and cash equivalents

$

783,112


$

530,089


Marketable securities


241,117


167,728


Trade receivables, net of allowances of $3,202 and $2,626, respectively


905,146


456,339


Inventories, net


729,201


380,143


Prepaid expenses and other current assets


241,082


176,992


Total current assets


2,899,658


1,711,291


LONG-TERM ASSETS:


Marketable securities


645,491


482,228


Deferred tax assets, net


44,153


27,572


Property, plant and equipment, net


543,969


410,379


Operating lease right-of-use assets, net


62,754


47,137


Intangible assets, net


19,929


58,861


Goodwill


31,189


129,629


Other long-term assets


18,806


33,856


Total long-term assets


1,366,291


1,189,662


Total assets


4,265,949


2,900,953


LIABILITIES AND STOCKHOLDERS’ EQUITY


CURRENT LIABILITIES:


Trade payables, net


459,831


252,068


Employees and payroll accruals


85,158


74,465


Warranty obligations


103,975


71,480


Deferred revenues and customers advances


26,641


17,789


Accrued expenses and other current liabilities


214,112


109,379


Total current liabilities


889,717


525,181


LONG-TERM LIABILITIES:


Convertible senior notes, net


624,451


621,535


Warranty obligations


281,082


193,680


Deferred revenues


186,936


151,556


Finance lease liabilities


45,385


40,508


Operating lease liabilities


46,256


38,912


Other long-term liabilities


15,756


19,542


Total long-term liabilities


1,199,866


1,065,733


COMMITMENTS AND CONTINGENT LIABILITIES


STOCKHOLDERS’ EQUITY:


Common stock of $0.0001 par value - Authorized: 125,000,000 shares as of December 31, 2022 and December 31, 2021; issued and outstanding: 56,133,404 and 52,815,395 shares as of December 31, 2022 and December 31, 2021, respectively


6


5


Additional paid-in capital


1,505,632


687,295


Accumulated other comprehensive loss


(73,109

)


(27,319

)

Retained earnings


743,837


650,058


Total stockholders’ equity


2,176,366


1,310,039


Total liabilities and stockholders’ equity

$

4,265,949


$

2,900,953


SOLAREDGE TECHNOLOGIES INC.

CONDENSED CONSOLIDATED STATEMENTS OF CASH FLOWS

(in thousands, except per share data)


Year ended December 31,


2022


2021


Cash flows from operating activities:


Net income


$

93,779


$

169,170


Adjustments to reconcile net income to net cash provided by operating activities:


Depreciation of property, plant and equipment


40,580


29,359


Amortization of intangible assets


9,096


10,176


Amortization of debt discount and debt issuance costs


2,916


2,903


Amortization of premium and accretion of discount on available-for-sale marketable securities, net


9,310


9,462


Impairment of goodwill and intangible assets


118,492


Stock-based compensation expenses


145,539


102,593


Gain from sale of privately held company


(7,719

)


Deferred income taxes, net


(11,055

)


(12,045

)

Exchange rate fluctuations and other items, net


10,052


20,697


Changes in assets and liabilities:


Inventories, net


(341,085

)


(43,051

)

Prepaid expenses and other assets


(64,991

)


(39,444

)

Trade receivables, net


(457,610

)


(247,723

)

Trade payables, net


194,524


91,709


Employees and payroll accruals


26,238


26,519


Warranty obligations


120,169


60,524


Deferred revenues and customers advances


44,376


29,936


Other liabilities, net


98,673


3,344


Net cash provided by operating activities


31,284


214,129


Cash flows from investing activities:


Proceed from sales and maturities of available-for-sale marketable securities


231,210


202,188


Purchase of property, plant and equipment


(169,341

)


(149,251

)

Investment in available-for-sale marketable securities


(507,171

)


(579,377

)

Investment in a privately-held company


(16,643

)

Proceeds from sale of a privately-held company


24,362


Withdrawal from bank deposits, net


60,096


Withdrawal from (investment in) restricted bank Deposits, net


(242

)


798


Other investing activities


4,138


(2,022

)

Net cash used in investing activities


(417,044

)


(484,211

)

Cash flows from financing activities:


Proceeds from secondary public offering, net of issuance costs


650,526


Repayment of bank loans


(138

)


(16,073

)

Proceeds from exercise of stock-based award


4,030


6,486


Tax withholding in connection with stock-based awards, net


3,023


(4,283

)

Other financing activities


(2,834

)


(1,308

)

Net cash provided by (used in) financing activities


654,607


(15,178

)

Increase (decrease) in cash and cash equivalents


268,847


(285,260

)

Cash and cash equivalents at the beginning of the period


530,089


827,146


Effect of exchange rate differences on cash and cash equivalents


(15,824

)


(11,797

)

Cash and cash equivalents at the end of the period


$

783,112


$

530,089


SOLAREDGE TECHNOLOGIES INC.

RECONCILIATION OF NON-GAAP FINANCIAL MEASURES (Unaudited)

(in thousands, except per share data and percentages)


Reconciliation of GAAP to Non-GAAP


Three Months Ended


Year ended


December 31,
2022


September 30,
2022


December 31,
2021


December 31,
2022


December 31,
2021

Gross profit (GAAP)

$

261,047


$

222,001


$

160,491


$

844,648


$

629,318


Revenues from finance component


(174

)


(159

)


(122

)


(614

)


(418

)

Stock-based compensation


6,810


4,661


4,373


21,818


18,743


Disposal of assets related to Critical Power


4,314


Amortization and depreciation of acquired assets


961


2,064


2,272


7,429


9,326


Gross profit (Non-GAAP)

$

268,644


$

228,567


$

167,014


$

877,595


$

656,969


Gross margin (GAAP)


29.3

%


26.5

%


29.1

%


27.2

%


32.0

%

Revenues from finance component


0.0

%


0.0

%


0.0

%


0.0

%


0.0

%

Stock-based compensation


0.8

%


0.6

%


0.8

%


0.7

%


1.0

%

Disposal of assets related to Critical Power


%


%


%


0.1

%


%

Amortization and depreciation of acquired assets


0.1

%


0.2

%


0.4

%


0.2

%


0.5

%

Gross margin (Non-GAAP)


30.2

%


27.3

%


30.3

%


28.2

%


33.5

%


Operating expenses (GAAP)

$

266,210


$

137,594


$

119,453


$

678,528


$

422,179


Stock-based compensation - R&D


(16,854

)


(14,553

)


(14,872

)


(63,211

)


(45,424

)

Stock-based compensation - S&M


(7,928

)


(9,341

)


(5,882

)


(31,017

)


(22,834

)

Stock-based compensation - G&A


(7,015

)


(7,196

)


(4,076

)


(29,493

)


(15,592

)

Amortization and depreciation of acquired assets - R&D


(301

)


(302

)


(302

)


(1,206

)


(530

)

Amortization and depreciation of acquired assets - S&M


(173

)


(187

)


(225

)


(822

)


(927

)

Amortization and depreciation of acquired assets - G&A


(4

)


(6

)


(6

)


(21

)


(29

)

Assets impairment


(114,473

)


19


(119,141

)


(2,209

)

Gain (loss) from assets sales and disposal


(93

)


744


18


1,053


117


Other items


(359

)


1,559


1,200


859


Operating expenses (Non-GAAP)

$

119,010


$

108,331


$

94,108


$

435,870


$

335,610


SOLAREDGE TECHNOLOGIES INC.

RECONCILIATION OF NON-GAAP FINANCIAL MEASURES (Unaudited)

(in thousands, except per share data and percentages)


Reconciliation of GAAP to Non-GAAP


Three Months Ended


Year ended


December 31,
2022


September 30,
2022


December 31,
2021


December 31,
2022


December 31,
2021

Operating income (GAAP)

$

(5,163

)


$

84,407


$

41,038


$

166,120


$

207,139


Revenues from finance component


(174

)


(159

)


(122

)


(614

)


(418

)

Disposal of assets related to Critical Power


4,314


Stock-based compensation


38,607


35,751


29,203


145,539


102,593


Amortization and depreciation of acquired assets


1,439


2,559


2,805


9,478


10,812


Assets impairment


114,473


(19

)


119,141


2,209


Loss (gain) from assets sales and disposal


93


(744

)


(18

)


(1,053

)


(117

)

Other items


359


(1,559

)


(1,200

)


(859

)

Operating income (Non-GAAP)

$

149,634


$

120,236


$

72,906


$

441,725


$

321,359


Financial income (expense), net (GAAP)

$

56,101


$

(33,025

)


$

(6,324

)


$

3,316


$

(19,915

)

Notes due 2025


730


730


727


2,916


2,903


Non cash interest


1,955


1,775


1,527


7,038


5,771


Unrealized losses


(170

)


(541

)


(170

)


(541

)

Currency fluctuation related to lease standard


749


(1,116

)


2,422


(11,187

)


2,007


Financial income (expense), net (Non-GAAP)

$

59,365


$

(31,636

)


$

(2,189

)


$

1,913


$

(9,775

)


Other income (GAAP)

$

186


$

7,533


$


$

7,719


$


Gain from sale of investment in privately-held company


(186

)


(7,533

)


(7,719

)


Other income (Non-GAAP)

$


$


$


$


$


Income tax benefit (expense) (GAAP)

$

(30,295

)


$

(34,172

)


$

6,240


$

(83,376

)


$

(18,054

)

Uncertain tax positions


(9,007

)


(9,007

)

Income tax adjustment


(7,186

)


(291

)


(5,181

)


(9,067

)


(11,639

)

Income tax benefit (expense) (Non-GAAP)

$

(37,481

)


$

(34,463

)


$

(7,948

)


$

(92,443

)


$

(38,700

)

SOLAREDGE TECHNOLOGIES INC.

RECONCILIATION OF NON-GAAP FINANCIAL MEASURES (Unaudited)

(in thousands, except per share data and percentages)


Reconciliation of GAAP to Non-GAAP


Three Months Ended


Year ended


December 31,
2022


September 30,
2022


December 31,
2021


December 31,
2022


December 31,
2021

Net income (GAAP)

$

20,829


$

24,743


$

40,954


$

93,779


$

169,170


Revenues from finance component


(174

)


(159

)


(122

)


(614

)


(418

)

Disposal of assets related to Critical Power


4,314


Stock-based compensation


38,607


35,751


29,203


145,539


102,593


Amortization and depreciation of acquired assets


1,439


2,559


2,805


9,478


10,812


Assets impairment


114,473


(19

)


119,141


2,209


Loss (gain) from assets sales and disposal


93


(744

)


(18

)


(1,053

)


(117

)

Other items


359


(1,559

)


(1,200

)


(859

)

Notes due 2025


730


730


727


2,916


2,903


Non cash interest


1,955


1,775


1,527


7,038


5,771


Unrealized losses


(170

)


(541

)


(170

)


(541

)

Currency fluctuation related to lease standard


749


(1,116

)


2,422


(11,187

)


2,007


Gain from sale of investment in privately-held company


(186

)


(7,533

)


(7,719

)


Uncertain tax positions


(9,007

)


(9,007

)

Income tax adjustment


(7,186

)


(291

)


(5,181

)


(9,067

)


(11,639

)

Net income (Non-GAAP)

$

171,518


$

54,137


$

62,769


$

351,195


$

272,884


Net basic earnings per share (GAAP)

$

0.37


$

0.44


$

0.78


$

1.70


$

3.24


Revenues from finance component


0.00


0.00


0.00


(0.01

)


(0.01

)

Disposal of assets related to Critical Power


0.08


Stock-based compensation


0.69


0.64


0.55


2.64


1.97


Amortization and depreciation of acquired assets


0.02


0.05


0.05


0.17


0.21


Assets impairment


2.05


0.00


2.17


0.05


Loss (gain) from assets sales and disposal


0.00


(0.02

)


0.00


(0.02

)


(0.01

)

Other items


0.01


(0.02

)


(0.02

)


(0.02

)

Notes due 2025


0.01


0.01


0.02


0.05


0.05


Non cash interest


0.04


0.03


0.03


0.13


0.11


Unrealized losses


(0.01

)


(0.01

)


(0.01

)


(0.01

)

Currency fluctuation related to lease standard


0.02


(0.02

)


0.04


(0.20

)


0.04


Gain from sale of investment in privately-held company


(0.01

)


(0.13

)


(0.14

)


Uncertain tax positions


(0.17

)


(0.17

)

Income tax adjustment


(0.13

)


(0.01

)


(0.10

)


(0.16

)


(0.22

)

Net basic earnings per share (Non-GAAP)

$

3.06


$

0.97


$

1.19


$

6.38


$

5.23


Contacts

Investor Contacts
SolarEdge Technologies, Inc.
Ronen Faier, Chief Financial Officer
+1 510-498-3263
This email address is being protected from spambots. You need JavaScript enabled to view it.

Sapphire Investor Relations, LLC
Erica Mannion or Michael Funari
+1 617-542-6180
This email address is being protected from spambots. You need JavaScript enabled to view it.


Read full story here

Enteligent’s charger is powered directly from the sun and eliminates inefficient DC to AC power conversion, reducing energy consumption and cost

MORGAN HILL, Calif.--(BUSINESS WIRE)--Enteligent Inc., developer of solar power optimization and electric vehicle (EV) solar charging technologies that delivers more of the clean solar energy you generate and dramatically reduces cost, is unveiling the world’s first DC-to-DC solar hybrid bi-directional EV charger this week at Intersolar NA 2023 in Booth 2460. Powered directly from the sun, Enteligent’s solar EV charger can supply 25 kW of fast DC charging – three times faster than AC Level 2 EV chargers – while also supporting vehicle-to-home (V2H) and vehicle-to-grid (V2G) home energy resilience and providing significant energy savings.


Image: Enteligent solar EV charger

Currently, EV owners plug their cars into home chargers which are powered by an alternating current (AC) flow of energy generated from the electric grid. But EV batteries operate on a direct current (DC) requiring the power to be converted from AC-to-DC in the charging process. This conversion is inefficient and results in a significant amount of lost energy and a longer charging time.

By eliminating the AC-to-DC conversion, Enteligent’s EV chargers help users optimize every kilowatt of precious, clean energy, resulting in up to 25% energy savings. And direct charging DC by-passes the EV’s internal conversion electronics, dramatically improving the time necessary to charge.

Additionally, BloombergNEF forecasts that by the end of this decade 52% of the total car market will be composed of EVs. Today, the vast majority of EVs are charged overnight by a fossil fuel-powered grid. With the dramatically increased number of EVs plugged in at night and with the rapidly growing array of household electronics we rely on daily, this proliferation of required electricity will strain the grid’s ability to reliability meet energy demand.

Enteligent’s proprietary solar EV chargers make it convenient and affordable to charge during the day, direct from convenient on-site solar generation, fostering a fundamental shift in energy consumption habits that leverage solar power when it is locally generated and readily available.

“Rapid growth in EV ownership and usage and the resulting demand for energy are putting increased pressure on an already stretched electricity grid,” said Sean Burke, founder, and CEO of Enteligent. “This first-of-its-kind technology will benefit consumers by enabling them to shift from night-time charging, which is dependent on the fossil-fuel powered grid, to clean, solar-based, daytime charging.”

About Enteligent

Enteligent is a California-based developer of smart solar power optimization and solar EV charging technologies that dramatically increase energy utilization, improve returns on energy investments and enable critical paradigm shifts in how we use energy for the upcoming green electrification revolution. Enteligent’s NMax photovoltaic module power optimizers use smart digital technology to dynamically adjust when to optimize and provide panel-level monitoring data, resulting in greater rooftop yield, more energy harvesting and higher system reliability. Enteligent’s bidirectional DC solar EV chargers enable direct electrification from clean energy to charge faster and more efficiently, recouping up to 25% of the electricity lost by traditional means. Learn more about Enteligent at: https://enteligent.com/


Contacts

Wendy Prabhu, Mercom Communications
This email address is being protected from spambots. You need JavaScript enabled to view it.
US: +1.512.215.4452

CENTENNIAL, Colo.--(BUSINESS WIRE)--Vitesse Energy, Inc. (NYSE: VTS) (“we,” “our,” “Vitesse,” or “the Company”) today announced the Company’s 2022 results and declared a quarterly cash dividend.

Unless otherwise stated herein, the financial and operating results presented in this press release are that of Vitesse Energy, LLC (“Vitesse Energy”), Vitesse’s predecessor, for the years ended December 31, 2022 and 2021 and do not include the results of operations of Vitesse Oil, LLC (“VO”), which was acquired on January 13, 2023. On November 30, 2022, Vitesse Energy changed its fiscal year end for 2022 to December 31 from November 30. Financial and operating results have been recast for the year ended December 31, 2021. See “Historical Financial Information” included elsewhere in this release.

HIGHLIGHTS

  • Completed spin-off from Jefferies Financial Group Inc. (the “Spin-Off”) and closed the acquisition of VO on January 13, 2023
  • Declared a quarterly cash dividend of $0.50 per common share to be paid in the first quarter of 2023
  • 2022 net income of $118.9 million, an increase of 682% over 2021
  • 2022 production of 10,376 barrels of oil equivalent (“Boe”) per day (68% oil), an increase of 4% from 2021
  • 2022 Adjusted EBITDA(1) of $167.6 million, an increase of 58% over 2021
  • Net Debt to Adjusted EBITDA ratio(1) of 0.23, a decrease from 0.59 for 2021
  • 2022 cash flow from operations of $147.0 million and 2022 Free Cash Flow(1) of $100.0 million
  • Approved a $60 million share repurchase program

(1) Non-GAAP financial measure; see reconciliation schedules at the end of this release

MANAGEMENT COMMENTS

Bob Gerrity, Vitesse’s Chairman and Chief Executive Officer, commented, “As an independent, publicly traded company we will continue to focus on returning capital to stockholders through our non-operated financial ownership in producing oil and gas wells and the conversion of our deep inventory of highly economic undeveloped drilling locations.”

STOCKHOLDER RETURNS

Vitesse’s Board of Directors declared a quarterly cash dividend for Vitesse’s common stock of $0.50 per share for stockholders of record as of March 15, 2023, which will be paid on March 31, 2023. Subject to board approval and applicable law, Vitesse currently intends to pay quarterly dividends of $0.50 per share.

In addition, Vitesse’s Board of Directors approved a stock repurchase program authorizing the repurchase of up to $60 million of the Company’s common stock. As the Company continues to focus on its goal of maximizing total shareholder return, the Board of Directors along with the management team believe that a share repurchase program is complementary to the dividend and is a tax efficient means to further improve shareholder return.

Under the stock repurchase program, Vitesse may repurchase shares of its common stock from time to time in open market transactions or such other means as will comply with applicable rules, regulations and contractual limitations. The Board of Directors may limit or terminate the stock repurchase program at any time without prior notice. The extent to which the Company repurchases its shares of common stock, and the timing of such repurchases, will depend upon market conditions and other considerations as may be considered in the Company’s sole discretion.

FINANCIAL AND OPERATING RESULTS

Total revenue for 2022 was $300.1 million, an increase of 55% over 2021. Net income was $118.9 million during 2022, an increase of 682% over 2021. Adjusted EBITDA for 2022 was $167.6 million, an increase of 58% over 2021. See “Non-GAAP Financial Measures” below.

Oil and gas production during 2022 averaged 10,376 Boe per day, an increase of 4% from 2021. Oil represented 68% of production and 81% of total revenue in 2022.

During 2022, Vitesse’s realized oil and natural gas prices before hedging were $94.16 per Bbl and $7.92 per Mcf, respectively. Vitesse hedges a portion of its oil and natural gas production to reduce commodity price volatility on its financial results. In 2022, the Company’s realized oil price with hedging was only $76.09 per Bbl and its realized natural gas price was $7.84 per Mcf.

Production expenses in 2022, including gathering and transportation, were $49.3 million, or $13.02 per Boe, an increase of 6% on a per unit basis compared to 2021. The higher production expense was primarily related to increased workover activity and inflationary pressure on service costs.

General and administrative (“G&A”) costs for 2022 totaled $19.8 million, or $5.24 per Boe, which included $7.9 million of costs related to the Spin-Off. Excluding these costs related to the Spin-Off, G&A would have been $3.15 per Boe, an increase of 6% on a per unit basis compared to 2021.

RESERVES

Total proved reserves at December 31, 2022 increased 3% from 2021 to 43.8 million Boe (62% proved developed) with a Standardized Measure and PV-10 value of $1.18 billion (67% proved developed) at oil and natural gas prices determined in accordance with the SEC’s rules regarding reserve reporting currently in effect, including the use of an average price equal to the 12-month unweighted arithmetic average of the first day of the month prices for each of the preceding 12 months as adjusted for location and quality differentials, unless prices are defined by contractual arrangements, excluding escalations based on future conditions (“SEC Pricing”). The Standardized Measure and PV-10 value were equivalent as future income taxes for Vitesse as of December 31, 2022 were zero due to Vitesse Energy’s tax status as a pass-through entity.


SEC PRICING PROVED RESERVES (1)


RESERVES VOLUMES


PV-10 (3)

RESERVE CATEGORY

OIL
(MBbls)


NATURAL GAS
(MMcf)


TOTAL
(MBoe) (2)


%


AMOUNT
(in thousands)


%

PDP Properties

17,149


58,778


26,945


62%


$ 786,959


67%

PDNP Properties

141


119


161


—%


6,577


—%

PUD Properties

13,155


21,217


16,691


38%


386,448


33%

Total

30,445


80,114


43,797


100%


$1,179,984


100%

(1)

Oil and natural gas reserve quantities and related discounted future net cash flows are valued as of December 31, 2022 based on average prices of $94.14 per barrel of oil and $6.36 per MMBtu of natural gas. Under SEC guidelines, these prices represent the average prices per barrel of oil and per MMBtu of natural gas at the beginning of each month in the twelve-month period prior to the end of the reporting period.

(2)

MBoe are computed based on a conversion ratio of one Boe for each barrel of oil and one Boe for every 6 Mcf of natural gas.

(3)

PV-10 is a non-GAAP financial measure that does not include the effects of income taxes on future net revenues, and are not intended to represent fair market value of our oil and natural gas properties. For a definition of and reconciliation of PV-10 to its nearest GAAP financial measure, see the reconciliation schedules at the end of this release.

Vitesse’s PV-10 and proved reserves at year-end 2022 do not include the recently closed VO acquisition, which had a year-end PV-10 value of $65.6 million at SEC Pricing and proved reserves of 2.1 million Boe. Vitesse’s year-end 2022 pro forma PV-10 and proved reserves, giving effect to the acquisition of VO, were $1.25 billion and 45.9 million Boe, respectively. The reserves are calculated under SEC guidelines relating to both commodity price assumptions and a maximum five-year drill schedule. The SEC Pricing used as of December 31, 2022 was $94.14 per barrel of oil and $6.36 per MMBtu of natural gas. See “Non-GAAP Financial Measures” below regarding PV-10 value.

LIQUIDITY AND CAPITAL EXPENDITURES

As of December 31, 2022, Vitesse had $10.0 million in cash and $48.0 million of borrowings outstanding on its revolving credit facility. Vitesse had total liquidity of $132 million as of December 31, 2022, consisting of cash and committed borrowing availability under the revolving credit facility.

Upon completion of the Spin-Off, Vitesse entered into a new revolving credit facility, which amended and restated the Vitesse Energy’s prior credit facility. Borrowings under the new revolving credit facility were $53.0 million as of the completion of the Spin-Off. While the new revolving credit facility has elected commitments of $170 million, the borrowing base is $265 million.

During 2022, Vitesse spent $56.0 million on development capital expenditures and $28.5 million on acquisitions of oil and gas properties.

2023 ANNUAL GUIDANCE

Vitesse anticipates production on a two-stream basis to be in the range of 10,800-11,800 Boe per day in 2023, an increase of approximately 9% at the midpoint from 2022 levels. Vitesse expects total capital spending in the range of $60 - $80 million for 2023.


2023 Guidance

Annual Production (Boe per day)

10,800 - 11,800

Oil as a Percentage of Annual Production

66% - 70%

Total Capital Expenditures ($ in millions)

$60 -$80

Note: For the quarter ended March 31, 2023, Vitesse will incur a charge of approximately $28 million related to non-cash Stock-based compensation in connection with the Spin-Off.

FULL YEAR 2022 RESULTS

The following table sets forth selected financial and operating data for the periods indicated.


YEAR ENDED
DECEMBER 31,


INCREASE
(DECREASE)

($ in thousands, except per unit data)

2022


2021


AMOUNT


PERCENT

Financial and Operating Results:


Revenue


Oil

$

242,467


$

158,400


$

84,067


53

%

Natural gas


57,603


35,046


22,557


64

%

Total revenue

$

300,070


$

193,446


$

106,624


55

%

Operating Expenses


Production

$

49,313


$

44,561


$

4,752


11

%

Production taxes


24,092


15,012


9,080


60

%

General and administrative


19,833


10,738


9,095


85

%

Depletion, depreciation, amortization, and accretion


63,732


60,883


2,849


5

%

Unit-based compensation


(10,766

)


4,037


(14,803

)


*nm

Interest Expense

$

4,153


$

3,125


$

1,028


33

%

Commodity Derivative Gain (Loss)

$

(30,830

)


$

(39,891

)


$

9,061


(23

)%

Production Data:


Oil (MBbls)


2,575


2,447


128


5

%

Natural gas (MMcf)


7,274


7,084


190


3

%

Combined volumes (MBoe)


3,787


3,627


160


4

%

Daily combined volumes (Boe/d)


10,376


9,937


439


4

%

Average Realized Prices before Hedging:


Oil (per Bbl)

$

94.16


$

64.74


$

29.42


45

%

Natural gas (per Mcf)


7.92


4.95


2.97


60

%

Combined (per Boe)


79.24


53.33


25.91


49

%

Average Realized Prices with Hedging:


Oil (per Bbl)

$

76.09


$

58.16


$

17.93


31

%

Natural gas (per Mcf)


7.84


4.83


3.01


62

%

Combined (per Boe)


66.79


48.67


18.12


37

%

Average Costs (per Boe):


Production

$

13.02


$

12.29


$

0.73


6

%

Production taxes


6.36


4.14


2.22


54

%

General and administrative


5.24


2.96


2.28


77

%

Depletion, depreciation, amortization, and accretion


16.83


16.79


0.04


%


COMMODITY HEDGING

Vitesse hedges a portion of its expected annual oil production volumes to increase the predictability and certainty of its cash flow and to help maintain a strong financial position. The following table summarizes Vitesse’s open oil commodity derivative swap contracts scheduled to settle after December 31, 2022.

SETTLEMENT PERIOD

OIL (barrels)


WEIGHTED AVERAGE
PRICE $

Swaps-Crude Oil


2023:


Q1

345,000


$ 78.28

Q2

345,000


$ 78.28

Q3

345,000


$ 78.28

Q4

305,000


$ 77.66

2024:


Q1

180,000


$ 75.97

Q2

180,000


$ 75.97

Q3

180,000


$ 75.97

Q4

120,000


$ 75.97


The following table presents Vitesse’s settlements on commodity derivative instruments and unsettled gains and losses on open commodity derivative instruments for the periods presented:


YEAR END
DECEMBER 31,


2022


2021


(in thousands)

Realized gain (loss) on commodity derivatives

$

(47,124

)


$

(16,914

)

Unrealized gain (loss) on commodity derivatives


16,294


(22,977

)

Total commodity derivative gain (loss)

$

(30,830

)


$

(39,891

)


2022 EARNINGS RELEASE CONFERENCE CALL

In conjunction with Vitesse’s release of its financial and operating results, investors, analysts and other interested parties are invited to listen to a conference call with management on Tuesday, February 14, 2023 at 9:00 a.m. Eastern Standard Time.

An updated corporate slide presentation that may be referenced on the conference call will be posted prior to the conference call on Vitesse’s website, www.vitesse-vts.com, in the “Investor Relations” section of the site, under “News & Events,” sub-tab “Presentations.” Certain slides in the presentation will include the financial and operating results of VO, which was acquired on January 13, 2023.

Those wishing to listen to the conference call may do so via the Company’s website or by phone as follows:

Website: https://event.choruscall.com/mediaframe/webcast.html?webcastid=CVEVzRZD

Dial-In Number: 877-407-0778 (US/Canada) and 201-689-8565 (International)

Conference ID: 13736198 - 2022 Earnings Call

Replay Dial-In Number: 877-660-6853 (US/Canada) 201-612-7415 (International)

Replay Access Code: 13736198 - Replay will be available through February 21, 2023

ABOUT VITESSE ENERGY, INC.

Vitesse Energy, Inc. is focused on returning capital to stockholders through owning financial interests as a non-operator in oil and gas wells drilled by leading US operators.

FORWARD-LOOKING STATEMENTS

This press release contains forward-looking statements regarding future events and future results that are subject to the safe harbors created under the Securities Act of 1933 and the Securities Exchange Act of 1934. All statements other than statements of historical facts included in this release regarding Vitesse’s financial position, operating and financial performance, development pace and drilling inventory, business strategy, dividend plans and practices, guidance, Vitesse’s share repurchase program, plans and objectives of management for future operations, and industry conditions are forward-looking statements. When used in this release, forward-looking statements are generally accompanied by terms or phrases such as “estimate,” “project,” “predict,” “believe,” “expect,” “continue,” “anticipate,” “target,” “could,” “plan,” “intend,” “seek,” “goal,” “will,” “should,” “may” or other words and similar expressions that convey the uncertainty of future events or outcomes. Items contemplating or making assumptions about actual or potential future production and sales, market size, collaborations, and trends or operating results also constitute such forward-looking statements.

Forward-looking statements involve inherent risks and uncertainties, and important factors (many of which are beyond Vitesse’s control) that could cause actual results to differ materially from those set forth in the forward-looking statements, including the following: changes in oil and natural gas prices; the pace of drilling and completions activity on Vitesse’s properties; Vitesse’s ability to acquire additional development opportunities; potential acquisition transactions; integration and benefits of property acquisitions, or the effects of such acquisitions on Vitesse’s cash position and levels of indebtedness; changes in Vitesse’s reserves estimates or the value thereof; disruptions to Vitesse’s business due to acquisitions and other significant transactions; infrastructure constraints and related factors affecting Vitesse’s properties; cost inflation or supply chain disruption; ongoing legal disputes over and potential shutdown of the Dakota Access Pipeline; the COVID-19 pandemic and its related economic repercussions and effect on the oil and natural gas industry; the impact of general economic or industry conditions, nationally and/or in the communities in which Vitesse conducts business; changes in the interest rate environment, legislation or regulatory requirements; conditions of the securities markets; Vitesse’s ability to raise or access capital; cyber-related risks; changes in accounting principles, policies or guidelines; and financial or political instability, health-related epidemics, acts of war (including the armed conflict in Ukraine) or terrorism, and other economic, competitive, governmental, regulatory and technical factors affecting Vitesse’s operations, products and prices. Additional information concerning potential factors that could affect future results is included in the section entitled “Item 1A. Risk Factors” and other sections of Vitesse’s Annual Report on Form 10-K and subsequent Quarterly Reports on Form 10-Q, as updated from time to time in amendments and subsequent reports filed with the SEC, which describe factors that could cause Vitesse’s actual results to differ from those set forth in the forward looking statements.

Vitesse has based these forward-looking statements on its current expectations and assumptions about future events. While management considers these expectations and assumptions to be reasonable, they are inherently subject to significant business, economic, competitive, regulatory and other risks, contingencies and uncertainties, most of which are difficult to predict and many of which are beyond Vitesse’s control. Vitesse does not undertake any duty to update or revise any forward-looking statements, except as may be required by the federal securities laws.

HISTORICAL FINANCIAL INFORMATION

As discussed above, Vitesse Energy is the “predecessor” of Vitesse for financial reporting purposes. As a result, unless otherwise indicated, the historical financial and operating data presented in this release are those of Vitesse Energy and do not include the results of operations of VO, which was acquired on January 13, 2023. On November 30, 2022, the board of managers of Vitesse Energy approved a change in fiscal year end from November 30 to December 31. As a result, Vitesse Energy’s 2022 fiscal year end began on January 1, 2022 and ended December 31, 2022 and there was a transition period from December 1, 2021 to December 31, 2021. The historical information has been presented for informational purposes only and is not necessarily indicative of Vitesse’s future financial position or results of operations.

VITESSE ENERGY, LLC

Consolidated Statements of Operations


FOR THE YEAR ENDED
DECEMBER 31,


FOR THE MONTH ENDED
DECEMBER 31,


FOR THE YEARS ENDED
NOVEMBER 30,

(In thousands, except per share data)

2022


2021


2021


2020

Revenue


Oil

$

242,467


$

15,241


$

151,838


$

91,542


Natural gas


57,603


2,747


33,340


5,688


Total revenue


300,070


17,988


185,178


97,230


Operating Expenses


Production expense


49,313


3,794


43,910


41,731


Production taxes


24,092


1,340


14,535


9,173


General and administrative


19,833


950


10,581


9,196


Depletion, deprecation, amortization, and accretion


63,732


5,417


60,846


58,307


Impairment of proved oil and gas properties


13,200


Unit-based compensation


(10,766

)


2,628


1,409


(544

)

Total operating expenses


146,204


14,129


131,281


131,063


Operating Income (Loss)


153,866


3,859


53,897


(33,833

)

Other (Expense) Income


Commodity derivative (loss) gain, net


(30,830

)


(10,982

)


(32,590

)


29,633


Interest expense


(4,153

)


(237

)


(3,207

)


(4,679

)

Other income


20


1


14


22


Total other (expense) income


(34,963

)


(11,218

)


(35,783

)


24,976


Net Income (Loss)

$

118,903


$

(7,359

)


$

18,114


$

(8,857

)

Net income (loss) per common unit-basic and diluted

$

0.26


$

(0.02

)


$

0.04


$

(0.02

)


VITESSE ENERGY, LLC

Consolidated Balance Sheets


DECEMBER 31,


NOVEMBER 30,

(in thousands except units)

2022


2021


2021


Assets


Current Assets


Cash

$

10,007


$

5,356


$

2,801


Revenue receivable


41,393


30,629


31,959


Commodity derivatives


2,112


1,513


Prepaid expenses and other current assets


841


138


148


Total current assets


54,353


36,123


36,421


Oil and Gas Properties-Using the successful efforts method of accounting


Proved oil and gas properties


985,751


893,920


890,788


Less accumulated DD&A and impairment


(382,974

)


(319,675

)


(314,292

)

Total oil and gas properties


602,777


574,245


576,496


Other Property and Equipment—Net


114


215


223


Other Assets


Commodity derivatives


1,155


Other noncurrent assets


2,085


943


988


Total other assets


3,240


943


988


Total assets

$

660,484


$

611,526


$

614,128


Liabilities, Redeemable Units, and Members' Equity


Current Liabilities


Accounts payable

$

7,207


$

7,940


$

4,593


Accrued liabilities


25,849


15,610


18,617


Commodity derivatives


3,439


16,466


8,672


Other current liabilities


184


316


318


Total current liabilities


36,679


40,332


32,200


Long-term Liabilities


Revolving credit facility


48,000


68,000


68,000


Unit-based compensation


10,980


8,352


Asset retirement obligations


6,823


6,156


6,132


Other noncurrent liabilities


194


221


Total liabilities


91,502


125,662


114,905


Commitments and contingencies


Redeemable Management Incentive Units


4,559


5,790


4,831


Members' Equity-common units-450,000,000 units outstanding


564,423


480,074


494,392


Total liabilities, redeemable units, and members' equity

$

660,484


$

611,526


$

614,128


NON-GAAP FINANCIAL MEASURES

Net Debt is calculated by deducting cash on hand from the amount outstanding on our revolving credit facility as of the balance sheet or measurement date.

Adjusted EBITDA is defined as net income before expenses for interest, income taxes, depletion, depreciation, amortization and accretion, and excludes non-cash gains and losses on unsettled derivative instruments and non-cash unit-based compensation in addition to certain items we consider non-routine in nature, including non-cash oil and natural gas property impairments and material general and administrative costs related to the Spin-Off.

Vitesse defines Free Cash Flow as cash flow from operations, adding back changes in operating assets and liabilities, less development of oil and gas properties. A reconciliation of each of these measures to the most directly comparable GAAP measure is included below.

“PV-10” is the present value of estimated future oil and gas revenues, net of estimated direct expenses, discounted at an annual discount rate of 10% to estimate the present value of proved oil and natural gas reserves. PV-10 is a non-GAAP financial measure and is derived from the Standardized Measure, which is the most directly comparable GAAP measure for proved reserves calculated using SEC Pricing. PV-10 is a computation of the Standardized Measure on a pre-tax basis. PV-10 is equal to the Standardized Measure at the applicable date, before deducting future income taxes discounted at 10 percent. A reconciliation of PV-10 to the Standardized Measure is included below.

Management believes the use of these non-GAAP financial measures provides useful information to investors to gain an overall understanding of financial performance. Specifically, management believes the non-GAAP financial measures included herein provide useful information to both management and investors by excluding certain items that management believes are not indicative of Vitesse’s core operating results. In addition, these non-GAAP financial measures are used by management for budgeting and forecasting as well as subsequently measuring Vitesse’s performance, and management believes it is providing investors with financial measures that most closely align to its internal measurement processes.


Contacts

INVESTOR AND MEDIA CONTACT
Ben Messier, CFA
Director – Investor Relations
(720) 532-8232
This email address is being protected from spambots. You need JavaScript enabled to view it.


Read full story here
Offshore Source Logo

Offshore Source keeps you updated with relevant information concerning the Offshore Energy Sector.

Any views or opinions represented on this website belong solely to the author and do not represent those of the people, institutions or organizations that Offshore Source or collaborators may or may not have been associated with in a professional or personal capacity, unless explicitly stated.

Corporate Offices

Technology Systems Corporation
8502 SW Kansas Ave
Stuart, FL 34997

info@tscpublishing.com