Business Wire News

  •  Fourth quarter revenue grew to $4.0 million, up over 2.5 times over the prior-year period and up 11% sequentially
  • Revenue for 2021 increased 27% to $13.3 million driven by strong demand for SDP’s flagship Drill-N-Ream® wellbore conditioning tool and the significant recovery in oil & gas production in North America
  • Achieved net income of $645 thousand for the quarter and Adjusted EBITDA* of $827 thousand, or 20.9% as a percent of revenue
  • Ended year with $6.1 million in shareholders’ equity

*Adjusted EBITDA is a non-GAAP measure. See comments regarding the use of non-GAAP measures and the reconciliation of GAAP to non-GAAP measures in the tables of this release


VERNAL, Utah--(BUSINESS WIRE)--Superior Drilling Products, Inc. (NYSE American: SDPI) (“SDP” or the “Company”), a designer and manufacturer of drilling tool technologies, today reported financial results for the fourth quarter of 2021 ended December 31, 2021.

Troy Meier, Chairman and CEO, commented, “We had exceptional growth in demand for our Drill-N-Ream® wellbore conditioning tool (“DNR”) as the number of operators and rigs using the tool continues to grow. It would appear as well that we are now reaching a point where tool fleet replacement is required as tool sales in the quarter picked up measurably.”

He added, “We have been building out our team and focused on training to be able to deliver to demand in 2022. We are working hard to address the challenges of talent management and retention, stay ahead of supply chain constraints and meet our customers’ requirements as demand continues to expand.”

Fourth Quarter 2021 Review ($ in thousands, except per share amounts) (See at “Definitions” the composition of product/service revenue categories.)

($ in thousands) December 31,
2021
September 30,
2021
December 31,
2020
Change
Sequential
Change
Year/Year
North America


3,546


3,041


1,203

16.6%

194.7%

International


405


521


338

(22.3)%

19.7%

Total Revenue

$

3,950

$

3,562

$

1,541

10.9%

156.3%

Tool Sales/Rental

$

1,545

$

836


342

84.8%

351.7%

Other Related Tool Revenue


1,422


1,510


561

(5.8)%

153.4%

Tool Revenue


2,967


2,346


903

26.5%

228.5%

Contract Services


983


1,216


638

(19.1)%

54.1%

Total Revenue

$

3,950

$

3,562

$

1,541

10.9%

156.3%

Significant growth in revenue year-over-year reflected a strong recovery in the oil & gas industry especially in North America, growing market penetration of the Company’s DNR in North America and the related expanded demand for new drilling tools.

For the fourth quarter 2021, approximately 90% of revenue was from North America and approximately 10% from international markets, all within the Middle East. Revenue in North America grew year-over-year from increased tool revenue and strong growth in Contract Services.

Fourth Quarter 2021 Operating Costs

($ in thousands, except per share amounts) December 31,
2021
September 30,
2021
December 31,
2020
Change
Sequential
Change
Year/Year
Cost of revenue

$

1,777

$

1,442

$

821

23.2%

116.5%

As a percent of sales


45.0%


40.5%


53.3%

Selling, general & administrative

$

1,660

$

1,551

$

1,483

7.0%

11.9%

As a percent of sales


42.0%


43.6%


96.2%

Depreciation & amortization

$

423

$

405

$

682

4.3%

(38.0)%

Total operating expenses

$

3,860

$

3,399

$

2,986

13.6%

29.3%

Operating Income (loss)

$

90

$

163

$

(1,445)

(44.7)%

(106.2)%

As a % of sales


2%


4.6%


(94)%

Other (expense) income including
income tax (expense)

$

555

$

(169)

$

790

(427.2)%

(29.8)%

Net Income (loss)

$

645

$

(6)

$

(655)

NM

NM

Diluted loss per share

$

0.02

$

(0.00)

$

(0.03)

Adjusted EBITDA(1)

$

827

$

853

$

(494)

(3.0)%

(267.4)%

As a % of sales


20.9%


23.9%


NM

(1) Adjusted EBITDA is a non-GAAP measure defined as earnings before interest, taxes, depreciation and amortization, non-cash stock compensation expense and unusual items. See the attached tables for important disclosures regarding SDP’s use of Adjusted EBITDA, as well as a reconciliation of net loss to Adjusted EBITDA.

Gross margin was impacted by operating inefficiencies associated with labor shortages and supply chain constraints. Selling, general & administrative expenses were higher as a result of labor constraints and the inflationary impact of wages.

Net income of $645 thousand, or $0.02 per diluted share was primarily due to the recovery of principal and interest of a related party note receivable in the fourth quarter. Adjusted EBITDA(1) improved year-over-year to $827 thousand on higher net income.

The Company believes that when used in conjunction with measures prepared in accordance with U.S. generally accepted accounting principles (“GAAP”), Adjusted EBITDA, which is a non-GAAP measure, helps in the understanding of its operating performance.

Full Year 2021 Review

 
($ in thousands, except per share amounts) December 31,
2021
December 31,
2020
$ Change % Change
Tool sales/rental

$

4,331

$

3,030

$

1,301

42.9%

Other Related Tool Revenue


4,917


4,021

$

896

22.3%

Tool Revenue

$

9,248

$

7,051

$

2,198

31.2%

Contract Services


4,088


3,420

$

667

19.5%

Total Revenue

$

13,336

$

10,471

$

2,865

27.4%

Operating expenses


13,923


14,293

$

(371)

(2.6)%

Operating (loss) income

$

(587)

$

(3,823)

$

3,235

(84.6)%

Net loss

$

(530)

$

(3,430)

$

2,900

(84.6)%

Diluted loss per share

$

(0.02)

$

(0.13)

$

0.11

Adjusted EBITDA(1)

$

2,626

$

(103)

$

2,729

NM

Revenue of $13.3 million grew 27% over the prior year as a result of an improved market combined with strong demand for the Company’s products and services. Revenue in North America was up 35% which more than offset a 8.7% decline in international markets as the Middle East continued to address the global pandemic with containment restrictions.

Tool revenue was $9.2 million, up 31%, or $2.2 million, from the prior-year period driven by demand for the DNR, both new tools as well as repair and royalty revenue from DNR activity on more rigs throughout the year. Contract Services revenue increased approximately $667 thousand, or 19%, to $4.1 million for the year as the Company refurbished more tools for its legacy customer.

Operating expenses in 2021 were down $371 thousand, or 3%, compared with 2020. This was primarily as a result of lower amortization expense and the reorganization of the Company’s international business to improve profitability.

Other income in 2021 included $707 thousand for recovery of a related party note receivable, whereas 2020 benefitted from the $933 thousand in forgiveness on SBA loans.

The net loss in 2021 was $530 thousand, or ($0.02) per diluted share, improved over a net loss of $3.4 million, ($0.13) per diluted share in 2020.

Adjusted EBTIDA was $2.6 million in 2021, or 19.7% of revenue. This was up from an Adjusted loss before tax, interest, depreciation and amortization of $103 thousand in 2020.

Balance Sheet and Liquidity

Cash at the end of the quarter was $2.8 million, up $861 thousand from the end of 2020 and up $353 thousand from the trailing third quarter. Cash generated by operations for the year was $526 thousand. Long-term debt, including the current portion, at quarter-end was $2.5 million. The final $750 thousand of principal due on the note is payable on October 5, 2022.

During the quarter, the Company completed an equity offering of 1,739,131 shares of common stock at a price of $1.15 per share, which resulted in net proceeds of approximately $1.7 million.

Definitions and Composition of Product/Service Revenue:

Contract Services Revenue is comprised of repair and manufacturing services for drill bits and other tools or products for customers.

Other Related Tool Revenue is comprised of royalties and fleet maintenance fees.

Tool Sales/Rental revenue is comprised of revenue from either the sale or rent of tools to customers.

Tool Revenue is the sum of Other Related Tool Revenue and Tool Sales/Rental revenue.

Webcast and Conference Call

The Company will host a conference call and live webcast today at 10:00 am MT (12:00 pm ET) to review the results of the quarter and discuss its corporate strategy and outlook. The discussion will be accompanied by a slide presentation that will be made available prior to the conference call on SDP’s website at www.sdpi.com/events. A question-and-answer session will follow the formal presentation.

The conference call can be accessed by calling (201) 689-8470. Alternatively, the webcast can be monitored at www.sdpi.com/events. A telephonic replay will be available from 1:00 p.m. MT (3:00 p.m. ET) the day of the teleconference until Friday, March 18, 2022. To listen to the archived call, please call (412) 317-6671 and enter conference ID number 13727112 or access the webcast replay at www.sdpi.com, where a transcript will be posted once available.

About Superior Drilling Products, Inc.

Superior Drilling Products, Inc. is an innovative, cutting-edge drilling tool technology company providing cost saving solutions that drive production efficiencies for the oil and natural gas drilling industry. The Company designs, manufactures, repairs and sells drilling tools. SDP drilling solutions include the patented Drill-N-Ream® wellbore conditioning tool and the patented Strider™ oscillation system technology. In addition, SDP is a manufacturer and refurbisher of PDC (polycrystalline diamond compact) drill bits for a leading oil field service company. SDP operates a state-of-the-art drill tool fabrication facility, where it manufactures its solutions for the drilling industry, as well as customers’ custom products. The Company’s strategy for growth is to leverage its expertise in drill tool technology and innovative, precision machining in order to broaden its product offerings and solutions for the oil and gas industry.

Additional information about the Company can be found at: www.sdpi.com.

Safe Harbor Regarding Forward Looking Statements

This news release contains forward-looking statements and information that are subject to a number of risks and uncertainties, many of which are beyond our control. All statements, other than statements of historical fact included in this release, including, without limitations, the continued impact of COVID-19 on the business, the Company’s strategy, future operations, success at developing future tools, the Company’s effectiveness at executing its business strategy and plans, financial position, estimated revenue and losses, projected costs, prospects, plans and objectives of management, and ability to outperform are forward-looking statements. The use of words “could,” “believe,” “anticipate,” “intend,” “estimate,” “expect,” “may,” “continue,” “predict,” “potential,” “project”, “forecast,” “should” or “plan, and similar expressions are intended to identify forward-looking statements, although not all forward -looking statements contain such identifying words. These statements reflect the beliefs and expectations of the Company and are subject to risks and uncertainties that may cause actual results to differ materially. These risks and uncertainties include, among other factors, the duration of the COVID-19 pandemic and related impact on the oil and natural gas industry, the effectiveness of success at expansion in the Middle East, options available for market channels in North America, the deferral of the commercialization of the Strider technology, the success of the Company’s business strategy and prospects for growth; the market success of the Company’s specialized tools, effectiveness of its sales efforts, its cash flow and liquidity; financial projections and actual operating results; the amount, nature and timing of capital expenditures; the availability and terms of capital; competition and government regulations; and general economic conditions. These and other factors could adversely affect the outcome and financial effects of the Company’s plans and described herein. The Company undertakes no obligation to revise or update any forward-looking statements to reflect events or circumstances after the date hereof.

FINANCIAL TABLES FOLLOW.

Superior Drilling Products, Inc.
Consolidated Condensed Statements Of Operations
(unaudited)
 

For the Three Months


For the Twelve Months

Ended December 31,


Ended December 31,


2021


2020


2021


2020

 
Revenue
North America

$

3,545,648

$

1,203,086

$

11,619,593

$

8,590,933

International


404,821


338,119


1,716,556


1,879,865

Total revenue

$

3,950,469

$

1,541,205

$

13,336,149

$

10,470,798

 
Operating cost and expenses
Cost of revenue


1,777,130


820,961


5,618,844


5,105,677

Selling, general, and administrative expenses


1,660,386


1,483,338


6,200,522


6,371,337

Depreciation and amortization expense


422,733


681,998


2,103,534


2,816,396

 
Total operating costs and expenses


3,860,249


2,986,297


13,922,900


14,293,410

 
Operating Income (loss)


90,220


(1,445,092)


(586,751)


(3,822,612)

 
Other Income (expense)
Interest income


81


28


228


5,803

Interest expense


(125,593)


(125,096)


(539,390)


(575,306)

Recovery of related party note receivable


707,112


-


707,112


-

Loss on Fixed Asset Impairment


-


-


-


(30,000)

Net gain/(loss) on sale or disposition of assets


939


32,000


(249)


174,234

Loan Forgiveness


-


891,600


-


933,003

Total other expense


582,539


798,532


167,701


507,734

 
Income (loss) before income taxes

$

672,759

$

(646,560)

$

(419,050)

$

(3,314,878)

 
Income tax expense


(27,875)


(8,582)


(110,751)


(114,996)

Net Income (loss)

$

644,884

$

(655,142)


(529,801)


(3,429,874)

 
Basic income (loss) per common share

$

0.02

$

(0.03)

$

(0.02)

$

(0.13)

 
Basic weighted average common shares outstanding


27,816,874


25,650,846


26,378,967


25,515,166

 
Diluted income (loss) per common Share

$

0.02

$

(0.03)

$

(0.02)

$

(0.13)

 
Diluted weighted average common shares outstanding


26,153,334


25,650,846


26,378,967


25,515,166

Superior Drilling Products, Inc.

Consolidated Condensed Balance Sheets

 
December 31, 2021 December 31, 2020
(unaudited)
Assets
Current assets:
Cash $

2,822,100

$

1,961,441

Accounts receivable, net

2,871,932

1,345,622

Prepaid expenses

435,595

90,269

Inventories

1,174,635

1,020,008

Asset held for sale

-

40,000

Other current assets

55,159

40,620

 
Total current assets

7,359,421

4,497,960

 
Property, plant and equipment, net

6,930,329

7,535,098

Intangible assets, net

236,111

819,444

Right of use Asset (net of amortization) $

20,518

$

99,831

Other noncurrent assets

65,880

87,490

Total assets $

14,612,259

$

13,039,823

 
Liabilities and Owners' Equity
Current liabilities:
Accounts payable $

1,139,091

$

430,015

Accrued expenses

467,462

1,091,518

Accrued Income tax

206,490

106,446

Current portion of Operating Lease Liability

13,716

79,313

Current portion of Long-term Financial Obligation

65,678

61,691

Current portion of long-term debt, net of discounts

2,195,759

1,397,337

-

-

Total current liabilities $

4,088,196

$

3,166,320

 
Operating long term liability

6,802

20,518

Long-term Financial Obligation

4,112,658

4,178,261

Long-term debt, less current portion, net of discounts

256,675

1,451,049

Total liabilities $

8,464,331

$

8,816,148

 
Shareholders' equity
Common stock (28,218,316 and 25,762,342)

28,218

25,762

Additional paid-in-capital

43,071,218

40,619,620

Accumulated deficit

(36,951,508)

(36,421,707)

Total stockholders' equity $

6,147,928

$

4,223,675

Total liabilities and shareholders' equity $

14,612,259

$

13,039,823

Superior Drilling Products, Inc.
Consolidated Statement of Cash Flows
(Unaudited)


December 31,
2021


December 31,
2020
Cash Flows From Operating Activities


Net Loss $

(529,801)

$

(3,429,874)

Adjustments to reconcile net income to net cash used in operating activities:


Depreciation and amortization expense

2,103,534


2,816,396

Amortization debt discount


Share - based compensation expense

756,743


550,573

Loss on disposition of rental fleet

-


23,649

Loss (Gain) on sale or dispositon of assets

249


(174,234)

Gain on Forgiveness of loan

-


(933,003)

Impairment on asset held for sale

-


30,000

Amortization of deferred loan cost

18,522


18,525

Changes in operating assets and liabilities:


Accounts receivable

(1,526,310)


2,504,887

Inventories

(143,590)


(95,976)

Prepaid expenses and other noncurrent assets

(338,255)


266,488

Accounts payable and accrued expenses

85,020


(85,630)

Income Tax expense

100,044


90,566

Other long term liabilities

-


(61,421)

Net Cash Provided By Operating Activities

526,156


1,520,946


Cash Flows From Investing Activities


Purchases of property, plant and equipment

(936,718)


(1,167,346)

Proceeds from sale of fixed assets

50,000


149,833

Net Cash Provided By Investing Activities

(886,718)


(1,017,513)


Cash Flows From Financing Activities


Principal payments on debt

(1,277,730)


(2,350,783)

Proceeds received from debt borrowings

-


72,520

Proceeds received from SBA Paycheck Protection Program (PPP)

-


891,600

Payments on Revolving loan

(895,787)


(1,179,768)

Proceeds received from Revolving loan

1,697,427


1,185,319

Proceeds from financing obligation

-


1,622,106

Proceeds from Issuance of Common Stock

1,697,311


-

Net Cash Provided By (Used In) Financing Activities

1,221,221


240,994


Net change in Cash

860,659


744,427

Cash at Beginning of Period

1,961,441


1,217,014

Cash at End of Period $

2,822,100

$

1,961,441


Supplemental information:


Cash paid for interest $

530,898

$

576,854

Non-cash payment of other liabilities by offsetting recovery of
related-party note receivable
$

707,112

$

-

Long term debt paid with Sale of Plane $

-

$

211,667

Superior Drilling Products, Inc.

Adjusted EBITDA(1) Reconciliation

(unaudited)

 
($, in thousands) Three Months Ended
December 31,
2021
December 31,
2020
September 30,
2021
 
GAAP net income (loss)

$

644,884

$

(655,142)

$

$

(6,210)

Add back:
Depreciation and amortization


422,733


681,998


405,225

Interest expense, net


125,512


125,068


130,172

Share-based compensation


226,144


180,730


196,096

Net non-cash compensation


88,200


88,200


88,200

Income tax expense


27,875


8,582


39,327

Recovery of Related Party Note Receivable


(707,112)


-


-

Loan Forgiveness


-


(891,600)


-

(Gain) Loss on disposition of assets


(939)


(32,000)


-

Non-GAAP adjusted EBITDA(1)

$

827,297

$

(494,164)

$

852,810

 
GAAP Revenue

$

3,950,469

$

1,541,205

$

3,561,919

Non-GAAP Adjusted EBITDA Margin


20.9%


NM


23.9%

 
Year Ended
December 31,
2021
December 31,
2020
 
GAAP net loss

$

(529,801)

$

(3,429,874)

Add back:
Depreciation and amortization


2,103,534


2,816,396

Interest expense, net


539,162


569,503

Share-based compensation


756,743


550,573

Net non-cash compensation


352,800


352,800

Income tax expense


110,751


114,996

Impairment on asset held for sale


-


30,000

Gain on disposition of assets


(249)


(174,234)

Loan forgiveness


-


(933,003)

Inventory impairment


-


-

Recovery of related party note receivable


(707,112)


-

Non-GAAP adjusted EBITDA(1)

$

2,625,828

$

(102,843)

 
GAAP Revenue

$

13,336,149

$

10,470,798

Non-GAAP Adjusted EBITDA Margin


19.7%


(1.0)%

(1) Adjusted EBITDA represents net income adjusted for income taxes, interest, depreciation and amortization and other items as noted in the reconciliation table. The Company believes Adjusted EBITDA is an important supplemental measure of operating performance and uses it to assess performance and inform operating decisions. However, Adjusted EBITDA is not a GAAP financial measure. The Company’s calculation of Adjusted EBITDA should not be used as a substitute for GAAP measures of performance, including net cash provided by operations, operating income and net income. The Company’s method of calculating Adjusted EBITDA may vary substantially from the methods used by other companies and investors are cautioned not to rely unduly on it.


Contacts

For more information, contact investor relations:
Deborah K. Pawlowski
Kei Advisors LLC
(716) 843-3908
This email address is being protected from spambots. You need JavaScript enabled to view it.

DUBLIN--(BUSINESS WIRE)--The "India Renewable Energy Market - Growth, Trends, COVID-19 Impact, and Forecasts (2022 - 2027)" report has been added to ResearchAndMarkets.com's offering.


The Indian renewable energy market is expected to register a CAGR of more than 10% during the forecast period of 2022-2027. The COVID-19 outbreak, in 2020, had led to a decrease in the consumption of bioenergy and other renewable energy sources when compared to the previous year.

Furthermore, COVID-19 impact constituted a risk to investments made by individuals and small to medium-sized enterprises in the Indian renewable energy market. Factors such as supportive government policies, rising environmental concerns, incentives, and tax benefits for solar panel installations are expected to drive the market during the forecast period. However, the lack of grid infrastructure in rural areas is likely to hinder the market growth during the forecast period.

Key Highlights

  • The solar energy segment is expected to witness significant growth during the forecast period, owing to increasing investment opportunities across the country.
  • Ministry of New and Renewable Energy (MNRE) has set a target to achieve 450 GW of renewable energy installed capacity by 2030. This is expected to create an opportunity for the market to grow in the future.
  • The market is also propelled by supportive government policies, particularly the plans formulated by the Ministry of New & Renewable Energy (MNRE) during the forecast period.

Key Market Trends

Solar Segment to Witness a Significant Growth

  • The solar segment is likely to have the largest market share during the forecast period, owing to declining costs of solar modules and the versatility of these systems for various applications, like electricity generation, water heating, etc.
  • India is endowed with vast solar energy potential. About 5,000 trillion kWh per year of energy is incident over India's land area with most parts receiving 4-7 kWh per square meter per day. There has been a visible impact of solar energy in the Indian energy sector during the last few years.
  • According to the Ministry of New and Renewable Energy (MNRE), the installed solar energy installed capacity in India was around 40.1 GW in 2020-2021, up from 34.6 GW in 2019-2020, recording a growth of around 16% during the year. This growth is the result of huge investments in the upcoming solar energy projects in India.
  • In December 2021, MNRE invited applications for the Expression of Interest in conducting the evaluation study of Phase-II of the Grid Connected Rooftop Solar Program. The program is a part of the National Solar Mission, which aims at installing 40 GW capacity of grid-connected solar rooftop installation systems by 2022.
  • Furthermore, in February 2021, Amara Raja Batteries Ltd (ARBL) announced plans to set up a 50 MW solar power plant in Chittoor district of Andhra Pradesh with a total investment of INR 220 crore over the next 18 months.
  • In August 2021, ArcelorMittal S.A. announced plans to set up a 4.5 GW solar park in Rajasthan with an investment of INR 19,000 crore. It also plans to invest in Gujarat's solar energy.
  • In January 2022, Azure Power has commissioned a 600 MW solar power project in Bikaner, Rajasthan. The power generated from the project, will be supplied to Solar Energy Corporation of India Limited(SECI) at a tariff of Rs 2.53 per kWh for 25 years.
  • Hence, increasing investments in the solar energy sector is expected to aid the growth in India during the forecast period.

Supportive Government Policies and Programs Driving the Market Demand

  • The Indian government has introduced numerous supportive policies to increase the renewable energy installed capacity to 450 GW by 2030. These policies are set to achieve the targets during the forecast period.
  • As part of the Paris Climate Agreement, India has committed to install 40% of its electricity generation capacity from non-fossil fuels by 2030. For achieving this goal, India has set an ambitious target of setting up 1,75,000 MW of renewable energy capacity, including, 1,00,000 MW of solar power, by 2022. Further, a target of 4,50,000 MW installed RE capacity by 2030 has also been fixed.
  • In February 2022, the Indian government has allocated an additional INR 19,500 crore to support solar PV module manufacturing under the production linked incentive (PLI) scheme.
  • The scheme has various provisions for supporting the set up of integrated manufacturing units of high-efficiency solar PV modules by offering Production Linked Incentive (PLI) on sales of such solar PV modules. It aims at attaining the ambitious goal of 280 GW of installed solar capacity by 2030.
  • In September 2021, the Indian government has announced plans to provide viability gap funding (VGF) or grants for offshore wind and storage projects. The new scheme will help discoms carry out renovation and modernization of substations. The government has set a target of adding 30GW of offshore wind energy projects by 2030.
  • Some other schemes implemented by the Ministry of New and Renewable Energy (MNRE) in the last three years are the Solar Park Scheme, the 300 MW defense Scheme, and the 500 MW of VGF (Viability Gap Funding) Scheme. In January 2020, India made an ambitious target of having 450 GW of renewable energy by 2030. The announcement was made by the central government, which is already working on the project of installing around 100 GW of solar energy by 2022.
  • In December 2020, the Gujarat government implemented "the Surya Urja Rooftop Yojana" scheme to install solar rooftops for 8 lakh residential consumers by March 2022. Under this scheme, 40% of state subsidy will be provided on installing systems up to 3 kW and 20% subsidy for 3 kW-10 kW systems.
  • Therefore, numerous supportive polices by central and state governments are expected to drive the India renewable energy market during the forecast period.

Companies Mentioned

  • Adani Green Energy Limited
  • Tata Power Company Limited
  • Azure Power Global Limited
  • NTPC Limited
  • ReNew Power India
  • Suzlon Energy Limited
  • First Solar Inc.
  • Vestas Wind Systems A/S
  • Trina Solar Limited
  • Siemens Gamesa Renewable Energy, S.A.
  • JinkoSolar Holding Co., Ltd.

For more information about this report visit https://www.researchandmarkets.com/r/urfdw3


Contacts

ResearchAndMarkets.com
Laura Wood, Senior Press Manager
This email address is being protected from spambots. You need JavaScript enabled to view it.

For E.S.T Office Hours Call 1-917-300-0470
For U.S./CAN Toll Free Call 1-800-526-8630
For GMT Office Hours Call +353-1-416-8900

The Project is Expected to Reduce the City’s Reliance on Fossil Fuels, Generate Clean Energy and Achieve Sustainability Goals

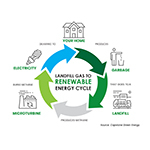
VAN NUYS, Calif.--(BUSINESS WIRE)--$CGRN #GreenEnergy--Capstone Green Energy Corporation (NASDAQ: CGRN), a global leader in carbon reduction and on-site resilient green Energy-as-a-Service (EaaS) solutions, announced today that its distributor for the Upper Midwest, New England and Eastern Canada Vergent Power Solutions (www.vergentpower.com), has secured a contract to provide a one-megawatt microturbine system to be installed in a landfill gas-to-energy project for a solid waste facility in New England. The renewable energy project will convert the gas generated by waste at the landfill to electricity that will be redistributed to the electrical grid and utilized by the city to power its municipal facilities.


The waste to energy project is expected to be commissioned in early 2023. Currently, the landfill generates and flares approximately 350 standard cubic feet per minute (scfm) of landfill gas. The new project will convert all of this gas into electricity by utilizing the highly-efficient Capstone C1000S microturbine system. The conversion process will generate one megawatt of clean and reliable electricity and deliver a continuous renewable source of revenue for the city. Bringing this project to fruition is expected to reduce greenhouse gas emissions in New England by 3,500 tons per year.

“Vergent Power dedicated many years to develop this important project, which reflects the New England region’s path towards decarbonization,” said Darren Jamison, President and Chief Executive Officer of Capstone Green Energy. “The project clearly demonstrates Capstone microturbines’ ultra-clean emission and beneficial product features such as UL1741 SA-certified power electronics that enable simplified interconnection with the utility grid as well as potential future microgrids in the area. We look forward to many more innovative, carbon-reducing projects from Vergent Power in New England in the future,” added Mr. Jamison.

After a thorough analysis comparing various distributed generation technologies, officials ultimately chose low-emission Capstone Green Energy microturbines as the ideal solution for their scalability, resiliency, and ability to reduce energy costs to taxpayers.

“Vergent Power is proud to support this municipal customer and its progressive efforts to have 100% renewable power in 2023. Utilizing renewable biogas generated by wastewater treatment plants and landfills is an excellent way for communities to transition to renewable energy. This one-megawatt plant will be Vergent Power’s eleventh renewable energy system in our North American operating fleet comprising more than thirty microturbines running on biogas,” said Justin Rathke, President, Vergent Power Solutions.

About Capstone Green Energy

Capstone Green Energy (www.CapstoneGreenEnergy.com) (NASDAQ: CGRN) is a leading provider of customized microgrid solutions and on-site energy technology systems focused on helping customers around the globe meet their environmental, energy savings, and resiliency goals. Capstone Green Energy focuses on four key business lines. Through its Energy as a Service (EaaS) business, it offers rental solutions utilizing its microturbine energy systems and battery storage systems, comprehensive Factory Protection Plan (FPP) service contracts that guarantee life-cycle costs, as well as aftermarket parts. Energy Conversion Products are driven by the Company's industry-leading, highly efficient, low-emission, resilient microturbine energy systems offering scalable solutions in addition to a broad range of customer-tailored solutions, including hybrid energy systems and larger frame industrial turbines. The Energy Storage Products business line designs and installs microgrid storage systems creating customized solutions using a combination of battery technologies and monitoring software. Through Hydrogen Energy Solutions, Capstone Green Energy offers customers a variety of hydrogen products, including the Company's microturbine energy systems.

For customers with limited capital or short-term needs, Capstone offers rental systems; for more information, contact: This email address is being protected from spambots. You need JavaScript enabled to view it.. To date, Capstone has shipped over 10,000 units to 83 countries and estimates that, in FY21, it saved customers over $217 million in annual energy costs and approximately 397,000 tons of carbon. Total savings over the last three years are estimated at 1,115,100 tons of carbon and $698 million in annual energy savings.

For more information about the Company, please visit: www.CapstoneGreenEnergy.com. Follow Capstone Green Energy on Twitter, LinkedIn, Instagram, Facebook, and YouTube.

Cautionary Note Regarding Forward-Looking Statements

This release contains forward-looking statements as defined in the Private Securities Litigation Reform Act of 1995, including statements regarding expectations for green initiatives and execution on the Company's growth strategy and other statements regarding the Company's expectations, beliefs, plans, intentions, and strategies. The Company has tried to identify these forward-looking statements by using words such as "expect," "anticipate," "believe," "could," "should," "estimate," "intend," "may," "will," "plan," "goal" and similar terms and phrases, but such words, terms and phrases are not the exclusive means of identifying such statements. Actual results, performance and achievements could differ materially from those expressed in, or implied by, these forward-looking statements due to a variety of risks, uncertainties and other factors, including, but not limited to, the following: the ongoing effects of the COVID-19 pandemic; the availability of credit and compliance with the agreements governing the Company's indebtedness; the Company's ability to develop new products and enhance existing products; product quality issues, including the adequacy of reserves therefor and warranty cost exposure; intense competition; financial performance of the oil and natural gas industry and other general business, industry and economic conditions; the Company's ability to adequately protect its intellectual property rights; and the impact of pending or threatened litigation. For a detailed discussion of factors that could affect the Company's future operating results, please see the Company's filings with the Securities and Exchange Commission, including the disclosures under "Risk Factors" in those filings. Except as expressly required by the federal securities laws, the Company undertakes no obligation to update or revise any forward-looking statements, whether as a result of new information, changed circumstances or future events or for any other reason.


Contacts

Capstone Green Energy
Investor and investment media inquiries:
818-407-3628
This email address is being protected from spambots. You need JavaScript enabled to view it.

Diverse businesses benefit from receive nearly $1 billion in contracts

SAN DIEGO--(BUSINESS WIRE)--San Diego Gas & Electric purchased nearly $1 billion in goods and services from diverse business enterprises in 2021. More than half (56%) of SDG&E’s diverse business expenditures, or $525 million, were with local companies in the San Diego region. And approximately 90% of SDG&E’s diverse suppliers are located in California, further helping to grow California’s economy, which currently is the fifth largest in the world.


Highlights from all diverse spending categories and interviews with key suppliers can be found in SDG&E’s newly released annual supplier diversity report.

“Our company’s long-standing commitment to supplier diversity is stronger than ever, particularly as we look to support an equitable economic recovery from the pandemic,” said SDG&E CEO Caroline Winn. “This commitment reflects our customers, employees and the communities we serve and truly enhances our ability to remain competitive while contributing to the local economy.”

SDG&E’s supplier diversity program is part of its broader commitment to environmental, social and governance best practices, and reflects one of the company’s core values, which is to champion people by creating opportunities through diversity, equity and inclusion.

“If more of the region’s anchors and large employers follow in SDG&E’s footsteps in adopting or expanding their supplier diversity programs—especially focused on small, local and diverse businesses—San Diego would see significant economic impact and quality job creation,” said Mark Cafferty, president and CEO of the San Diego Regional Economic Development Corporation (EDC).

Overall, SDG&E infused $2.4 billion into the economy last year, the highest level of expenditures on goods and services in the company’s 140-year history. Of that amount, $936 million went to small and diverse suppliers, representing 39.1% of the total expenditures – far exceeding the 21.5% goal set by the California Public Utilities Commission’s (CPUC).

Diverse suppliers support SDG&E’s key business areas such as electric and gas construction and operations. One reason for SDG&E’s success is its Ambassadors for Excellence program. More than 340 SDG&E employees play a significant role in seeking out, training and mentoring new diverse suppliers to ensure they are competitive and able to grow into prime roles. The goal is to expand the program to 500 employees by year end.

Here is a breakdown of SDG&E’s 2021 spending by diverse business categories:

  • Minority Business Enterprise: $461.2 million or 19.3%
  • Women Business Enterprise: $355.2 million or 14.8%
  • Service-Disabled Veteran Business Enterprise: $110.3 million or 4.6%
  • Lesbian, Gay, Bisexual, Transgender Business Enterprise: $9.3 million or 0.4%

SDG&E is an innovative San Diego-based energy company that provides clean, safe and reliable energy to better the lives of the people it serves in San Diego and southern Orange counties. The company is committed to creating a sustainable future by providing its electricity from renewable sources; modernizing natural gas pipelines; accelerating the adoption of electric vehicles; supporting numerous non-profit partners; and, investing in innovative technologies to ensure the reliable operation of the region’s infrastructure for generations to come. SDG&E is a subsidiary of Sempra (NYSE: SRE). For more information, visit SDGEnews.com or connect with SDG&E on Twitter (@SDGE), Instagram (@SDGE) and Facebook.


Contacts

Sara Prince
San Diego Gas & Electric
877-866-2066
This email address is being protected from spambots. You need JavaScript enabled to view it.
Twitter: @sdge

Voltus recognized for employee satisfaction, company reputation, and significant growth

SAN FRANCISCO & BOSTON--(BUSINESS WIRE)--Voltus, Inc. (“Voltus”), the leading distributed energy resource (DER) software technology platform, has been featured on the Forbes list of America's Best Startup Employers 2022. The list recognizes innovative and high-growth startups that exceed employee satisfaction and foster a positive culture.


“It is an honor to be recognized by Forbes as among the top 50 companies for growing quickly, while creating a positive and engaging environment,” says Carey Albertine, Voltus Vice President of People and Culture. “Voltus’s goal is to provide the best professional experience of every Voltan’s life. We provide our team with competitive cash and equity compensation, a practice of promoting from within, and the opportunity to contribute directly to the future health of our planet by helping to build a cleaner and more resilient electric grid, a concept we call ‘doing well by doing good.’ We hold ourselves accountable to this goal each quarter by measuring and reporting on our team’s happiness and productivity. Nothing is more important than our team, and our efforts toward hiring and retaining the absolute best team will be all the more important as we move toward becoming a publicly traded company.”

To compile the annual list, Forbes evaluated 2,500 U.S. businesses founded between 2012 and 2019 with at least 50 employees on three criteria: employer reputation, employee satisfaction, and growth.

About Voltus

Voltus is the leading software technology platform connecting distributed energy resources to electricity markets, delivering less expensive, more reliable, and more sustainable electricity. Our commercial and industrial customers and DER partners generate cash by allowing Voltus to maximize the value of their flexible load, distributed generation, energy storage, energy efficiency, and electric vehicle resources in these markets. To learn more, visit www.voltus.co.

On November 30, 2021 Voltus and Broadscale Acquisition Corp. (“Broadscale”) (Nasdaq: SCLE), entered into a definitive merger agreement. Upon the closing of the transaction, the combined company will be named Voltus Technologies, Inc. and is expected to remain on the Nasdaq under the new ticker symbol “VLTS.” The transaction is expected to close in the first half of 2022 and requires the approval of Broadscale’s stockholders, the Registration Statement being declared effective by the SEC, and other customary closing conditions.

Forward-Looking Statements

This communication contains certain “forward-looking statements” within the meaning of the United States Private Securities Litigation Reform Act of 1995, Section 27A of the Securities Act of 1933, as amended (the “Securities Act”) and Section 21E of the Securities Exchange Act of 1934, as amended, including certain financial forecasts and projections. All statements other than statements of historical fact contained in this communication, including statements as to future results of operations and financial position, revenue and other metrics planned products and services, business strategy and plans, objectives of management for future operations of Voltus, Inc. (“Voltus”), market size and growth opportunities, competitive position and technological and market trends, are forward-looking statements. Some of these forward-looking statements can be identified by the use of forward-looking words, including “may,” “should,” “expect,” “intend,” “will,” “estimate,” “anticipate,” “believe,” “predict,” “plan,” “targets,” “projects,” “could,” “would,” “continue,” “forecast” or the negatives of these terms or variations of them or similar expressions. All forward-looking statements are subject to risks, uncertainties, and other factors which could cause actual results to differ materially from those expressed or implied by such forward-looking statements. All forward-looking statements are based upon estimates, forecasts and assumptions that, while considered reasonable by Broadscale Acquisition Corp. (“Broadscale”) and its management, and Voltus and its management, as the case may be, are inherently uncertain and many factors may cause the actual results to differ materially from current expectations which include, but are not limited to: 1) the occurrence of any event, change or other circumstances that could give rise to the termination of the definitive merger agreement with respect to the business combination; 2) the outcome of any legal proceedings that may be instituted against Voltus, Broadscale, the combined company or others following the announcement of the business combination and any definitive agreements with respect thereto; 3) the inability to complete the business combination due to the failure to obtain approval of the stockholders of Broadscale or Voltus, or to satisfy other conditions to closing the business combination; 4) changes to the proposed structure of the business combination that may be required or appropriate as a result of applicable laws or regulations or as a condition to obtaining regulatory approval of the business combination; 5) the ability to meet Nasdaq’s listing standards following the consummation of the business combination; 6) the risk that the business combination disrupts current plans and operations of Voltus as a result of the announcement and consummation of the business combination; 7) the inability to recognize the anticipated benefits of the business combination, which may be affected by, among other things, competition, the ability of the combined company to grow and manage growth profitably, maintain relationships with customers and suppliers and retain its management and key employees; 8) costs related to the business combination; 9) changes in applicable laws or regulations; 10) the possibility that Voltus or the combined company may be adversely affected by other economic, business and/or competitive factors; 11) Voltus’s estimates of its financial performance; 12) the risk that the business combination may not be completed in a timely manner or at all, which may adversely affect the price of Broadscale’s securities; 13) the risk that the transaction may not be completed by Broadscale’s business combination deadline and the potential failure to obtain an extension of the business combination deadline if sought by Broadscale; 14) the impact of the novel coronavirus disease pandemic, including any mutations or variants thereof, and its effect on business and financial conditions; 15) inability to complete the PIPE investment in connection with the business combination; and 16) other risks and uncertainties set forth in the sections entitled “Risk Factors” and “Cautionary Note Regarding Forward-Looking Statements” in Broadscale’s registration statement on Form S-4 (File No. 333-262287), filed with the SEC on January 21, 2022 (the “Registration Statement”) and other documents filed by Broadscale from time to time with the SEC. These filings identify and address other important risks and uncertainties that could cause actual events and results to differ materially from those contained in the forward-looking statements. Nothing in this communication should be regarded as a representation by any person that the forward-looking statements set forth herein will be achieved or that any of the contemplated results of such forward looking statements will be achieved. You should not place undue reliance on forward-looking statements, which speak only as of the date they are made. Neither Broadscale nor Voltus gives any assurance that either Broadscale or Voltus or the combined company will achieve its expected results. Neither Broadscale nor Voltus undertakes any duty to update these forward-looking statements, except as otherwise required by law.

Use of Projections

This communication may contain financial forecasts of Voltus. Neither Voltus’s independent auditors, nor the independent registered public accounting firm of Broadscale, audited, reviewed, compiled or performed any procedures with respect to the projections for the purpose of their inclusion in this communication, and accordingly, neither of them expressed an opinion or provided any other form of assurance with respect thereto for the purpose of this communication. These projections should not be relied upon as being necessarily indicative of future results. The projected financial information contained in this communication constitutes forward-looking information. The assumptions and estimates underlying such projected financial information are inherently uncertain and are subject to a wide variety of significant business, economic, competitive and other risks and uncertainties that could cause actual results to differ materially from those contained in the prospective financial information. See “Forward-Looking Statements” above. Actual results may differ materially from the results contemplated by the projected financial information contained in this communication, and the inclusion of such information in this communication should not be regarded as a representation by any person that the results reflected in such projections will be achieved.

Additional Information and Where to Find It

In connection with the proposed transaction, Broadscale has filed with the U.S. Securities and Exchange Commission the Registration Statement, which included a preliminary proxy statement and a preliminary prospectus. After the Registration Statement has been declared effective, Broadscale will mail a definitive proxy statement /prospectus relating to the proposed transaction to its stockholders as of the record date established for voting on the proposed transactions. Broadscale’s stockholders and other interested persons are urged to carefully read the Registration Statement, including the preliminary proxy statement / preliminary prospectus, and any amendments thereto, and, when available, the definitive proxy statement/prospectus and other documents filed in connection with the proposed transaction, as these materials contain, or will contain, important information about the proposed transaction and the parties to the proposed transaction.

Broadscale’s stockholders and other interested persons will be able to obtain free copies of the Registration Statement, the preliminary proxy statement / preliminary prospectus, the definitive proxy statement/prospectus and all other relevant documents filed or that will be filed with the SEC, without charge, when available, at the website maintained by the SEC at www.sec.gov.

The documents filed by Broadscale with the SEC also may be obtained free of charge at Broadscale’s website at https://www.broadscalespac.com or upon written request to 1845 Walnut Street, Suite 1111, Philadelphia, PA 19103.

NEITHER THE SEC NOR ANY STATE SECURITIES REGULATORY AGENCY HAS APPROVED OR DISAPPROVED THE TRANSACTIONS DESCRIBED IN THIS COMMUNICATION, PASSED UPON THE MERITS OR FAIRNESS OF THE BUSINESS COMBINATION OR RELATED TRANSACTIONS OR PASSED UPON THE ADEQUACY OR ACCURACY OF THE DISCLOSURE IN THIS COMMUNICATION. ANY REPRESENTATION TO THE CONTRARY CONSTITUTES A CRIMINAL OFFENSE.

Participants in the Solicitation

Broadscale and Voltus and their respective directors and executive officers may be deemed to be participants in the solicitation of proxies from Broadscale’s stockholders in connection with the proposed transactions. Broadscale’s stockholders and other interested persons may obtain, without charge, more detailed information regarding the directors and executive officers of Broadscale listed in the Registration Statement. Information regarding the persons who may, under SEC rules, be deemed participants in the solicitation of proxies from Broadscale’s stockholders in connection with the proposed business combination is set forth in the Registration Statement.

No Offer or Solicitation

This communication is not intended to and does not constitute an offer to sell or the solicitation of an offer to buy, sell or solicit any securities or any proxy, vote or approval, nor shall there be any sale of securities in any jurisdiction in which such offer, solicitation or sale would be unlawful prior to registration or qualification under the securities laws of any such jurisdiction. No offer of securities shall be deemed to be made except by means of a prospectus meeting the requirements of Section 10 of the Securities Act.


Contacts

Investor Relations Contact – Voltus
Sioban Hickie, ICR, Inc.
Eduardo Royes, ICR, Inc.
This email address is being protected from spambots. You need JavaScript enabled to view it.

Media Contact – Voltus
Matt Dallas, ICR, Inc.
This email address is being protected from spambots. You need JavaScript enabled to view it.

TORONTO--(BUSINESS WIRE)--Superior Plus Corp. (“Superior”) (TSX:SPB):


March 2022 Cash Dividend - $0.06 per share

Superior Plus Corp. (“Superior”) today announced its cash dividend for the month of March 2022 of $0.06 per share payable on April 18, 2022. The record date is March 31, 2022 and the ex-dividend date will be March 30, 2022. Superior’s annualized cash dividend rate is currently $0.72 per share. This dividend is an eligible dividend for Canadian income tax purposes.

About the Corporation

Superior is a leading North American distributor and marketer of propane and distillates and related products and services, servicing approximately 890,000 customer locations in the U.S. and Canada.

For further information about Superior, please visit Superior’s website at: www.superiorplus.com or contact: Beth Summers, Executive Vice President and Chief Financial Officer, Tel: (416) 340-6015, or Rob Dorran, Vice President, Capital Markets, Tel: (416) 340-6003, E-mail: This email address is being protected from spambots. You need JavaScript enabled to view it., Toll Free: 1-866-490-PLUS (7587).

Forward Looking Information

This news release contains certain forward-looking information and statements that are based on Superior’s current expectations, estimates, projections and assumptions in light of its experience and its perception of historical trends. In this news release, such forward-looking information and statements can be identified by terminology such as “will”, "expects", "annualized", and similar expressions.

In particular, this news release contains forward-looking statements and information relating to: future dividends which may be declared on Superior’s common shares, the dividend payment, the tax treatment thereof, and the receipt of cash dividends. These forward-looking statements are being made by Superior based on certain assumptions that Superior has made in respect thereof as at the date of this news release, regarding, among other things: the success of Superior’s operations; prevailing commodity prices, margins, volumes and exchange rates; that Superior’s future results of operations will be consistent with past performance and management expectations in relation thereto; the continued availability of capital at attractive prices to fund future capital requirements; future operating costs; that any required commercial agreements can be reached; that all required regulatory and environmental approvals can be obtained on the necessary terms in a timely manner. These forward-looking statements are not guarantees of future performance and are subject to a number of known and unknown risks and uncertainties, including, but not limited to: the regulatory environment and decisions; non-performance of agreements in accordance with their terms; the impact of competitive entities and pricing; reliance on key industry partners and agreements; actions by governmental or regulatory authorities including changes in tax laws and treatment, or increased environmental regulation; adverse general economic and market conditions in Canada, North America and elsewhere; fluctuations in operating results; labour and material shortages; and certain other risks detailed from time to time in Superior’s public disclosure documents including, among other things, those detailed under the heading "Risk Factors" in Superior’s management's discussion and analysis and annual information form for the year ended December 31, 2021, which can be found at www.sedar.com.

Accordingly, readers are cautioned that events or circumstances could cause results to differ materially from those predicted, forecasted or projected. Such forward-looking statements are expressly qualified by the above statements. Superior does not undertake any obligation to publicly update or revise any forward looking statements or information contained herein, except as required by applicable laws.


Contacts

Beth Summers
Executive Vice President and Chief Financial Officer
Tel: (416) 340-6015
or
Rob Dorran
Vice President, Capital Markets
Tel: (416) 340-6003
E-mail: This email address is being protected from spambots. You need JavaScript enabled to view it.
Toll Free: 1-866-490-PLUS (7587).

Twenty-Three Winning Teams Recognized for Innovative Solutions to the World’s Challenges

ARLINGTON, Va.--(BUSINESS WIRE)--Toshiba and the National Science Teaching Association (NSTA) announced today the regional winners of the 30th annual ExploraVision program, the largest K-12 science competition designed to build problem-solving, critical thinking and collaboration skills that are central to the Next Generation Science Standards.


This year’s regional winners’ projects include innovative ideas ranging from technology drones that help reduce the carbon footprint to virtual reality technologies for pain management. The 23 winning teams will advance to the national phase of the competition, where participants will have a chance to win $10,000 U.S. Series EE Savings Bonds (at maturity) and other prizes. The winning teams will also receive Chromebooks to support virtual poster, website and video development for the national phase of the competition.

“The 30th year of the ExploraVision program saw tremendous challenges for schools, teachers and students around the world. This year’s achievements in critical and creative thinking are made even more impressive by the challenges many have overcome in navigating education during COVID-19,” said Ryuji Maruyama, Chairman and CEO, Toshiba America, Inc. “We applaud our winners and all our entrants for their resilience as well as their ideas for new technologies and smart solutions that improve and enhance our lives and communities.”

ExploraVision participants were challenged to come up with potential solutions to solve problems that may exist in ten years or more. Using real scientific research, students outlined methods to plan and test their ideas. In the next phase of the competition, the winning regional teams will be asked to build webpages and short videos to communicate and exhibit their ideas to the public.

“The level of creativity and dedication these students have shown through their projects is truly amazing. Their imaginative ideas are shining examples of the innovation teachers of science try to foster every day in science classrooms, museums and zoos nationwide,” said Eric Pyle, NSTA President. “We congratulate the ExploraVision regional winners on what they’ve achieved so far and applaud all of the team coaches for engaging and inspiring their students to make a real difference in the world that they will inherit.”

Some of the winning solutions included:

  • Medical Technology Innovations: Several winning regional projects were focused on innovations to promote advancements in medical technologies, such as a protection suit to reduce falling while another team invented the “Diabetic Balance Shoe” to prevent diabetic foot ulcers.
  • Environmental Technology Innovations: “The 3D photoPRINThesizer: Biomimetic Building Inspired by Photosynthesis” innovation was developed by a high school team interested in creating affordable housing alternatives. Another team sought to create a solution to combat toxic blue-green algae blooms.

In the next phase of the competition, the 23 regional winners will advance to the national level. Members of first-place national winning teams each receive a $10,000 U.S. Series EE Savings Bond (at maturity). Members of second-place national winning teams will each receive a $5,000 U.S. Series EE Savings Bond (at maturity). All first- and second-place national winners will be formally recognized for their creativity and accomplishments at an ExploraVision awards ceremony in early June.

Since its inception in 1992, close to 450,000 students from across the United States and Canada have participated in the ExploraVision program. For 30 consecutive years, the program has helped children to expand their imagination and have fun while developing an interest in science, technology, engineering and math (STEM) education at an early age. To learn more, visit https://www.exploravision.org/.

For more information, visit www.exploravision.org or email This email address is being protected from spambots. You need JavaScript enabled to view it.. Follow ExploraVision on Twitter at @ToshibaAmerica or join the ExploraVision Facebook Fan Page at www.Facebook.com/ToshibaAmerica.

About Toshiba
Toshiba Corporation leads a global group of companies that combines knowledge and capabilities from over 140 years of experience in a wide range of businesses—from energy and social infrastructure to electronic devices—with world-class capabilities in information processing, digital and AI technologies. These distinctive strengths support Toshiba’s continued evolution toward becoming an Infrastructure Services Company that promotes data utilization and digitization, and one of the world’s leading cyber-physical-systems technology companies. Guided by the Basic Commitment of the Toshiba Group, “Committed to People, Committed to the Future,” Toshiba contributes to society’s positive development with services and solutions that lead to a better world. The Group and its 120,000 employees worldwide secured annual sales surpassing 3.1 trillion yen (US$27.5 billion) in fiscal year 2020.

About Toshiba America, Inc.
Founded in 1965, Toshiba America, Inc. (TAI) is a subsidiary of Tokyo-based Toshiba Corporation and the holding company of three Toshiba operating companies that offer a broad range of products and solutions for the commercial, energy and industrial sectors. The three companies, which along with TAI are known collectively as Toshiba America Group, are Toshiba America Electronic Components, Inc. (Semiconductor & data storage solutions), Toshiba America Energy Systems, Corp. (Power generation solutions), and Toshiba International Corporation (Industrial, power electronics & transmission & distribution solutions).

About NSTA
The National Science Teaching Association (NSTA) is a vibrant community of 40,000 science educators and professionals committed to best practices in teaching science and its impact on student learning. NSTA offers high quality science resources and continuous learning so that science educators grow professionally and excel in their career. For new and experienced teachers alike, the NSTA community offers the opportunity to network with like-minded peers at the national level, connect with mentors and leading researchers, and learn from the best in the field.


Contacts

Toshiba:
Samantha Smoak: This email address is being protected from spambots. You need JavaScript enabled to view it.

National Science Teaching Association:
Kate Falk: This email address is being protected from spambots. You need JavaScript enabled to view it.

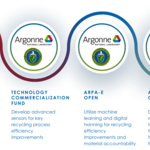
LEMONT, Ill.--(BUSINESS WIRE)--The U.S. Department of Energy (DOE) recently announced $35 million in funding for diverse small businesses to pursue clean energy, climate and other scientific solutions. These Small Business Innovation Research (SBIR) and Small Business Technology Transfer (STTR) awards aim to transform DOE-supported science and technology breakthroughs into viable products and services.


Researchers at DOE's Argonne National Laboratory will contribute to three SBIR/STTR projects. The projects will draw upon Argonne's many strengths in artificial intelligence (AI) and machine learning (ML), as well as quantum information science. Each project will receive approximately $200K for six months to a year.

In one project, a team led by Argonne nanoscientist Maria Chan will be working with VISIMO (Coraopolis, PA) to develop data management software based on AI and ML. This software will use AI and ML to automatically label and organize microscopy images, such as those from DOE's Nanoscale Science Research Centers. Such automation will allow researchers to more easily make discoveries such as new or improved catalysts and batteries for sustainable energy production and storage.

For the second project, a team led by Argonne scientist Subramanian Sankaranarayanan will be working with Sentient Science Corp. (West Lafayette, IN) on another software package that leverages AI and ML. Their software will accelerate the development of new models for studying the properties of materials that can be applied to solving industrial problems, such as predicting the short- and long-term failure rates of mechanical systems, like wind turbines, rotorcraft and rail transport.

For the third project, Argonne scientist F. Joseph Heremans is teaming up with Adamas Nanotechnologies (Raleigh, NC) and the City College of New York to develop a method for commercial production of a key quantum material for new sensors. This material is diamond that has been engineered with defects in the crystal structure to exploit their quantum properties. At present, the absence of commercial production of the core “quantum diamond” material hinders the field. Quantum probes with such defects could leapfrog current sensing technology and find applications in physics, chemistry and medicine.

“The DOE SBIR and STTR are powerful programs to engage small businesses in stimulating innovation for the U.S. economy,” said Megan Clifford, Associate Laboratory Director for Science & Technology Partnerships and Outreach at Argonne. "Argonne is excited to partner with small businesses to expand our impact and support technology transfer."


Contacts

Christopher J. Kramer
Head of Media Relations
Argonne National Laboratory
This email address is being protected from spambots. You need JavaScript enabled to view it.
Office: 630.252.5580

LOS ANGELES & ALAMEDA, Calif.--(BUSINESS WIRE)--Romeo Power and Wrightspeed, today announced that they are working together to leverage Romeo Power’s high-capacity battery packing and module technology along with Wrightspeed’s high torque, high-efficiency powertrain system to accelerate electrification in the bus, and medium and heavy duty truck market.

There are over one million existing buses and trucks that are candidates for repowering to zero emission full battery electric right now, and at a much lower upfront cost than purchasing expensive new battery electric vehicles. Wrightspeed is developing “Powertrain in a Crate™” kits that are chassis-specific and can be installed locally where fleets operate, creating jobs and new technology opportunities for those supporting school bus, work truck and other fleets. By using Wrightspeed’s Route™ traction drive technology, the repowered vehicles will be more efficient and provide higher torque than new vehicles based on single speed remote mount systems.

Together, the companies intend to develop and sell repower kits to the addressable market. “Romeo Power’s advanced electrification solutions for complex commercial vehicle applications is a perfect fit for our Route™ powertrain system. We are particularly impressed by their high level of safety, packaging density, and modularity,” said Alan Dowdell, Acting CEO of Wrightspeed. “We are proud to team up with Romeo Power and set a new standard in performance and efficiency for electric buses and trucks.”

Romeo Power and Wrightspeed together bring a unique combination of real-world, on-road experience and powertrain technology to accelerate electrification safely. After vehicles are selected and inspected, they will be rapidly decontented of the diesel or gas powertrains. The bespoke powertrain kits including traction drive axle with motors, inverters, battery modules and new dash with telematics will then be added to the vehicle. After thorough testing, the vehicle will be qualified to re-enter the fleet as a safe, quiet, efficient zero-emission bus or truck.

“Wrightspeed’s medium and heavy-duty “Powertrain in a Crate™” kits are a great way for our battery technology to help quickly and locally convert legacy diesel and gas vehicles to zero-emission electric vehicles” said Susan Brennan, Romeo’s Chief Executive Officer. “We are as excited about Wrightspeed’s technology and business model as we are about our new partnership.”

The battery packs will be manufactured at Romeo Power’s new state of the art facility in Cypress, California, where production is scheduled to begin later in 2022. The balance of the “Powertrain in a Crate” solution will be assembled in Wrightspeed’s 110,000 square foot Alameda, California facility. The complete system will be shipped and installed near fleets locally with training and support from both Romeo Power and Wrightspeed.

About Romeo Power, Inc.

Founded in 2016 and headquartered in Los Angeles, California, Romeo Power (NYSE: RMO) is an energy technology leader delivering advanced electrification solutions for complex commercial vehicle applications. The Company’s suite of advanced battery electric products, combined with its innovative battery management system, delivers the safety, performance, reliability and configurability its customers need to succeed. To keep up with everything Romeo Power, please follow the Company on social media @romeopowerinc or visit www.romeopower.com.

About Wrightspeed Inc.

Wrightspeed designs and manufactures the world’s cleanest and most efficient electric vehicle (EV) powertrain for medium and heavy-duty vehicles. The company is revolutionizing the environmental impact and economics of heavy transportation by delivering world class EV technology where it’s needed most. Founded in 2005, Wrightspeed is headquartered and manufactures in Alameda, California. For more information about Wrightspeed, visit wrightspeed.com or send an email to This email address is being protected from spambots. You need JavaScript enabled to view it..


Contacts

For Investors:
Joe Caminiti or Ashley Gruenberg
Alpha IR Group
This email address is being protected from spambots. You need JavaScript enabled to view it.
312-445-2870

ANAHEIM, Calif.--(BUSINESS WIRE)--$WLDN--Willdan Group, Inc. (Nasdaq: WLDN) announced today that it has been awarded a two-and-a-half year contract by National Grid to implement a new energy efficiency program for low- to moderate-income (LMI) customers. This program will focus on comprehensive, gas-saving improvements across multiple building systems and will leverage a local Trade Ally network to sell and install energy projects. Program incentives will help cover the costs of gas-saving projects for eligible multifamily gas customers in National Grid’s downstate service territory, which consists of Brooklyn, Queens, Staten Island, and Long Island.


This program is the first of its kind for National Grid and is part of an innovative, larger statewide effort to provide a more holistic and coordinated approach to energy efficiency for New York LMI customers. This approach, called the Statewide Low- and Moderate-Income Portfolio Implementation Plan, aims to increase energy affordability, improve access to energy efficiency, and reduce fossil fuel combustion. This new program will contribute to achieving New York State’s goal of directing at least 35% of the overall benefits from clean energy programs to help disadvantaged communities, as set forth by the Climate Leadership and Community Protection Act.

“We are honored to support New York’s ambitious climate and equity goals,” said Tom Brisbin, Willdan’s CEO and Chairman. “This contract expands our reach in New York to include National Grid multifamily customers and will leverage our national experience implementing energy efficiency projects for multifamily properties and serving customers in disadvantaged communities.”

About National Grid

National Grid (NYSE: NGG) is an electricity, natural gas, and clean energy delivery company serving more than 20 million people through our networks in New York, Massachusetts, and Rhode Island. National Grid is transforming our electricity and natural gas networks with smarter, cleaner, and more resilient energy solutions to meet the goal of reducing greenhouse gas emissions. For more information, please visit National Grid’s website, follow them on LinkedIn or Twitter, watch them on YouTube, friend them on Facebook, and find their photos on Instagram.

About Willdan

Willdan is a nationwide provider of professional, technical and consulting services to utilities, government agencies, and private industry. Willdan’s service offerings span a broad set of complementary disciplines that include electric grid solutions, energy efficiency and sustainability, engineering and planning, and municipal financial consulting. For additional information, visit Willdan's website at www.willdan.com. Follow Willdan on LinkedIn, Facebook, and Twitter.

Forward-Looking Statements

Statements in this press release that are not purely historical are forward-looking statements within the meaning of the Private Securities Litigation Reform Act of 1995. It is important to note that Willdan’s actual results could differ materially from those in any such forward-looking statements. Factors that could cause actual results to differ materially include, but are not limited to, the risk factors listed from time to time in Willdan’s reports filed with the Securities and Exchange Commission, including, but not limited to, the Annual Report on Form 10-K filed for the year ended January 1, 2021. Willdan cautions investors not to place undue reliance on the forward-looking statements contained in this press release. Willdan disclaims any obligation to, and does not undertake to, update or revise any forward-looking statements in this press release.


Contacts

Al Kaschalk
VP Investor Relations
310-922-5643
This email address is being protected from spambots. You need JavaScript enabled to view it.

DUBLIN--(BUSINESS WIRE)--The "Marine Gensets - Global Market Trajectory & Analytics" report has been added to ResearchAndMarkets.com's offering.


Global Marine Gensets Market to Reach $6.7 Billion by 2027

The global market for Marine Gensets estimated at US$5.4 Billion in the year 2020, is projected to reach a revised size of US$6.7 Billion by 2027, growing at a CAGR of 3.1% over the analysis period 2020-2027.

Commercial Vessels, one of the segments analyzed in the report, is projected to record a 3.3% CAGR and reach US$3.5 Billion by the end of the analysis period. After an early analysis of the business implications of the pandemic and its induced economic crisis, growth in the Defense Vessels segment is readjusted to a revised 3.1% CAGR for the next 7-year period.

The U.S. Market is Estimated at $1.1 Billion, While China is Forecast to Grow at 3.7% CAGR

The Marine Gensets market in the U.S. is estimated at US$1.1 Billion in the year 2020. China, the world`s second largest economy, is forecast to reach a projected market size of US$1.5 Billion by the year 2027 trailing a CAGR of 3.7% over the analysis period 2020 to 2027.

Among the other noteworthy geographic markets are Japan and Canada, each forecast to grow at 2.1% and 2.7% respectively over the 2020-2027 period. Within Europe, Germany is forecast to grow at approximately 2.6% CAGR.

Offshore Support Vessels Segment to Record 2.8% CAGR

In the global Offshore Support Vessels segment, USA, Canada, Japan, China and Europe will drive the 2.5% CAGR estimated for this segment.

These regional markets accounting for a combined market size of US$607.7 Million in the year 2020 will reach a projected size of US$723 Million by the close of the analysis period. China will remain among the fastest growing in this cluster of regional markets. Led by countries such as Australia, India, and South Korea, the market in Asia-Pacific is forecast to reach US$1.3 Billion by the year 2027.

Key Topics Covered:

I. METHODOLOGY

II. EXECUTIVE SUMMARY

1. MARKET OVERVIEW

  • World Market Trajectories
  • Impact of Covid-19 and a Looming Global Recession
  • An Introduction to Marine Gensets
  • Marine Gensets Market: Prospects and Outlook
  • Commercial Vessels Segment Poised for High Growth
  • Diesel Fuel Dominates Market
  • Asian Economies to Spearhead Future Growth

2. FOCUS ON SELECT PLAYERS (Total 51 Featured)

  • ABB Ltd.
  • Caterpillar, Inc.
  • Cummins India Ltd.
  • Deutz AG
  • Dresser-Rand Group, Inc.
  • Kohler Co.
  • Mitsubishi Heavy Industries Ltd.
  • Rolls-Royce Power Systems AG
  • Sole Diesel
  • Valley Power Systems
  • Wartsila Corporation
  • Yanmar Co., Ltd.

3. MARKET TRENDS & DRIVERS

  • Steady Growth in Seaborne Trade Volumes Drives Demand for Marine Gensets
  • Steady Growth in Number of Container Ships and Gas Carrier Marine Freight Worldwide: An Opportunity for the Market
  • Shipbuilding Activity Trends Influence Dynamics of Marine Gensets Market
  • Offshore E&P Projects and Offshore Wind Projects Drive Demand for Marine Gensets Used in OSVs
  • Marine Gensets Market Stands to Gain from Prevailing Scenario in the FPSO Industry
  • A Snapshot of Select Major Under Construction FPSO Projects Worldwide
  • Expanding Fleet of High-Value Pleasure Vessels Presents Favorable Outlook for Marine Gensets Market
  • Demand Rises for Hybrid-Fuel Powered Marine Gensets
  • Variable Speed Generators, a Simple Yet Potent Technology to Achieve Energy Savings
  • Relation Between Speed and Torque & Its Importance in Energy Efficiency
  • Advancements in Marine Generators: A Review
  • Kohler Develops Low CO Gasoline Marine Generator
  • Growing Demand for Power in New Age Boats Throws Spotlight on Designing of Efficient Gensets
  • Manufacturers Introduce Generators with Ignition-Protected Starters
  • Rise in Use of Permanent Magnets in Generator Designs
  • Stringent Environmental Regulations: A Major Market Deterrent for Diesel Gensets
  • Pollutant Emissions from Diesel Engines: A Review

4. GLOBAL MARKET PERSPECTIVE

III. REGIONAL MARKET ANALYSIS

IV. COMPETITION

For more information about this report visit https://www.researchandmarkets.com/r/7t8o3o


Contacts

ResearchAndMarkets.com
Laura Wood, Senior Press Manager
This email address is being protected from spambots. You need JavaScript enabled to view it.
For E.S.T Office Hours Call 1-917-300-0470
For U.S./CAN Toll Free Call 1-800-526-8630
For GMT Office Hours Call +353-1-416-8900

HOUSTON--(BUSINESS WIRE)--Falcon Minerals Corporation (“Falcon,” or the “Company,” “we,” “our,”) (NASDAQ: FLMN, FLMNW), a leading oil and gas minerals company, today announces financial and operating results for the fourth quarter and full year ending December 31, 2021.


Falcon Highlights

  • Net production of 4,067 barrels of oil equivalent per day (“Boe/d”) for the fourth quarter 2021 and 4,438 Boe/d for the full year 2021
  • 48 gross wells (0.30 net) turned in line during the fourth quarter 2021 and 225 gross wells (2.35 net) turned in line for the full year 2021
  • 126 gross line-of-sight wells (1.39 net) permitted and in active development as of March 3, 2022 on the Company’s Eagle Ford position
  • Received $0.8 million of lease bonus revenue in the Marcellus Shale during the fourth quarter 2021
  • Fourth quarter 2021 net income of $9.3 million and full year 2021 net income of $27.5 million (1)
  • Adjusted EBITDA of $13.7 million for the fourth quarter 2021, excluding $2.2 million of expenses associated with the announced transaction with Desert Peak Minerals (“Desert Peak”) ($11.6 million inclusive of all transaction expenses) (2)
  • Adjusted EBITDA of $51.7 million for full year 2021(3)
  • Pro-forma Free Cash Flow of $13.0 million in the fourth quarter 2021, excluding $2.2 million of expenses associated with the announced Desert Peak transaction ($10.9 million of Pro-forma Free Cash Flow inclusive of transaction expenses) (2)
  • Fourth quarter 2021 dividend of $0.145 per share declared on February 17, 2022
  • Dividend paid on March 9, 2022 to all shareholders of record as of February 28, 2022
  • Falcon announced on January 12, 2022 that the Company had entered into a definitive agreement to combine in an all-stock transaction with Desert Peak; it is anticipated that the transaction will close in the second quarter 2022

(1)


Net income shown above includes amounts attributable to non-controlling interests.

(2) 


Please refer to the disclosure on pages 8-9 for a reconciliation of the identified non-GAAP measures to net income, the most comparable financial measure prepared in accordance with GAAP.

(3)


Excludes expenses associated with the announced Desert Peak transaction and executive leadership transition ($47.9 million of Adjusted EBITDA inclusive of expenses associated with the announced Desert Peak transaction and executive leadership transition).  

Management Commentary

Bryan C. Gunderson, President and Chief Executive Officer of Falcon Minerals commented, “We are pleased with the way Falcon ended 2021, with Pro-forma Free Cash Flow per share above our guidance range. We are also excited about the way we entered 2022 by delivering on our core strategic objective to add scale and diversity without sacrificing asset quality or Free Cash Flow on a per share basis.” Mr. Gunderson continued, “Falcon’s previously announced fourth quarter dividend of $0.145 per share allows Falcon’s shareholders to participate in the strong macro environment for commodities as we work to finalize the transformational combination with Desert Peak. Following the closing of the Desert Peak transaction, we believe that Falcon will be positioned extremely well, as the combined company will benefit from owning best-in-class assets in the most active U.S. basins, a strong balance sheet, and a supportive commodity backdrop.”

Matthew B. Ockwood, Falcon’s Chief Financial Officer added, “Falcon’s assets performed well during the fourth quarter. Adjusted Pro-forma Free Cash Flow per share of $0.15 exceeded our guidance range of $0.13 - $0.14 per share, allowing Falcon to declare a quarterly dividend of $0.145 per share, which represents a payout ratio of 97%. Falcon entered 2022 with no oil hedges in place and is currently benefitting from our asset quality and favorable proximity to markets in Texas.” Mr. Ockwood continued, “The Marcellus Shale asset portfolio again contributed meaningfully to quarterly results both in production and in new lease bonus revenue. We expect this trend to continue into early 2022, as activity in the Marcellus continues at a robust pace.”

Financial Results

Falcon realized prices of $76.51 per barrel (“bbl”) for crude oil, $4.68 per thousand cubic feet (“mcf”) for natural gas and $38.54/bbl for natural gas liquids (“NGL”) during the fourth quarter 2021.

Falcon reported net income of $9.3 million, or $0.11 of net income per Class A common share, for the fourth quarter 2021, which includes amounts attributable to non-controlling interests. Falcon generated royalty revenue of $18.6 million (approximately 64% oil) and lease bonus revenue of $0.8 million for the fourth quarter 2021. The Company reported Adjusted EBITDA (a non-GAAP measure defined and reconciled on pages 8-9) of $11.6 million for the fourth quarter 2021, or $13.7 million excluding the transaction expenses associated with the Desert Peak merger incurred during the fourth quarter 2021.

Cash operating costs consisting of production and ad valorem taxes and marketing and transportation expenses for the fourth quarter 2021 were $1.4 million, or $3.67/Boe on a combined basis. General and administrative expense for the third quarter 2021, excluding non-cash stock-based compensation of $0.4 million and $2.2 million of expenses associated with the Desert Peak transaction, was approximately $2.5 million.

As of December 31, 2021, the Company had $40.0 million of borrowings on its revolving credit facility, and $2.8 million of cash on hand, resulting in net debt of approximately $37.2 million at the end of the quarter. Falcon’s net debt / LTM EBITDA ratio was 0.72x as of December 31, 2021. (4)

(4)


Calculated by dividing the sum of total debt outstanding less cash on hand as of December 31, 2021 by Adjusted EBITDA for the trailing 12-month period. Please refer to the disclosure on pages 8-9 for the Reconciliation of net income to Non-GAAP Measures.

Fourth Quarter 2021 Dividend

Falcon’s Board of Directors declared a dividend of $0.145 per Class A share for the fourth quarter 2021 on February 17, 2022. During the fourth quarter 2021, the Company generated Pro-forma Free Cash Flow of $13.0 million, or $0.15 per share excluding expenses associated with the Desert Peak transaction. Inclusive of expenses associated with the Desert Peak transaction, Falcon generated Pro-forma Free Cash Flow of $10.9 million, or $0.13 per share (5) (as described and reconciled on page 8-9). The dividend for the fourth quarter 2021 was paid on March 9, 2022 to all Class A shareholders of record on February 28, 2022.

As a result of this dividend, Falcon has declared and paid $0.55 per share in dividends over the trailing 365-day period, resulting in an adjustment to the exercise price of the Falcon warrants downward to $11.29 per warrant.

The Company expects that approximately 63% of its 2021 dividends will not constitute taxable dividend income and instead will result in a non-taxable reduction to the tax basis of the shareholders’ common stock. The reduced tax basis will increase a shareholders’ capital gain (or decrease shareholders’ capital loss) when shareholders sell their common stock.

(5)


The pro-forma adjustments assume that the non-controlling interests are converted to Class A common shares, such that approximately 86.9 million Class A shares would be outstanding.  The pro-forma Class A shares reflects dilution from 0.5 million unvested restricted stock awards which receive dividend equivalent rights (“DER”) when dividends are paid to Class A common stockholders.

Operational Results

Falcon’s production averaged 4,067 Boe/d during the fourth quarter 2021, of which approximately 42% was oil and approximately 75% was from the Eagle Ford. Eagle Ford production was approximately 56% oil during the fourth quarter 2021. During the fourth quarter 2021, Falcon’s gas sales volumes reflected a material increase in Marcellus production, which led to lower than anticipated percentage of oil contribution to the total production mix. Falcon expects that this ratio will normalize to an oil mix of 45%-50%. Falcon had 48 gross wells turned in line (0.30 net wells) with an average net royalty interest (“NRI”) of approximately 0.6% during the fourth quarter 2021. Falcon averaged three rigs running on its Eagle Ford position during the fourth quarter 2021.

Falcon currently has 2,328 gross producing Eagle Ford wells, and the Company’s average NRI for all producing wells is approximately 1.25%. As of March 3, 2022 the Company had 126 line-of-sight wells (1.39 net wells) with an average NRI of 1.11% in various stages of development on Falcon’s Eagle Ford minerals position. These wells are comprised of the following:

Line-of-Sight Wells (As of March 3, 2022)

Stage of Activity Gross Wells Net Wells NRI %
Permitted

75

0.95

1.27%

Waiting on completion

44

0.29

0.67%

Waiting on connection

7

0.15

2.13%

Total line-of-sight

126

1.39

1.11%

Reserve Summary for the Year Ended December 31, 2021

As of December 31, 2021, net proved oil and gas reserves were approximately 17.2 million barrels of oil equivalent (MMboe), based on the Securities and Exchange Commission (“SEC”) average net realized price assumptions of $66.56/bbl for oil, $25.96/bbl for NGL, and $3.60/mcf for natural gas. Falcon’s year end 2021 proved reserves were valued at a PV-10 amount of approximately $372 million, and approximately 58% of the Company’s proved reserves were oil and NGLs.

Summary of proved reserves as of December 31, 2021:

Total
Oil (Mbbl) Gas (MMcf) NGLs (Mbbl) MBoe
Proved developed reserves

2,738

19,098

1,183

7,104

Proved undeveloped reserves

5,025

24,339

1,059

10,141

Total proved reserves at December 31, 2021

7,763

43,437

2,242

17,245

Reconciliation of proved reserves for full year 2021:

Total
Oil (Mbbl) Gas (MMcf) NGLs (Mbbl) MBoe
Proved reserves at December 31, 2020

9,742

48,536

2,186

20,017

Purchase of reserves in place

22

34

5

33

Extensions and discoveries

326

1,777

122

744

Reivisions of previous estimates

(1,571)

(3,109)

159

(1,930)

Production

(756)

(3,801)

(230)

(1,620)

Proved reserves at December 31, 2021

7,763

43,437

2,242

17,245

 
Changes in reserves net of production

(1,223)

(1,298)

286

(1,153)

About Falcon Minerals

Falcon Minerals Corporation (NASDAQ: FLMN, FLMNW) is a C-Corporation formed to own and acquire high growth oil-weighted mineral rights. Falcon Minerals owns mineral, royalty, and over-riding royalty interests covering approximately 256,000 gross unit acres in the Eagle Ford Shale and Austin Chalk in Karnes, DeWitt, and Gonzales Counties in Texas. The Company also owns approximately 95,000 gross unit acres in the Marcellus Shale across Pennsylvania, Ohio, and West Virginia. For more information, visit our website at www.falconminerals.com.

Cautionary Note Regarding Forward-Looking Statements

This document contains forward-looking statements that involve a number of assumptions, risks and uncertainties that could cause actual results to differ materially from those contained in the forward-looking statements. Falcon cautions readers not to place any undue reliance on these forward-looking statements as forward-looking information is not a guarantee of future performance. The words “anticipate,” “believe,” “continue,” “could,” “estimate,” “expect,” “intends,” “may,” “might,” “plan,” “seeks,” “possible,” “potential,” “predict,” “project,” “prospects,” “guidance,” “outlook,” “should,” “would,” “will,” and similar expressions may identify forward-looking statements, but the absence of these words does not mean that a statement is not forward-looking. Such forward-looking statements include, but are not limited to, statements about future financial and operating results, future dividends paid, the tax treatment of dividends paid, Falcon’s plans, initiatives, objectives, expectations and intentions, the anticipated impact and timing of the proposed Desert Peak transaction, including the combined company’s expected performance, and other statements that are not historical facts. While forward-looking statements are based on assumptions and analyses made by us that we believe to be reasonable under the circumstances, whether actual results and developments will meet our expectations and predictions depend on a number of risks and uncertainties which could cause our actual results, performance, and financial condition to differ materially from our expectations. See “Risk Factors” in Falcon’s Annual Report on Form 10-K for the fiscal year ended December 31, 2020, as amended on Form 10-K/A, and in Falcon’s Quarterly Reports on Form 10-Q, filed with the Securities and Exchange Commission (“SEC”), for a discussion of risk factors that affect our business. Any forward-looking statement made in this news release speaks only as of the date on which it is made. Factors or events that could cause actual results to differ may emerge from time to time, and it is not possible to predict all of them. Neither Desert Peak nor Falcon undertake any obligation to publicly update any forward-looking statement, whether as a result of new information, future development, or otherwise, except as may be required by law.

Additional Information and Where to Find It

In connection with the proposed Desert Peak transaction, the Company has filed with the SEC a proxy statement on Schedule 14A (the “Proxy Statement”) and will file other documents with the SEC regarding the proposed transaction. The Proxy Statement will be sent or given to the Company’s stockholders and will contain important information about the proposed transaction and related matters. INVESTORS ARE URGED TO READ THE PROXY STATEMENT (INCLUDING ALL AMENDMENTS AND SUPPLEMENTS THERETO) AND OTHER RELEVANT DOCUMENTS FILED WITH THE SEC IF AND WHEN THEY BECOME AVAILABLE BECAUSE THEY WILL CONTAIN IMPORTANT INFORMATION. You may obtain a free copy of the Proxy Statement and other relevant documents filed by Falcon with the SEC at the SEC’s website at www.sec.gov. You may also obtain the Company’s documents on its website at www.falconminerals.com. The references to the SEC's website and our website are for the convenience of investors and shall not be deemed to be incorporated into any of the Company’s filings. All website addresses in this prospectus are intended to be inactive textual references only.

Participants in the Solicitation

The Company, Desert Peak and certain of their respective directors, executive officers and employees may be deemed to be participants in the solicitation of proxies in connection with the proposed transaction and may have direct or indirect interests in the proposed transaction. Information about the Company’s directors and executive officers is set forth in the Company’s Proxy Statement on Schedule 14A for its 2021 Annual Meeting of Stockholders, filed with the SEC on April 23, 2021, its Annual Report on Form 10-K for the fiscal year ended December 31, 2020, filed with the SEC on March 12, 2020, as amended on Form 10-K/A, filed with the SEC on May 5, 2021, and its other documents which are filed with the SEC. Other information regarding the participants in the proxy solicitations and a description of their direct and indirect interests, by security holdings or otherwise, is set forth in the Proxy Statement. Other relevant materials will be filed with the SEC regarding the proposed transaction when they become available. Investors should read the Proxy Statement carefully before making any voting or investment decisions. Investors may obtain free copies of these documents using the sources indicated above.

FALCON MINERALS CORPORATION
CONDENSED CONSOLIDATED STATEMENTS OF OPERATIONS
(In thousands, except per share amounts)
(Unaudited)
 
Three Months Ended Year Ended
December 31, December 31,


2021


2020


2021


2020


Revenues:
Oil and gas sales

$

18,642


$

10,234


$

70,868


$

40,081


Lease bonus and other revenue


807


-


1,970


-


Gain (loss) on hedging activities


680


(737

)


(4,830

)


(1,200

)

Total revenue


20,129


9,497


68,008


38,881


Expenses:
Production and ad valorem taxes


950


602


3,935


2,807


Marketing and transportation


423


426


1,752


1,993


Amortization of royalty interests in oil & gas properties


4,151


3,619


15,233


14,103


General, administrative and other


5,066


3,379


14,130


11,997


Total expenses


10,590


8,026


35,050


30,900


Operating income


9,539


1,471


32,958


7,981


Other income (expense):
Change in fair value of warrant liability


1,207


(1,728

)


467


5,128


Other income


13


31


50


125


Interest expense


(473

)


(491

)


(1,924

)


(2,197

)

Total other income (expense)


747


(2,188

)


(1,407

)


3,056


Income (loss) before income taxes


10,286


(717

)


31,551


11,037


Provision for income taxes


1,035


189


4,059


589


Net income (loss)


9,251


(906

)


27,492


10,448


Net income attributable to non-controlling interests


(4,139

)


(470

)


(14,336

)


(2,748

)

Net income (loss) attributable to shareholders

$

5,112


$

(1,376

)

$

13,156


$

7,700


Class A common shares - basic

$

0.11


$

(0.03

)

$

0.28


$

0.17


Class A common shares - diluted

$

0.10


$

(0.03

)

$

0.28


$

0.11


FALCON MINERALS CORPORATION
CONSOLIDATED BALANCE SHEETS
(In thousands)
(Unaudited)
 
December 31, December 31,
ASSETS


2021


2020

Current assets:
Cash and cash equivalents

$

2,768

$

2,724

Accounts receivable


10,018


5,419

Prepaid expenses


1,220


766

Total current assets


14,006


8,909

Royalty interests in oil & gas properties, net of accumulated amortization


193,544


207,505

Property and equipment, net of accumulated depreciation


322


427

Deferred tax asset, net


52,135


55,773

Other assets


1,834


3,015

Total assets

$

261,841

$

275,629

 
LIABILITIES AND SHAREHOLDERS' EQUITY
Current liabilities:
Accounts payable and accrued expenses

$

3,471

$

1,540

Other current liabilities


502


1,557

Total current liabilities


3,973


3,097

Credit facility


40,000


39,800

Warrant liability


3,036


3,503

Other non-current liabilities


576


828

Total liabilities


47,585


47,228

 
Shareholders' equity:
Class A common stock


5


5

Class C common stock


4


4

Additional paid in capital


121,029


121,053

Non-controlling interests


83,586


88,637

Retained earnings


9,632


18,702

Total shareholders' equity


214,256


228,401

Total liabilities and shareholders' equity

$

261,841

$

275,629


Non-GAAP Financial Measures

Adjusted EBITDA and Pro-forma Free Cash Flow are supplemental non-GAAP financial measures used by management and external users of our financial statements, such as industry analysts, investors, lenders, and rating agencies. We believe Adjusted EBITDA and Pro-forma Free Cash Flow are useful because they allow us to evaluate our performance and compare the results of our operations period to period without regard to our financing methods or capital structure. In addition, management uses Adjusted EBITDA and Pro-forma Free Cash Flow to evaluate cash flow available to pay dividends to our common shareholders.

We define Adjusted EBITDA as net income before interest expense, net, depletion and depreciation expense, provision for income taxes, change in fair value of warrant liability, unrealized gains and losses on commodity derivative instruments and non-cash equity-based compensation. We define Pro-forma Free Cash Flow as net income before depletion and depreciation expense, provision for income taxes, change in fair value of warrant liability, unrealized gains and losses on commodity derivative instruments and non-cash equity-based compensation less interest expense and cash income taxes. Adjusted EBITDA and Pro-forma Free Cash Flow are not measures of net income as determined by GAAP. We exclude the items listed above from net income in calculating Adjusted EBITDA and Pro-forma Free Cash Flow because these amounts can vary substantially from company to company within our industry depending upon accounting methods and book values of assets, capital structures and the method by which the assets were acquired. Certain items excluded from Adjusted EBITDA and Pro-forma Free Cash Flow are significant components in understanding and assessing a company’s financial performance, such as a company’s cost of capital and tax structure, as well as historic costs of depreciable assets, none of which are components of Adjusted EBITDA and Pro-forma Free Cash Flow.

Adjusted EBITDA and Pro-forma Free Cash Flow should not be considered an alternative to, or more meaningful than, net income, royalty income, cash flow from operating activities or any other measure of financial performance presented in accordance with GAAP. Our computations of Adjusted EBITDA and Pro-forma Free Cash Flow may not be comparable to other similarly titled measures of other companies.

Reconciliation of Net Income to Adjusted EBITDA and Pro-forma Free Cash Flow

(in thousands, except per share amounts):

Fully Converted
Three Months Per Share Basis
Ended Three Months Ended
December 31, 2021 December 31, 2021 (1)
Net income

$

9,251


$

0.11


Interest expense (2)


473


0.01


Depletion and depreciation


4,177


0.05


Share-based compensation


417


-


Unrealized gain on commodity derivatives


(2,577

)


(0.03

)

Change in fair value of warrant liability


(1,207

)


(0.01

)

Income tax expense


1,035


0.01


Adjusted EBITDA

$

11,569


$

0.14


Interest expense (2)


(473

)


(0.01

)

Pro-forma cash income taxes (3)


(210

)


-


Pro-forma Free Cash Flow

$

10,886


$

0.13


(1)


Per share information is presented on a fully converted basis of 86.9 million common shares which is inclusive of 47.0 million Class A common shares, 39.4 million Class C common shares and 0.5 million unvested restricted stock awards that are outstanding as of December 31, 2021. As such, net income per fully converted share in this schedule is not comparable to net income per share of $0.11 for the period ended December 31, 2021 as shown on the Condensed Consolidated Statements of Operations.

(2)


Interest expense includes amortization of deferred financing costs. 

(3)


Pro-forma cash income taxes are estimated on a pro-rata basis and therefore based upon net income before non-controlling interest considerations. 

Calculation of cash available for dividends for the fourth quarter 2021 (in thousands):

Three Months Ended
December 31,


2021


Adjusted EBITDA

$

11,569


Interest expense (2)


(473

)

Pro-forma cash taxes (3)


(210

)

Net cash available for distribution

$

10,886


Cash to be distributed to non-controlling interests

$

5,806


Cash to be distributed to Falcon Minerals Corp. (4)

$

6,931


Dividends to be paid to Class A shareholders

$

6,817


(2)


Interest expense includes amortization of deferred financing costs.

(3)


Pro-forma cash income taxes are estimated on a pro-rata basis and therefore based upon net income before non-controlling interest considerations. 

(4)


Includes approximately $113k of cash for current income taxes at Falcon Minerals Corporation.

FALCON MINERALS CORPORATION
SELECTED OPERATING DATA
(Unaudited)
 
Three Months Ended Year Ended
December 31, December 31,


2021


2020


2021


2020

Production Data:
Oil (bbls)


155,352


179,219


756,236


835,545

Natural gas (Mcf)


959,920


885,186


3,801,087


3,528,150

Natural gas liquids (bbls)


58,801


59,239


230,093


247,536

Combined volumes (boe)


374,140


385,989


1,619,844


1,671,106

Average daily combined volume (boe/d)


4,067


4,196


4,438


4,566

 
Average sales prices:
Oil (bbls)

$

76.51

$

40.21

$

66.39

$

35.84

Natural gas (mcf)

$

4.68

$

2.42

$

3.59

$

2.01

Natural gas liquids (bbls)

$

38.54

$

14.99

$

30.52

$

12.28

Combined per boe

$

49.83

$

26.52

$

43.75

$

23.98

 
Average costs ($/boe):
Production and ad valorem taxes

$

2.54

$

1.56

$

2.43

$

1.68

Marketing and transportation expense

$

1.13

$

1.10

$

1.08

$

1.19

Cash general and administrative expense

$

12.36

$

6.37

$

8.51

$

5.03

Interest expense, net

$

1.26

$

1.27

$

1.19

$

1.31

Depletion

$

11.09

$

9.37

$

9.40

$

8.44


Contacts

Falcon Minerals Contact:
Matthew B. Ockwood
Chief Financial Officer
This email address is being protected from spambots. You need JavaScript enabled to view it.


Read full story here

DUBLIN--(BUSINESS WIRE)--The "Biomass Power Market Size, Share & Trends Analysis Report by Feedstock (Solid Biofuel, Liquid Biofuel), by Technology (Combustion, Gasification), by Region (North America, EU, APAC), and Segment Forecasts, 2022-2030" report has been added to ResearchAndMarkets.com's offering.


The global biomass power market size is expected to reach USD 203.61 billion by 2030 and is expected to expand at a CAGR of 6.0%

The growing concerns about Greenhouse Gas (GHG) emissions have resulted in favorable policies and regulations for renewable energy, which has been the key factor driving the growth of this market.

The COVID-19 pandemic has hampered the market growth globally owing to the disruptions in the supply chain, which resulted in delays for some projects. The power demand has declined from commercial and industrial end-users in the non-essential category due to the closure of operations during the lockdown.

These factors have resulted in delays in the construction of new biomass power plants and reduced power supply from existing biomass power plants. Solid biofuel has emerged as the dominant feedstock segment in the market owing to its easy availability. Moreover, it is simpler to use than liquid biofuel and biogas in power generation applications. The combustion technology segment accounted for the largest market share in 2021, in terms of revenue.

The growth of this segment can be attributed to lower costs of combustion technology than anaerobic digestion and gasification technologies. Europe has emerged as the major regional market owing to the presence of supportive policies and plans, coupled with the announcement of the phasing-out of coal-based power plants by the leading European countries, such as the U.K., Germany, and France.

Biomass Power Market Report Highlights

  • In terms of revenue, the solid biofuel segment accounted for the dominant revenue share in 2021 and is projected to expected further over the forecast period.
  • Germany dominated the Europe regional market and accounted for the maximum revenue share in 2021.
  • The high rate of depletion of fossil fuels in the Europe region is creating ample growth opportunities for this market.
  • The European Union has set a target to fulfill a significant portion of its energy requirements from renewable sources.
  • The focus of governments of different countries of the region on reducing carbon emissions also creates ample opportunities for the market.
  • Some of the major strategic initiatives undertaken by vendors in the biomass power market include M&A & R&D activities, overseas business expansions, and strategic collaborations among the market participants.

Key Topics Covered:

Chapter 1. Methodology and Scope

Chapter 2. Executive Summary

Chapter 3. Biomass Power Market Variables, Trends & Scope

Chapter 4. Biomass Power Market: Technology Estimates & Trend Analysis

Chapter 5. Biomass Power Market: Feedstock Estimates & Trend Analysis

Chapter 6. Biomass Power Market: Regional Estimates & Trend Analysis

Chapter 7. Competitive Analysis

Chapter 8. Company Profiles

  • Mitsubishi Power, Ltd.
  • Suez
  • Xcel Energy Inc.
  • Ramboll Group A/S
  • Ameresco Inc.
  • Babcock & Wilcox Enterprises, Inc.
  • Orsted A/S
  • General Electric
  • Veolia
  • Vattenfall

For more information about this report visit https://www.researchandmarkets.com/r/yw38az


Contacts

ResearchAndMarkets.com
Laura Wood, Senior Press Manager
This email address is being protected from spambots. You need JavaScript enabled to view it.
For E.S.T Office Hours Call 1-917-300-0470
For U.S./CAN Toll Free Call 1-800-526-8630
For GMT Office Hours Call +353-1-416-8900

  • The project will demonstrate the core end-to-end fuel recycling process using advanced automation techniques and sensor technologies.
  • The primary objectives of the project will be the technical basis for a commercial-scale recycling facility.
  • This work will facilitate the development of a secure and economical domestic fuel supply chain for clean advanced fission power, furthering U.S. energy independence.


SANTA CLARA, Calif.--(BUSINESS WIRE)--#ARPAE--Oklo Inc. has been awarded a $5 million cost-share project in partnership with Argonne National Laboratory (Argonne), Idaho National Laboratory (INL), and Deep Isolation from the U.S. Department of Energy’s (DOE) Advanced Research Projects Agency-Energy (ARPA-E). The project is funded under the ARPA-E Optimizing Nuclear Waste and Advanced Reactor Disposal Systems (ONWARDS) program, the first focused program working to identify transformative pathways to reduce waste material and minimize the need for disposal sites.

This announcement follows DOE’s Technology Commercialization Fund and ARPA-E OPEN award announcements. Oklo’s selection for three competitive DOE awards for recycling exemplifies Oklo’s leadership in advanced fuel recycling. Together, the projects include process improvements through advanced sensors, advances using machine learning and digital twin modeling, and culminating in this ONWARDS project which will demonstrate the end-to-end recycling process and result in the technical basis for the commercial recycling facility.

“The ONWARDS project will build on our other DOE project work to allow Oklo to build a first-of-a-kind fuel recycling facility,” said Jacob DeWitte, co-founder and CEO of Oklo. The fuel recycling facility will enable Oklo to convert nuclear waste from existing used nuclear fuel into clean energy, as well as to recycle fuel from Oklo’s plants, allowing for a dramatic cost reduction and solving for a key supply chain need.

“A commercial-scale fuel recycling facility will change the economic paradigm for advanced fission,” added DeWitte. These investments in the infrastructure of advanced fission by the DOE will enable a cleaner and more secure energy future for the country.

About Oklo Inc.: Oklo Inc. (Oklo) is a California-based company developing advanced fission power plants to provide emission-free, reliable, and affordable energy. Oklo received a Site Use Permit from the U.S Department of Energy, successful fabrication of fuel prototypes, was awarded fuel material from Idaho National Laboratory, and developed the first advanced fission combined license application accepted and docketed by the U.S. Nuclear Regulatory Commission, and is developing waste-to-energy fuel recycling in collaboration with the U.S. Department of Energy and several national laboratories.


Contacts

Bonita Chester
Director of Marketing and External Relations
Inquiries: This email address is being protected from spambots. You need JavaScript enabled to view it.

Citizens for a Pro-Business Delaware Doubles Down on Demand for Delaware to Stop Doing Business with Skadden Until It Severs All Ties to Russian Oligarchs

WILMINGTON, Del.--(BUSINESS WIRE)--Following pressure from Citizens for a Pro-Business Delaware, other good government advocates, and intense media scrutiny, Skadden Arps has dropped a lawsuit on behalf of Alfa Bank, owned by billionaire Russian oligarch Mikhail Fridman, and pledged to relocate its Russia-based lawyers while maintaining its Moscow office. In response, Citizens for a Pro-Business Delaware Campaign Manager Chris Coffey released the following statement:


“We’re glad that our pressure, along with that of other good government groups, has forced Skadden to reconsider its long-held ties to Russian oligarchs, especially in light of Russia’s unprovoked invasion of Ukraine. But these latest steps by Skadden seem cynically calculated to minimize losses to the firm’s bottom line while publicly saving face as much as possible. We don’t buy it.

“For years, Skadden has done the bidding of Putin-aligned oligarchs without a shred of concern for his regime’s human rights abuses, helping facilitate more than $90 billion worth of Russian corporate deals just since 2012. While dropping the oligarch-backed Alfa Bank lawsuit is one small step towards justice, Skadden must do much more – including closing its Russia office, disclosing its Russian client list, and contributing to Ukraine relief efforts – to right its wrongs in Russia.

“Until Skadden does so, we are doubling down on our demand that Delaware’s courts and government cease doing business with Skadden immediately. The same firm taking Russian ‘blood money’ does not deserve to receive a cent from the state of Delaware.”

Citizens for a Pro-Business Delaware is a group made up of more than 5,000 members including employees of the global translation services company TransPerfect, as well as concerned Delaware residents, business executives and others. They formed in April of 2016 to focus on raising awareness with Delaware residents, elected officials, and other stakeholders about the unprecedented, forced sale of TransPerfect. While their primary goal of saving the company has been accomplished, they continue their efforts to fight for more transparency in the Delaware Chancery Court. For more information on Citizens for a Pro-Business Delaware or to join the cause, visit DelawareForBusiness.org.


Contacts

Chris Coffey, This email address is being protected from spambots. You need JavaScript enabled to view it.


PASADENA, Calif.--(BUSINESS WIRE)--$HLGN #ArtificialIntelligence--Heliogen, Inc. (“Heliogen”) (NYSE: HLGN), a leading provider of AI-enabled concentrated solar energy, today announced that it will release financial and operating results for 2021 after market close on Monday, March 28, 2022. This release will be followed by a conference call for investors at 8:30 AM EDT on March 29. Bill Gross, Founder and Chief Executive Officer of Heliogen, and Christie Obiaya, Chief Financial Officer will host the call.


The conference call may be accessed via a live webcast on a listen-only basis in the Investors section of Heliogen’s website at investors.heliogen.com. The call can also be accessed live via telephone by dialing 877-407-0789 (201-689-8562 for international callers) and referencing Heliogen.

A replay of the webcast will be available shortly after the call on the Investors section of Heliogen’s website.

About Heliogen

Heliogen is a renewable energy technology company focused on eliminating the need for fossil fuels in heavy industry and powering a sustainable future. The company’s AI-enabled, modular concentrated solar technology aims to cost-effectively deliver near 24/7 carbon-free energy in the form of heat, power, or green hydrogen fuel at scale – for the first time in history. Heliogen was created at Idealab, the leading technology incubator founded by Bill Gross in 1996. For more information about Heliogen, please visit Heliogen.com


Contacts

Heliogen Media Contact:
Cory Ziskind
ICR, Inc.
This email address is being protected from spambots. You need JavaScript enabled to view it.

Heliogen Investor Contact
Caldwell Bailey
ICR, Inc.
This email address is being protected from spambots. You need JavaScript enabled to view it.

HOUSTON--(BUSINESS WIRE)--#solarenergy--Vision Solar will be heading to the 'Bayou City', which is often referred to as Houston, Texas. Our Austin launch earlier this year has proven very successful. This has led to our rapid South Texas expansion into Houston.


As the solar industry continues to expand, Vision Solar continues to grow. Vision Solar has a projected growth of over 168% by the end of 2022. It will also create over 400+ jobs for the people of Texas.

As fuel prices rise, we are striving to get homeowners to a point where they can produce their own electricity in order to start saving money.

According to the SEIA market insight report for Texas: Texas is the second highest state for solar electric capacity, with more than 9,000 megawatts of solar capacity statewide — equivalent to over one million Texas homes running the renewable energy resource.’

In Q3 of 2021, 12,308.5 Solar Installed (MW) according to the same report.

In spite of solar energy's rapid growth, it still provides only 0.1 percent of the residential solar market, providing Vision Solar with a great opportunity to establish a solid foundation in Houston, Texas.

Considering the high sun exposure, the federal tax credits for switching to solar, and the value added to their properties, installing solar could provide homeowners in Houston, Texas with a very good return on investment.

Here at Vision Solar, we are passionate about providing homeowners with the opportunity to reduce their utility bills by as much as 40% or more!

”We are currently expanding nationwide - we know Houston, Texas is a pro-solar state and is actively seeking out ways to help consumers save money and become more sustainable." - Michael Eden, CRO

About Vision Solar

Vision Solar is one of the fastest growing solar energy companies in the United States. Their full-service renewable energy company installs solar services for residential homes nationwide. Over the past three years, Vision Solar has grossed over $168+ million in revenue, with significant increase in projected growth for 2022. To learn more visit https://visionsolar.com

For any inquiries regarding this press release, please feel free to contact John Czelusniak at This email address is being protected from spambots. You need JavaScript enabled to view it.


Contacts

John Czelusniak
Vision Solar LLC
This email address is being protected from spambots. You need JavaScript enabled to view it.

NEW YORK--(BUSINESS WIRE)--#KBRA--KBRA releases research following Russia’s invasion of Ukraine and its implications to the global oil and gas industry and the exacerbation of inflation in global economies. The effects of sanctions implemented by Western nations in response to Russia’s attack on Ukraine is still ongoing. Political strategy aside, sanctioning one of the largest global producers of oil and gas comes at a cost and market fears have driven a surge in commodity prices.


Key Takeaways

  • Even in the absence of direct sanctions on the Russian oil and gas industry, benchmark prices have risen to record levels over the last several weeks as market participants move to sever ties with the country. KBRA believes that these self-induced sanctions signify that $100-plus/bl crude oil prices are here to stay.
  • While artificially high crude oil prices should induce supply and demand dynamics that push down the price of oil, the imbalance of the missing 5 million barrels per day (bl/d) of Russian crude oil exports cannot be easily replaced over the short term.
  • KBRA believes that producers in the U.S. Permian Basin are well equipped to ameliorate some of the pain from high oil prices given their well economics and shorter rig lead times. Still, increases from Permian producers will take some time to work through the system and would only represent one-fifth of the needed production increase.
  • Without adequate supply increase, higher oil prices are likely to stay, which would lead to demand destruction for petroleum productions over the medium term. High oil prices, which may trigger a slowdown in economic activities, combined with inflationary pressures that are already being felt, may lead to the dreaded stagflation.
  • Nevertheless, over the medium to long term, KBRA still expects supply and demand dynamics to moderate oil prices and push the price of crude oil back below $100/bl.

Click here to view the report.

Related Publications

About KBRA
KBRA is a full-service credit rating agency registered in the U.S., the EU, and the UK, and is designated to provide structured finance ratings in Canada. KBRA’s ratings can be used by investors for regulatory capital purposes in multiple jurisdictions.


Contacts

Shane Olaleye, CFA, Senior Director
+1 (646) 731-2432
This email address is being protected from spambots. You need JavaScript enabled to view it.

Adam Gracely, Associate Director
+1 (646) 731-3329
This email address is being protected from spambots. You need JavaScript enabled to view it.

Rene White, Senior Analyst
+1 (646) 731-2451
This email address is being protected from spambots. You need JavaScript enabled to view it.

Andrew Giudici, Senior Managing Director, Global Head of Corporate, Project, and Infrastructure Finance
+1 (646) 731-2372
This email address is being protected from spambots. You need JavaScript enabled to view it.

Business Development
Jason Lilien
+1 (646) 731-2442
This email address is being protected from spambots. You need JavaScript enabled to view it.

KANSAS CITY, Mo.--(BUSINESS WIRE)--Kansas City Southern (KCS) announced today that it has pledged a total of $500,000 to the American Red Cross to support the global Red Cross network response to the Ukraine humanitarian crisis, and will also match employees’ contributions to the American Red Cross for this effort.


The entire world sees the escalating humanitarian crisis in Ukraine and we want to support the international effort to provide relief,” said KCS president and CEO Patrick J. Ottensmeyer. “I encourage all of our employees, vendors, suppliers, customers, and others across the world to join in these relief efforts.”

The American Red Cross has deployed international crisis responders to Poland, Moldova, Hungary and Romania to provide humanitarian relief in support of the international Red Cross operation helping families who fled their homes. These highly trained crisis responders are supporting on-the-ground relief efforts alongside local teams, including the Polish Red Cross and Moldovan Red Cross.

Headquartered in Kansas City, Mo., KCS is a transportation holding company that has railroad investments in the U.S., Mexico and Panama. Its primary U.S. holding is The Kansas City Southern Railway Company, serving the central and south-central U.S. Its international holdings include Kansas City Southern de Mexico, S.A. de C.V., serving northeastern and central Mexico and the port cities of Lázaro Cárdenas, Tampico and Veracruz, and a 50 percent interest in Panama Canal Railway Company, providing ocean-to-ocean freight and passenger service along the Panama Canal. KCS' North American rail holdings and strategic alliances with other North American rail partners are primary components of a unique railway system, linking the commercial and industrial centers of the U.S., Mexico and Canada. More information about KCS can be found at www.kcsouthern.com.


Contacts

C. Doniele Carlson, 816-983-1372, This email address is being protected from spambots. You need JavaScript enabled to view it.

NEWBURY PARK, Calif.--(BUSINESS WIRE)--Kolibri Global Energy Inc. (TSX: KEI) (OTCQB: KGEIF):


All amounts are in U.S. Dollars unless otherwise indicated:

2021 HIGHLIGHTS

  • In December 2021, the Company completed an equity rights offering for gross proceeds of C$8.6 million and is using the proceeds to drill two wells. As of March 10, 2022, the Company has completed drilling the Barnes 7-3H well (98.07% working interest) and the Barnes 8-4H well (99.8% working interest) and is currently performing a fracture stimulation on the Barnes 7-3H well with production expected in late March.
  • BOK Financial agreed to increase the borrowing base of the credit facility by $2.0 million if certain items are met. When the Company finishes fracture stimulating the Barnes 7-3H well, those items will have been met. The Company anticipates receiving the increase in the borrowing base in the second quarter of 2022.
  • The Company’s debt was reduced to $16.9 million at December 31, 2021 from $20.7 million at the beginning of the year. This was down from a peak debt level of $30.0 million.
  • The Company’s Total Proved Reserves were 34.1 million barrels of oil equivalent (BOE) for 2021 which was a 3% increase from 2020 according to the Company’s December 31, 2021, independent reserves evaluation. The NPV10 value of the Total Proved Reserves increased to $358.8 million, an 86% increase from 2020, due primarily to higher estimated future pricing.
  • The Company performed an impairment reversal test at December 31, 2021 and reversed the entire impairment expense of $71.9 million that was recorded in March 2020 due to low prices. The $71.9 impairment reversal was lower than the original impairment charge by $1.1 million to reflect the depletion that would have been recorded if the PP&E was never impaired for a net impairment reversal amount of $70.8 million.
  • Gross revenue in 2021 was $19.2 million, compared to $12.3 million in 2020.
  • Net income in 2021 was $71.0 million, compared to a net loss of $70.4 million in 2020, due to the impairment reversal of $70.8 million for the year ended December 31, 2021 compared to the impairment charge of $71.9 million for the year ended December 31, 2020.
  • Revenue, net of royalties was $15.0 million for 2021 compared to $9.6 million for 2020, due to an average price increase of 85% partially offset by 15% lower production.
  • Adjusted funds flow was $6.6 million for 2021 compared to $7.2 million for 2020. This decrease was due to a decrease in production of 15% and realized losses from commodity contracts in 2021 compared to realized gains in 2020, partially offset by the increase in average prices.(1)
  • Netback from operations increased to $33.75 per BOE in 2021 compared to $16.20 per BOE in 2020, an increase of 108%.(2) Netback including the impact of commodity contracts for 2021 was $26.05 per BOE, an increase of 9% from the prior year.(2) The 2021 increase compared to the prior year was due to the increase in average prices partially offset by higher production taxes.
  • Interest expense has decreased by 32% in 2021 compared to the prior year due to principal payments on the credit facility which reduced the outstanding loan balance combined with lower interest rates.
  • Average production for 2021 was 976 BOEPD compared to 1,151 BOEPD in 2020, a decrease of 15% due to the normal production decline of existing wells.
  • General & administrative (G&A) expenses for 2021 were $2.7 million compared to $2.9 million in 2020, a decrease of 7%. The decrease is due to management’s continued efforts to reduce G&A costs throughout the Company partially offset by higher advisor fees at the beginning of the year.
  • Production and operating expense per barrel averaged $8.32 per BOE in 2021 compared to $6.54 per BOE in 2020, an increase of 27%. The increase was primarily due to an increase in production taxes of $1.47 per BOE in 2021 due to higher average prices.

(1)


Adjusted Funds Flow is considered a non-GAAP measure. Refer to the section entitled “Non-GAAP Measures” of this earnings release.

(2)


Netback from operations and netback including commodity contracts are considered non-GAAP ratios. Refer to the section entitled “Non-GAAP Measures” of this earnings release.

Kolibri’s President and Chief Executive Officer, Wolf Regener commented:

“With our successful rights offering raising over C$8.6 million in December, the Company was able to fast track our 2022 drilling program at the beginning of the year. We have already drilled both the Barnes 7-3H well and the Barnes 8-4H well safely and on budget. The Company is currently performing fracture stimulation operations on the Barnes 7-3H well and expects production flow back by the end of March. In addition, we anticipate receiving the additional $2.0 million increase in our credit facility borrowing base which we will use, along with cash flow from operations, to fracture stimulate the Barnes 8-4H well in the second quarter of 2022. With oil current prices of over $100/barrel, we expect to generate significant incremental value to shareholders from both of these wells as production from these wells is unhedged.

Our 2021 independent reserves evaluation report showed a 3% increase in total proved reserves from the prior year with a NPV10 total proved value of $358.8 million, which was an 86% increase from 2020, primarily due to higher prices.

Also, due to higher prices in the oil market, the Company completely reversed the $71.9 million impairment charge that it has recorded in March 2020. The $71.9 impairment reversal was reduced by $1.1 million to reflect the depletion that would have been recorded if the PP&E was never impaired for a net impairment reversal amount of $70.8 million.

The Company was able to generate $6.6 million of adjusted funds flow without any capital expenditures during the year.

Netback from operations increased to $33.75 per BOE in 2021 compared to $16.20 per BOE in 2020, an increase of 108%, with an average price of $66.08 per BOE. Netback including the impact of commodity contracts for 2021 was $26.05 per BOE, an increase of 9% from the prior year. The 2021 increase compared to the prior year was due to the increase in average prices partially offset by higher production taxes.

Revenue, net of royalties was $15.0 million for 2021 compared to $9.6 million for 2020, an increase of 56% due to an 86% increase in average prices partially offset by a 15% decrease in production.

The average production for 2021 was 975 BOEPD, a decrease of 15% compared to 2020 production of 1,151 BOEPD. The decrease is due to the normal production decline of existing wells as no new wells were brought online in 2021.

G&A expenses for 2021 was $2.7 million compared to $2.9 million in 2020, a decrease of 7%. The decrease is due to management’s continued efforts to reduce G&A costs throughout the Company partially offset by higher advisor fees at the beginning of the year.

Interest expense has decreased by 32% in 2021 compared to the prior year due to principal payments on the credit facility which reduced the outstanding loan balance combined with lower interest rates.

Production and operating expense per barrel averaged $8.32 per BOE in 2021 compared to $6.54 per BOE in 2020, an increase of 27%. The increase was primarily due to an increase in production taxes of $1.47 per BOE in 2021 due to higher average prices.”


Fourth Quarter


Year Ended


2021

2020


%


2021


2020


%


Net Income (Loss):

$ Thousands

$72,340

$(1,078)

-%

$71,002

$(70,410)

-%

$ per common share

$0.31

$(0.01)

-%

$0.30

$(0.30)

-%

assuming dilution


Adjusted Funds Flow

$1,859

$1,750

6%

$6,569

$7,196

(9%)

Capital Expenditures

$559

$43

1200%

$696

$(16)

-%


Average Production (Boepd)

931

1,082

(14%)

975

1,151

(15%)

Gross Revenue

5,444

3,205

70%

19,128

12,251

56%

Average Price per Barrel

$51.67

$32.19

61%

$53.75

$29.08

85%

Netback from operations

per Barrel

$40.88

$18.38

122%

$33.75

$16.20

108%

Netback including commodity contracts per Barrel

$28.99

$25.40

14%

$26.05

$23.86

9%


December
2021


December
2020


Cash and Cash Equivalents

$7,316


$920


Working Capital

$3,823


($3,456)


Year Ended 2021 to Year Ended 2020

For 2021, oil and gas gross revenues increased $6,877,000 or 56% to $19,128,000. Oil revenues before royalties increased by 51% to $15,978,000 due to a 79% increase in prices between years partially offset by a 16% decrease in production. Natural gas revenues before royalties increased $534,000 or 74% due to a 104% increase in average gas prices partially offset by a 15% decrease in natural gas production. NGL revenue before royalties increased $958,000 or 103% due to a 136% increase in average prices partially offset by a 14% decrease in production.

Average production per day for 2021 decreased 15% from the prior year due to the normal production decline of existing wells.

Production and operating expenses increased by $207,000 due to an increase in production taxes. Production and operating expense per barrel averaged $8.32 per BOE in 2021 compared to $6.54 per BOE in 2020, an increase of 27%. The increase was primarily due to an increase in production taxes of $1.47 per BOE in 2021 due to higher average prices.

Depletion and depreciation expense decreased $1,020,000 due to decreased production and a lower PP&E balance due to the impairment.

The Company completely reversed the $71.9 million PP&E impairment charge that it has recorded in March 2020 due to higher oil prices. The $71.9 impairment reversal was reduced by $1.1 million to reflect the depletion that would have been recorded if the PP&E was never impaired for a net impairment reversal amount of $70.8 million.

G&A expenses decreased $162,000, or 6%, in 2021 compared to 2020. The decrease is due to management’s continued efforts to reduce G&A costs throughout the Company partially offset by higher advisor fees at the beginning of the year.

Finance income decreased $3,542,000 in 2021 compared to the prior year due to realized and unrealized gains on commodity contracts that were recorded in 2020.

Finance expense increased $4,760,000 due to realized and unrealized losses on commodity contracts in 2021 partially offset by lower interest expense.

FOURTH QUARTER HIGHLIGHTS:

  • Net income in the fourth quarter of 2021 was $72.3 million, compared to net loss of $1.8 million in the fourth quarter of 2020, due to the impairment reversal of $70.8 million for the year ended December 31, 2021.
  • Revenue, net of royalties, was $4.3 million for the fourth quarter of 2021, an increase of 70% compared to the fourth quarter 2020 due to higher average prices partially offset by lower production.
  • Adjusted funds flow was $1.9 million in the fourth quarter of 2021 compared to $1.8 million in the prior year fourth quarter.
  • Netback from operations increased to $40.88 per BOE in the fourth quarter of 2021 compared to $18.38 per BOE in the fourth quarter of 2020, an increase of 123%. Netback including the impact of commodity contracts for the fourth quarter of 2021 was $28.99 per BOE, an increase of 14% from the prior year. The 2021 increase compared to the prior year quarter was due to the increase in average prices partially offset by higher production taxes.
  • Interest expense decreased by 22% in the fourth quarter of 2021 due to principal payments on the credit facility which reduced the outstanding loan balance and lower interest rates.
  • Average production for the fourth quarter of 2021 was 931 BOEPD, a decrease of 14% compared to the prior year fourth quarter due to the normal decline of existing wells.
  • G&A expense decreased by over 20% in the fourth quarter of 2021 due to due to management’s continued efforts to reduce G&A costs throughout the Company.
  • Operating expense per barrel averaged $8.79 per BOE in the fourth quarter of 2021 compared to $6.84 per BOE in the prior year quarter, an increase of 28%. The increase was primarily due to an increase in production taxes in 2021 due to higher average prices.
  • The Company performed an impairment reversal test at December 31, 2021 and reversed the entire impairment expense of $71.9 million that was recorded in March 2020. The $71.9 impairment reversal was lower than the original impairment by $1.1 million to reflect the depletion that would have been recorded if the PP&E was never impaired for a net impairment reversal amount of $70.8 million.

Fourth Quarter 2021 to Fourth Quarter 2020

Gross oil and gas revenues totaled $5,444,000 in the fourth quarter of 2021 versus $3,205,000 in the fourth quarter of 2020, an increase of 70%. Oil revenues were $4,450,000 in the fourth quarter of 2021 versus $2,735,000 in the fourth quarter of 2020, an increase of 63%, due to increase in average prices partially offset by decreased production. Natural gas revenues increased 95% due to an increase in average prices partially offset by a decrease in production. NGL revenue increased 125% to $577,000 due to higher average NGL prices partially offset by lower production.

Operating expenses increased by $72,000 in the fourth quarter of 2021 compared to 2020 due to higher production taxes.

G&A expenses decreased by $155,000, or 20%, between quarters due to management’s continued efforts to reduce G&A costs throughout the Company.

Finance income decreased by $185,000 in the fourth quarter of 2021 compared to the prior year fourth quarter due to realized gains on commodity contracts in 2020.

Finance expense decreased $602,000 due to unrealized losses on commodity contracts in 2020 and lower fourth quarter 2021 interest expense compared to the prior year fourth quarter.

KOLIBRI GLOBAL ENERGY INC.

CONDENSED CONSOLIDATED STATEMENTS OF FINANCIAL POSITION

(Unaudited, Expressed in Thousands of United States Dollars)


December 31,


December 31,


2021


2020

Current assets


Cash and cash equivalents

$

7,316

$

920


Trade and other receivables


1,999


1,607


Deposits and prepaid expenses


587


575


9,902


3,102


Non-current assets


Property, plant and equipment


147,076


78,979


Right of use assets


38


103


Total assets

$

157,016

$

82,184


Current liabilities


Trade and other payables

$

3,145

$

4,371


Current portion of loans and borrowings


1,000


2,084


Current lease payable


43


66


Fair value of commodity contracts


1,891


37


6,079


6,558


Non-current liabilities


Loans and borrowings


15,866


18,665


Asset retirement obligations


1,398


1,269


Lease payable


-


44


Fair value of commodity contracts


585


-


17,849


19,978


Equity


Share capital


296,060


289,622


Contributed surplus


22,948


22,948


Deficit


(185,920)


(256,922)

Total equity


133,088


55,648


Total equity and liabilities

$

157,016

$

82,184


KOLIBRI GLOBAL ENERGY INC.

CONDENSED CONSOLIDATED STATEMENTS OF OPERATIONS AND COMPREHENSIVE LOSS

(Unaudited, expressed in Thousands of United States dollars, except per share amounts)


Three months ended

December 31


Year ended

December 31


2021


2020


2021


2020

Revenue:


Oil and natural gas revenue, net

$

4,255


$

2,510


$

14,972


$

9,580


Other income


-


-


2


2


4,255


2,510


14,974


9,582


Expenses:


Production and operating


753


681


2,962


2,755


Depletion and depreciation


915


988


3,594


4,614


General and administrative


622


777


2,697


2,859


Share based compensation


-


-


-


21


Impairment (impairment reversal) of PP&E


(70,820

)


-


(70,820

)


71,923


Gain on forgiven loans


(280

)


-


(583

)


-


(68,810)


2,446


(62,150

)


82,172


Finance income


514


699


-


3,542


Finance expense


(1,239

)


(1,841

)


(6,122

)


(1,362

)


Net income (loss) and comprehensive income (loss)

$

72,340

$

(1,078

) $

71,002

$

(70,410)


Net income (loss) per share


Basic and Diluted

$

0.31


$

(0.00

)

$

0.30


$

(0.30

)

KOLIBRI GLOBAL ENERGY INC.

FOURTH QUARTER AND YEAR ENDED 2021

(Unaudited, expressed in Thousands of United States dollars, except as noted)


4th Quarter


Year Ended Dec. 31


2021

2020


2021


2020


Oil revenue before royalties

$

4,450


2,735


15,978


10,593


Gas revenue before royalties


417


214


1,259


725


NGL revenue before royalties


577


256


1,891


933


5,444


3,205


19,128


12,251


Adjusted funds flow


1,859


1,750


6,569


7,196


Additions (adjustments) to PP&E


559


43


696


(16

)


Statistics:


4th Quarter

Year Ended Dec. 31


2021


2020


2021


2020


Average oil production (Bopd)


638


735


662


785


Average natural gas production (mcf/d)


825


924


864


1,013


Average NGL production (Boepd)


153


193


169


197


Average production (Boepd)


931


1,082


975


1,151


Average oil price ($/bbl)


$

75.80


$

40.42

$

66.08


$

36.85


Average natural gas price ($/mcf)


$

5.49


$

2.52

$

3.99


$

1.96


Average NGL price ($/bbl)


$

40.56


$

14.39

$

30.59


$

12.94


Average price per barrel


$

63.56


$

32.19

$

53.75


$

29.08


Royalties per barrel


13.89


6.97


11.68


6.34


Operating expenses per barrel


8.79


6.84


8.32


6.54


Netback from operations


$

40.88


$

18.38

$

33.75


$

16.20


Price adjustment from commodity contracts (Boe)


(11.89

)


7.02


(7.70

)


7.66


Netback including commodity contracts (Boe)


28.99


25.40


26.05


23.86


The information outlined above is extracted from and should be read in conjunction with the Company's audited financial statements for the year ended December 31, 2021 and the related management's discussion and analysis thereof, copies of which are available under the Company's profile at www.sedar.com.

NON-GAAP MEASURES

Netback from operations, netback including commodity contracts and adjusted funds flow (collectively, the "Company’s Non-GAAP Measures") are not measures or ratios recognized under Canadian generally accepted accounting principles ("GAAP") and do not have any standardized meanings prescribed by IFRS. Management of the Company believes that such measures and ratios are relevant for evaluating returns on each of the Company's projects as well as the performance of the enterprise as a whole. The Company's Non-GAAP Measures may differ from similar computations as reported by other similar organizations and, accordingly, may not be comparable to similar non-GAAP measures and ratios as reported by such organizations. The Company’s Non-GAAP Measures should not be construed as alternatives to net income, cash flows related to operating activities, working capital or other financial measures and ratios determined in accordance with IFRS, as an indicator of the Company's performance.

An explanation of how the Company’s Non-GAAP Measures provide useful information to an investor and the purposes for which the Company’s management uses the Non-GAAP Measures is set out in the management's discussion and analysis under the heading “Non-GAAP Measures” which is available under the Company's profile at www.sedar.com and is incorporated by reference into this earnings release.

The following is the reconciliation of the non-GAAP ratio netback from operations to net income (loss) from continuing operations, which the Company considers to be the most directly comparable financial measure that is disclosed in the Company’s financial statements:

(US $000)

Year ended December 31,

2021

2020

Net earnings (loss) from continuing operations

71,002

(70,410)


Adjustments:

Finance income

-

(3,542)

Finance expense

6,122

1,362

Stock based compensation

-

21

General and administrative expenses

2,697

2,859

Impairment (impairment reversal) of property, plant and equipment

(70,820)

71,923

Depletion, depreciation and amortization

3,594

4,614

Other income

(583)

(2)

Operating netback

12,012

6,825


Netback from operations

$33.75

$16.20

The following is the reconciliation of the non-GAAP measure adjusted funds flow to the comparable financial measures disclosed in the Company’s financial statements:

(US $000)

Year ended December 31,

2021

2020

Cash flow from continuing operations

6,303

6,111

Change in non-cash working capital

(551)

(128)

Interest expense(a)

817

1,213

Adjusted funds flow

6,569

7,196

(a)

Interest expense on long-term debt excluding the amortization of debt issuance costs

CAUTIONARY STATEMENTS

In this news release and the Company’s other public disclosure:

(a)

The Company's natural gas production is reported in thousands of cubic feet ("Mcfs"). The Company also uses references to barrels ("Bbls") and barrels of oil equivalent ("Boes") to reflect natural gas liquids and oil production and sales. Boes may be misleading, particularly if used in isolation. A Boe conversion ratio of 6 Mcf:1 Bbl is based on an energy equivalency conversion method primarily applicable at the burner tip and does not represent a value equivalency at the wellhead. Given that the value ratio based on the current price of crude oil as compared to natural gas is significantly different from the energy equivalency of 6:1, utilizing a conversion on a 6:1 basis may be misleading as an indication of value.

(b)

Discounted and undiscounted net present value of future net revenues attributable to reserves do not represent fair market value.

(c)

Possible reserves are those additional reserves that are less certain to be recovered than probable reserves. There is a 10% probability that the quantities actually recovered will equal or exceed the sum of proved plus probable plus possible reserves.

(d)

The Company discloses peak and 30-day initial production rates and other short-term production rates. Readers are cautioned that such production rates are preliminary in nature and are not necessarily indicative of long-term performance or of ultimate recovery.

Readers are referred to the full description of the results of the Company's December 31, 2021 independent reserves evaluation and other oil and gas information contained in its Form 51-101F1 Statement of Reserves Data and Other Oil and Gas Information for the year ended December 31, 2021, which the Company filed on SEDAR on March 7, 2022.

Caution Regarding Forward-Looking Information

This release contains forward-looking information including estimates of reserves, the proposed timing and expected results of exploratory and development work including fracture stimulation and production from the Company's Tishomingo field, Oklahoma acreage, the future performance of wells including following shut-in’s and restart of well(s), the expected effects of cost reduction efforts, availability of funds from the Company’s reserves based loan facility and the expected increase to the Company’s borrowing base of $2.0 million in the second quarter of 2022, and the Company’s strategy and objectives. The use of any of the words “target”, “plans”, "anticipate", "continue", "estimate", "expect", "may", "will", "project", "should", "believe", “intend” and similar expressions are intended to identify forward-looking statements.

Such forward-looking information is based on management’s expectations and assumptions, including that the Company's geologic and reservoir models and analysis will be validated, that indications of early results are reasonably accurate predictors of the prospectiveness of the shale intervals, that previous exploration results are indicative of future results and success, that expected production from future wells can be achieved as modeled, declines will match the modeling, future well production rates will be improved over existing wells, that rates of return as modeled can be achieved, that recoveries are consistent with management’s expectations, that additional wells are actually drilled and completed, that design and performance improvements will reduce development time and expense and improve productivity, that discoveries will prove to be economic, that anticipated results and estimated costs will be consistent with managements’ expectations, that all required permits and approvals and the necessary labor and equipment will be obtained, provided or available, as applicable, on terms that are acceptable to the Company, when required, that no unforeseen delays, unexpected geological or other effects, equipment failures, permitting delays or labor or contract disputes are encountered, that the development plans of the Company and its co-venturers will not change, that the demand for oil and gas will be sustained, that the price of oil will be sustained or increase, that the Company will continue to be able to access sufficient capital through financings, credit facilities, farm-ins or other participation arrangements to maintain its projects, that the Company will continue in compliance with the covenants under its reserves-based loan facility and that the borrowing base will not be reduced and will be increased in the second quarter of 2022, that the Company will not be adversely affected by changing government policies and regulations, social instability or other political, economic or diplomatic developments in the countries in which it operates and that global economic conditions will not deteriorate in a manner that has an adverse impact on the Company's business and its ability to advance its business strategy.


Contacts

Wolf E. Regener, President and Chief Executive Officer +1 (805) 484-3613
Email: This email address is being protected from spambots. You need JavaScript enabled to view it.
Website: www.kolibrienergy.com


Read full story here

Offshore Source Logo

Offshore Source keeps you updated with relevant information concerning the Offshore Energy Sector.

Any views or opinions represented on this website belong solely to the author and do not represent those of the people, institutions or organizations that Offshore Source or collaborators may or may not have been associated with in a professional or personal capacity, unless explicitly stated.

Corporate Offices

Technology Systems Corporation
8502 SW Kansas Ave
Stuart, FL 34997

info@tscpublishing.com