Business Wire News

TORONTO--(BUSINESS WIRE)--Superior Plus Corp. (“Superior”) (TSX:SPB):


March 2022 Cash Dividend - $0.06 per share

Superior Plus Corp. (“Superior”) today announced its cash dividend for the month of March 2022 of $0.06 per share payable on April 18, 2022. The record date is March 31, 2022 and the ex-dividend date will be March 30, 2022. Superior’s annualized cash dividend rate is currently $0.72 per share. This dividend is an eligible dividend for Canadian income tax purposes.

About the Corporation

Superior is a leading North American distributor and marketer of propane and distillates and related products and services, servicing approximately 890,000 customer locations in the U.S. and Canada.

For further information about Superior, please visit Superior’s website at: www.superiorplus.com or contact: Beth Summers, Executive Vice President and Chief Financial Officer, Tel: (416) 340-6015, or Rob Dorran, Vice President, Capital Markets, Tel: (416) 340-6003, E-mail: This email address is being protected from spambots. You need JavaScript enabled to view it., Toll Free: 1-866-490-PLUS (7587).

Forward Looking Information

This news release contains certain forward-looking information and statements that are based on Superior’s current expectations, estimates, projections and assumptions in light of its experience and its perception of historical trends. In this news release, such forward-looking information and statements can be identified by terminology such as “will”, "expects", "annualized", and similar expressions.

In particular, this news release contains forward-looking statements and information relating to: future dividends which may be declared on Superior’s common shares, the dividend payment, the tax treatment thereof, and the receipt of cash dividends. These forward-looking statements are being made by Superior based on certain assumptions that Superior has made in respect thereof as at the date of this news release, regarding, among other things: the success of Superior’s operations; prevailing commodity prices, margins, volumes and exchange rates; that Superior’s future results of operations will be consistent with past performance and management expectations in relation thereto; the continued availability of capital at attractive prices to fund future capital requirements; future operating costs; that any required commercial agreements can be reached; that all required regulatory and environmental approvals can be obtained on the necessary terms in a timely manner. These forward-looking statements are not guarantees of future performance and are subject to a number of known and unknown risks and uncertainties, including, but not limited to: the regulatory environment and decisions; non-performance of agreements in accordance with their terms; the impact of competitive entities and pricing; reliance on key industry partners and agreements; actions by governmental or regulatory authorities including changes in tax laws and treatment, or increased environmental regulation; adverse general economic and market conditions in Canada, North America and elsewhere; fluctuations in operating results; labour and material shortages; and certain other risks detailed from time to time in Superior’s public disclosure documents including, among other things, those detailed under the heading "Risk Factors" in Superior’s management's discussion and analysis and annual information form for the year ended December 31, 2021, which can be found at www.sedar.com.

Accordingly, readers are cautioned that events or circumstances could cause results to differ materially from those predicted, forecasted or projected. Such forward-looking statements are expressly qualified by the above statements. Superior does not undertake any obligation to publicly update or revise any forward looking statements or information contained herein, except as required by applicable laws.


Contacts

Beth Summers
Executive Vice President and Chief Financial Officer
Tel: (416) 340-6015
or
Rob Dorran
Vice President, Capital Markets
Tel: (416) 340-6003
E-mail: This email address is being protected from spambots. You need JavaScript enabled to view it.
Toll Free: 1-866-490-PLUS (7587).

Wallbox will demonstrate its award-winning Pulsar Plus and Supernova fast charger for auto dealers at Booth #6343N and at NADA’s EV Solutions Center

MOUNTAIN VIEW, Calif.--(BUSINESS WIRE)--Wallbox N.V. (NYSE: WBX), a leading provider of electric vehicle (EV) charging and energy management solutions worldwide, announced it is exhibiting at the National Automobile Dealers Association (NADA) Show in Las Vegas to showcase Pulsar Plus, the company’s award-winning and global best-selling home EV charger, and Supernova, a reliable and affordable mid-range charging solution for dealerships and service centers.


“NADA’s spotlight on electric vehicles underscores the excitement that dealers have for this technology,” said Douglas Alfaro, General Manager of Wallbox North America. “The conference offers a great opportunity to connect with dealers and OEMS and show how innovation and design within the charging segment can help drive the transition to EVs.”

Visitors will be able to discover Wallbox’s latest charging and energy management solutions for the home, business, and public segments at booth 6364N in the North Hall of the Las Vegas Convention Center. The company intends to offer incentivised packages to dealers interested in selling Pulsar Plus.

In addition to showcasing products at its booth, Wallbox has been invited by NADA to showcase its solutions within The NADA Show EV Solutions Center showcase.

Where: Las Vegas Convention Center, North Hall, Booth 6343N
When: March 11 - 13, 2022, from 8:30 a.m. - 5:00 p.m. PST (show closes at 2:30pm on Sunday, March 13)

About Wallbox:
Wallbox is a global company, dedicated to changing the way the world uses energy in the electric vehicle industry. Wallbox creates smart charging systems that combine innovative technology with outstanding design and manage the communication between vehicle, grid, building and charger. Wallbox offers a complete portfolio of charging and energy management solutions for residential, semi-public and public use in more than 84 countries. Founded in 2015, with headquarters in Barcelona, Wallbox’s mission is to facilitate the adoption of electric vehicles today to make more sustainable use of energy tomorrow. The company employs over 700 people in Europe, Asia, and the Americas.

For additional information, please visit www.wallbox.com.

Forward Looking Statements

This press release includes "forward-looking statements" within the meaning of Section 27A of the Securities Act and Section 21E of the Securities Exchange Act of 1934, as amended. All statements contained in this press release that do not relate to matters of historical fact should be considered forward-looking statements, including, without limitation, statements regarding the expected exhibits in NADA . In some cases, you can identify forward-looking statements by terminology such as "anticipate," "believe," "may," "can," "should," "could," "might," "plan," "possible," "project," "strive," "budget," "forecast," "expect," "intend," "will," "estimate," "predict," "potential," "continue" or the negatives of these terms or variations of them or similar terminology, but the absence of these words does not mean that statement is not forward-looking. Such forward-looking statements are subject to risks, uncertainties, and other factors which could cause actual results to differ materially from those expressed or implied by such forward looking statements. In addition, any statements or information that refer to expectations, beliefs, plans, projections, objectives, performance or other characterizations of future events or circumstances, including any underlying assumptions, are forward-looking.

These forward-looking statements are based on management’s current expectations and beliefs. These statements are neither promises nor guarantees, but involve known and unknown risks, uncertainties and other important factors that may cause Wallbox’s actual results, performance or achievements to be materially different from any future results, performance or achievements expressed or implied by the forward-looking statements, including, but not limited to the factors discussed under the caption "Risk Factors" in Wallbox’s final prospectus on Form 424(b)(3) filed with the SEC on November 12, 2021, as such factors may be updated from time to time in its other filings with the SEC, accessible on the SEC’s website at www.sec.gov and the Investors Relations section of Wallbox’s website at investors.wallbox.com.

These and other important factors could cause actual results to differ materially from those indicated by the forward-looking statements made in this press release. Any forward-looking statement that Wallbox makes in this press release speaks only as of the date of such statement. Except as required by law, Wallbox disclaims any obligation to update or revise, or to publicly announce any update or revision to, any of the forward-looking statements, whether as a result of new information, future events or otherwise.


Contacts

Wallbox PR Contact:
Elyce Behrsin
PR Manager Global
This email address is being protected from spambots. You need JavaScript enabled to view it.

LEMONT, Ill.--(BUSINESS WIRE)--The U.S. Department of Energy (DOE) recently announced $35 million in funding for diverse small businesses to pursue clean energy, climate and other scientific solutions. These Small Business Innovation Research (SBIR) and Small Business Technology Transfer (STTR) awards aim to transform DOE-supported science and technology breakthroughs into viable products and services.


Researchers at DOE's Argonne National Laboratory will contribute to three SBIR/STTR projects. The projects will draw upon Argonne's many strengths in artificial intelligence (AI) and machine learning (ML), as well as quantum information science. Each project will receive approximately $200K for six months to a year.

In one project, a team led by Argonne nanoscientist Maria Chan will be working with VISIMO (Coraopolis, PA) to develop data management software based on AI and ML. This software will use AI and ML to automatically label and organize microscopy images, such as those from DOE's Nanoscale Science Research Centers. Such automation will allow researchers to more easily make discoveries such as new or improved catalysts and batteries for sustainable energy production and storage.

For the second project, a team led by Argonne scientist Subramanian Sankaranarayanan will be working with Sentient Science Corp. (West Lafayette, IN) on another software package that leverages AI and ML. Their software will accelerate the development of new models for studying the properties of materials that can be applied to solving industrial problems, such as predicting the short- and long-term failure rates of mechanical systems, like wind turbines, rotorcraft and rail transport.

For the third project, Argonne scientist F. Joseph Heremans is teaming up with Adamas Nanotechnologies (Raleigh, NC) and the City College of New York to develop a method for commercial production of a key quantum material for new sensors. This material is diamond that has been engineered with defects in the crystal structure to exploit their quantum properties. At present, the absence of commercial production of the core “quantum diamond” material hinders the field. Quantum probes with such defects could leapfrog current sensing technology and find applications in physics, chemistry and medicine.

“The DOE SBIR and STTR are powerful programs to engage small businesses in stimulating innovation for the U.S. economy,” said Megan Clifford, Associate Laboratory Director for Science & Technology Partnerships and Outreach at Argonne. "Argonne is excited to partner with small businesses to expand our impact and support technology transfer."


Contacts

Christopher J. Kramer
Head of Media Relations
Argonne National Laboratory
This email address is being protected from spambots. You need JavaScript enabled to view it.
Office: 630.252.5580

MIAMI--(BUSINESS WIRE)--Intradeco Holdings is investing over $100 million in Central America to make the most of the CAFTA-DR and nearshoring opportunities, advance full circularity, and expand solar power with three major projects, it was announced today.

The first project is the Central American Spinning Works, a state-of-the-art ring spinning mill in Honduras, which began operations earlier this year.

The second project is the creation of a manufacturing plant in El Salvador that manufactures 100% recycled yarns -- both cotton and synthetics. This will allow the company to advance in its full circularity textile supply chain strategy.

The third project will allow the company to expand its solar energy power to attain 30 megawatts by the third quarter of 2022.

In making today’s announcement, Felix Siman, Intradeco Chairman said, “Today’s announcement is consistent with our 40 years of innovation and service which comes with being an integral part of the textile, apparel, and retail industries. With our comprehensive distribution channels and state-of-the-art supply chain, we can reach our customers in an efficient and cost-effective manner in the shortest time possible.”

“Intradeco is a founding member in Think HUGE (Honduras, USA, Guatemala, El Salvador) Business and Investment Council. Through these investments, our company is helping to create more than 1,000 jobs in Central America, while contributing to the region´s environmental sustainability objectives,” Mr. Siman concluded.

About Intradeco Holdings

With 40 years in the textile industry, Intradeco is a global vertical-manufacturing company supplying high-quality casual clothing and thermal underwear to major retailers in the United States, Mexico, and Canada. With state-of-the-art manufacturing facilities, pioneering logistics best practices, and merchandising trends, Intradeco is committed to sustainability which has earned the company recognition from multiple partners and retailers.

Intradeco embraces its social responsibility through its commitment to the community by supporting different charities and foundations around the globe.


Contacts

Melissa M. Krantz
Krantz and Company
917-653-6716
This email address is being protected from spambots. You need JavaScript enabled to view it.

ANAHEIM, Calif.--(BUSINESS WIRE)--$WLDN--Willdan Group, Inc. (Nasdaq: WLDN) announced today that it has been awarded a two-and-a-half year contract by National Grid to implement a new energy efficiency program for low- to moderate-income (LMI) customers. This program will focus on comprehensive, gas-saving improvements across multiple building systems and will leverage a local Trade Ally network to sell and install energy projects. Program incentives will help cover the costs of gas-saving projects for eligible multifamily gas customers in National Grid’s downstate service territory, which consists of Brooklyn, Queens, Staten Island, and Long Island.


This program is the first of its kind for National Grid and is part of an innovative, larger statewide effort to provide a more holistic and coordinated approach to energy efficiency for New York LMI customers. This approach, called the Statewide Low- and Moderate-Income Portfolio Implementation Plan, aims to increase energy affordability, improve access to energy efficiency, and reduce fossil fuel combustion. This new program will contribute to achieving New York State’s goal of directing at least 35% of the overall benefits from clean energy programs to help disadvantaged communities, as set forth by the Climate Leadership and Community Protection Act.

“We are honored to support New York’s ambitious climate and equity goals,” said Tom Brisbin, Willdan’s CEO and Chairman. “This contract expands our reach in New York to include National Grid multifamily customers and will leverage our national experience implementing energy efficiency projects for multifamily properties and serving customers in disadvantaged communities.”

About National Grid

National Grid (NYSE: NGG) is an electricity, natural gas, and clean energy delivery company serving more than 20 million people through our networks in New York, Massachusetts, and Rhode Island. National Grid is transforming our electricity and natural gas networks with smarter, cleaner, and more resilient energy solutions to meet the goal of reducing greenhouse gas emissions. For more information, please visit National Grid’s website, follow them on LinkedIn or Twitter, watch them on YouTube, friend them on Facebook, and find their photos on Instagram.

About Willdan

Willdan is a nationwide provider of professional, technical and consulting services to utilities, government agencies, and private industry. Willdan’s service offerings span a broad set of complementary disciplines that include electric grid solutions, energy efficiency and sustainability, engineering and planning, and municipal financial consulting. For additional information, visit Willdan's website at www.willdan.com. Follow Willdan on LinkedIn, Facebook, and Twitter.

Forward-Looking Statements

Statements in this press release that are not purely historical are forward-looking statements within the meaning of the Private Securities Litigation Reform Act of 1995. It is important to note that Willdan’s actual results could differ materially from those in any such forward-looking statements. Factors that could cause actual results to differ materially include, but are not limited to, the risk factors listed from time to time in Willdan’s reports filed with the Securities and Exchange Commission, including, but not limited to, the Annual Report on Form 10-K filed for the year ended January 1, 2021. Willdan cautions investors not to place undue reliance on the forward-looking statements contained in this press release. Willdan disclaims any obligation to, and does not undertake to, update or revise any forward-looking statements in this press release.


Contacts

Al Kaschalk
VP Investor Relations
310-922-5643
This email address is being protected from spambots. You need JavaScript enabled to view it.

VANCOUVER, British Columbia--(BUSINESS WIRE)--$LPEN--Following on from the recent webinar, Loop Energy™ (TSX: LPEN) announces it plans to report consolidated financial results for the fourth quarter and full year 2021 after market close on Wednesday, March 23, 2022. Loop will host a conference call on Thursday, March 24 at 8:00 am PT (11:00 am ET) to discuss the company’s financial results for the fourth quarter and full year 2021 and the successful delivery of its 2021 objectives.


Please dial-in by phone 5 to 10 minutes prior to the start time and ask to join the Loop Energy call:

  • Toll Free Dial-In Number: +1 (888) 330-2057
  • International Dial-In Number: +1 (646) 960-0203
  • Conference ID: 5946836

The Company’s past financial results are available at investors.loopenergy.com.

About Loop Energy Inc.

Loop Energy is a leading designer and manufacturer of fuel cell systems targeted for the electrification of commercial vehicles, including light commercial vehicles, transit buses and medium and heavy-duty trucks. Loop’s products feature the Company’s proprietary eFlow™ technology in the fuel cell stack’s bipolar plates. eFlow™ is designed to enable commercial customers to achieve performance maximization and cost minimization. Loop works with OEMs and major vehicle sub-system suppliers to enable the production of hydrogen fuel cell electric vehicles. For more information about how Loop is driving towards a zero-emissions future, visit www.loopenergy.com.


Contacts

Investor Inquiries:
Bill Zhang | Tel: +1 604.222.3400 Ext. 299 | This email address is being protected from spambots. You need JavaScript enabled to view it.
Laine Yonker | Tel: +1 646.653.7035 | This email address is being protected from spambots. You need JavaScript enabled to view it.

Media Inquiries:
Lucas Schmidt | Tel: +1.604.222.3400 Ext. 603 | This email address is being protected from spambots. You need JavaScript enabled to view it.

HOUSTON--(BUSINESS WIRE)--Falcon Minerals Corporation (“Falcon,” or the “Company,” “we,” “our,”) (NASDAQ: FLMN, FLMNW), a leading oil and gas minerals company, today announces financial and operating results for the fourth quarter and full year ending December 31, 2021.


Falcon Highlights

  • Net production of 4,067 barrels of oil equivalent per day (“Boe/d”) for the fourth quarter 2021 and 4,438 Boe/d for the full year 2021
  • 48 gross wells (0.30 net) turned in line during the fourth quarter 2021 and 225 gross wells (2.35 net) turned in line for the full year 2021
  • 126 gross line-of-sight wells (1.39 net) permitted and in active development as of March 3, 2022 on the Company’s Eagle Ford position
  • Received $0.8 million of lease bonus revenue in the Marcellus Shale during the fourth quarter 2021
  • Fourth quarter 2021 net income of $9.3 million and full year 2021 net income of $27.5 million (1)
  • Adjusted EBITDA of $13.7 million for the fourth quarter 2021, excluding $2.2 million of expenses associated with the announced transaction with Desert Peak Minerals (“Desert Peak”) ($11.6 million inclusive of all transaction expenses) (2)
  • Adjusted EBITDA of $51.7 million for full year 2021(3)
  • Pro-forma Free Cash Flow of $13.0 million in the fourth quarter 2021, excluding $2.2 million of expenses associated with the announced Desert Peak transaction ($10.9 million of Pro-forma Free Cash Flow inclusive of transaction expenses) (2)
  • Fourth quarter 2021 dividend of $0.145 per share declared on February 17, 2022
  • Dividend paid on March 9, 2022 to all shareholders of record as of February 28, 2022
  • Falcon announced on January 12, 2022 that the Company had entered into a definitive agreement to combine in an all-stock transaction with Desert Peak; it is anticipated that the transaction will close in the second quarter 2022

(1)


Net income shown above includes amounts attributable to non-controlling interests.

(2) 


Please refer to the disclosure on pages 8-9 for a reconciliation of the identified non-GAAP measures to net income, the most comparable financial measure prepared in accordance with GAAP.

(3)


Excludes expenses associated with the announced Desert Peak transaction and executive leadership transition ($47.9 million of Adjusted EBITDA inclusive of expenses associated with the announced Desert Peak transaction and executive leadership transition).  

Management Commentary

Bryan C. Gunderson, President and Chief Executive Officer of Falcon Minerals commented, “We are pleased with the way Falcon ended 2021, with Pro-forma Free Cash Flow per share above our guidance range. We are also excited about the way we entered 2022 by delivering on our core strategic objective to add scale and diversity without sacrificing asset quality or Free Cash Flow on a per share basis.” Mr. Gunderson continued, “Falcon’s previously announced fourth quarter dividend of $0.145 per share allows Falcon’s shareholders to participate in the strong macro environment for commodities as we work to finalize the transformational combination with Desert Peak. Following the closing of the Desert Peak transaction, we believe that Falcon will be positioned extremely well, as the combined company will benefit from owning best-in-class assets in the most active U.S. basins, a strong balance sheet, and a supportive commodity backdrop.”

Matthew B. Ockwood, Falcon’s Chief Financial Officer added, “Falcon’s assets performed well during the fourth quarter. Adjusted Pro-forma Free Cash Flow per share of $0.15 exceeded our guidance range of $0.13 - $0.14 per share, allowing Falcon to declare a quarterly dividend of $0.145 per share, which represents a payout ratio of 97%. Falcon entered 2022 with no oil hedges in place and is currently benefitting from our asset quality and favorable proximity to markets in Texas.” Mr. Ockwood continued, “The Marcellus Shale asset portfolio again contributed meaningfully to quarterly results both in production and in new lease bonus revenue. We expect this trend to continue into early 2022, as activity in the Marcellus continues at a robust pace.”

Financial Results

Falcon realized prices of $76.51 per barrel (“bbl”) for crude oil, $4.68 per thousand cubic feet (“mcf”) for natural gas and $38.54/bbl for natural gas liquids (“NGL”) during the fourth quarter 2021.

Falcon reported net income of $9.3 million, or $0.11 of net income per Class A common share, for the fourth quarter 2021, which includes amounts attributable to non-controlling interests. Falcon generated royalty revenue of $18.6 million (approximately 64% oil) and lease bonus revenue of $0.8 million for the fourth quarter 2021. The Company reported Adjusted EBITDA (a non-GAAP measure defined and reconciled on pages 8-9) of $11.6 million for the fourth quarter 2021, or $13.7 million excluding the transaction expenses associated with the Desert Peak merger incurred during the fourth quarter 2021.

Cash operating costs consisting of production and ad valorem taxes and marketing and transportation expenses for the fourth quarter 2021 were $1.4 million, or $3.67/Boe on a combined basis. General and administrative expense for the third quarter 2021, excluding non-cash stock-based compensation of $0.4 million and $2.2 million of expenses associated with the Desert Peak transaction, was approximately $2.5 million.

As of December 31, 2021, the Company had $40.0 million of borrowings on its revolving credit facility, and $2.8 million of cash on hand, resulting in net debt of approximately $37.2 million at the end of the quarter. Falcon’s net debt / LTM EBITDA ratio was 0.72x as of December 31, 2021. (4)

(4)


Calculated by dividing the sum of total debt outstanding less cash on hand as of December 31, 2021 by Adjusted EBITDA for the trailing 12-month period. Please refer to the disclosure on pages 8-9 for the Reconciliation of net income to Non-GAAP Measures.

Fourth Quarter 2021 Dividend

Falcon’s Board of Directors declared a dividend of $0.145 per Class A share for the fourth quarter 2021 on February 17, 2022. During the fourth quarter 2021, the Company generated Pro-forma Free Cash Flow of $13.0 million, or $0.15 per share excluding expenses associated with the Desert Peak transaction. Inclusive of expenses associated with the Desert Peak transaction, Falcon generated Pro-forma Free Cash Flow of $10.9 million, or $0.13 per share (5) (as described and reconciled on page 8-9). The dividend for the fourth quarter 2021 was paid on March 9, 2022 to all Class A shareholders of record on February 28, 2022.

As a result of this dividend, Falcon has declared and paid $0.55 per share in dividends over the trailing 365-day period, resulting in an adjustment to the exercise price of the Falcon warrants downward to $11.29 per warrant.

The Company expects that approximately 63% of its 2021 dividends will not constitute taxable dividend income and instead will result in a non-taxable reduction to the tax basis of the shareholders’ common stock. The reduced tax basis will increase a shareholders’ capital gain (or decrease shareholders’ capital loss) when shareholders sell their common stock.

(5)


The pro-forma adjustments assume that the non-controlling interests are converted to Class A common shares, such that approximately 86.9 million Class A shares would be outstanding.  The pro-forma Class A shares reflects dilution from 0.5 million unvested restricted stock awards which receive dividend equivalent rights (“DER”) when dividends are paid to Class A common stockholders.

Operational Results

Falcon’s production averaged 4,067 Boe/d during the fourth quarter 2021, of which approximately 42% was oil and approximately 75% was from the Eagle Ford. Eagle Ford production was approximately 56% oil during the fourth quarter 2021. During the fourth quarter 2021, Falcon’s gas sales volumes reflected a material increase in Marcellus production, which led to lower than anticipated percentage of oil contribution to the total production mix. Falcon expects that this ratio will normalize to an oil mix of 45%-50%. Falcon had 48 gross wells turned in line (0.30 net wells) with an average net royalty interest (“NRI”) of approximately 0.6% during the fourth quarter 2021. Falcon averaged three rigs running on its Eagle Ford position during the fourth quarter 2021.

Falcon currently has 2,328 gross producing Eagle Ford wells, and the Company’s average NRI for all producing wells is approximately 1.25%. As of March 3, 2022 the Company had 126 line-of-sight wells (1.39 net wells) with an average NRI of 1.11% in various stages of development on Falcon’s Eagle Ford minerals position. These wells are comprised of the following:

Line-of-Sight Wells (As of March 3, 2022)

Stage of Activity Gross Wells Net Wells NRI %
Permitted

75

0.95

1.27%

Waiting on completion

44

0.29

0.67%

Waiting on connection

7

0.15

2.13%

Total line-of-sight

126

1.39

1.11%

Reserve Summary for the Year Ended December 31, 2021

As of December 31, 2021, net proved oil and gas reserves were approximately 17.2 million barrels of oil equivalent (MMboe), based on the Securities and Exchange Commission (“SEC”) average net realized price assumptions of $66.56/bbl for oil, $25.96/bbl for NGL, and $3.60/mcf for natural gas. Falcon’s year end 2021 proved reserves were valued at a PV-10 amount of approximately $372 million, and approximately 58% of the Company’s proved reserves were oil and NGLs.

Summary of proved reserves as of December 31, 2021:

Total
Oil (Mbbl) Gas (MMcf) NGLs (Mbbl) MBoe
Proved developed reserves

2,738

19,098

1,183

7,104

Proved undeveloped reserves

5,025

24,339

1,059

10,141

Total proved reserves at December 31, 2021

7,763

43,437

2,242

17,245

Reconciliation of proved reserves for full year 2021:

Total
Oil (Mbbl) Gas (MMcf) NGLs (Mbbl) MBoe
Proved reserves at December 31, 2020

9,742

48,536

2,186

20,017

Purchase of reserves in place

22

34

5

33

Extensions and discoveries

326

1,777

122

744

Reivisions of previous estimates

(1,571)

(3,109)

159

(1,930)

Production

(756)

(3,801)

(230)

(1,620)

Proved reserves at December 31, 2021

7,763

43,437

2,242

17,245

 
Changes in reserves net of production

(1,223)

(1,298)

286

(1,153)

About Falcon Minerals

Falcon Minerals Corporation (NASDAQ: FLMN, FLMNW) is a C-Corporation formed to own and acquire high growth oil-weighted mineral rights. Falcon Minerals owns mineral, royalty, and over-riding royalty interests covering approximately 256,000 gross unit acres in the Eagle Ford Shale and Austin Chalk in Karnes, DeWitt, and Gonzales Counties in Texas. The Company also owns approximately 95,000 gross unit acres in the Marcellus Shale across Pennsylvania, Ohio, and West Virginia. For more information, visit our website at www.falconminerals.com.

Cautionary Note Regarding Forward-Looking Statements

This document contains forward-looking statements that involve a number of assumptions, risks and uncertainties that could cause actual results to differ materially from those contained in the forward-looking statements. Falcon cautions readers not to place any undue reliance on these forward-looking statements as forward-looking information is not a guarantee of future performance. The words “anticipate,” “believe,” “continue,” “could,” “estimate,” “expect,” “intends,” “may,” “might,” “plan,” “seeks,” “possible,” “potential,” “predict,” “project,” “prospects,” “guidance,” “outlook,” “should,” “would,” “will,” and similar expressions may identify forward-looking statements, but the absence of these words does not mean that a statement is not forward-looking. Such forward-looking statements include, but are not limited to, statements about future financial and operating results, future dividends paid, the tax treatment of dividends paid, Falcon’s plans, initiatives, objectives, expectations and intentions, the anticipated impact and timing of the proposed Desert Peak transaction, including the combined company’s expected performance, and other statements that are not historical facts. While forward-looking statements are based on assumptions and analyses made by us that we believe to be reasonable under the circumstances, whether actual results and developments will meet our expectations and predictions depend on a number of risks and uncertainties which could cause our actual results, performance, and financial condition to differ materially from our expectations. See “Risk Factors” in Falcon’s Annual Report on Form 10-K for the fiscal year ended December 31, 2020, as amended on Form 10-K/A, and in Falcon’s Quarterly Reports on Form 10-Q, filed with the Securities and Exchange Commission (“SEC”), for a discussion of risk factors that affect our business. Any forward-looking statement made in this news release speaks only as of the date on which it is made. Factors or events that could cause actual results to differ may emerge from time to time, and it is not possible to predict all of them. Neither Desert Peak nor Falcon undertake any obligation to publicly update any forward-looking statement, whether as a result of new information, future development, or otherwise, except as may be required by law.

Additional Information and Where to Find It

In connection with the proposed Desert Peak transaction, the Company has filed with the SEC a proxy statement on Schedule 14A (the “Proxy Statement”) and will file other documents with the SEC regarding the proposed transaction. The Proxy Statement will be sent or given to the Company’s stockholders and will contain important information about the proposed transaction and related matters. INVESTORS ARE URGED TO READ THE PROXY STATEMENT (INCLUDING ALL AMENDMENTS AND SUPPLEMENTS THERETO) AND OTHER RELEVANT DOCUMENTS FILED WITH THE SEC IF AND WHEN THEY BECOME AVAILABLE BECAUSE THEY WILL CONTAIN IMPORTANT INFORMATION. You may obtain a free copy of the Proxy Statement and other relevant documents filed by Falcon with the SEC at the SEC’s website at www.sec.gov. You may also obtain the Company’s documents on its website at www.falconminerals.com. The references to the SEC's website and our website are for the convenience of investors and shall not be deemed to be incorporated into any of the Company’s filings. All website addresses in this prospectus are intended to be inactive textual references only.

Participants in the Solicitation

The Company, Desert Peak and certain of their respective directors, executive officers and employees may be deemed to be participants in the solicitation of proxies in connection with the proposed transaction and may have direct or indirect interests in the proposed transaction. Information about the Company’s directors and executive officers is set forth in the Company’s Proxy Statement on Schedule 14A for its 2021 Annual Meeting of Stockholders, filed with the SEC on April 23, 2021, its Annual Report on Form 10-K for the fiscal year ended December 31, 2020, filed with the SEC on March 12, 2020, as amended on Form 10-K/A, filed with the SEC on May 5, 2021, and its other documents which are filed with the SEC. Other information regarding the participants in the proxy solicitations and a description of their direct and indirect interests, by security holdings or otherwise, is set forth in the Proxy Statement. Other relevant materials will be filed with the SEC regarding the proposed transaction when they become available. Investors should read the Proxy Statement carefully before making any voting or investment decisions. Investors may obtain free copies of these documents using the sources indicated above.

FALCON MINERALS CORPORATION
CONDENSED CONSOLIDATED STATEMENTS OF OPERATIONS
(In thousands, except per share amounts)
(Unaudited)
 
Three Months Ended Year Ended
December 31, December 31,


2021


2020


2021


2020


Revenues:
Oil and gas sales

$

18,642


$

10,234


$

70,868


$

40,081


Lease bonus and other revenue


807


-


1,970


-


Gain (loss) on hedging activities


680


(737

)


(4,830

)


(1,200

)

Total revenue


20,129


9,497


68,008


38,881


Expenses:
Production and ad valorem taxes


950


602


3,935


2,807


Marketing and transportation


423


426


1,752


1,993


Amortization of royalty interests in oil & gas properties


4,151


3,619


15,233


14,103


General, administrative and other


5,066


3,379


14,130


11,997


Total expenses


10,590


8,026


35,050


30,900


Operating income


9,539


1,471


32,958


7,981


Other income (expense):
Change in fair value of warrant liability


1,207


(1,728

)


467


5,128


Other income


13


31


50


125


Interest expense


(473

)


(491

)


(1,924

)


(2,197

)

Total other income (expense)


747


(2,188

)


(1,407

)


3,056


Income (loss) before income taxes


10,286


(717

)


31,551


11,037


Provision for income taxes


1,035


189


4,059


589


Net income (loss)


9,251


(906

)


27,492


10,448


Net income attributable to non-controlling interests


(4,139

)


(470

)


(14,336

)


(2,748

)

Net income (loss) attributable to shareholders

$

5,112


$

(1,376

)

$

13,156


$

7,700


Class A common shares - basic

$

0.11


$

(0.03

)

$

0.28


$

0.17


Class A common shares - diluted

$

0.10


$

(0.03

)

$

0.28


$

0.11


FALCON MINERALS CORPORATION
CONSOLIDATED BALANCE SHEETS
(In thousands)
(Unaudited)
 
December 31, December 31,
ASSETS


2021


2020

Current assets:
Cash and cash equivalents

$

2,768

$

2,724

Accounts receivable


10,018


5,419

Prepaid expenses


1,220


766

Total current assets


14,006


8,909

Royalty interests in oil & gas properties, net of accumulated amortization


193,544


207,505

Property and equipment, net of accumulated depreciation


322


427

Deferred tax asset, net


52,135


55,773

Other assets


1,834


3,015

Total assets

$

261,841

$

275,629

 
LIABILITIES AND SHAREHOLDERS' EQUITY
Current liabilities:
Accounts payable and accrued expenses

$

3,471

$

1,540

Other current liabilities


502


1,557

Total current liabilities


3,973


3,097

Credit facility


40,000


39,800

Warrant liability


3,036


3,503

Other non-current liabilities


576


828

Total liabilities


47,585


47,228

 
Shareholders' equity:
Class A common stock


5


5

Class C common stock


4


4

Additional paid in capital


121,029


121,053

Non-controlling interests


83,586


88,637

Retained earnings


9,632


18,702

Total shareholders' equity


214,256


228,401

Total liabilities and shareholders' equity

$

261,841

$

275,629


Non-GAAP Financial Measures

Adjusted EBITDA and Pro-forma Free Cash Flow are supplemental non-GAAP financial measures used by management and external users of our financial statements, such as industry analysts, investors, lenders, and rating agencies. We believe Adjusted EBITDA and Pro-forma Free Cash Flow are useful because they allow us to evaluate our performance and compare the results of our operations period to period without regard to our financing methods or capital structure. In addition, management uses Adjusted EBITDA and Pro-forma Free Cash Flow to evaluate cash flow available to pay dividends to our common shareholders.

We define Adjusted EBITDA as net income before interest expense, net, depletion and depreciation expense, provision for income taxes, change in fair value of warrant liability, unrealized gains and losses on commodity derivative instruments and non-cash equity-based compensation. We define Pro-forma Free Cash Flow as net income before depletion and depreciation expense, provision for income taxes, change in fair value of warrant liability, unrealized gains and losses on commodity derivative instruments and non-cash equity-based compensation less interest expense and cash income taxes. Adjusted EBITDA and Pro-forma Free Cash Flow are not measures of net income as determined by GAAP. We exclude the items listed above from net income in calculating Adjusted EBITDA and Pro-forma Free Cash Flow because these amounts can vary substantially from company to company within our industry depending upon accounting methods and book values of assets, capital structures and the method by which the assets were acquired. Certain items excluded from Adjusted EBITDA and Pro-forma Free Cash Flow are significant components in understanding and assessing a company’s financial performance, such as a company’s cost of capital and tax structure, as well as historic costs of depreciable assets, none of which are components of Adjusted EBITDA and Pro-forma Free Cash Flow.

Adjusted EBITDA and Pro-forma Free Cash Flow should not be considered an alternative to, or more meaningful than, net income, royalty income, cash flow from operating activities or any other measure of financial performance presented in accordance with GAAP. Our computations of Adjusted EBITDA and Pro-forma Free Cash Flow may not be comparable to other similarly titled measures of other companies.

Reconciliation of Net Income to Adjusted EBITDA and Pro-forma Free Cash Flow

(in thousands, except per share amounts):

Fully Converted
Three Months Per Share Basis
Ended Three Months Ended
December 31, 2021 December 31, 2021 (1)
Net income

$

9,251


$

0.11


Interest expense (2)


473


0.01


Depletion and depreciation


4,177


0.05


Share-based compensation


417


-


Unrealized gain on commodity derivatives


(2,577

)


(0.03

)

Change in fair value of warrant liability


(1,207

)


(0.01

)

Income tax expense


1,035


0.01


Adjusted EBITDA

$

11,569


$

0.14


Interest expense (2)


(473

)


(0.01

)

Pro-forma cash income taxes (3)


(210

)


-


Pro-forma Free Cash Flow

$

10,886


$

0.13


(1)


Per share information is presented on a fully converted basis of 86.9 million common shares which is inclusive of 47.0 million Class A common shares, 39.4 million Class C common shares and 0.5 million unvested restricted stock awards that are outstanding as of December 31, 2021. As such, net income per fully converted share in this schedule is not comparable to net income per share of $0.11 for the period ended December 31, 2021 as shown on the Condensed Consolidated Statements of Operations.

(2)


Interest expense includes amortization of deferred financing costs. 

(3)


Pro-forma cash income taxes are estimated on a pro-rata basis and therefore based upon net income before non-controlling interest considerations. 

Calculation of cash available for dividends for the fourth quarter 2021 (in thousands):

Three Months Ended
December 31,


2021


Adjusted EBITDA

$

11,569


Interest expense (2)


(473

)

Pro-forma cash taxes (3)


(210

)

Net cash available for distribution

$

10,886


Cash to be distributed to non-controlling interests

$

5,806


Cash to be distributed to Falcon Minerals Corp. (4)

$

6,931


Dividends to be paid to Class A shareholders

$

6,817


(2)


Interest expense includes amortization of deferred financing costs.

(3)


Pro-forma cash income taxes are estimated on a pro-rata basis and therefore based upon net income before non-controlling interest considerations. 

(4)


Includes approximately $113k of cash for current income taxes at Falcon Minerals Corporation.

FALCON MINERALS CORPORATION
SELECTED OPERATING DATA
(Unaudited)
 
Three Months Ended Year Ended
December 31, December 31,


2021


2020


2021


2020

Production Data:
Oil (bbls)


155,352


179,219


756,236


835,545

Natural gas (Mcf)


959,920


885,186


3,801,087


3,528,150

Natural gas liquids (bbls)


58,801


59,239


230,093


247,536

Combined volumes (boe)


374,140


385,989


1,619,844


1,671,106

Average daily combined volume (boe/d)


4,067


4,196


4,438


4,566

 
Average sales prices:
Oil (bbls)

$

76.51

$

40.21

$

66.39

$

35.84

Natural gas (mcf)

$

4.68

$

2.42

$

3.59

$

2.01

Natural gas liquids (bbls)

$

38.54

$

14.99

$

30.52

$

12.28

Combined per boe

$

49.83

$

26.52

$

43.75

$

23.98

 
Average costs ($/boe):
Production and ad valorem taxes

$

2.54

$

1.56

$

2.43

$

1.68

Marketing and transportation expense

$

1.13

$

1.10

$

1.08

$

1.19

Cash general and administrative expense

$

12.36

$

6.37

$

8.51

$

5.03

Interest expense, net

$

1.26

$

1.27

$

1.19

$

1.31

Depletion

$

11.09

$

9.37

$

9.40

$

8.44


Contacts

Falcon Minerals Contact:
Matthew B. Ockwood
Chief Financial Officer
This email address is being protected from spambots. You need JavaScript enabled to view it.


Read full story here

A Greentech start-up developing reversible fuel cell technology, Refhuel, has named former Sr. Director of R&D Product Development at StoreDot, Dr. Daniel Szwarcman, CEO of its R&D Centre.


The new business is the result of a partnership between Israeli University Bar-Ilan and Refhuel Limited, a subsidiary of investment company Decama Capital.

LONDON--(BUSINESS WIRE)--Reversible fuel cell company, Refhuel (www.refhuel.com), has announced Dr Daniel Szwarcman as its R&D Centre CEO. He will join the company after nearly a decade working for StoreDot, a developer of extreme fast-charging lithium-ion batteries for electric vehicles, most recently as Sr. Director, R&D Product Development. StoreDot is owned by BP, Daimler, Samsung, and TDK.

Dr Szwarcman has worked with StoreDot since its inception in 2012 after finishing his PhD in Chemistry at Tel-Aviv University. He will bring his extensive knowledge and experience of the energy sector to his new role as CEO of the Refhuel R&D Centre.

Along with Dr Szwarcman, Refhuel is also delighted to be welcoming three new scientists to the research team; Bar Gavriel, Noam Zion and Yan Yurko. They are currently in the final stages of completing their doctorates under the supervision of Professor Lior Elbaz, Co-Founder of Refhuel and Associate Professor in Chemistry at Bar-Ilan University, and are joining the Refhuel team.

The announcement of these appointments comes as Refhuel establishes its own lab at Bar-Ilan University. Just two weeks ago the Bahraini Ambassador to Israel, Khaled Al Jalahma, visited Professor Elbaz and his team at the lab. Ambassador Al Jalahma’s visit was part of his tour of Israel’s growing tech industry and reflects growing international interest in Refhuel.

Refhuel is developing a reversible fuel-cell based on a proprietary hydrogen carrier technology that will enable efficient storage and production of energy.

Dr Daniel Szwarcman, incoming CEO of the Refhuel R&D Centre, said:

“I am very pleased to be joining Refhuel which is at the forefront of transforming fuel cell technology. Refhuel is full of exceptionally talented individuals, and I look forward to leading our exciting work, building on my background in the energy sector. GreenTech is a fast-growing and incredibly important sector, and it gives me great professional and personal satisfaction to know that I am joining a company with a big vision to change the world for the better.”

Nathanel Lorenzi, Co-Founder of Refhuel and CEO of Decama Capital Ltd, said:

“We are delighted to have appointed Dr Szwarcman as CEO of the Refhuel R&D Centre. He brings with him outstanding technical knowledge in energy storage as well as extensive management experience from his work at StoreDot. Alongside the appointment of our three research scientists, we are building the team to carry out our mission. This is an exciting moment for the Refhuel team as we look towards to the company’s future as a world leader in innovative fuel cell technology.”

- ENDS -


Contacts

Integra Group
Mr Zaki Cooper
Email: This email address is being protected from spambots. You need JavaScript enabled to view it.
Phone: +44 (0) 203 921 0310.

  • The project will demonstrate the core end-to-end fuel recycling process using advanced automation techniques and sensor technologies.
  • The primary objectives of the project will be the technical basis for a commercial-scale recycling facility.
  • This work will facilitate the development of a secure and economical domestic fuel supply chain for clean advanced fission power, furthering U.S. energy independence.


SANTA CLARA, Calif.--(BUSINESS WIRE)--#ARPAE--Oklo Inc. has been awarded a $5 million cost-share project in partnership with Argonne National Laboratory (Argonne), Idaho National Laboratory (INL), and Deep Isolation from the U.S. Department of Energy’s (DOE) Advanced Research Projects Agency-Energy (ARPA-E). The project is funded under the ARPA-E Optimizing Nuclear Waste and Advanced Reactor Disposal Systems (ONWARDS) program, the first focused program working to identify transformative pathways to reduce waste material and minimize the need for disposal sites.

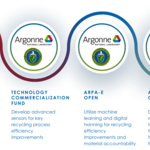
This announcement follows DOE’s Technology Commercialization Fund and ARPA-E OPEN award announcements. Oklo’s selection for three competitive DOE awards for recycling exemplifies Oklo’s leadership in advanced fuel recycling. Together, the projects include process improvements through advanced sensors, advances using machine learning and digital twin modeling, and culminating in this ONWARDS project which will demonstrate the end-to-end recycling process and result in the technical basis for the commercial recycling facility.

“The ONWARDS project will build on our other DOE project work to allow Oklo to build a first-of-a-kind fuel recycling facility,” said Jacob DeWitte, co-founder and CEO of Oklo. The fuel recycling facility will enable Oklo to convert nuclear waste from existing used nuclear fuel into clean energy, as well as to recycle fuel from Oklo’s plants, allowing for a dramatic cost reduction and solving for a key supply chain need.

“A commercial-scale fuel recycling facility will change the economic paradigm for advanced fission,” added DeWitte. These investments in the infrastructure of advanced fission by the DOE will enable a cleaner and more secure energy future for the country.

About Oklo Inc.: Oklo Inc. (Oklo) is a California-based company developing advanced fission power plants to provide emission-free, reliable, and affordable energy. Oklo received a Site Use Permit from the U.S Department of Energy, successful fabrication of fuel prototypes, was awarded fuel material from Idaho National Laboratory, and developed the first advanced fission combined license application accepted and docketed by the U.S. Nuclear Regulatory Commission, and is developing waste-to-energy fuel recycling in collaboration with the U.S. Department of Energy and several national laboratories.


Contacts

Bonita Chester
Director of Marketing and External Relations
Inquiries: This email address is being protected from spambots. You need JavaScript enabled to view it.

ST. CATHARINES, Ontario--(BUSINESS WIRE)--#yourmarinecarrierofchoice--Algoma Central Corporation (TSX: ALC) and Nova Marine today announced an increased investment in their global short sea shipping joint ventures, NovaAlgoma, by acquiring three cement carriers from KGJ Cement in Northern Europe and two handy-size bulk carriers from Swire Bulk Holdings Pte. Ltd. of Singapore. The vessels will be strong additions to NovaAlgoma’s already diversified vessel portfolio, which includes cement carriers, mini-bulkers and handy-size bulk carriers.


“We carefully consider each opportunity for growth and these vessel purchases fit perfectly into our long-term plan for sustaining a profitable business alongside our partners at Nova Marine,“ said Gregg Ruhl, President and CEO of Algoma Central Corporation. “The three cement carriers will support increasing cement requirements and significant global infrastructure investments. The two handy-size vessels will be part of our active international sales and purchase vessel platform, which has delivered strong returns since 2018,” concluded Mr. Ruhl.

“The cement carriers will supply additional capacity for NovaAlgoma Cement Carriers (“NACC”) and provide tailored and flexible short sea logistics solutions for our customers in this market,” said Vincenzo Romeo, Chief Executive Officer at Nova Marine. “Working together with our partners at Algoma, we continually review market conditions and add incremental investments so we can strategically evolve with fluctuations in industry demand,” added Mr. Romeo.

The first of the three cement vessels, the NACC Providence, previously named the Glory Atlantic, was delivered in early February. The second vessel will follow in early March and the third is expected to be delivered in late June. All three vessels will join the NACC fleet serving a growing list of clients around the world.

The two handy-size bulk carriers, to be named the Sider Athena and the Sider Bear will join the NovaAlgoma Bulk Holdings fleet in late April and will be commercially managed by Nova Marine.

About NovaAlgoma Cement Carriers Limited

NovaAlgoma Cement Carriers (“NACC”), is a joint venture between Nova Marine Holding of Luxembourg and Algoma Central Corporation of Canada that operates specialized pneumatic cement vessels worldwide. Once the above transactions close, NACC will be the largest and most diverse fleet of specialized cement carriers operating globally. The vessels utilize a compressor and pump system to load and unload cement powder; this system is fully enclosed with essentially no discharge to the atmosphere and significantly reduces the carbon intensity of cement transportation versus other modes. Cement shipping operates in regionalized markets in service of large global manufacturers and in support of infrastructure investments.

About NovaAlgoma Bulk Holdings

NovaAlgoma Bulk Holdings is a joint venture between Nova Marine Holding of Luxembourg and Algoma Central Corporation of Canada and operates handy-size bulk carriers worldwide. The vessels are part of a platform that pursues international sales and purchase opportunities in the handy-size market.

About Algoma Central Corporation

Algoma owns and operates the largest fleet of dry and liquid bulk carriers operating on the Great Lakes - St. Lawrence Waterway, including self-unloading dry-bulk carriers, gearless dry-bulk carriers and product tankers. Since 2010 we have introduced 10 new build vessels to our domestic dry-bulk fleet, with one under construction and expected to arrive in 2024, making us the youngest, most efficient and environmentally sustainable fleet on the Great Lakes. Each new vessel reduces carbon emissions on average by 40% versus the ship replaced. Algoma also owns ocean self-unloading dry-bulk vessels operating in international markets and a 50% interest in NovaAlgoma, which owns and operates a diversified portfolio of dry-bulk fleets serving customers internationally. Algoma truly is Your Marine Carrier of Choice™.

About Nova Marine

Nova owns and also operates through its subsidiary Nova Marine Carriers SA, headquartered in Lugano, Switzerland, a varied fleet of modern bulk carriers and belt self-unloading vessels ranging from 5,000 dwt up to 57,000 dwt. With around one hundred ships under control, Nova specializes in bulk traffic in the Mediterranean, Atlantic and Middle East and in Italian/European cabotage. In 2021 Nova Marine Carriers undertook over 2000 voyages and transported around 26 million tonnes of cargo. In 2021 Nova undertook its first carbon neutral voyage, offsetting the CO2 emitted by one of its vessels by voluntarily purchasing carbon credits for a Madagascan solar farm project.


Contacts

Gregg A. Ruhl
President & CEO
Algoma Central Corporation
905-687-7890

J. Wesley Newton
Senior Vice-President, Corporate Development
Algoma Central Corporation
905-687-7836

Vincenzo Romeo
Chief Executive Officer
Nova Marine
41 91 822 73 05

Or visit

www.algonet.com

www.novaalgoma.com

PASADENA, Calif.--(BUSINESS WIRE)--$HLGN #ArtificialIntelligence--Heliogen, Inc. (“Heliogen”) (NYSE: HLGN), a leading provider of AI-enabled concentrated solar energy, today announced that it will release financial and operating results for 2021 after market close on Monday, March 28, 2022. This release will be followed by a conference call for investors at 8:30 AM EDT on March 29. Bill Gross, Founder and Chief Executive Officer of Heliogen, and Christie Obiaya, Chief Financial Officer will host the call.


The conference call may be accessed via a live webcast on a listen-only basis in the Investors section of Heliogen’s website at investors.heliogen.com. The call can also be accessed live via telephone by dialing 877-407-0789 (201-689-8562 for international callers) and referencing Heliogen.

A replay of the webcast will be available shortly after the call on the Investors section of Heliogen’s website.

About Heliogen

Heliogen is a renewable energy technology company focused on eliminating the need for fossil fuels in heavy industry and powering a sustainable future. The company’s AI-enabled, modular concentrated solar technology aims to cost-effectively deliver near 24/7 carbon-free energy in the form of heat, power, or green hydrogen fuel at scale – for the first time in history. Heliogen was created at Idealab, the leading technology incubator founded by Bill Gross in 1996. For more information about Heliogen, please visit Heliogen.com


Contacts

Heliogen Media Contact:
Cory Ziskind
ICR, Inc.
This email address is being protected from spambots. You need JavaScript enabled to view it.

Heliogen Investor Contact
Caldwell Bailey
ICR, Inc.
This email address is being protected from spambots. You need JavaScript enabled to view it.

DUBLIN--(BUSINESS WIRE)--The "Ferrystat Monthly" newsletter has been added to ResearchAndMarkets.com's offering.


Ferrystat is a branded monthly report on the UK ferry market. The twenty-page statistical report is based on monthly returns from the leading passenger ferry operators in the UK. The report provides passenger, car and coach traffic by route by mode of transport with clearly-laid-out tables and illustrative charts.

This definitive monitor of the UK ferry industry tracks the competitive position of all major routes on a monthly basis. The report is available soon after the end of each reporting month.

Ferrystat provides timely information for tactical action to improve sales and to give guidance to suppliers, service providers and financiers on the latest trends in the industry.

Key Topics Covered

  • Latest trends - passengers, cars, coaches and sailings by route & sector (UK - Continent, Domestic, Ireland and Eurotunnel)
  • Annual trends - passengers, cars, coaches and sailings by route & sector
  • UK - Continent passengers, cars, coaches and sailings by route & sector
  • UK - Continent passengers by country of destination - Air & Ferry
  • UK - Ireland passengers, cars, coaches and sailings by route & sector
  • UK - Domestic passenger, cars & coaches by route & sector

For more information about this newsletter visit https://www.researchandmarkets.com/r/v9g0mh


Contacts

ResearchAndMarkets.com
Laura Wood, Senior Press Manager
This email address is being protected from spambots. You need JavaScript enabled to view it.
For E.S.T Office Hours Call 1-917-300-0470
For U.S./CAN Toll Free Call 1-800-526-8630
For GMT Office Hours Call +353-1-416-8900

NEW YORK--(BUSINESS WIRE)--#KBRA--KBRA releases research following Russia’s invasion of Ukraine and its implications to the global oil and gas industry and the exacerbation of inflation in global economies. The effects of sanctions implemented by Western nations in response to Russia’s attack on Ukraine is still ongoing. Political strategy aside, sanctioning one of the largest global producers of oil and gas comes at a cost and market fears have driven a surge in commodity prices.


Key Takeaways

  • Even in the absence of direct sanctions on the Russian oil and gas industry, benchmark prices have risen to record levels over the last several weeks as market participants move to sever ties with the country. KBRA believes that these self-induced sanctions signify that $100-plus/bl crude oil prices are here to stay.
  • While artificially high crude oil prices should induce supply and demand dynamics that push down the price of oil, the imbalance of the missing 5 million barrels per day (bl/d) of Russian crude oil exports cannot be easily replaced over the short term.
  • KBRA believes that producers in the U.S. Permian Basin are well equipped to ameliorate some of the pain from high oil prices given their well economics and shorter rig lead times. Still, increases from Permian producers will take some time to work through the system and would only represent one-fifth of the needed production increase.
  • Without adequate supply increase, higher oil prices are likely to stay, which would lead to demand destruction for petroleum productions over the medium term. High oil prices, which may trigger a slowdown in economic activities, combined with inflationary pressures that are already being felt, may lead to the dreaded stagflation.
  • Nevertheless, over the medium to long term, KBRA still expects supply and demand dynamics to moderate oil prices and push the price of crude oil back below $100/bl.

Click here to view the report.

Related Publications

About KBRA
KBRA is a full-service credit rating agency registered in the U.S., the EU, and the UK, and is designated to provide structured finance ratings in Canada. KBRA’s ratings can be used by investors for regulatory capital purposes in multiple jurisdictions.


Contacts

Shane Olaleye, CFA, Senior Director
+1 (646) 731-2432
This email address is being protected from spambots. You need JavaScript enabled to view it.

Adam Gracely, Associate Director
+1 (646) 731-3329
This email address is being protected from spambots. You need JavaScript enabled to view it.

Rene White, Senior Analyst
+1 (646) 731-2451
This email address is being protected from spambots. You need JavaScript enabled to view it.

Andrew Giudici, Senior Managing Director, Global Head of Corporate, Project, and Infrastructure Finance
+1 (646) 731-2372
This email address is being protected from spambots. You need JavaScript enabled to view it.

Business Development
Jason Lilien
+1 (646) 731-2442
This email address is being protected from spambots. You need JavaScript enabled to view it.

WILMINGTON, Del.--(BUSINESS WIRE)--$CC--The Chemours Company (“Chemours”) (NYSE: CC), a global chemistry company with leading market positions in Titanium Technologies, Thermal & Specialized Solutions, Advanced Performance Materials, and Chemical Solutions, today announced it has suspended business with Russian entities in response to the ongoing military conflict and humanitarian crisis.


Chemours condemns the senseless violence taking place and views continuing business as inconsistent with our company values. As always, we will work to meet the needs of our global customers throughout this process, however, we believe suspending business with Russian entities is the right thing to do,” said Mark Newman, President and CEO for Chemours. "We will continue to monitor the situation closely and reassess in the future.”

Chemours also announced a $100,000 donation to the International Committee of the Red Cross to support humanitarian efforts in the region.

Every day we encourage our people to operate with the courage to make a difference. Over the past two weeks the people of the Ukraine have embodied such courage and perseverance. Now, we want to do our part and help make a difference by supporting those in need,” said Newman.

Chemours has a small office in Moscow and is working closely with employees to ensure their safety.

About The Chemours Company
The Chemours Company (NYSE: CC) is a global leader in Titanium Technologies, Thermal & Specialized Solutions, Advanced Performance Materials, and Chemical Solutions providing its customers with solutions in a wide range of industries with market-defining products, application expertise and chemistry-based innovations. We deliver customized solutions with a wide range of industrial and specialty chemicals products for markets, including coatings, plastics, refrigeration, and air conditioning, transportation, semiconductor and consumer electronics, general industrial, and oil and gas. Our flagship products include prominent brands such as Ti-Pure™, Opteon™, Freon™, Teflon™, Viton™, Nafion™, and Krytox™. The company has approximately 6,400 employees and 29 manufacturing sites serving approximately 3,200 customers in approximately 120 countries. Chemours is headquartered in Wilmington, Delaware and is listed on the NYSE under the symbol CC.

For more information, we invite you to visit chemours.com or follow us on Twitter @Chemours or LinkedIn.

Forward-Looking Statements
This press release contains forward-looking statements, within the meaning of Section 27A of the Securities Act of 1933 and Section 21E of the Securities Exchange Act of 1934, which involve risks and uncertainties. Forward-looking statements provide current expectations of future events based on certain assumptions and include any statement that does not directly relate to a historical or current fact. The words "believe," "expect," "will," "anticipate," "plan," "estimate," "target," "project" and similar expressions, among others, generally identify "forward-looking statements," which speak only as of the date such statements were made. These forward-looking statements may address, among other things, the outcome or resolution of any pending or future environmental liabilities, the commencement, outcome or resolution of any regulatory inquiry, investigation or proceeding, the initiation, outcome or settlement of any litigation, changes in environmental regulations in the U.S. or other jurisdictions that affect demand for or adoption of our products, anticipated future operating and financial performance for our segments individually and our company as a whole, business plans, prospects, targets, goals and commitments, capital investments and projects and target capital expenditures, plans for dividends or share repurchases, sufficiency or longevity of intellectual property protection, cost reductions or savings targets, plans to increase profitability and growth, our ability to make acquisitions, integrate acquired businesses or assets into our operations, and achieve anticipated synergies or cost savings, all of which are subject to substantial risks and uncertainties that could cause actual results to differ materially from those expressed or implied by such statements. Forward-looking statements are based on certain assumptions and expectations of future events that may not be accurate or realized. These statements are not guarantees of future performance. Forward-looking statements also involve risks and uncertainties that are beyond Chemours' control. In addition, the current COVID-19 pandemic has significantly impacted the national and global economy and commodity and financial markets, which has had and we expect will continue to have a negative impact on our financial results. The full extent and impact of the pandemic is still being determined and to date has included significant volatility in financial and commodity markets and a severe disruption in economic activity. The public and private sector response has led to travel restrictions, temporary business closures, quarantines, stock market volatility, and interruptions in consumer and commercial activity globally. Matters outside our control have affected our business and operations and may or may continue to hinder our ability to provide goods and services to customers, cause disruptions in our supply chains, adversely affect our business partners, significantly reduce the demand for our products, adversely affect the health and welfare of our personnel or cause other unpredictable events. Additionally, there may be other risks and uncertainties that Chemours is unable to identify at this time or that Chemours does not currently expect to have a material impact on its business. Factors that could cause or contribute to these differences include the risks, uncertainties and other factors discussed in our filings with the U.S. Securities and Exchange Commission, including in our Annual Report on Form 10-K for the year ended December 31, 2021. Chemours assumes no obligation to revise or update any forward-looking statement for any reason, except as required by law.


Contacts

INVESTORS
Jonathan Lock
SVP, Chief Development Officer and Investor Relations
+1.302.773.2263

This email address is being protected from spambots. You need JavaScript enabled to view it.

NEWS MEDIA
Cassie Olszewski
Media Relations and Financial Communications Manager
+1.302.219.7140
This email address is being protected from spambots. You need JavaScript enabled to view it.

NEWBURY PARK, Calif.--(BUSINESS WIRE)--Kolibri Global Energy Inc. (TSX: KEI) (OTCQB: KGEIF):


All amounts are in U.S. Dollars unless otherwise indicated:

2021 HIGHLIGHTS

  • In December 2021, the Company completed an equity rights offering for gross proceeds of C$8.6 million and is using the proceeds to drill two wells. As of March 10, 2022, the Company has completed drilling the Barnes 7-3H well (98.07% working interest) and the Barnes 8-4H well (99.8% working interest) and is currently performing a fracture stimulation on the Barnes 7-3H well with production expected in late March.
  • BOK Financial agreed to increase the borrowing base of the credit facility by $2.0 million if certain items are met. When the Company finishes fracture stimulating the Barnes 7-3H well, those items will have been met. The Company anticipates receiving the increase in the borrowing base in the second quarter of 2022.
  • The Company’s debt was reduced to $16.9 million at December 31, 2021 from $20.7 million at the beginning of the year. This was down from a peak debt level of $30.0 million.
  • The Company’s Total Proved Reserves were 34.1 million barrels of oil equivalent (BOE) for 2021 which was a 3% increase from 2020 according to the Company’s December 31, 2021, independent reserves evaluation. The NPV10 value of the Total Proved Reserves increased to $358.8 million, an 86% increase from 2020, due primarily to higher estimated future pricing.
  • The Company performed an impairment reversal test at December 31, 2021 and reversed the entire impairment expense of $71.9 million that was recorded in March 2020 due to low prices. The $71.9 impairment reversal was lower than the original impairment charge by $1.1 million to reflect the depletion that would have been recorded if the PP&E was never impaired for a net impairment reversal amount of $70.8 million.
  • Gross revenue in 2021 was $19.2 million, compared to $12.3 million in 2020.
  • Net income in 2021 was $71.0 million, compared to a net loss of $70.4 million in 2020, due to the impairment reversal of $70.8 million for the year ended December 31, 2021 compared to the impairment charge of $71.9 million for the year ended December 31, 2020.
  • Revenue, net of royalties was $15.0 million for 2021 compared to $9.6 million for 2020, due to an average price increase of 85% partially offset by 15% lower production.
  • Adjusted funds flow was $6.6 million for 2021 compared to $7.2 million for 2020. This decrease was due to a decrease in production of 15% and realized losses from commodity contracts in 2021 compared to realized gains in 2020, partially offset by the increase in average prices.(1)
  • Netback from operations increased to $33.75 per BOE in 2021 compared to $16.20 per BOE in 2020, an increase of 108%.(2) Netback including the impact of commodity contracts for 2021 was $26.05 per BOE, an increase of 9% from the prior year.(2) The 2021 increase compared to the prior year was due to the increase in average prices partially offset by higher production taxes.
  • Interest expense has decreased by 32% in 2021 compared to the prior year due to principal payments on the credit facility which reduced the outstanding loan balance combined with lower interest rates.
  • Average production for 2021 was 976 BOEPD compared to 1,151 BOEPD in 2020, a decrease of 15% due to the normal production decline of existing wells.
  • General & administrative (G&A) expenses for 2021 were $2.7 million compared to $2.9 million in 2020, a decrease of 7%. The decrease is due to management’s continued efforts to reduce G&A costs throughout the Company partially offset by higher advisor fees at the beginning of the year.
  • Production and operating expense per barrel averaged $8.32 per BOE in 2021 compared to $6.54 per BOE in 2020, an increase of 27%. The increase was primarily due to an increase in production taxes of $1.47 per BOE in 2021 due to higher average prices.

(1)


Adjusted Funds Flow is considered a non-GAAP measure. Refer to the section entitled “Non-GAAP Measures” of this earnings release.

(2)


Netback from operations and netback including commodity contracts are considered non-GAAP ratios. Refer to the section entitled “Non-GAAP Measures” of this earnings release.

Kolibri’s President and Chief Executive Officer, Wolf Regener commented:

“With our successful rights offering raising over C$8.6 million in December, the Company was able to fast track our 2022 drilling program at the beginning of the year. We have already drilled both the Barnes 7-3H well and the Barnes 8-4H well safely and on budget. The Company is currently performing fracture stimulation operations on the Barnes 7-3H well and expects production flow back by the end of March. In addition, we anticipate receiving the additional $2.0 million increase in our credit facility borrowing base which we will use, along with cash flow from operations, to fracture stimulate the Barnes 8-4H well in the second quarter of 2022. With oil current prices of over $100/barrel, we expect to generate significant incremental value to shareholders from both of these wells as production from these wells is unhedged.

Our 2021 independent reserves evaluation report showed a 3% increase in total proved reserves from the prior year with a NPV10 total proved value of $358.8 million, which was an 86% increase from 2020, primarily due to higher prices.

Also, due to higher prices in the oil market, the Company completely reversed the $71.9 million impairment charge that it has recorded in March 2020. The $71.9 impairment reversal was reduced by $1.1 million to reflect the depletion that would have been recorded if the PP&E was never impaired for a net impairment reversal amount of $70.8 million.

The Company was able to generate $6.6 million of adjusted funds flow without any capital expenditures during the year.

Netback from operations increased to $33.75 per BOE in 2021 compared to $16.20 per BOE in 2020, an increase of 108%, with an average price of $66.08 per BOE. Netback including the impact of commodity contracts for 2021 was $26.05 per BOE, an increase of 9% from the prior year. The 2021 increase compared to the prior year was due to the increase in average prices partially offset by higher production taxes.

Revenue, net of royalties was $15.0 million for 2021 compared to $9.6 million for 2020, an increase of 56% due to an 86% increase in average prices partially offset by a 15% decrease in production.

The average production for 2021 was 975 BOEPD, a decrease of 15% compared to 2020 production of 1,151 BOEPD. The decrease is due to the normal production decline of existing wells as no new wells were brought online in 2021.

G&A expenses for 2021 was $2.7 million compared to $2.9 million in 2020, a decrease of 7%. The decrease is due to management’s continued efforts to reduce G&A costs throughout the Company partially offset by higher advisor fees at the beginning of the year.

Interest expense has decreased by 32% in 2021 compared to the prior year due to principal payments on the credit facility which reduced the outstanding loan balance combined with lower interest rates.

Production and operating expense per barrel averaged $8.32 per BOE in 2021 compared to $6.54 per BOE in 2020, an increase of 27%. The increase was primarily due to an increase in production taxes of $1.47 per BOE in 2021 due to higher average prices.”


Fourth Quarter


Year Ended


2021

2020


%


2021


2020


%


Net Income (Loss):

$ Thousands

$72,340

$(1,078)

-%

$71,002

$(70,410)

-%

$ per common share

$0.31

$(0.01)

-%

$0.30

$(0.30)

-%

assuming dilution


Adjusted Funds Flow

$1,859

$1,750

6%

$6,569

$7,196

(9%)

Capital Expenditures

$559

$43

1200%

$696

$(16)

-%


Average Production (Boepd)

931

1,082

(14%)

975

1,151

(15%)

Gross Revenue

5,444

3,205

70%

19,128

12,251

56%

Average Price per Barrel

$51.67

$32.19

61%

$53.75

$29.08

85%

Netback from operations

per Barrel

$40.88

$18.38

122%

$33.75

$16.20

108%

Netback including commodity contracts per Barrel

$28.99

$25.40

14%

$26.05

$23.86

9%


December
2021


December
2020


Cash and Cash Equivalents

$7,316


$920


Working Capital

$3,823


($3,456)


Year Ended 2021 to Year Ended 2020

For 2021, oil and gas gross revenues increased $6,877,000 or 56% to $19,128,000. Oil revenues before royalties increased by 51% to $15,978,000 due to a 79% increase in prices between years partially offset by a 16% decrease in production. Natural gas revenues before royalties increased $534,000 or 74% due to a 104% increase in average gas prices partially offset by a 15% decrease in natural gas production. NGL revenue before royalties increased $958,000 or 103% due to a 136% increase in average prices partially offset by a 14% decrease in production.

Average production per day for 2021 decreased 15% from the prior year due to the normal production decline of existing wells.

Production and operating expenses increased by $207,000 due to an increase in production taxes. Production and operating expense per barrel averaged $8.32 per BOE in 2021 compared to $6.54 per BOE in 2020, an increase of 27%. The increase was primarily due to an increase in production taxes of $1.47 per BOE in 2021 due to higher average prices.

Depletion and depreciation expense decreased $1,020,000 due to decreased production and a lower PP&E balance due to the impairment.

The Company completely reversed the $71.9 million PP&E impairment charge that it has recorded in March 2020 due to higher oil prices. The $71.9 impairment reversal was reduced by $1.1 million to reflect the depletion that would have been recorded if the PP&E was never impaired for a net impairment reversal amount of $70.8 million.

G&A expenses decreased $162,000, or 6%, in 2021 compared to 2020. The decrease is due to management’s continued efforts to reduce G&A costs throughout the Company partially offset by higher advisor fees at the beginning of the year.

Finance income decreased $3,542,000 in 2021 compared to the prior year due to realized and unrealized gains on commodity contracts that were recorded in 2020.

Finance expense increased $4,760,000 due to realized and unrealized losses on commodity contracts in 2021 partially offset by lower interest expense.

FOURTH QUARTER HIGHLIGHTS:

  • Net income in the fourth quarter of 2021 was $72.3 million, compared to net loss of $1.8 million in the fourth quarter of 2020, due to the impairment reversal of $70.8 million for the year ended December 31, 2021.
  • Revenue, net of royalties, was $4.3 million for the fourth quarter of 2021, an increase of 70% compared to the fourth quarter 2020 due to higher average prices partially offset by lower production.
  • Adjusted funds flow was $1.9 million in the fourth quarter of 2021 compared to $1.8 million in the prior year fourth quarter.
  • Netback from operations increased to $40.88 per BOE in the fourth quarter of 2021 compared to $18.38 per BOE in the fourth quarter of 2020, an increase of 123%. Netback including the impact of commodity contracts for the fourth quarter of 2021 was $28.99 per BOE, an increase of 14% from the prior year. The 2021 increase compared to the prior year quarter was due to the increase in average prices partially offset by higher production taxes.
  • Interest expense decreased by 22% in the fourth quarter of 2021 due to principal payments on the credit facility which reduced the outstanding loan balance and lower interest rates.
  • Average production for the fourth quarter of 2021 was 931 BOEPD, a decrease of 14% compared to the prior year fourth quarter due to the normal decline of existing wells.
  • G&A expense decreased by over 20% in the fourth quarter of 2021 due to due to management’s continued efforts to reduce G&A costs throughout the Company.
  • Operating expense per barrel averaged $8.79 per BOE in the fourth quarter of 2021 compared to $6.84 per BOE in the prior year quarter, an increase of 28%. The increase was primarily due to an increase in production taxes in 2021 due to higher average prices.
  • The Company performed an impairment reversal test at December 31, 2021 and reversed the entire impairment expense of $71.9 million that was recorded in March 2020. The $71.9 impairment reversal was lower than the original impairment by $1.1 million to reflect the depletion that would have been recorded if the PP&E was never impaired for a net impairment reversal amount of $70.8 million.

Fourth Quarter 2021 to Fourth Quarter 2020

Gross oil and gas revenues totaled $5,444,000 in the fourth quarter of 2021 versus $3,205,000 in the fourth quarter of 2020, an increase of 70%. Oil revenues were $4,450,000 in the fourth quarter of 2021 versus $2,735,000 in the fourth quarter of 2020, an increase of 63%, due to increase in average prices partially offset by decreased production. Natural gas revenues increased 95% due to an increase in average prices partially offset by a decrease in production. NGL revenue increased 125% to $577,000 due to higher average NGL prices partially offset by lower production.

Operating expenses increased by $72,000 in the fourth quarter of 2021 compared to 2020 due to higher production taxes.

G&A expenses decreased by $155,000, or 20%, between quarters due to management’s continued efforts to reduce G&A costs throughout the Company.

Finance income decreased by $185,000 in the fourth quarter of 2021 compared to the prior year fourth quarter due to realized gains on commodity contracts in 2020.

Finance expense decreased $602,000 due to unrealized losses on commodity contracts in 2020 and lower fourth quarter 2021 interest expense compared to the prior year fourth quarter.

KOLIBRI GLOBAL ENERGY INC.

CONDENSED CONSOLIDATED STATEMENTS OF FINANCIAL POSITION

(Unaudited, Expressed in Thousands of United States Dollars)


December 31,


December 31,


2021


2020

Current assets


Cash and cash equivalents

$

7,316

$

920


Trade and other receivables


1,999


1,607


Deposits and prepaid expenses


587


575


9,902


3,102


Non-current assets


Property, plant and equipment


147,076


78,979


Right of use assets


38


103


Total assets

$

157,016

$

82,184


Current liabilities


Trade and other payables

$

3,145

$

4,371


Current portion of loans and borrowings


1,000


2,084


Current lease payable


43


66


Fair value of commodity contracts


1,891


37


6,079


6,558


Non-current liabilities


Loans and borrowings


15,866


18,665


Asset retirement obligations


1,398


1,269


Lease payable


-


44


Fair value of commodity contracts


585


-


17,849


19,978


Equity


Share capital


296,060


289,622


Contributed surplus


22,948


22,948


Deficit


(185,920)


(256,922)

Total equity


133,088


55,648


Total equity and liabilities

$

157,016

$

82,184


KOLIBRI GLOBAL ENERGY INC.

CONDENSED CONSOLIDATED STATEMENTS OF OPERATIONS AND COMPREHENSIVE LOSS

(Unaudited, expressed in Thousands of United States dollars, except per share amounts)


Three months ended

December 31


Year ended

December 31


2021


2020


2021


2020

Revenue:


Oil and natural gas revenue, net

$

4,255


$

2,510


$

14,972


$

9,580


Other income


-


-


2


2


4,255


2,510


14,974


9,582


Expenses:


Production and operating


753


681


2,962


2,755


Depletion and depreciation


915


988


3,594


4,614


General and administrative


622


777


2,697


2,859


Share based compensation


-


-


-


21


Impairment (impairment reversal) of PP&E


(70,820

)


-


(70,820

)


71,923


Gain on forgiven loans


(280

)


-


(583

)


-


(68,810)


2,446


(62,150

)


82,172


Finance income


514


699


-


3,542


Finance expense


(1,239

)


(1,841

)


(6,122

)


(1,362

)


Net income (loss) and comprehensive income (loss)

$

72,340

$

(1,078

) $

71,002

$

(70,410)


Net income (loss) per share


Basic and Diluted

$

0.31


$

(0.00

)

$

0.30


$

(0.30

)

KOLIBRI GLOBAL ENERGY INC.

FOURTH QUARTER AND YEAR ENDED 2021

(Unaudited, expressed in Thousands of United States dollars, except as noted)


4th Quarter


Year Ended Dec. 31


2021

2020


2021


2020


Oil revenue before royalties

$

4,450


2,735


15,978


10,593


Gas revenue before royalties


417


214


1,259


725


NGL revenue before royalties


577


256


1,891


933


5,444


3,205


19,128


12,251


Adjusted funds flow


1,859


1,750


6,569


7,196


Additions (adjustments) to PP&E


559


43


696


(16

)


Statistics:


4th Quarter

Year Ended Dec. 31


2021


2020


2021


2020


Average oil production (Bopd)


638


735


662


785


Average natural gas production (mcf/d)


825


924


864


1,013


Average NGL production (Boepd)


153


193


169


197


Average production (Boepd)


931


1,082


975


1,151


Average oil price ($/bbl)


$

75.80


$

40.42

$

66.08


$

36.85


Average natural gas price ($/mcf)


$

5.49


$

2.52

$

3.99


$

1.96


Average NGL price ($/bbl)


$

40.56


$

14.39

$

30.59


$

12.94


Average price per barrel


$

63.56


$

32.19

$

53.75


$

29.08


Royalties per barrel


13.89


6.97


11.68


6.34


Operating expenses per barrel


8.79


6.84


8.32


6.54


Netback from operations


$

40.88


$

18.38

$

33.75


$

16.20


Price adjustment from commodity contracts (Boe)


(11.89

)


7.02


(7.70

)


7.66


Netback including commodity contracts (Boe)


28.99


25.40


26.05


23.86


The information outlined above is extracted from and should be read in conjunction with the Company's audited financial statements for the year ended December 31, 2021 and the related management's discussion and analysis thereof, copies of which are available under the Company's profile at www.sedar.com.

NON-GAAP MEASURES

Netback from operations, netback including commodity contracts and adjusted funds flow (collectively, the "Company’s Non-GAAP Measures") are not measures or ratios recognized under Canadian generally accepted accounting principles ("GAAP") and do not have any standardized meanings prescribed by IFRS. Management of the Company believes that such measures and ratios are relevant for evaluating returns on each of the Company's projects as well as the performance of the enterprise as a whole. The Company's Non-GAAP Measures may differ from similar computations as reported by other similar organizations and, accordingly, may not be comparable to similar non-GAAP measures and ratios as reported by such organizations. The Company’s Non-GAAP Measures should not be construed as alternatives to net income, cash flows related to operating activities, working capital or other financial measures and ratios determined in accordance with IFRS, as an indicator of the Company's performance.

An explanation of how the Company’s Non-GAAP Measures provide useful information to an investor and the purposes for which the Company’s management uses the Non-GAAP Measures is set out in the management's discussion and analysis under the heading “Non-GAAP Measures” which is available under the Company's profile at www.sedar.com and is incorporated by reference into this earnings release.

The following is the reconciliation of the non-GAAP ratio netback from operations to net income (loss) from continuing operations, which the Company considers to be the most directly comparable financial measure that is disclosed in the Company’s financial statements:

(US $000)

Year ended December 31,

2021

2020

Net earnings (loss) from continuing operations

71,002

(70,410)


Adjustments:

Finance income

-

(3,542)

Finance expense

6,122

1,362

Stock based compensation

-

21

General and administrative expenses

2,697

2,859

Impairment (impairment reversal) of property, plant and equipment

(70,820)

71,923

Depletion, depreciation and amortization

3,594

4,614

Other income

(583)

(2)

Operating netback

12,012

6,825


Netback from operations

$33.75

$16.20

The following is the reconciliation of the non-GAAP measure adjusted funds flow to the comparable financial measures disclosed in the Company’s financial statements:

(US $000)

Year ended December 31,

2021

2020

Cash flow from continuing operations

6,303

6,111

Change in non-cash working capital

(551)

(128)

Interest expense(a)

817

1,213

Adjusted funds flow

6,569

7,196

(a)

Interest expense on long-term debt excluding the amortization of debt issuance costs

CAUTIONARY STATEMENTS

In this news release and the Company’s other public disclosure:

(a)

The Company's natural gas production is reported in thousands of cubic feet ("Mcfs"). The Company also uses references to barrels ("Bbls") and barrels of oil equivalent ("Boes") to reflect natural gas liquids and oil production and sales. Boes may be misleading, particularly if used in isolation. A Boe conversion ratio of 6 Mcf:1 Bbl is based on an energy equivalency conversion method primarily applicable at the burner tip and does not represent a value equivalency at the wellhead. Given that the value ratio based on the current price of crude oil as compared to natural gas is significantly different from the energy equivalency of 6:1, utilizing a conversion on a 6:1 basis may be misleading as an indication of value.

(b)

Discounted and undiscounted net present value of future net revenues attributable to reserves do not represent fair market value.

(c)

Possible reserves are those additional reserves that are less certain to be recovered than probable reserves. There is a 10% probability that the quantities actually recovered will equal or exceed the sum of proved plus probable plus possible reserves.

(d)

The Company discloses peak and 30-day initial production rates and other short-term production rates. Readers are cautioned that such production rates are preliminary in nature and are not necessarily indicative of long-term performance or of ultimate recovery.

Readers are referred to the full description of the results of the Company's December 31, 2021 independent reserves evaluation and other oil and gas information contained in its Form 51-101F1 Statement of Reserves Data and Other Oil and Gas Information for the year ended December 31, 2021, which the Company filed on SEDAR on March 7, 2022.

Caution Regarding Forward-Looking Information

This release contains forward-looking information including estimates of reserves, the proposed timing and expected results of exploratory and development work including fracture stimulation and production from the Company's Tishomingo field, Oklahoma acreage, the future performance of wells including following shut-in’s and restart of well(s), the expected effects of cost reduction efforts, availability of funds from the Company’s reserves based loan facility and the expected increase to the Company’s borrowing base of $2.0 million in the second quarter of 2022, and the Company’s strategy and objectives. The use of any of the words “target”, “plans”, "anticipate", "continue", "estimate", "expect", "may", "will", "project", "should", "believe", “intend” and similar expressions are intended to identify forward-looking statements.

Such forward-looking information is based on management’s expectations and assumptions, including that the Company's geologic and reservoir models and analysis will be validated, that indications of early results are reasonably accurate predictors of the prospectiveness of the shale intervals, that previous exploration results are indicative of future results and success, that expected production from future wells can be achieved as modeled, declines will match the modeling, future well production rates will be improved over existing wells, that rates of return as modeled can be achieved, that recoveries are consistent with management’s expectations, that additional wells are actually drilled and completed, that design and performance improvements will reduce development time and expense and improve productivity, that discoveries will prove to be economic, that anticipated results and estimated costs will be consistent with managements’ expectations, that all required permits and approvals and the necessary labor and equipment will be obtained, provided or available, as applicable, on terms that are acceptable to the Company, when required, that no unforeseen delays, unexpected geological or other effects, equipment failures, permitting delays or labor or contract disputes are encountered, that the development plans of the Company and its co-venturers will not change, that the demand for oil and gas will be sustained, that the price of oil will be sustained or increase, that the Company will continue to be able to access sufficient capital through financings, credit facilities, farm-ins or other participation arrangements to maintain its projects, that the Company will continue in compliance with the covenants under its reserves-based loan facility and that the borrowing base will not be reduced and will be increased in the second quarter of 2022, that the Company will not be adversely affected by changing government policies and regulations, social instability or other political, economic or diplomatic developments in the countries in which it operates and that global economic conditions will not deteriorate in a manner that has an adverse impact on the Company's business and its ability to advance its business strategy.


Contacts

Wolf E. Regener, President and Chief Executive Officer +1 (805) 484-3613
Email: This email address is being protected from spambots. You need JavaScript enabled to view it.
Website: www.kolibrienergy.com


Read full story here

  • Time-tested design part of Siemens Energy’s commitment to environment and safety
  • Blue switchgear technology will help National Grid meet zero-carbon emissions goal

ORLANDO, Fla.--(BUSINESS WIRE)--In line with shared commitments to decarbonize, National Grid and Siemens Energy are teaming up to undertake a cutting-edge upgrade of a National Grid substation using Siemens Energy designed fluorinated gas free “Blue circuit breakers” with clean air insulation and vacuum switching technology.


The installation is an example of how the two companies are leading the energy transition. The elimination of fluorinated gasses, specifically SF6, aggressively mitigates greenhouse gas emissions and furthers each company’s goal of addressing climate change, as the global warming potential (GWP) of SF6 is 23,500 times higher than the GWP of CO2. One kg of SF6 has the same greenhouse gas effect as 23,500 kg of CO2. SF6 also remains in the atmosphere for more than 3,000 years.

“The availability of a SF6-free circuit breaker for this voltage class will go a long way toward helping us meet our net-zero carbon emissions targets,” says Jim McGrath, New England Director of Substation Engineering for National Grid. “Climate change is one of the greatest challenges that we currently confront as a society, requiring bold, creative solutions. The Blue circuit breaker is an excellent example of a solution that will help reduce our emissions.”

Scheduled for commissioning in 2023, Siemens Energy’s Blue circuit breakers will be installed in National Grid’s Ayer, Massachusetts, substation that serves several North Central Massachusetts communities. It will be the first Siemens Energy Blue circuit breaker installation in National Grid’s U.S. electricity network.

The core element of Siemens Energy’s Blue circuit breaker is the vacuum interrupter unit. This revolutionary technology enables fluorinated gas-free and climate neutral high-voltage power grids. Instead of SF6 used in most high-voltage circuit breakers, Siemens Energy’s Blue portfolio combines 80 percent nitrogen and 20 percent oxygen as the insulating medium, called clean air. The gas can be released into the atmosphere with zero harmful effects to people and the environment, and with zero greenhouse gas (GHG) emissions.

“The Blue portfolio design leverages our 150 years of industry experience and has an 11-year proven track record of successful vacuum high-voltage circuit breaker applications,” says Tim Holt, member of the Siemens Energy managing board responsible for the Transmission business. “It shows we are fully committed not only to being carbon neutral ourselves, but to supporting partners like National Grid who care about the environment and human safety.”

Follow us on Twitter at: www.twitter.com/siemens_energy

Siemens Energy is one of the world’s leading energy technology companies. The company works with its customers and partners on energy systems for the future, thus supporting the transition to a more sustainable world. With its portfolio of products, solutions and services, Siemens Energy covers almost the entire energy value chain – from power generation and transmission to storage. The portfolio includes conventional and renewable energy technology, such as gas and steam turbines, hybrid power plants operated with hydrogen, and power generators and transformers. More than 50 percent of the portfolio has already been decarbonized. A majority stake in the listed company Siemens Gamesa Renewable Energy (SGRE) makes Siemens Energy a global market leader for renewable energies. An estimated one-sixth of the electricity generated worldwide is based on technologies from Siemens Energy. Siemens Energy employs around 91,000 people worldwide in more than 90 countries and generated revenue of €28.5 billion in fiscal year 2021. www.siemens-energy.com.


Contacts

Contact for journalists
Stacia Licona
Phone: +1 281-721-3402
E-mail: This email address is being protected from spambots. You need JavaScript enabled to view it.

ABERDEEN, Scotland--(BUSINESS WIRE)-- 

Financial Highlights

For the three months ended December 31, 2021, KNOT Offshore Partners LP (“KNOT Offshore Partners” or the “Partnership”):

  • Generated total revenues of $72.1 million, operating income of $26.0 million and net income of $23.1 million.
  • Generated Adjusted EBITDA of $52.0 million (1)
  • Generated distributable cash flow of $23.3 million (1)
  • Reported a distribution coverage ratio of 1.28 (2)
  • Reported $117.3 million in available liquidity, which included cash and cash equivalents of $62.3 million at December 31, 2021 (compared to $121.6 million of available liquidity and $66.6 million of cash and cash equivalents at September 30, 2021)

Other Partnership Highlights and Events

  • Fleet operated with 100% utilization for scheduled operations and 96% utilization taking into account both the scheduled drydocking of the Tordis Knutsen, which was offhire for 35 days in connection with her drydocking in the fourth quarter of 2021, and the offhire of 27 days related to the installation of the volatile organic compound (“VOC”) emissions recovery plant on the Bodil Knutsen.
  • On February 10, 2022, the Partnership paid a quarterly cash distribution of $0.52 per common and Class B unit with respect to the quarter ended December 31, 2021 to all common and Class B unitholders of record on January 28, 2022. On February 10, 2022, the Partnership paid a cash distribution to holders of Series A Convertible Preferred Units (“Series A Preferred Units”) with respect to the quarter ended December 31, 2021 in an aggregate amount equal to $1.7 million.
  • The charterer of the Anna Knutsen, Galp Sinopec, did not notify the Partnership by the due date of its intention to exercise its option to extend the time charter of the vessel and, as a consequence, the vessel was effectively redelivered to the Partnership on February 14, 2022 at the start of its mobilization trip to Europe for the vessel’s planned drydock. On February 11, 2022 the Partnership agreed on the commercial terms for a new time charter contract for the Anna Knutsen with a major oil company to commence in the second quarter of 2022 for a fixed period, at the charterer’s option, of either (a) one year, with options for the charterer to extend the time charter by up to four further one-year periods, or (b) two years, with options for the charterer to extend the time charter by up to three further one-year periods.
  • The Partnership has entered into a new time charter agreement for the Tordis Knutsen with Petrobras that commenced on February 23, 2022 for a fixed period of five months, with an option for the charterer to extend the charter by one month.
  • The Partnership has entered into a new time charter contract for the Bodil Knutsen with Equinor to commence in the fourth quarter of 2023 or the first quarter of 2024. The new charter is for a fixed period, at the charterer’s option, of either one year or two years with options for the charterer to extend the charter, in either case, by two further one-year periods.
  • The Partnership has entered into a new time charter contract for the Windsor Knutsen with Equinor to commence in the fourth quarter of 2024 or the first quarter of 2025. The new charter is for a fixed period, at the charterer’s option, of either one year or two years, with options for the charterer to extend the charter, in either case, by two further one-year periods.

Gary Chapman, Chief Executive Officer and Chief Financial Officer of KNOT Offshore Partners LP, commented, “Even as one of our vessels underwent scheduled drydocking, the Partnership maintained very high fleet utilization during the fourth quarter of 2021, generating strong cash-flow and providing solid coverage for our distribution to unitholders. We have also made good progress in agreeing a combination of interim and longer-term employment contracts for a number of our vessels coming into the charter market, and we remain highly focused on securing further coverage for the quarters ahead. In the medium term and beyond, with high oil prices continuing to incentivize production and major shuttle tanker customers, particularly in Brazil, committing extensive capex to the FPSOs that will serve as the basis for their deep-water expansion, we believe that KNOP is well positioned to service the significant growth that we expect in the shuttle tanker-serviced offshore oil fields where we operate.”

(1) EBITDA, Adjusted EBITDA and distributable cash flow are non-GAAP financial measures used by management and external users of the Partnership’s financial statements. Please see Appendix A for definitions of EBITDA, Adjusted EBITDA and distributable cash flow and a reconciliation to net income, the most directly comparable GAAP financial measure.

(2) Distribution coverage ratio is equal to distributable cash flow divided by distributions declared for the period presented.

Financial Results Overview

Total revenues were $72.1 million for the three months ended December 31, 2021 (the “fourth quarter”), compared to $66.6 million for the three months ended September 30, 2021 (the “third quarter”). The increase was mainly due to full earnings for the Windsor Knutsen after starting up the contract with PetroChina in the third quarter of 2021, full earnings for the Vigdis Knutsen after a COVID-19 outbreak on board in the third quarter and loss of hire recoveries in the fourth quarter related to the Tordis Knutsen due to a technical fault on its azimuth thruster in the third quarter.

Vessel operating expenses for the fourth quarter of 2021 were $18.5 million, an increase of $0.8 million from $17.7 million in the third quarter of 2021. The increase is mainly related to increased bunkers costs for the Tordis Knutsen in connection with its voyage to drydocking.

Depreciation was $26.0 million for the fourth quarter, a decrease of $0.1 million from $26.1 million in the third quarter. The decrease is related to drydock adjustments for the Tordis Knutsen in the fourth quarter.

General and administrative expenses were $1.6 million for the fourth quarter compared to $1.7 million for the third quarter.

As a result, operating income for the fourth quarter was $26.0 million, compared to $21.1 million for the third quarter.

Interest expense for the fourth quarter was $6.6 million, a decrease of $0.6 million from $7.2 million for the third quarter. The decrease was mainly due to higher amortization costs in the third quarter for the Tordis Knutsen, the Vigdis Knutsen, the Lena Knutsen, the Anna Knutsen and the Brasil Knutsen in connection with the $345 million refinancing and the expensing of certain amortization costs related to the vessels’ previous financing.

Realized and unrealized gain on derivative instruments was $4.1 million in the fourth quarter, compared to a gain of $0.1 million in the third quarter. The unrealized non-cash element of the mark-to-market gain was $6.3 million for the fourth quarter of 2021, compared to a gain of $2.0 million for the third quarter of 2021. All of the unrealized gain for the third quarter and the fourth quarter of 2021 is related to a mark-to-market gain on interest rate swaps.

As a result, net income for the fourth quarter of 2021 was $23.1 million compared to $13.5 million for the third quarter of 2021.

Net income for the fourth quarter of 2021 decreased by $1.5 million to $23.1 million from a net income of $24.6 million for the three months ended December 31, 2020. Operating income for the fourth quarter of 2021 decreased by $4.4 million to $26.0 million, compared to operating income of $30.4 million in the fourth quarter of 2020, mainly due to lower utilization of the fleet due to offhire in connection with scheduled drydocking and the VOC recovery plant installation on the Bodil Knutsen, and increased depreciation costs for the fleet related to the Partnership’s change of the useful life estimate of the vessels from 25 years to 23 years. This decrease was partially offset by the inclusion of the Tove Knutsen in results of operations from December 31, 2020 and increased earnings from the Windsor Knutsen after starting up the contract with PetroChina. Total finance expense for the fourth quarter of 2021 decreased by $3.0 million to $2.8 million, compared to finance expense of $5.8 million for the fourth quarter of 2020. The decrease in finance expense was mainly due to an increase in unrealized gain on derivative instruments. This was partially offset by increased interest expense for the Raquel Knutsen in connection with the sale and leaseback transaction, as a result of which both the financial obligation and interest rate increased, and by including the Tove Knutsen in results from December 31, 2020.

Distributable cash flow was $23.3 million for the fourth quarter of 2021, compared to $18.6 million for the third quarter of 2021. The increase in distributable cash flow was mainly due to an overall higher utilization for the fleet due to several offhires in the third quarter and loss of hire insurance recoveries for the Tordis Knutsen in the fourth quarter. This was offset by lower contributions from the Bodil Knutsen in the fourth quarter in connection with VOC recovery plant installation which resulted in 27 days of offhire in the fourth quarter. The distribution declared for the fourth quarter was $0.52 per common and Class B unit, equivalent to an annualized distribution of $2.08.

COVID-19

The outbreak of the coronavirus (“COVID-19”) continues to affect global economic activity; however the Partnership has to date avoided any serious or sustained operational impacts, and there have been no effects on the Partnership’s contractual position. Steady progress in vaccinations and further signs of global economic recovery continue to cautiously increase optimism.

The Partnership’s focus remains on ensuring the health and safety of its employees and crew onboard while providing safe and reliable operations for its customers, and a large number of practical steps and changes have been made and taken towards this aim. While full or partial crew changes on all of the Partnership’s vessels have been continuing, the situation remains challenging for the maritime industry as a whole owing to travel restrictions and quarantine regulations that are ongoing in many countries.

Costs related to the movement of maritime personnel and vessel operational logistics, including repairs and maintenance, remain challenging. The Partnership remains vigilant to address any changes related to the health, safety and wellbeing of personnel, or to government restrictions and other matters potentially affecting operations.

Other than 17 days of off-hire incurred as a result of a COVID-19 outbreak on the Vigdis Knutsen in July 2021 and the 5 days of off-hire incurred as a result of a COVID-19 outbreak on the Raquel Knutsen in February 2022, each of which was quickly contained with no serious ill-health caused to any persons affected, the Partnership has not had any material service interruptions on its time-chartered vessels as a result of COVID-19; however the potential impact of COVID-19 on the Partnership’s business, financial condition and results of operating remains uncertain.

The closure of, or restricted access to, ports and terminals and passenger air travel in regions affected by the virus may yet still lead to further operational impacts that could result in higher costs. It is possible that a further outbreak onboard a time-chartered vessel could prevent the Partnership from meeting its obligations under a charter, resulting in an off-hire claim and loss of revenue. Any outbreak of COVID-19 on board one of the Partnership’s time-chartered vessels or that affects any of the Partnership’s main suppliers could cause an inability to replace critical supplies or parts, maintain adequate crewing or fulfill the Partnership’s obligations under its time charter contracts, which in turn could result in off-hire or claims for the impacted period.

Announced delays in new capital expenditure by many oil majors in 2020 had a negative impact on the demand for shuttle tankers and, given the uncertainty around the continuation of the COVID-19 situation, this dampened demand could continue through at least the majority of 2022. This has affected the timing and number of new offshore projects and overall oil production profiles in the short-term, which has impacted the demand and pricing for shuttle tankers. If this situation persists, the Partnership may be unable to re-charter its vessels at attractive rates in the future, particularly for vessels that are coming off charter in the next one to two years.

Notwithstanding these challenges, the Partnership remains confident in the mid to long term growth opportunities for the shuttle tanker market and that as economic activity begins to regain traction, the Partnership will be well-placed to capture new opportunities, particularly given an absence of speculative vessel ordering in the shuttle tanker sector.

Although the Partnership is exposed to credit risk associated with individual charterers, the Partnership believes that its charter contracts, all with subsidiaries of national oil companies and oil majors and Knutsen NYK Offshore Tankers AS (“Knutsen NYK”), largely insulate the Partnership from this risk. In particular, charter hire is payable in advance and the services the Partnership performs are of a critical nature for the Partnership’s customers. Notwithstanding, any extended period of non-payment or idle time between charters could adversely affect the Partnership’s future liquidity, results of operations and cash flows. The Partnership has not so far experienced any reduced or non-payments for obligations under the Partnership’s time charter contracts and the Partnership has not provided concessions or made changes to the terms of payment for customers.

Operational Review

The Partnership’s vessels operated throughout the fourth quarter of 2021 with 100% utilization for scheduled operations and 96% utilization taking into account both the scheduled drydocking of the Tordis Knutsen, which was offhire for 35 days in connection with her drydocking in the fourth quarter of 2021, and the offhire of 27 days related to the installation of the VOC emissions recovery plant on the Bodil Knutsen.

The Bodil Knutsen is currently operating under a time charter contract with its sponsor, Knutsen NYK; which expires in April 2022. The charterer has two further one-month extension options. The Partnership has also entered into a new time charter contract for the Bodil Knutsen with Equinor to commence in the fourth quarter of 2023 or the first quarter of 2024. The new charter is for a fixed period, at the charterer’s option, of either one year or two years with options for the charterer to extend the charter, in either case, by two further one-year periods. The Partnership is still seeking short term to mid-term charter employment for the vessel and the time charter with Knutsen NYK can be terminated early should such an employment opportunity arise.

The Tordis Knutsen was redelivered from the charterer on November 26, 2021, and thereafter started on her mobilization trip to Europe for her planned 5-year special survey drydocking, The vessel completed this work and on February 23, 2022 the vessel commenced a new time charter contract with Petrobras for a fixed period of five months with an option for the charterer to extend the charter by one month.

The Anna Knutsen was redelivered from the charterer on February 14, 2022 and started on its mobilization trip to Europe in order to complete her planned 5-year special survey drydocking. On February 11, 2022 the Partnership agreed on the commercial terms for a new time charter contract for the Anna Knutsen with a major oil company to commence in the second quarter of 2022 for a fixed period, at the charterer’s option, of either (a) one year, with options for the charterer to extend the time charter by up to four further one-year periods, or (b) two years, with options for the charterer to extend the time charter by up to three further one-year periods.

The Windsor Knutsen is operating on a one-year time charter contract with PetroChina with charterer’s options to extend the charter by one one-year period and then one six-month period, for operation in Brazil. The Partnership has entered into a new time charter contract for the Windsor Knutsen with Equinor to commence in the fourth quarter of 2024 or the first quarter of 2025. The new charter is for a fixed period, at the charterer’s option, of either one year or two years, with options for the charterer to extend the charter, in either case, by two further one-year periods.

As anticipated, the Vigdis Knutsen was redelivered by the charterer on March 5, 2022 and started her mobilization trip to Europe for her planned 5-year special survey drydocking.

Financing and Liquidity

As of December 31, 2021, the Partnership had $117.3 million in available liquidity, which consisted of cash and cash equivalents of $62.3 million and $55.0 million of capacity under its existing revolving credit facilities. The revolving credit facilities mature between August 2023 and November 2023. The Partnership’s total interest-bearing obligations outstanding as of December 31, 2021 were $974.6 million ($967.1 million net of debt issuance cost). The average margin paid on the Partnership’s outstanding debt during the fourth quarter of 2021 was approximately 2.06% over LIBOR.

As of December 31, 2021, the Partnership had entered into various interest rate swap agreements for a total notional amount of $462.3 million to hedge against the interest rate risks of its variable rate borrowings. As of December 31, 2021, the Partnership receives interest based on three or six-month LIBOR and pays a weighted average interest rate of 1.88% under its interest rate swap agreements, which have an average maturity of approximately 3.4 years. The Partnership does not apply hedge accounting for derivative instruments, and its financial results are impacted by changes in the market value of such financial instruments.

As of December 31, 2021, the Partnership’s net exposure to floating interest rate fluctuations was approximately $360.8 million based on total interest-bearing contractual obligations of $974.6 million, less the Raquel Knutsen sale & leaseback facility of $89.2 million, less interest rate swaps of $462.3 million and less cash and cash equivalents of $62.3 million. The Partnership’s outstanding interest-bearing contractual obligations of $974.6 million as of December 31, 2021 are repayable as follows:

(U.S. Dollars in thousands)


Sale & Leaseback


Period repayment


Balloon repayment


Total


2022


$

4,960


$

85,996


$


$

90,956


2023


5,177


79,768


225,906


310,851


2024


5,418


38,107


123,393


166,918


2025


5,640


28,372


65,506


99,518


2026 and thereafter


68,010


18,822


219,521


306,353


Total


$

89,205


$

251,065


$

634,326


$

974,596


ATM Program

On August 26, 2021, the Partnership entered into a sales agreement with B. Riley Securities, Inc., as the Agent. Under the terms of the at the market sales agreement, the Partnership may offer and sell up to $100 million of common units from time to time through the Agent.

From October 1, 2021 to December 31, 2021, the Partnership sold 41,940 common units under the program at an average gross sales price of $20.06 per unit and received net proceeds, after sales commissions, of $0.83 million. The Partnership paid an aggregate of $0.01 million in sales commissions to the Agent in connection with such sales.

Distributions

On February 10, 2022, the Partnership paid a quarterly cash distribution of $0.52 per common unit and Class B unit with respect to the quarter ended December 31, 2021 to all common and Class B unitholders of record on January 28, 2022. On February 10, 2022, the Partnership paid a cash distribution to holders of Series A Preferred Units with respect to the quarter ended December 31, 2021 in an aggregate amount equal to $1.7 million.

Assets Owned by Knutsen NYK

In October 2020, Knutsen NYK took delivery of Tove Knutsen’s sister vessel, the Synnøve Knutsen. Upon delivery, the vessel operated under a short-term contract with Petrobras in Brazil and then commenced on a 5-year time charter contract with Equinor in February 2022. Equinor has the option to extend the Synnnøve Knutsen charter for up to a further 15 years.

In February 2021, Tuva Knutsen, was delivered to Knutsen NYK from the yard and commenced on a 5-year time charter contract with a wholly owned subsidiary of the French oil major TotalEnergies. TotalEnergies has options to extend the charter for up to a further 10 years.

In November 2021, Live Knutsen, was delivered to Knutsen NYK from the yard in China and commenced on a 5-year time charter contract with Galp Sinopec for operation in Brazil. Galp has options to extend the charter for up to a further 6 years.

Knutsen NYK has three additional newbuildings under construction, all of which are secured on long-term charters from delivery.

Pursuant to the omnibus agreement the Partnership entered into with Knutsen NYK at the time of its initial public offering, the Partnership has the option to acquire from Knutsen NYK any offshore shuttle tankers that Knutsen NYK acquires or owns that are employed under charters for periods of five or more years.

There can be no assurance that the Partnership will acquire any additional vessels from Knutsen NYK.

Outlook

As of December 31, 2021, the Partnership’s fleet of seventeen vessels had an average age of 8.0 years and had charters with an average remaining fixed duration of 2.0 years. In addition, the charterers of the Partnership’s time charter vessels had options to extend their charters by an additional 2.7 years on average. As of December 31, 2021, the Partnership had $560 million of remaining contracted forward revenue, excluding options.

The Partnership’s earnings for the first quarter of 2022 will be affected by the planned 5-year special survey dry dockings of the Tordis Knutsen, Anna Knutsen and Vigdis Knutsen. The estimated aggregate off hire related to the scheduled drydocking of the above vessels will be approximately 130 days and the costs are expected to fall predominantly in the first quarter of 2022. Although the Partnership’s distribution coverage in the first quarter of 2022 will be affected by such concentrated drydocking work, the impact is both scheduled and expected.

In addition, during February 2022, the Raquel Knutsen experienced 5 days offhire related to an outbreak of COVID-19. The outbreak was quickly contained, with no crewmembers experiencing severe symptoms, and the vessel subsequently returned to service.

Shuttle tanker demand continues to reflect the delays to offshore project development timelines following from the dramatic capex reductions instituted by offshore oil producers during the early days of the COVID-19 pandemic; however recent and increasing activity by the Partnership’s customers is encouraging. Despite this and the continuing recovery in oil demand together with increasing oil prices, the lag effect introduced by the delay in capex deployment continues to impact the shuttle tanker charter market at the current time.

Vessel newbuild prices continue to be significantly above those prices that were available throughout 2019, 2020 and 2021 and the Partnership expects this to continue for the foreseeable future due to heavy ordering of other types of vessels, notably in the LNG and container vessel markets. Such higher newbuild prices assist the competitiveness of the Partnership’s fleet during charter renewal discussions, where the ordering of a newbuild vessel might otherwise be a competitively priced alternative.


Contacts

Questions should be directed to: 
Gary Chapman (by telephone +44 1224 618 420, or via email at This email address is being protected from spambots. You need JavaScript enabled to view it.)


Read full story here

SAN DIEGO--(BUSINESS WIRE)--$DFCO #BrianBonar--Dalrada Corporation (OTCQB: DFCO, “Dalrada”) is privileged to announce that the Company’s clean energy subsidiary Likido® is earning serious interest from major commercial entities and top-federal agencies.


Recent attention comes from governmental bodies recognizing Likido®ONE’s heat pump capabilities that produce “clean” energy – at a rate seven times more efficient than traditional water heaters and boilers while reducing energy consumption up to 75%. Interest in the unique heat pump stems from aggressive cost-cutting goals in federal buildings and market transformation with new carbon-reducing technologies.

The U.S. government is committed to sustainability and interagency collaboration for clean energy initiatives like Net Zero by 2050, and recent global developments accelerated those efforts. The current administration’s renewed push for clean energy shifts America from dependence on certain petrostates.

Exponentially-rising oil and natural gas costs, and potential embargos, will ultimately prevent the import of fuel sources from oil-rich areas, particularly in Europe. Outside of the U.S., other leading nations are expected to follow suit as a means of jumpstarting energy transition efforts.

At a time when all energy sources are in high demand, to combat worldwide shortages and high prices, fossil fuels may once again be viewed to provide energy. Likido® provides readily-available energy and cost-efficient heat pumps that run on alternative fuel sources, not depending solely on natural gas, reduces carbon footprints, and drives global sustainability initiatives.

According to Dalrada Founder & CEO, Brian Bonar, “Recognition as a global leader in clean energy is an honor. It’s our mission to create innovation that positively impacts the world and meets sustainability needs head-on. Becoming a true solution in this space while directly addressing noble and just causes – like our current situation – is what drives Likido® forward.”

Dalrada leads with disruptive advanced technology solutions to reduce time and expense to market as an alternative to greenhouse gas-producing energy sources that contain fossil fuels. These innovative resources enable institutions, industries, businesses, and government agencies to implement long-term clean energy and Net Zero sustainability initiatives by or before 2050.

Dalrada continuously creates innovative, impactful solutions to address the complex challenges of today and the future. To learn more about Dalrada Corporation, please visit www.Dalrada.com.

About Dalrada (DFCO)

With perseverance, valor, dedication, and vision, Dalrada Corporation is dedicated to tackling worldwide challenges of today and tomorrow.

Dalrada is a global company that operates under the tenet of creating impactful innovations that matter for the world. The Company works continually to produce disruptive solutions that bridge the gap of accessibility and accelerate positive change for current and future generations.

Established in 1982, the Company has since grown its footprint to include the business divisions: Dalrada Health, Dalrada Precision, and Dalrada Technologies. Each of Dalrada's subsidiaries actively produces affordable and accessible world-class solutions to global problems. For more information, please visit www.dalrada.com.

Disclaimer

Statements in this press release that are not historical facts, the statements are forward-looking, including statements regarding future revenues and sales projections, plans for future financing, the ability to meet operational milestones, marketing arrangements and plans, and shipments to and regulatory approvals in international markets. Such statements reflect management's current views, are based on certain assumptions, and involve risks and uncertainties. Actual results, events, or performance may differ materially from the above forward-looking statements due to important factors and will be dependent upon a variety of factors including, but not limited to, our ability to obtain additional financing that will allow us to continue our current and future operations and whether demand for our products and services in domestic and international markets will continue to expand. The Company undertakes no obligation to publicly update these forward-looking statements to reflect events or circumstances that occur after the date hereof or to reflect any change in the Company's expectations regarding these forward-looking statements or the occurrence of unanticipated events. Factors that may impact the Company's success are more fully disclosed in the Company's most recent public filings with the US Securities and Exchange Commission ("SEC"), including its annual report on Form 10-K.


Contacts

Denise Mahaffey
858.283.1253
This email address is being protected from spambots. You need JavaScript enabled to view it.

  • Maersk and WasteFuel have today announced a groundbreaking agreement focused on using green methanol at-scale.
  • Maersk intends to purchase over 30,000 tons per year of WasteFuel to fuel its vessels from 2024 on.
  • The order will support the fueling of 12 new green methanol powered Maersk ships – each with a 16,000-container capacity.

COPENHAGEN & LOS ANGELES--(BUSINESS WIRE)--#biomethanol--WasteFuel and Maersk have today announced a commercial-scale bio-methanol partnership, which is set to help accelerate the decarbonisation of the shipping sector.


Maersk intends to buy 30,000 tons per year of WasteFuel bio-methanol, an order to help fulfil the demand of its 12 new green methanol powered ships planned to be operational by 2024.

Initially this green methanol will be made from the conversion of municipal waste in South America by 2024, but both partners expect expanding projects and production of green methanol further.

This announcement builds upon Maersk Growth’s investment in WasteFuel last year, under Its decarbonisation theme, as part of Maersk's strategy to reach net zero by 2040.

This partnership has significant implications for some of the largest consumer product businesses in the world, with green fuel set to reduce the emissions footprint of the products bought and shipped globally.

Speaking from Copenhagen, Denmark, Henriette Hallberg Thygesen, CEO of Fleet & Strategic Brands, A.P. Moller – Maersk said, “To drive the massive scale-up of green fuels we need to transition towards decarbonisation, production must increase in time. Green methanol is the only market-ready sustainable fuel available today for shipping and production must be accelerated through collaboration across the ecosystem and around the world. That is why these partnerships mark an important milestone to get the transition to green energy underway.”

Speaking from WasteFuel’s headquarters in Los Angeles, California, Trevor Neilson, Co-founder, Chairman and CEO said, "Last year, many of the world’s largest companies including Amazon, Ikea, Apple, Nestle and Patagonia pledged to reach net-zero emissions by 2050. Ships transport nearly as much as 90% of globally traded goods by volume and produce nearly 1.1 billion tons of carbon dioxide emissions, which rivals the annual output of Germany, the world’s sixth-largest emitter. Without green fuel solutions, corporate net-zero commitments will be impossible to meet."

Compared to conventional fuels, WasteFuel aims for its marine fuels to reduce CO2 emissions by 95%, to cut Nitrogen Oxide emissions by up to 80%, and to eliminate sulphur oxide and particulate matter emissions.

Maersk Growth, the Corporate Venture arm of A.P. Moller – Maersk announced their investment in WasteFuel in September 2021. With their investment, Morten Bo Christiansen, VP and Head of Decarbonisation at A.P. Moller – Maersk joined Trevor Neilson, Guillaume Lucci, Par Lindstrom, Bradley Ferrell, and Guy Oseary on WasteFuel’s Board of Directors.

WasteFuel, using proven technologies to convert waste - which would otherwise decompose releasing greenhouse gasses - into low carbon fuels, is driving solutions to decarbonise air, land, and sea transport. In addition to the green methanol project with Maersk, the company has several biorefinery projects underway including a project in the Philippines to produce Sustainable Aviation Fuel and bio-methanol in partnership with Prime Infra and NetJets and projects across the Americas and Asia to produce Renewable Natural Gas and green methanol.

About WasteFuel

WasteFuel uses proven technologies to address the climate emergency and revolutionise mobility. We convert municipal (trash) and agricultural waste into low-carbon fuels, renewable natural gas, and green methanol.

WasteFuel investors include Maersk, Marc Benioff’s TIME Ventures, i(x) Net Zero, NetJets, Prime Infra, Guy Oseary, and Aileen Getty.

For more information visit: www.wastefuel.com.


Contacts

Abby Pick
This email address is being protected from spambots. You need JavaScript enabled to view it.

MONTREAL--(BUSINESS WIRE)--Today, Montreal-based AON3D announced their AON M2+ High Temperature Industrial 3D Printer will be receiving an optional firmware upgrade to enable Duplication Mode and Mirror Mode 3D printing. This powerful new feature will double the output of new and existing M2+ machines to meet the growing demands of factory floors. Combined with ungated access to the world’s most advanced thermoplastics, largest-in-class build volume, and features that minimize part post-processing, the AON M2+ continues to be the agile manufacturing solution of choice by companies globally — capable of producing functional end-use parts at scale in half the time compared to any other high temperature 3D printer.


With this upgrade, the AON M2+ will be able to print two of the same part, or two mirrored parts concurrently via an Independent Dual Extrusion (IDEX) system, doubling the machine’s output. In addition to increased production capabilities, the IDEX system provides greater design freedom, such as the ability to print large internal geometries and non-liner holes with water-soluble support options, while reducing labor intensive post-processing.

Unlike other 3D printers with IDEX currently available, the AON M2+ is also capable of printing high-performance materials, like PEEK, PEKK, and ULTEM™, which offer some of the strongest and best material properties currently available in 3D printing including:

  • Higher strength to weight ratio than many metals
  • High heat resistance - Continuous use temperatures up to 260°C
  • High chemical & hydrocarbon resistance
  • Low friction / high wear resistance
  • And many other benefits

With the Duplication Mode upgrade, the AON M2+ offers twice the size, twice the output, and more material options than any sub-$60k high temperature 3D printer on the market. Duplication and Mirror Mode are expected to be available via firmware upgrade by fall of this year. Existing AON M2+ customers on a success plan will receive the update free of charge. To learn more about the AON M2+, easy financing options, and high-performance material options, please visit AON3D.com.

About AON3D

Founded in 2015 by a team of materials engineers, AON3D is a Montreal-based additive manufacturing hardware, software, and material science company.

Our solutions drive innovation for hundreds of companies in 25+ countries, ranging from small businesses to multi-national Fortune 500 corporations and government agencies.


Contacts

Media:
Eric Beardslee
719-650-1554
This email address is being protected from spambots. You need JavaScript enabled to view it.

Offshore Source Logo

Offshore Source keeps you updated with relevant information concerning the Offshore Energy Sector.

Any views or opinions represented on this website belong solely to the author and do not represent those of the people, institutions or organizations that Offshore Source or collaborators may or may not have been associated with in a professional or personal capacity, unless explicitly stated.

Corporate Offices

Technology Systems Corporation
8502 SW Kansas Ave
Stuart, FL 34997

info@tscpublishing.com