Business Wire News

BUFFALO, N.Y.--(BUSINESS WIRE)--Gibraltar Industries, Inc. (Nasdaq: ROCK), a leading manufacturer and provider of products and services for the renewable energy, residential, agtech and infrastructure markets, announced today that its Board of Directors has authorized a share repurchase program of up to $200 million of common stock. The program has a duration of three years, ending May 2, 2025.


“The volatility in our stock price has at times presented attractive buying opportunities, and therefore we asked our Board to authorize this share repurchase program,” Chairman and CEO Bill Bosway stated. “Given the strength of our balance sheet and our expectation that we will generate increasing cash flow in 2022 and in the coming years, we have sufficient liquidity to both invest in our operations and to offer incremental returns to shareholders.”

Common stock repurchases will be funded with available cash generated from operations opportunistically supplemented by borrowing under the existing credit facility. Gibraltar may repurchase shares from time to time through open market purchases, in privately negotiated transactions or by other means, including through the use of trading plans intended to qualify under Rule 10b5-1 under the Securities Exchange Act of 1934, as amended. The method, timing and amount of future repurchases are subject to business and market conditions, corporate and regulatory requirements, stock price, acquisition opportunities and other factors. The share repurchase program does not obligate the Company to purchase any particular amount of common stock, and the program may be suspended or terminated by Gibraltar at any time at its discretion without prior notice.

About Gibraltar
Gibraltar is a leading manufacturer and provider of products and services for the renewable energy, residential, agtech, and infrastructure markets. Gibraltar’s mission, to make life better for people and the planet, is fueled by advancing the disciplines of engineering, science, and technology. Gibraltar is innovating to reshape critical markets in comfortable living, sustainable power, and productive growing throughout North America. For more please visit www.gibraltar1.com.

Forward-Looking Statements

Certain information set forth in this news release, other than historical statements, contains “forward-looking statements” within the meaning of the Private Securities Litigation Reform Act of 1995 that are based, in whole or in part, on current expectations, estimates, forecasts, and projections about the Company’s business, and management’s beliefs about future operations, results, and financial position. These statements are not guarantees of future performance and are subject to a number of risk factors, uncertainties, and assumptions, such as, but not limited to, those described in the “Risk Factors” disclosures in our most recent Annual Report on Form 10-K along with Item 1A of our most recent Quarterly Report on Form 10-Q. Actual events, performance, or results could differ materially from the anticipated events, performance, or results expressed or implied by such forward-looking statements. Before making any investment decisions regarding our company, we strongly advise you to read the section described above from our annual and quarterly reports entitled “Risk Factors” which can be accessed under the “SEC Filings” link of the “Investor Info” page of our website at www.Gibraltar1.com. The Company undertakes no obligation to update any forward-looking statements, whether as a result of new information, future events or otherwise, except as may be required by applicable law or regulation.


Contacts

LHA Investor Relations
Carolyn Capaccio/Jody Burfening
(212) 838-3777
This email address is being protected from spambots. You need JavaScript enabled to view it.

International segments drive solid performance offsetting impact of winter season on domestic dry-bulk business


ST. CATHARINES, Ontario--(BUSINESS WIRE)--#yourmarinecarrierofchoice--Algoma Central Corporation (TSX: ALC) today reported its results for the three months ended March 31, 2022. Revenues increased 10% to $85,103, compared to $77,599 in 2021. The Company reported a 13% improvement in net loss and a 68% improvement in EBITDA(1). Due to the closing of the canal system and the winter weather conditions on the Great Lakes - St. Lawrence Seaway, the majority of the Domestic Dry-Bulk fleet does not operate for most of the first quarter. All amounts reported below are in thousands of Canadian dollars, except for per share data and where the context dictates otherwise.

"Our first quarter results confirms the strength of our diversified business portfolio and the benefits of our growth in international markets," said Gregg Ruhl, President and CEO of Algoma Central Corporation. "Our Ocean Self-Unloader and Global Short Sea fleets generated strong results this quarter. Both segments are continuing to experience steady freight rates and we are seeing improved customer demand in most sectors. Although the majority of our domestic fleet was laid-up during the first quarter, our teams were busy conducting our winter maintenance program and preparing our fleet for the season. We also had some of our domestic vessels running in parts of the system during the first quarter and a shout out to those who weathered the elements to ensure that essential cargo, like road salt, was delivered," concluded Mr. Ruhl.

Financial Highlights: First Quarter 2022 Compared to 2021

  • Net loss improved 13% to $19,571 compared to $22,416. Basic and diluted loss per share were $0.52 compared to $0.59.
  • Global Short Sea Shipping segment equity earnings increased 73% to $2,500 compared to $1,444. The earnings improvement was driven by very strong charter rates realized in the mini-bulker sector.
  • The Ocean Self-Unloader segment revenue increased 24% to $40,321 compared to $32,496 driven by higher fuel cost recoveries and a 14% increase in revenue days due to fewer dry-dockings compared to the first quarter of 2021. Operating earnings increased 40% to $6,108 compared to $4,369.
  • Domestic Dry-Bulk segment revenue was essentially flat at $24,588 compared to $24,552, reflecting similar year-over-year revenue days. Operating loss improved 8% to $27,220 compared to $29,686 driven by lower operating costs.
  • Revenue for Product Tankers decreased 1% to $18,036 compared to $18,217. This was due to the reduction in customer demand from our major customer, offset by higher fuel cost recoveries. Operating earnings decreased to a loss of $1,559 compared to earnings of $224 driven by a 7.5% reduction in revenue days and higher fuel prices.

Consolidated Statement of Earnings

For the years ended December 31


2022


2021

Revenue


$

85,103


$

77,599


Operating expenses


(86,558

)


(81,289

)

Selling, general and administrative


(8,411

)


(8,510

)

Other operating item


300


Depreciation and amortization


(16,745

)


(17,493

)

Operating loss


(26,611

)


(29,393

)


Interest expense


(4,985

)


(5,317

)

Interest income


11


27


Foreign currency (loss) gain


(607

)


53


(32,192

)


(34,630

)


Income tax recovery


10,157


10,742


Net earnings from investments in joint ventures


2,464


1,472


Net Loss


$

(19,571

)


$

(22,416

)

Basic loss per share


$

(0.52

)


$

(0.59

)

Diluted loss per share


$

(0.52

)


$

(0.59

)

EBITDA(1)

The Company uses EBITDA as a measure of the cash generating capacity of its businesses. The following table provides a reconciliation of net earnings in accordance with GAAP to the non-GAAP EBITDA measure for the three months ended March 31, 2022 and 2021 and presented herein:

EBITDA(1)


Three Months Ended

For the periods ended March 31


2022


2021

Net loss


$

(19,571

)


$

(22,416

)

Depreciation and amortization


21,554


21,270


Interest and taxes


(4,627

)


(4,787

)

Foreign exchange loss (gain)


522


(210

)

Other operating item


(300

)

Loss (gain) on sale of vessels


2


(208

)

EBITDA


$

(2,120

)


$

(6,651

)

Select Financial Performance by Business Segment

For the periods ended March 31


2022


2021

Domestic Dry-Bulk


Revenue


$

24,588


$

24,552


Operating loss


(27,220

)


(29,686

)

Product Tankers


Revenue


18,036


18,217


Operating (loss) earnings


(1,559

)


224


Ocean Self-Unloaders


Revenue


40,321


32,496


Operating earnings


6,108


4,369


Corporate and Other


Revenue


2,158


2,334


Operating loss


(3,940

)


(4,300

)

The MD&A for the three months ended March 31, 2022 and 2021 includes further details. Full results for the three months ended March 31, 2022 and 2021 can be found on the Company’s website at www.algonet.com/investor-relations or on SEDAR at www.sedar.com.

2022 Business Outlook(2)

In the Domestic Dry-Bulk segment, the impact of the drought in Western Canada is a significant factor in 2022. We currently expect reduced grain volumes, at least until the 2022 fall harvest. Reduced grain volumes will impact the efficiency of some of our trade routes in the spring and summer and we have adjusted the pace of our vessel fit-out schedule to match vessel capacity to customer demand. In the near term, other commodities may also be affected by changing global trading patterns, resulting primarily from the war in Ukraine, and may cause some incremental demand from our customers. We are preparing to be as nimble as possible to respond to shifting customer requirements.

We expect Product Tanker utilization in 2022 to be similar to 2021 as our customers continue to recover from the impact that COVID-19 has had on the demand for wholesale petroleum products.

Vessel supply at the Pool level is fairly well balanced for the remainder of the year. We are not currently expecting much impact from the war in Ukraine on the Pool business, aside from the effect of oil prices. Two Algoma vessels have significant dry-dockings later in the year. We remain optimistic that cargo volumes will grow gradually.

We are anticipating solid charter rates for the next quarter, building on a very strong first quarter market for the mini-bulker fleet, followed by gradual normalization over for the remainder of 2022. This outlook could change rapidly if global markets slow considerably. The cement sector is expected to remain steady for the 2022 season and we are expecting the third of three newly acquired cement carriers to be delivered in late June. Two handy-size bulk carriers will also join the handy-size fleet later this year.

Normal Course Issuer Bid

Effective March 21, 2022, the Company renewed its normal course issuer bid with the intention to purchase, through the facilities of the TSX, up to 1,890,457 of its Common Shares ("Shares") representing approximately 5% of the 37,800,943 Shares which were issued and outstanding as at the close of business on March 9, 2022 (the “NCIB”). No shares have been purchased to date under this NCIB.

Cash Dividends

The Company's Board of Directors have authorized payment of a quarterly dividend to shareholders of $0.17 per common share. The dividend will be paid on June 1, 2022 to shareholders of record on May 18, 2022.

Notes

(1) Use of Non-GAAP Measures

The Company uses several financial measures to assess its performance including earnings before interest, income taxes, depreciation, and amortization (EBITDA), free cash flow, return on equity, and adjusted performance measures. Some of these measures are not calculated in accordance with Generally Accepted Accounting Principles (GAAP), which are based on International Financial Reporting Standards (IFRS) as issued by the International Accounting Standards Board (IASB), are not defined by GAAP, and do not have standardized meanings that would ensure consistency and comparability among companies using these measures. From Management’s perspective, these non-GAAP measures are useful measures of performance as they provide readers with a better understanding of how management assesses performance. Further information on Non-GAAP measures please refer to page 2 in the Company's Management's Discussion and Analysis for the three months ended March 31, 2022.

(2) Forward-Looking Statements

Algoma Central Corporation’s public communications often include written or oral forward-looking statements. Statements of this type are included in this document and may be included in other filings with Canadian securities regulators or in other communications. All such statements are made pursuant to the safe harbour provisions of any applicable Canadian securities legislation. Forward-looking statements may involve, but are not limited to, comments with respect to our objectives and priorities for 2023 and beyond, our strategies or future actions, our targets, expectations for our financial condition or share price and the results of or outlook for our operations or for the Canadian, U.S. and global economies. The words "may", "will", "would", "should", "could", "expects", "plans", "intends", "trends", "indications", "anticipates", "believes", "estimates", "predicts", "likely" or "potential" or the negative or other variations of these words or other comparable words or phrases, are intended to identify forward-looking statements.

By their nature, forward-looking statements require us to make assumptions and are subject to inherent risks and uncertainties. There is significant risk that predictions, forecasts, conclusions or projections will not prove to be accurate, that our assumptions may not be correct and that actual results may differ materially from such predictions, forecasts, conclusions or projections. We caution readers of this document not to place undue reliance on our forward-looking statements as a number of factors could cause actual future results, conditions, actions or events to differ materially from the targets, expectations, estimates or intentions expressed in the forward-looking statements.

Algoma owns and operates the largest fleet of dry and liquid bulk carriers operating on the Great Lakes - St. Lawrence Waterway, including self-unloading dry-bulk carriers, gearless dry-bulk carriers and product tankers. Since 2010 we have introduced 10 new build vessels to our domestic dry-bulk fleet, with one under construction and expected to arrive in 2024, making us the youngest, most efficient and environmentally sustainable fleet on the Great Lakes. Each new vessel reduces carbon emissions on average by 40% versus the ship replaced. Algoma also owns ocean self-unloading dry-bulk vessels operating in international markets and a 50% interest in NovaAlgoma, which owns and operates a diversified portfolio of dry-bulk fleets serving customers internationally. Algoma truly is Your Marine Carrier of Choice™. For more information about Algoma, visit the Company's website at www.algonet.com.


Contacts

Gregg A. Ruhl
President & CEO
905-687-7890

Peter D. Winkley
Chief Financial Officer
905-687-7897

Addition of microgrid-ready system designed to provide annual utility cost savings of $125,000

FRAMINGHAM, Mass. & FORT DETRICK, Md.--(BUSINESS WIRE)--#batteryenergystorage--Ameresco, Inc., (NYSE: AMRC), a leading cleantech integrator specializing in energy efficiency and renewable energy, today announced that the U.S. Army has awarded its Federal Solutions Group a contract to add a comprehensive battery energy storage system (BESS) to the existing 18.6 megawatt (MW) direct current (15.0 MW alternating current) solar renewable energy facility at the Fort Detrick Army Garrison in Frederick, Maryland.


In partnership with DLA Energy, Ameresco will deploy a 6 MW / 6 MWh BESS on the 67-acre facility. The BESS will be operated as a demand response asset and will provide frequency regulation services to the PJM-Independent System Operator. Additionally, the installed system will be microgrid-ready, allowing for future resiliency functions at the Garrison. The BESS is designed to provide guaranteed utility cost savings of $125,000 annually to the Government.

“We have been working with Ameresco to continually reduce our facilities’ fossil-fuel energy consumption and ensure greener environmental strategies for years to come,” said Garrison Commander Col. Danford Bryant. “This is a great project and an excellent example of collaboration to support both the Army and the community,” said Bryant.

“The new BESS aligns with the Army’s Installation Energy and Water Strategic Plan to provide resilient, efficient and affordable energy on our installations,” said Mr. Paul Farnan, Acting Assistant Secretary of the Army for Installations, Energy and Environment. “It is designed to help reach future resiliency goals, and directly aligns with the Army Installations Strategy and the Army Climate Strategy,” said Farnan.

Ameresco’s relationship with the Fort Detrick Army Garrison dates back to 2015 when it was awarded a 26-year Renewable Energy Supply Agreement (RESA) and site lease to design, build, finance, and operate and maintain the 18.6 MW-dc solar renewable energy generation system (REGS). The solar field, which includes 59,994 solar panels, nine central inverters and transformers, and medium-voltage overhead and underground electric distribution, was completed in 2016, one month ahead of schedule. It currently serves approximately 12 percent of Fort Detrick’s annual electric load requirements.

“We commend the Army for taking yet another step to improve their energy infrastructure through battery energy storage technologies at Fort Detrick,” said Nicole Bulgarino, Executive Vice President, Ameresco. “This installation ties in the renewable energy generation from the existing solar arrays to a system that will allow the base to be microgrid-ready, ultimately creating a more resilient and future-energy ready base.”

Project completion is scheduled for early 2023.

To learn more about the renewable energy, resiliency, and energy efficiency solutions offered by Ameresco, visit www.ameresco.com/renewable-energy/.

About Ameresco, Inc.
Founded in 2000, Ameresco, Inc. (NYSE:AMRC) is a leading cleantech integrator and renewable energy asset developer, owner and operator. Our comprehensive portfolio includes energy efficiency, infrastructure upgrades, asset sustainability and renewable energy solutions delivered to clients throughout North America and Europe. Ameresco’s sustainability services in support of clients’ pursuit of Net Zero include upgrades to a facility’s energy infrastructure and the development, construction, and operation of distributed energy resources. Ameresco has successfully completed energy saving, environmentally responsible projects with Federal, state and local governments, healthcare and educational institutions, housing authorities, and commercial and industrial customers. With its corporate headquarters in Framingham, MA, Ameresco has more than 1,000 employees providing local expertise in the United States, Canada, and Europe. For more information, visit www.ameresco.com.

About Fort Detrick
Originally known as Detrick Field, it operated as an emergency airfield on the route between Cleveland and Washington, DC until 1938. During World War II (WWII), Camp Detrick became the site of biological warfare research. After WWII, the post was re-designated as Fort Detrick with a mandate to continue biological research and remain the world’s leading research campus for biological agents that require special containment.

About the Army Office of Energy Initiatives (OEI)
The OEI, under the Assistant Secretary of the Army for Installations, Energy and Environment, serves as the Army’s central program management office for the development, implementation, and oversight of privately financed, large-scale, energy projects focused on enhancing energy resilience on Army installations.

About United States Army Corps of Engineers (USACE)
The U.S. Army Corps of Engineers has approximately 37,000 dedicated Civilians and Soldiers delivering engineering services to customers in more than 130 countries worldwide. With environmental sustainability as a guiding principle, our disciplined Corps team is working diligently to strengthen our Nation’s security by building and maintaining America’s infrastructure and providing military facilities where our servicemembers train, work and live. We are also researching and developing technology for our war fighters while protecting America’s interests abroad by using our engineering expertise to promote stability and improve quality of life.

About DLA Energy
The Defense Logistics Agency Energy’s mission is to enable mission readiness by providing globally resilient energy solutions to the Warfighter and Whole of Government. DLA Energy is organized to work with customers and suppliers to accomplish all areas of its mission. DLA Energy Installation Energy Division provides acquisition support for facility energy commodities and services including coal, natural gas, electricity, renewable energy, energy savings performance contracts and long-term renewable energy project development. The business unit also serves as coordinator and facilitator for the DOD’s participation in electricity demand response programs and is the centralized program manager for DOD’s Natural Gas Program.

The announcement of an energy asset award is not necessarily indicative of the timing or amount of revenue from such award, of the company’s overall revenue for any particular period or of trends in the company’s overall total assets in development or operation. This project was included in our previously reported assets in development as of March 31, 2022.


Contacts

Media:
Ameresco: Leila Dillon, 508-661-2264, This email address is being protected from spambots. You need JavaScript enabled to view it.

DUBLIN--(BUSINESS WIRE)--The "Global Emission Management Software Market By Component (Software and Services), By Industry (Manufacturing, IT & Telecom, Government Sector, Energy & Power, and Others), By Regional Outlook, Industry Analysis Report and Forecast, 2021 - 2027" report has been added to ResearchAndMarkets.com's offering.


The Global Emission Management Software Market size is expected to reach $25.43 billion by 2027, rising at a market growth of 17.5% CAGR during the forecast period.

A software that helps companies to manage the processes related to the emissions of the industrial facilities or complicated sites is termed as emission management software. This software consists of the provision of functionality needed for industrial operations and for corporate demands like environmental reporting or KPI (Key Performance Indicator) supervising. Emission management software combines processes and people across various industrial units, which is expected to substantially contribute to risk mitigation.

The major functions of the emission management software are managing compliance with legal permits & regulations that implement critical operational boundaries and financial risks for industrial & non-industrial operation sites.

In addition, the ability of the solution to evaluate emissions prediction scenarios helps in making this software a tool for all kinds of planning and strategic decision items on an operational and corporate level, which is expected to attract more companies for its usage.

By using emission management software, enterprises can reduce the chances of human error, carry out efficient situation analysis, report and decrease the GHG (Green House Gases) emissions at all levels.

Market Growth Factors:

Efficient management and monitoring capabilities of emission management software

By using advanced emission management software, companies and manufacturing units can monitor their greenhouse and carbon emissions precisely and in real-time legacy emission management. In addition, this software can make it easier for the management to look after the emission stages in real-time as per the government compliances.

The growing popularity of sustainable development

The rising popularity of sustainable development among governments is expected to increase their emphasis on the sustainable development of the region. According to a study published by International Energy Agency (IEA), about 31.5 Giga tons CO2 was generated across the world during the year 2020. This huge number of emissions is expected to increase the concerns of the authorities and thus, fuel the demand and growth of the emission management software market over the forecast period.

Market Restraining Factor:

High cost of management and implementation

The initial cost of deployment of emission management software is relatively high since this software is made to support all the possible processes related to emissions in the large-scale industries. In addition, there are several companies that are finding it difficult to implement this software due to the lack of proper infrastructure used to maintain and efficiently operate this software for better operational productivity.

Market Segments Covered in the Report:

By Component

  • Software
    • Data Management
    • Asset Performance Optimization
    • Application Platform
    • Forecasting Analytics
    • Dashboard Tools
  • Services
    • Consulting & Training
    • Support & Maintenance

By Industry

  • Manufacturing
  • IT & Telecom
  • Government Sector
  • Energy & Power
  • Others

By Geography

  • North America
  • US
  • Canada
  • Mexico
  • Rest of North America
  • Europe
  • Germany
  • UK
  • France
  • Russia
  • Spain
  • Italy
  • Rest of Europe
  • Asia Pacific
  • China
  • Japan
  • India
  • South Korea
  • Singapore
  • Malaysia
  • Rest of Asia Pacific
  • LAMEA
  • Brazil
  • Argentina
  • UAE
  • Saudi Arabia
  • South Africa
  • Nigeria
  • Rest of LAMEA

Key Market Players

  • IBM Corporation
  • SAP SE
  • Accenture PLC
  • Broadcom, Inc. (CA Technologies, Inc.)
  • NortonLifeLock, Inc.
  • Fortive Corporation
  • Greenstone plus
  • Cority Software, Inc. (Thoma Bravo)
  • Foresite Systems

For more information about this report visit https://www.researchandmarkets.com/r/s4sdfa


Contacts

ResearchAndMarkets.com
Laura Wood, Senior Press Manager
This email address is being protected from spambots. You need JavaScript enabled to view it.

For E.S.T Office Hours Call 1-917-300-0470
For U.S./CAN Toll Free Call 1-800-526-8630
For GMT Office Hours Call +353-1-416-8900

  • Reports Q1 Revenues of $1.17 Billion with Strong Demand Across Core Businesses
  • Generates Q1 Net Income of $45.3 Million, or EPS of $0.83
  • Achieves Q1 Adjusted EBITDA Growth of 39% to $180.3 Million with Margin of 15.4%
  • Raises 2022 Adjusted EBITDA Guidance

NORWELL, Mass.--(BUSINESS WIRE)--Clean Harbors, Inc. (“Clean Harbors”) (NYSE: CLH), the leading provider of environmental and industrial services throughout North America, today announced financial results for the first quarter ended March 31, 2022.

We opened 2022 with a strong first-quarter on robust demand for our services and sustainable products,” said Alan S. McKim, Chairman, President and Chief Executive Officer. “Our record revenue and Adjusted EBITDA in the quarter reflected a continuation of the momentum that supported our business throughout 2021, including demand for our hazardous waste disposal capabilities, industrial services and re-refined products, as well as our October 2021 acquisition of HydroChemPSC (“HPC”). We executed effectively, navigating supply and inflation challenges through a combination of intelligent pricing programs and cost-control initiatives. Most importantly, we achieved a Total Recordable Incident Rate (TRIR) of 0.97 – underscoring the team’s unwavering commitment to safety.”

First-Quarter Results

Revenues increased 45% to $1.17 billion from $808.1 million in the same period of 2021. Income from operations grew 71% to $87.1 million from $50.9 million in the first quarter of 2021.

Net income was $45.3 million, or $0.83 per diluted share. This compared with net income of $21.7 million, or $0.39 per diluted share, for the same period in 2021. Adjusted for certain items in both periods, adjusted net income was $45.4 million, or $0.83 per diluted share, for the first quarter of 2022, compared with adjusted net income of $23.4 million, or $0.42 per diluted share, for the same period of 2021. (See reconciliation tables below).

Adjusted EBITDA (see description below) increased 39% to $180.3 million from $129.5 million in the same period of 2021. There were no benefits from government assistance programs in the first quarter of 2022, compared with a combined $5.4 million in benefits from Canadian and U.S. government programs in the same period of 2021.

Q1 2022 Segment Review

Environmental Services (ES) revenues increased 45% year-over-year, reflecting the contribution of HPC, higher volumes in our disposal and recycling facilities, pricing initiatives and steady demand across our service businesses,” McKim said. “Utilization of our incinerator network was 85% in the quarter, up five points from the prior year when utilization was negatively impacted by a deep freeze in the Gulf region. Average incineration pricing was up slightly from a year ago, reflecting the mix of waste in the quarter that included some project volumes. A modest pickup in remediation projects helped increase our landfill volumes by 14%. Safety-Kleen Environmental continued its growth trajectory, increasing 9% through pricing and new business wins across its core service offerings. Our Industrial Services business grew substantially with the addition of HPC, and we exited the quarter with significant momentum into the spring turnaround season.

Safety-Kleen Sustainability Solutions (SKSS) revenues grew 44% while our Adjusted EBITDA rose 64% from a year ago,” McKim said. “Although Q1 is typically a seasonally weaker quarter for SKSS, demand for our base oil and blended products was consistently strong in the quarter. Global supply disruptions led to favorable market dynamics in the U.S. and substantial price increases late in the quarter. In addition to the higher pricing on the back end of our re-refining spread, we continued to actively manage the front end to minimize collection costs while maintaining collection volumes. SKSS collected 53 million gallons of waste oil in the quarter, up 13% from a year ago.”

Business Outlook and Financial Guidance

We saw steady demand across our key lines of business to start this year; underlying market conditions driving that demand should enable to us to extend – or even accelerate – that momentum in the coming quarters,” McKim said. “Within our disposal network, we have a healthy backlog of volume as evidenced by our record level of deferred revenue at the end of Q1. A robust pipeline of waste project opportunities should support the growing volumes we are experiencing in our base business. Underlying trends such as U.S. regulations, infrastructure spending, chemical manufacturing and reshoring of multiple industries also provide a promising backdrop for our entire Environmental Services segment. As a result, we are continuing to invest in our plants to increase throughput across our network, including constructing a new incinerator in Nebraska. We are also hiring as rapidly as possible to meet demand, while lowering our third-party costs. In Q1, we added a significant number of employees on a net basis and expect to extend our recruitment efforts in the coming quarters.

Within SKSS, the pricing environment for sustainable base oil and finished lubricant products remains strong, supported by global supply dynamics and the corresponding rise in the value of base oil. We also are continuing to aggressively manage the front end of our re-refining spread. System improvements, greater transportation efficiencies and market-specific pricing are helping counteract rising costs,” McKim concluded. “Not only in SKSS, but across the organization, we are confident that we have pricing and cost reduction strategies in place to offset inflation in 2022. The demand environment is highly favorable across all our core lines of business, and we continue to expect Clean Harbors to deliver strong profitable growth and robust free cash flow this year.”

In the second quarter of 2022, Clean Harbors expects Adjusted EBITDA to increase 25% to 30% from the prior-year period, reflecting the addition of HPC and higher profitability in both the ES and SKSS segments.

Based on its first-quarter 2022 performance and current market conditions, Clean Harbors is raising the midpoint of its 2022 Adjusted EBITDA guidance by $35 million. For the year, the Company now expects:

  • Adjusted EBITDA in the range of $800 million to $830 million. This range is based on anticipated GAAP net income in the range of $225 million to $258 million; and
  • Adjusted free cash flow in the range of $250 million to $290 million, based on anticipated net cash from operating activities in the range of $560 million to $620 million.

Non-GAAP Results

Clean Harbors reports Adjusted EBITDA, which is a non-GAAP financial measure and should not be considered an alternative to net income or other measurements under generally accepted accounting principles (GAAP), but viewed only as a supplement to those measurements. Adjusted EBITDA is not calculated identically by all companies, and therefore the Company’s measurement of Adjusted EBITDA may not be comparable to similarly titled measures reported by other companies. Clean Harbors believes that Adjusted EBITDA provides additional useful information to investors since the Company’s loan covenants are based upon levels of Adjusted EBITDA achieved and management routinely evaluates the performance of its businesses based upon levels of Adjusted EBITDA. The Company defines Adjusted EBITDA in accordance with its existing revolving credit agreement, as described in the following reconciliation showing the differences between reported net income and Adjusted EBITDA for the three months ended March 31, 2022 and 2021 (in thousands, except percentages):


For the Three Months Ended


March 31, 2022


March 31, 2021

Net income

$

45,314


$

21,736


Accretion of environmental liabilities


3,156


2,953


Stock-based compensation


5,712


3,480


Depreciation and amortization


84,298


72,163


Other (income) expense, net


(704

)


1,228


Interest expense, net of interest income


25,017


17,918


Provision for income taxes


17,466


9,973


Adjusted EBITDA

$

180,259


$

129,451


Adjusted EBITDA Margin


15.4

%


16.0

%

This press release includes a discussion of net income and earnings per share adjusted for the impacts of tax-related valuation allowances and other items as identified in the reconciliations provided below. The Company believes that discussion of these additional non-GAAP measures provides investors with meaningful comparisons of current results to prior periods’ results by excluding items that the Company does not believe reflect its fundamental business performance. The following shows the difference between net income and adjusted net income, and the difference between earnings per share and adjusted earnings per share, for the three months ended March 31, 2022 and 2021 (in thousands, except per share amounts):


For the Three Months Ended


March 31, 2022


March 31, 2021

Adjusted net income


Net income

$

45,314


$

21,736

Tax-related valuation allowances and other


114


1,648


Adjusted net income

$

45,428


$

23,384


Adjusted earnings per share


Earnings per share

$

0.83


$

0.39


Tax-related valuation allowances and other


0.03


Adjusted earnings per share

$

0.83


$

0.42


Adjusted Free Cash Flow Reconciliation

Clean Harbors reports adjusted free cash flow, which it considers to be a measurement of liquidity that provides useful information to investors about its ability to generate cash. The Company defines adjusted free cash flow as net cash from operating activities excluding cash impacts of items derived from non-operating activities, less additions to property, plant and equipment plus proceeds from sale and disposal of fixed assets. The Company excludes cash impacts of items derived from non-operating activities such as taxes paid in connection with divestitures. Adjusted free cash flow should not be considered an alternative to net cash from operating activities or other measurements under GAAP. Adjusted free cash flow is not calculated identically by all companies, and therefore the Company’s measurement of adjusted free cash flow may not be comparable to similarly titled measures reported by other companies.

An itemized reconciliation between net cash (used in) from operating activities and adjusted free cash flow is as follows for the three months ended March 31, 2022 and 2021 (in thousands):


For the Three Months Ended


March 31, 2022


March 31, 2021

Adjusted free cash flow


Net cash (used in) from operating activities

$

(38,629

)


$

103,000


Additions to property, plant and equipment


(70,308

)


(41,913

)

Proceeds from sale and disposal of fixed assets


1,320


1,204


Adjusted free cash flow

$

(107,617

)


$

62,291


Adjusted EBITDA Guidance Reconciliation

An itemized reconciliation between projected GAAP net income and projected Adjusted EBITDA is as follows (in millions):


For the Year Ending
December 31, 2022

Projected GAAP net income

$225


to

$258


Adjustments:


Accretion of environmental liabilities

13

to

12

Stock-based compensation

26


to

29


Depreciation and amortization

340


to

330


Interest expense, net

110


to

106


Provision for income taxes

86


to

95


Projected Adjusted EBITDA

$800


to

$830


Adjusted Free Cash Flow Guidance Reconciliation

An itemized reconciliation between projected net cash from operating activities and projected adjusted free cash flow is as follows (in millions):


For the Year Ending
December 31, 2022

Projected net cash from operating activities

$560


to

$620


Additions to property, plant and equipment

(320

)

to

(340

)

Proceeds from sale and disposal of fixed assets

10


to

10


Projected adjusted free cash flow

$250


to

$290


Conference Call Information

Clean Harbors will conduct a conference call for investors today at 9:00 a.m. (ET) to discuss the information contained in this press release. During the call, management will discuss Clean Harbors’ financial results, business outlook and growth strategy. Investors who wish to listen to the webcast and view the accompanying slides should visit the Investor Relations section of the Company’s website at www.cleanharbors.com. The live call also can be accessed by dialing 201.689.8881 or 877.709.8155 prior to the start time. If you are unable to listen to the live conference call, the webcast will be archived on the Company’s website.

About Clean Harbors

Clean Harbors (NYSE: CLH) is North America’s leading provider of environmental and industrial services. The Company serves a diverse customer base, including a majority of Fortune 500 companies. Its customer base spans a number of industries, including chemical, energy and manufacturing, as well as numerous government agencies. These customers rely on Clean Harbors to deliver a broad range of services such as end-to-end hazardous waste management, emergency spill response, industrial cleaning and maintenance, and recycling services. Through its Safety-Kleen subsidiary, Clean Harbors also is North America’s largest re-refiner and recycler of used oil and a leading provider of parts washers and environmental services to commercial, industrial and automotive customers. Founded in 1980 and based in Massachusetts, Clean Harbors operates in the United States, Canada, Mexico, Puerto Rico and India. For more information, visit www.cleanharbors.com.

Safe Harbor Statement

Any statements contained herein that are not historical facts are forward-looking statements within the meaning of the Private Securities Litigation Reform Act of 1995. These forward-looking statements are generally identifiable by use of the words “believes,” “expects,” “intends,” “anticipates,” “plans to,” “seeks,” “should,” “estimates,” “projects,” “may,” “likely,” or similar expressions. Such statements may include, but are not limited to, statements about future financial and operating results, and other statements that are not historical facts. Such statements are based upon the beliefs and expectations of Clean Harbors’ management as of this date only and are subject to certain risks and uncertainties that could cause actual results to differ materially, including, without limitation, those items identified as “Risk Factors” in Clean Harbors’ most recently filed Form 10-K and Form 10-Q. Forward-looking statements are neither historical facts nor assurances of future performance. Therefore, readers are cautioned not to place undue reliance on these forward-looking statements. Clean Harbors undertakes no obligation to revise or publicly release the results of any revision to these forward-looking statements other than through its filings with the Securities and Exchange Commission, which may be viewed in the “Investors” section of Clean Harbors’ website at www.cleanharbors.com.

CLEAN HARBORS, INC. AND SUBSIDIARIES

UNAUDITED CONSOLIDATED STATEMENTS OF OPERATIONS

(in thousands, except per share amounts)


For the Three Months Ended


March 31,
2022


March 31,
2021

Revenues

$

1,169,109


$

808,148


Cost of revenues: (exclusive of items shown separately below)


843,389


560,536


Selling, general and administrative expenses


151,173


121,641


Accretion of environmental liabilities


3,156


2,953


Depreciation and amortization


84,298


72,163


Income from operations


87,093


50,855


Other income (expense), net


704


(1,228

)

Interest expense, net


(25,017

)


(17,918

)

Income before provision for income taxes


62,780


31,709


Provision for income taxes


17,466


9,973


Net income

$

45,314


$

21,736


Earnings per share:


Basic

$

0.83


$

0.40


Diluted

$

0.83


$

0.39


Shares used to compute earnings per share - Basic


54,408


54,723


Shares used to compute earnings per share - Diluted


54,672


55,043


CLEAN HARBORS, INC. AND SUBSIDIARIES

UNAUDITED CONDENSED CONSOLIDATED BALANCE SHEETS

(in thousands)


March 31, 2022

December 31, 2021

Current assets:


Cash and cash equivalents

$

339,584

$

452,575

Short-term marketable securities


75,364


81,724


Accounts receivable, net


900,273


792,734


Unbilled accounts receivable


123,945


94,963


Inventories and supplies


264,733


250,692


Prepaid expenses and other current assets


103,349


68,483


Total current assets


1,807,248


1,741,171


Property, plant and equipment, net


1,881,542


1,863,175


Other assets:


Operating lease right-of-use assets


156,811


161,797


Goodwill


1,221,399


1,227,042


Permits and other intangibles, net


633,445


644,912


Other


25,812


15,602


Total other assets


2,037,467


2,049,353


Total assets

$

5,726,257


$

5,653,699


Current liabilities:


Current portion of long-term debt

$

17,535


$

17,535


Accounts payable


394,152


359,866


Deferred revenue


90,116


83,749


Accrued expenses and other current liabilities


338,835


391,414


Current portion of closure, post-closure and remedial liabilities


26,393


25,136


Current portion of operating lease liabilities


47,108


47,614


Total current liabilities


914,139


925,314


Other liabilities:


Closure and post-closure liabilities, less current portion


92,891


87,088


Remedial liabilities, less current portion


106,144


98,752


Long-term debt, less current portion


2,513,944


2,517,024


Operating lease liabilities, less current portion


113,059


117,991


Deferred tax liabilities


312,668


314,853


Other long-term liabilities


80,175


78,790


Total other liabilities


3,218,881


3,214,498


Total stockholders’ equity, net


1,593,237


1,513,887


Total liabilities and stockholders’ equity

$

5,726,257


$

5,653,699


CLEAN HARBORS, INC. AND SUBSIDIARIES

UNAUDITED CONSOLIDATED STATEMENTS OF CASH FLOWS

(in thousands)


For the Three Months Ended


March 31, 2022

March 31, 2021

Cash flows (used in) from operating activities:


Net income

$

45,314


$

21,736


Adjustments to reconcile net income to net cash (used in) from operating activities:


Depreciation and amortization


84,298


72,163


Allowance for doubtful accounts


3,619


2,446


Amortization of deferred financing costs and debt discount


1,561


900


Accretion of environmental liabilities


3,156


2,953


Changes in environmental liability estimates


312


275


Deferred income taxes


2,226


(39

)

Other (income) expense, net


(704

)


1,228


Stock-based compensation


5,712


3,480


Environmental expenditures


(3,615

)


(3,011

)

Changes in assets and liabilities, net of acquisitions:


Accounts receivable and unbilled accounts receivable


(138,690

)


(9,703

)

Inventories and supplies


(13,610

)


(747

)

Other current and non-current assets


(32,924

)


(9,956

)

Accounts payable


43,001


22,179


Other current and long-term liabilities


(38,285

)


(904

)

Net cash (used in) from operating activities


(38,629

)


103,000


Cash flows used in investing activities:


Additions to property, plant and equipment


(70,308

)


(41,913

)

Proceeds from sale and disposal of fixed assets


1,320


1,204


Acquisitions, net of cash acquired


5,000


(22,918

)

Additions to intangible assets including costs to obtain or renew permits


(321

)


(505

)

Proceeds from sale of available-for-sale securities


10,450


20,375


Purchases of available-for-sale securities


(5,002

)


(42,980

)

Net cash used in investing activities


(58,861

)


(86,737

)

Cash flows used in financing activities:


Change in uncashed checks


(2,295

)


(6,662

)

Tax payments related to withholdings on vested restricted stock


(1,831

)


(3,719

)

Repurchases of common stock


(3,694

)


(26,546

)

Deferred financing costs paid


(291

)


(137

)

Payments on finance leases


(3,585

)


(1,672

)

Principal payments on debt


(4,384

)


(1,884

)

Net cash used in financing activities


(16,080

)


(40,620

)

Effect of exchange rate change on cash


579


1,639


Decrease in cash and cash equivalents


(112,991

)


(22,718

)

Cash and cash equivalents, beginning of period


452,575


519,101


Cash and cash equivalents, end of period

$

339,584


$

496,383


Supplemental information:


Cash payments for interest and income taxes:


Interest paid

$

33,697


$

27,507


Income taxes paid, net of refunds


3,121


3,599


Non-cash investing activities:


Property, plant and equipment accrued


11,397


5,108


Remedial liability assumed in acquisition of property, plant and equipment


13,073


ROU assets obtained in exchange for operating lease liabilities


7,342


2,305


ROU assets obtained in exchange for finance lease liabilities


4,679


9,205


Supplemental Segment Data (in thousands)


For the Three Months Ended

Revenue

March 31, 2022

March 31, 2021


Third Party
Revenues

Intersegment
Revenues
(Expense),
net

Direct
Revenues

Third Party
Revenues

Intersegment
Revenues
(Expense),
net

Direct
Revenues

Environmental Services

$

940,798

$

6,647


$

947,445

$

652,878

$

1,724


$

654,602

Safety-Kleen Sustainability Solutions


228,239


(6,647

)


221,592


155,191


(1,724

)


153,467


Corporate Items


72


72


79


79


Total

$

1,169,109


$


$

1,169,109


$

808,148


$


$

808,148


For the Three Months Ended

Adjusted EBITDA

March 31, 2022

March 31, 2021

Environmental Services

$

183,602


$

140,254


Safety-Kleen Sustainability Solutions


51,877


31,632


Corporate Items


(55,220

)


(42,435

)

Total

$

180,259


$

129,451


Contacts

Michael L. Battles
EVP and Chief Financial Officer
Clean Harbors, Inc.
781.792.5100
This email address is being protected from spambots. You need JavaScript enabled to view it.

Jim Buckley
SVP Investor Relations
Clean Harbors, Inc.
781.792.5100
This email address is being protected from spambots. You need JavaScript enabled to view it.
Drivers as small business owners strategize to put extra money in their pockets

JERSEY CITY, N.J.--(BUSINESS WIRE)--#Buckleup--As the gig economy grows, so do the numbers of people opting to drive – whether to supplement their income for a savings goal, as a second job, or by making driving a full-time career. Each of these drivers operates a small business that must strategize how to put extra money in their pockets. With automotive inflation and gas prices at record highs, drivers are looking at all solutions to be more efficient and save on expenses.


Everyone is impacted by the recent jumps in inflation and gas prices. However, the impact on small businesses is often amplified. While decisions such as hours of operation, or evaluating cost-of-goods-sold expenses like insurance coverage are a given for brick-and-mortar businesses, these same considerations are also true for a less considered small business owner – a rideshare or delivery driver, whose primary costs-of-goods-sold are vehicle depreciation and fuel.

Buckle understands the behaviors of rideshare and delivery drivers through our unique position serving all segments of gig driving. As a small business itself, Buckle knows first-hand the challenges of growing a business in the gig economy,” says Marty Young, CEO and Co-Founder of Buckle, the financial services company dedicated to serving drivers of the gig economy.

Inflation and Gas Prices Shift Driver Behaviors to Different Driving Platforms

As high inflation and gas prices hit their peak in March and April of 2022, Buckle noticed its drivers were making new decisions about their driving. Here's what they observed:

  • During the weeks of March 13 and March 20, 2022 – the same weeks the U.S. national average price of a gallon of gas peaked at over 20-year highs – Buckle observed a shift in more drivers opting for delivery driving over rideshare driving, driven in large part by platform incentives.
  • Drivers began to opt toward shorter, delivery-driving jobs and reduced their time taking rideshare jobs, which can be longer distances that require more gas and vehicle depreciation.
  • Buckle also noted that longer-tenured drivers began to balance their driver workload more fully than before between “long haul” rideshare and “short haul” delivery-driving jobs.
  • Buckle speculates this shift to more delivery driving jobs was an active business decision that helped drivers burn less gas and put fewer miles on their vehicles in the short term.
  • The company also speculates that drivers accepting gigs from multiple rideshare and delivery platforms are able to more easily adjust their driving habits to account for fluctuating economic situations while still making driving a good business.
  • Increasing a driver’s delivery gigs over rideshare driving can, however, present unanticipated challenges for these business owners. One example is the fact that many delivery platforms do not currently offer insurance coverage for their drivers, leaving them potentially underinsured or uninsured in the event of a loss.
  • Since March, Buckle has seen drops in both delivery and rideshare activity. However, with the summer vacation season approaching, Buckle speculates that driving will increase once again as drivers take advantage of the seasonality of rideshare and delivery needs, and inflation spreads through all sectors of the economy.

Video assets are available at: https://spaces.hightail.com/space/iI0ktz490f

About Buckle

Buckle is the digital financial services company providing insurance products for the gig industry. Serving the vital, rising middle class, Buckle protects drivers covering personal, rideshare, and delivery driving for leading companies including Uber, Lyft, DoorDash, Gopuff, Instacart, Amazon Flex, Uber Eats, Grubhub, Favor, Postmates, and more. The company also offers insurance solutions for select partners. Buckle has received awards for 2022 including Best of Insurance, a Fastest Growing Company, Best Tech Startup, and more. Connect with us on Facebook, Twitter, LinkedIn, and www.buckleup.com.


Contacts

Media:
Erica Netzley and Jenny Love
This email address is being protected from spambots. You need JavaScript enabled to view it.
(726) 262-5969

HOUSTON--(BUSINESS WIRE)--Tellurian Inc. (Tellurian) (NYSE American: TELL) ended the first quarter with nearly $300 million in cash on hand and total assets of more than $700 million. During the quarter, Tellurian generated $26 million in revenues from natural gas sales on an increase of production of approximately 24% as compared to the previous quarter. In addition, Tellurian completed its owners’ site preparation and issued a limited notice to proceed to Bechtel to begin construction of the Driftwood LNG terminal.


President and CEO Octávio Simões said, “Tellurian’s own natural gas production and sales provide valuable operating cash and a unique advantage to us as a liquefied natural gas (LNG) supplier. We are nearing net production of 100 million cubic feet equivalent per day (mmcfe/d) and plan to reach 200 mmcfe/d by year end. Tellurian production is now generating free cash flow after capex and we intend to maintain capex at approximately $150 million a year.”

“With Bechtel now onsite beginning construction of Driftwood, we are on schedule to begin LNG production in 2026,” Simões added.

Operating activities

Tellurian produced 6.1 billion cubic feet (Bcf) of natural gas for the quarter ending March 31, 2022 as compared to 4.9 Bcf for the previous quarter. Tellurian’s upstream assets include 13,521 net acres and interests in 82 producing wells as of March 31, 2022.

Financial results

Tellurian ended its first quarter of 2022 with approximately $296 million of cash and cash equivalents and approximately $732 million in total assets. Tellurian generated approximately $26 million in revenues from natural gas sales, compared to $8.7 million in the first quarter 2021. Tellurian reported a net loss of approximately $67 million, or $0.14 per share (basic and diluted), for the three months ended March 31, 2022.

About Tellurian Inc.

Tellurian intends to create value for shareholders by building a low-cost, global natural gas business, profitably delivering natural gas to customers worldwide. Tellurian is developing a portfolio of natural gas production, LNG marketing and trading, and infrastructure that includes an ~ 27.6 mtpa LNG export facility and an associated pipeline. Tellurian is based in Houston, Texas, and its common stock is listed on the NYSE American under the symbol “TELL”.

For more information, please visit www.tellurianinc.com. Follow us on Twitter at twitter.com/TellurianLNG

CAUTIONARY INFORMATION ABOUT FORWARD-LOOKING STATEMENTS

This press release contains forward-looking statements within the meaning of U.S. federal securities laws. The words “anticipate,” “assume,” “believe,” “budget,” “estimate,” “expect,” “forecast,” “initial,” “intend,” “may,” “plan,” “potential,” “project,” “proposed,” “should,” “will,” “would,” and similar expressions are intended to identify forward-looking statements. Forward-looking statements herein relate to, among other things, the capacity, timing, and other aspects of the Driftwood LNG project, future production and future capital expenditures. These statements involve a number of known and unknown risks, which may cause actual results to differ materially from expectations expressed or implied in the forward-looking statements. These risks include the matters discussed in Item 1A of Part I of the Annual Report on Form 10-K of Tellurian for the fiscal year ended December 31, 2021 filed by Tellurian with the Securities and Exchange Commission (the SEC) on February 23, 2022 (the “Annual Report”), and other Tellurian filings with the SEC, all of which are incorporated by reference herein. The forward-looking statements in this press release speak as of the date of this release. Although Tellurian may from time to time voluntarily update its prior forward-looking statements, it disclaims any commitment to do so except as required by securities laws.


Contacts

Media:
Joi Lecznar
EVP Public and Government Affairs
Phone +1.832.962.4044
This email address is being protected from spambots. You need JavaScript enabled to view it.
Investors:
Matt Phillips
Vice President, Investor Relations
Phone +1.832.320.9331
This email address is being protected from spambots. You need JavaScript enabled to view it.

RockCreek-managed fund, in partnership with minority banks and community-based lending institutions, will provide needed capital to help minority-owned businesses grow, create jobs, and expand in underserved and under-resourced communities served by Exelon.

CHICAGO--(BUSINESS WIRE)--Exelon announced today that RockCreek, one of the world’s largest diverse-owned global investment firms, has opened applications for the $36 million Exelon-funded Racial Equity Capital Fund to support minority-owned businesses in Exelon’s service areas in Delaware, the District of Columbia, Maryland, Illinois, New Jersey and Pennsylvania.


Exelon, which serves more than 10 million customers through its six electric and gas utilities, announced last fall that it had partnered with the Exelon Foundation to create the Racial Equity Capital Fund. The fund will help minority businesses obtain capital to fuel growth and spur job opportunities in communities that have historically been underserved, under-resourced, and overlooked by investors and traditional funding sources. The fund will provide loans and equity investments for numerous minority businesses throughout Exelon’s service areas over the next three years, with estimated loan amounts between $100,000 and $300,000, and equity investments of nearly $1 million.

“With this fund, we are empowering small, minority-owned businesses to grow their capacity, increase revenue and hire more employees,” said Calvin Butler, chief operating officer and senior executive vice president of Exelon. “We have identified financial partners who understand the unique challenges these businesses face, but who also share our vision and are eager to reinvigorate the communities we both serve.”

RockCreek has forged partnerships with minority-owned lending institutions and community-based banks to increase the investment capacity of the Racial Equity Capital Fund. The fund will invest in minority-owned businesses who have historically lacked access to capital to sustain operations, grow revenues, create jobs, and increase wellbeing throughout underserved and under-resourced communities.

“Capital is the fuel that allows businesses to grow, create jobs, and strengthen communities, and for too long, minority-owned businesses – and entire communities – have been neglected by financial markets,” said Afsaneh Beschloss, Founder and CEO of RockCreek. “The Racial Equity Capital Fund will bring this critical fuel directly to minority-owned businesses and will continue serving their communities in the years ahead.”

Initial partners in this effort include Providence Bank & Trust; United Bank of Philadelphia; and City First Bank, National Association of Washington, DC. RockCreek continues to seek out and engage with other potential partners throughout Exelon’s service areas.

The partnerships are the next step in the launch of the $36 million initiative, which is funded by Exelon and managed by RockCreek. RockCreek will select businesses for financing and manage the fund to serve as a continuing resource to help grow businesses, create jobs, and strengthen the communities Exelon serves.

Interested businesses can access the application here or contact RockCreek at This email address is being protected from spambots. You need JavaScript enabled to view it. for more information about the program.

About Exelon

Exelon (Nasdaq: EXC) is a Fortune 200 company and the nation’s largest utility company, serving more than 10 million customers through six fully regulated transmission and distribution utilities — Atlantic City Electric (ACE), Baltimore Gas and Electric (BGE), Commonwealth Edison (ComEd), Delmarva Power & Light (DPL), PECO Energy Company (PECO), and Potomac Electric Power Company (Pepco). More than 18,000 Exelon employees dedicate their time and expertise to supporting our communities through reliable, affordable and efficient energy delivery, workforce development, equity, economic development and volunteerism. Follow Exelon on Twitter @Exelon.

About RockCreek

One of the largest woman and diverse-owned global investment firms, RockCreek applies data-driven technology to invest sustainably and inclusively. Founded in 2003 by CEO Afsaneh Beschloss, former Treasurer and Chief Investment Officer of the World Bank, RockCreek has more than $16 billion in assets. RockCreek has invested more than $7.4 billion in diverse firms, including over $990 million in Black owned firms, and $6.3 billion in sustainable investments including climate, health, education, job creation, and affordable housing since its inception. Follow RockCreek on Twitter @RockCreekGroup and on LinkedIn.


Contacts

Exelon Media Hotline
Elizabeth Keating
312-394-7417
This email address is being protected from spambots. You need JavaScript enabled to view it.
RockCreek Communications
Nate Rawlings
(423) 664-3772
This email address is being protected from spambots. You need JavaScript enabled to view it.
HOUSTON--(BUSINESS WIRE)--Cheniere Energy, Inc. (“Cheniere”) (NYSE American: LNG) announced today that its subsidiary, Corpus Christi Liquefaction Stage III, LLC (“Corpus Christi Stage III”), has entered into a long-term Integrated Production Marketing (“IPM”) gas supply agreement with ARC Resources U.S. Corp (“ARC U.S.”), a subsidiary of ARC Resources, Ltd. (TSX: ARX), a leading natural gas producer in Canada.


Under the IPM agreement, ARC U.S. has agreed to sell 140,000 MMBtu per day of natural gas to Corpus Christi Stage III for a term of 15 years, commencing with commercial operations of Train 7 of the Corpus Christi Stage III Project. The LNG associated with this gas supply, approximately 0.85 million tonnes per annum (“mtpa”), will be marketed by Cheniere. Cheniere will pay ARC U.S. an LNG-linked price for its gas, based on the Platts Japan Korea Marker (JKM), after deductions for fixed LNG shipping costs and a fixed liquefaction fee. ARC Resources, Ltd. will act as guarantor of the IPM agreement on behalf of ARC U.S. The IPM agreement is subject to Corpus Christi Stage III making a positive final investment decision to construct the Corpus Christi Stage III Project.

“We are pleased to enter into this long-term IPM agreement with one of Canada’s largest natural gas producers, enabling Canadian natural gas to reach international markets,” said Jack Fusco, Cheniere’s President and CEO. “This commercial agreement further demonstrates Cheniere’s ability to create collaborative, innovative tailored solutions that meet the needs of our customers. This IPM agreement with ARC U.S. is expected to provide additional support to the Corpus Christi Stage III Project, which we expect to reach FID this summer.”

The Corpus Christi Stage III Project is being developed to include up to seven midscale liquefaction trains with a total expected nominal production capacity of over 10 mtpa.

About Cheniere

Cheniere Energy, Inc. is the leading producer and exporter of liquefied natural gas (LNG) in the United States, reliably providing a clean, secure, and affordable solution to the growing global need for natural gas. Cheniere is a full-service LNG provider, with capabilities that include gas procurement and transportation, liquefaction, vessel chartering, and LNG delivery. Cheniere has one of the largest liquefaction platforms in the world, consisting of the Sabine Pass and Corpus Christi liquefaction facilities on the U.S. Gulf Coast, with total production capacity of approximately 45 million tonnes per annum of LNG in operation. Cheniere is also pursuing liquefaction expansion opportunities and other projects along the LNG value chain. Cheniere is headquartered in Houston, Texas, and has additional offices in London, Singapore, Beijing, Tokyo, and Washington, D.C.

For additional information, please refer to the Cheniere website at www.cheniere.com and Quarterly Report on Form 10-Q for the quarter ended March 31, 2022, filed with the Securities and Exchange Commission.

About ARC

ARC Resources Ltd. is a pure-play Montney producer and one of Canada's largest dividend-paying energy companies, featuring low-cost operations and leading ESG performance. ARC's investment-grade credit profile is supported by commodity and geographic diversity and robust risk management practices around all aspects of the business. ARC's common shares trade on the Toronto Stock Exchange under the symbol ARX.

Forward-Looking Statements

This press release contains certain statements that may include “forward-looking statements” within the meanings of Section 27A of the Securities Act of 1933 and Section 21E of the Securities Exchange Act of 1934. All statements, other than statements of historical or present facts or conditions, included herein are “forward-looking statements.” Included among “forward-looking statements” are, among other things, (i) statements regarding Cheniere’s financial and operational guidance, business strategy, plans and objectives, including the development, construction and operation of liquefaction facilities, (ii) statements regarding regulatory authorization and approval expectations, (iii) statements expressing beliefs and expectations regarding the development of Cheniere’s LNG terminal and pipeline businesses, including liquefaction facilities, (iv) statements regarding the business operations and prospects of third-parties, (v) statements regarding potential financing arrangements, (vi) statements regarding future discussions and entry into contracts, (vii) statements relating to Cheniere’s capital deployment, including intent, ability, extent, and timing of capital expenditures, debt repayment, dividends, and share repurchases, and (viii) statements regarding the COVID-19 pandemic and its impact on our business and operating results. Although Cheniere believes that the expectations reflected in these forward-looking statements are reasonable, they do involve assumptions, risks and uncertainties, and these expectations may prove to be incorrect. Cheniere’s actual results could differ materially from those anticipated in these forward-looking statements as a result of a variety of factors, including those discussed in Cheniere’s periodic reports that are filed with and available from the Securities and Exchange Commission. You should not place undue reliance on these forward-looking statements, which speak only as of the date of this press release. Other than as required under the securities laws, Cheniere does not assume a duty to update these forward-looking statements.


Contacts

Cheniere Energy, Inc.

Investors
Randy Bhatia 713-375-5479
Frances Smith 713-375-5753

Media Relations
Eben Burnham-Snyder 713-375-5764
Phil West 713-375-5586

Targets align the company’s financial portfolios with the companywide goal of net-zero greenhouse gas emissions by 2050


SAN FRANCISCO--(BUSINESS WIRE)--Wells Fargo today announced its interim targets for reducing greenhouse gas emissions attributable to its financing activities in the Oil & Gas and Power sectors. The 2030 reduction targets for these sectors, based on a 2019 baseline, are:

  • Oil & Gas sector: 26% reduction in absolute emissions
  • Power sector: 60% reduction in portfolio emissions intensity

This is an important step in the company’s work to realize its goal of net-zero greenhouse gas emissions by 2050, including client emissions attributable to its financing. The company intends to reach this net-zero ambition by continuing to support and work with its clients and providing the capital needed to meet the demands of today while working to transition to a low carbon future.

The targets are detailed in CO2eMissionSM, Wells Fargo’s methodology for aligning its financial portfolios to the goals of the Paris Agreement and setting interim, emissions-based targets to guide that alignment. This methodology takes a sectoral approach, which recognizes that each sector of the economy is unique and will have its own decarbonization pathway. CO2eMission is available on this website. Wells Fargo’s approach is informed by the target-setting guidelines of the Net-Zero Banking Alliance (NZBA), which the company joined in 2021.

The company expects to publicly report on the progress made against the targets for Oil & Gas and Power and plans to set additional targets for other key emitting sectors.

About Wells Fargo
Wells Fargo & Company (NYSE: WFC) is a leading financial services company that has approximately $1.9 trillion in assets, proudly serves one in three U.S. households and more than 10% of small businesses in the U.S., and is a leading middle market banking provider in the U.S. We provide a diversified set of banking, investment and mortgage products and services, as well as consumer and commercial finance, through our four reportable operating segments: Consumer Banking and Lending, Commercial Banking, Corporate and Investment Banking, and Wealth & Investment Management. Wells Fargo ranked No. 37 on Fortune’s 2021 rankings of America’s largest corporations. In the communities we serve, the company focuses its social impact on building a sustainable, inclusive future for all by supporting housing affordability, small business growth, financial health, and a low-carbon economy. News, insights, and perspectives from Wells Fargo are also available at Wells Fargo Stories.

Additional information may be found at www.wellsfargo.com | Twitter: @WellsFargo.

Cautionary Statement About Forward-Looking Statements
This news release contains forward-looking statements about our future financial performance and business. Because forward-looking statements are based on our current expectations and assumptions regarding the future, they are subject to inherent risks and uncertainties. Do not unduly rely on forward-looking statements as actual results could differ materially from expectations. Forward-looking statements speak only as of the date made, and we do not undertake to update them to reflect changes or events that occur after that date. For information about factors that could cause actual results to differ materially from our expectations, refer to our reports filed with the Securities and Exchange Commission, including the discussion under “Risk Factors” in our Annual Report on Form 10-K for the year ended December 31, 2021, as filed with the Securities and Exchange Commission and available on its website at www.sec.gov.

News Release Category: WF-CF


Contacts

Media
Beth Richek, 704-374-2545
This email address is being protected from spambots. You need JavaScript enabled to view it.
Investor Relations
John Campbell, 415-396-0523
This email address is being protected from spambots. You need JavaScript enabled to view it.
Live Virtual Presentation on Wednesday, May 11 at 4:00 pm ET

VAN NUYS, Calif.--(BUSINESS WIRE)--$CGRN #Corporate--Capstone Green Energy Corporation (NASDAQ: CGRN), a global leader in carbon reduction and on-site resilient green Energy as a Service (EaaS) solutions, today announced that it will be presenting virtually at the upcoming Sidoti May Micro Cap Virtual Investor Conference on Wednesday, May 11, 2022, at 4:00 pm ET (1:00 pm PT). Darren Jamison, Capstone Green Energy’s President & Chief Executive Officer, will be presenting to a live virtual audience and answering questions from investors.


“We are pleased to return to the Sidoti Conference this year, where we always welcome the opportunity to present and speak with the Investment Community. I am looking forward to sharing some of our more recent business highlights and discussing how our Energy as a Service is transforming how customers are turning to us for low emission, reliable and affordable power solutions,” said Darren Jamison, Capstone’s President and Chief Executive Officer.

Presentation Details

  • Date: Wednesday, May 11, 2022
  • Time: 4:00 pm ET (1:00 pm PT)

One-on-One Meetings

Darren Jamison, Capstone’s President & Chief Executive Officer, and Eric Hencken, Capstone’s Chief Financial Officer, will be conducting one-on-one virtual meetings with qualified professional investors throughout the conference days of May 11-12, 2022. To register and schedule a time with management, please follow this link: Sidoti May Micro Cap Virtual Investor Conference Registration.

Supporting presentation materials will be available on the conference day by visiting the Investor Relations section of the company’s website at www.capstonegreenenergy.com.

About Sidoti & Company

For more than two decades, Sidoti & Company (http://www.sidoti.com) has been a premier provider of independent securities research focused specifically on small and microcap companies and the institutions that invest in their securities. The firm serves nearly 500 institutional clients in the U.S., Canada, and the U.K., including many leading portfolio managers with $200 million to $2 billion of assets.

About Capstone Green Energy

Capstone Green Energy (NASDAQ: CGRN) is a leading provider of customized microgrid solutions and on-site energy technology systems focused on helping customers around the globe meet their environmental, energy savings, and resiliency goals. Capstone Green Energy focuses on four key business lines. Through its Energy as a Service (EaaS) business, it offers rental solutions utilizing its microturbine energy systems and battery storage systems, comprehensive Factory Protection Plan (FPP) service contracts that guarantee life-cycle costs, as well as aftermarket parts. Energy Generation Technologies (EGT) are driven by the Company's industry-leading, highly efficient, low-emission, resilient microturbine energy systems offering scalable solutions in addition to a broad range of customer-tailored solutions, including hybrid energy systems and larger frame industrial turbines. The Energy Storage Solutions (ESS) business line designs and installs microgrid storage systems creating customized solutions using a combination of battery technologies and monitoring software. Through Hydrogen & Sustainable Products (H2S), Capstone Green Energy offers customers a variety of hydrogen products, including the Company's microturbine energy systems.

For customers with limited capital or short-term needs, Capstone offers rental systems; for more information, contact: This email address is being protected from spambots. You need JavaScript enabled to view it.. To date, Capstone has shipped over 10,000 units to 83 countries and estimates that, in FY21, it saved customers over $217 million in annual energy costs and approximately 397,000 tons of carbon. Total savings over the last three full fiscal years are estimated to be approximately $698 million in energy savings and approximately 1,115,100 tons of carbon savings.

For more information about the Company, please visit www.CapstoneGreenEnergy.com. Follow Capstone Green Energy on Twitter, LinkedIn, Instagram, Facebook, and YouTube.

Cautionary Note Regarding Forward-Looking Statements

This release contains forward-looking statements as defined in the Private Securities Litigation Reform Act of 1995, including statements regarding expectations for green initiatives and execution on the Company's growth strategy and other statements regarding the Company's expectations, beliefs, plans, intentions, and strategies. The Company has tried to identify these forward-looking statements by using words such as "expect," "anticipate," "believe," "could," "should," "estimate," "intend," "may," "will," "plan," "goal" and similar terms and phrases, but such words, terms and phrases are not the exclusive means of identifying such statements. Actual results, performance and achievements could differ materially from those expressed in, or implied by, these forward-looking statements due to a variety of risks, uncertainties and other factors, including, but not limited to, the following: the ongoing effects of the COVID-19 pandemic; the availability of credit and compliance with the agreements governing the Company's indebtedness; the Company's ability to develop new products and enhance existing products; product quality issues, including the adequacy of reserves therefor and warranty cost exposure; intense competition; financial performance of the oil and natural gas industry and other general business, industry and economic conditions; the Company's ability to adequately protect its intellectual property rights; and the impact of pending or threatened litigation. For a detailed discussion of factors that could affect the Company's future operating results, please see the Company's filings with the Securities and Exchange Commission, including the disclosures under "Risk Factors" in those filings. Except as expressly required by the federal securities laws, the Company undertakes no obligation to update or revise any forward-looking statements, whether as a result of new information, changed circumstances or future events or for any other reason.


Contacts

Capstone Green Energy
Investor and investment media inquiries:
818-407-3628
This email address is being protected from spambots. You need JavaScript enabled to view it.
From a simple yet innovative ocean trash skimmer to a global authority on ocean health; Seabin is a data-led clean-tech start up, with the ambitious goal of cleaning up 100 cities by 2050.

SYDNEY--(BUSINESS WIRE)--Australian clean-tech startup, Seabin, has today announced their first official global expansion, opening operations in Los Angeles. As part of their 100 Smarter Cities For Cleaner Oceans campaign, Marina Del Rey in Los Angeles has been selected as the first of three planned locations in the LA region as the second city after Sydney, Australia.


About Seabin

The Seabin unit is a “trash skimmer” designed to be installed in the water of marinas, yacht clubs, ports and any water body with a calm environment and suitable services available. The unit moves up and down with the tide, collecting all floating rubbish and skimming the surface of the water by pumping water into the device. A single Seabin unit can intercept floating debris, macro and micro plastics and even micro fibers, and a single unit can catch 1.4 tons of floating debris per year. The Seabin was recognised as one of the best inventions of 2018 by Time Magazine.

Cleaning up 100 Cities by 2050

The expansion to LA is part of the startup's vision of having an engaged presence in 100 cities around the world. Local team members will proactively work with the community, researchers, and corporations to obtain data and then support policy making and new legislation at the local, state, federal, and international levels to directly address the problem both in the water and on the ground.

“I’m extremely excited to launch our second city in LA and to have Marina Del Rey as our first location, followed by Port of LA and Long Beach. We spent weeks meeting the community, interviewing for positions related to the city pilot and speaking with corporates who want to support the Seabin x LA program, and everyone is simply brimming with positivity and enthusiasm to see these simple yet practical solutions come to LA” says Pete Ceglinski, CEO & Cofounder of Seabin.

The first city pilot in Sydney is now operating full time with 5 full time employees, 40 community volunteers and a broad portfolio of corporate sponsors building impact into their business models, marketing campaigns, and end of year reporting.

“Our partners in Sydney now include brands like Discovery Channel, Ben & Jerrys, Yamaha, IBM and many more other corporates who are building enviro impact solutions into their operations, we are excited to do the same now in LA with local and multinational corporates” continues Pete Ceglinski.

The Marina Del Rey – LA city pilot will create up to five full-time employment positions over the three year term, and clean-up expectations are set at an estimated 54 tons of microplastics, plastic fibers and other items captured over the three year period.

“Our marina community has long advocated for cleaner water ways and would conduct clean-ups after each storm event we had using pool skimmer nets. When Seabin technology became available we were early adopters, installing three units in our marina in 2019. We have noticed a substantial difference in our water quality, generated community awareness and started great conversations about single use plastics. We are so excited to be the second city location in the world's first 100 cities by 2050 campaign” says Bryan Plante, Marina Manager at Marina Harbor Anchorage.

“Seabin’s work provides valuable insight on issues pertinent to a cleaner LA coastline. Braid Theory is excited to support the company’s tech-forward monitoring and analysis approach, assisting in data-driven decision making in the region” said Ann Carpenter, CEO of Braid Theory, an impact accelerator entity based in Port of LA who also supports ocean innovation and new technologies.

Rather than lobby and pitch for financial support from the city, Seabin is launching a GoFundMe page to take action and start cleaning now. Currently Seabin has an estimated $150,000 pledged from American and multinational corporations, which will be used to create and drive momentum in the GoFundMe campaign.

The Seabin LA GoFundMe campaign finishes on June 8th – World Oceans Day – and the official city launch will see operations starting in Marina Del Rey, in July 2022.

For more information visit Seabin’s GoFundMe or visti seabinproject.com/, and follow The Seabin Project on Instagram @seabin_project.

>>>Click here for high-resolution images<<<


Contacts

For further information or interview requests:
Jonas Tobias, Senior Account Manager at Compass Studio, on +61 431 906 814 or This email address is being protected from spambots. You need JavaScript enabled to view it.
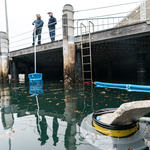
Comprehensive analysis of 50 states and the District of Columbia reveals US faces challenges to becoming EV ready

ALPHARETTA, Ga.--(BUSINESS WIRE)--#EV--LeasePlan USA, the world’s leading provider of innovative, sustainable vehicle leasing solutions, today released the results of its first USA EV Readiness Index, a comprehensive analysis of the preparedness of all 50 states and the District of Columbia for electric vehicle transition. While LeasePlan has published an annual European version of the index since 2018, the USA index ranks states on a weighted scale based on five unique factors, including favorable state legislation and incentives, EV penetration, charger to vehicle ratio, public charger availability and climate suitability.


Unlike other EV studies, LeasePlan USA assessed the balance of EVs and public chargers instead of evaluating cost of charging and cost parity between battery electric vehicles and internal combustion engine (ICE) vehicles. Forecasts for this cost equilibrium shorten yearly, and climate has proven to be an increasingly important factor in the EV transition. Also, this study clearly takes into consideration the driver experience as we have incorporated our learnings across many electric fleet drivers.

As part of the study, LeasePlan calculated a readiness score by state. In 2022, data showed that Nevada, Mississippi and Hawaii are the best prepared states for electric vehicle transition. All three states have a welcoming climate for EVs, with Nevada and Mississippi also providing a reasonable amount of public charging stations whereas Hawaii already has begun integrating EVs into its overall vehicle market.

“Although the states that rose to the top in this year’s index are surprising, it’s clear that individual states are making progress towards a greater adoption of electric vehicles,” said Matt Dyer, CEO of LeasePlan USA. “Public charging infrastructure and meaningful federal policies are critical to taking EV adoption from aspirational to attainable in the US.”

This first edition of the USA EV Readiness Index also includes an overview of electric mobility in 2022, anticipated EVs coming to market, available and soon-to-be available truck and heavy-duty EV models, and actionable insights into each market’s EV readiness.

“Although I’m excited to see so many new EVs in the pipeline, OEMs play a crucial role in developing electric models with sufficient battery ranges and adaptability for fleet customers, and they will need to ensure that production capacity and volume availability rises to the lifecycle requirements of our fleet customers. Furthermore, the onus lies with OEMs to develop efficient battery technology to fight the effects of colder climates,” says Matt Dyer.

USA EV Readiness key findings include:

No state ranked as fully EV ready

No states are ranked in the top bracket for readiness, and the top three states crept into the second rating bracket of EV accepted. States that ranked highest are better prepared than others while in lower ranked states drivers might encounter more challenges. This study shows that there is ample room for improvement across the Unites States. These rankings incorporate the fluidity of the transition to electric vehicles and growth of the market and will shift as the EV landscape evolves.

Climate suitability is crucial to EV readiness

Climate suitability plays a significant role in determining EV readiness. Cold environments are not yet ideal for EV operation due to the impact low temperatures have on driving range, charging speed and duration. On average, states that experience colder weather need to take additional measures in their EV transition efforts to secure a successful transition. European countries like Norway have proven that cold climates are not impossible to overcome, but proactive measures must be taken to ensure EV readiness.

Public charging infrastructure lags

For the purpose of this index, only public charging was assessed. While it’s promising to see federal government commitments, such as the planned $7.5 billion to accelerate EV adoption from the Infrastructure Bill, developing this network of chargers will likely take years and make public-only charging solutions unfavorable in the near term.

To download the full report, including comprehensive key findings, analysis and recommendations, please visit https://www.leaseplan.com/en-us/lpus-ev-readiness-index-2022.

Survey Methodology

The information in this study is a compilation of critical data points determined by LeasePlan USA and gathered through public data sources.

About LeasePlan:

LeasePlan is a global leader in Car-as-a-Service, with approximately 1.8 million vehicles under management in over 29 countries. LeasePlan purchases, funds and manages new vehicles for its customers, providing a complete end-to-end service for a typical contract duration of three to four years. With over 50 years’ experience and being a founding member of the EV100, a global climate initiative designed to accelerate the acceptance of electric vehicles by 2030, LeasePlan's mission is to provide what’s next in sustainable mobility so its customers can focus on what's next for them. To learn more about LeasePlan, please visit https://www.leaseplan.com/.


Contacts

Bri Carlesimo
This email address is being protected from spambots. You need JavaScript enabled to view it.
586-665-0619

PowerFlex X includes a full suite of products — Nexus, Axcess, Cortex, and Exact — that work together to control, monitor, and optimize a client's onsite solar, battery storage, and EV charging systems

SAN DIEGO--(BUSINESS WIRE)--PowerFlex, an EDF Renewables Company, today announced the unveiling of its PowerFlex X product platform, which provides real-time monitoring and intelligent control of onsite energy assets with patented software and hardware. PowerFlex X enables organizations and enterprises to integrate and co-optimize multiple technologies — including solar, battery storage, electric vehicle (EV) charging, and microgrid systems — to reduce energy costs and increase resiliency.


PowerFlex X consists of four products that seamlessly work together to help clients manage their onsite energy portfolio: Cortex is the intelligent system of algorithms, including Adaptive Load Management of EV charging, that enables the continuous monitoring and optimization of all energy asset operations; Nexus is the hardware that connects the onsite systems to the central platform; Exact is the modeling tool that forecasts the system’s impact on utility bills and carbon emission reductions; and Axcess is the single sign-in portal that allows customers to view their distributed energy resources all in one place. With PowerFlex X, customers gain a holistic view of their onsite energy assets with unprecedented transparency and ease of reporting.

“With the rapid increase in renewable energy and EV adoption, we recognized the need to bring intelligent solutions to our customers who are moving to onsite renewables and electric transportation,” said Raphael Declercq, CEO, PowerFlex. “We created PowerFlex X to optimize integrated energy solutions on the sites of our commercial customers and also to lessen the impact on the electricity grid. With PowerFlex X, we support the swift transition to clean energy with a suite of products that make our projects more sustainable and cost-competitive.”

As a single, full-service provider, PowerFlex delivers scalable onsite solutions to accelerate the decarbonization of energy sources. The company is part of EDF Renewables, a market leading independent power producer and service provider with 35 years of expertise in renewable energy. In 2017, the company began offering commercial EV charging solutions, leveraging its proprietary Adaptive Load Management (ALM) software, developed by a Caltech research group to optimize power consumption across a large network of charging stations. PowerFlex later consolidated with EnterSolar, a leading commercial solar developer, in 2021 to broaden its onsite solar offerings. As an experienced project developer, the company has now expanded its software and hardware development to bring a comprehensive energy management platform, PowerFlex X.

About PowerFlex:

PowerFlex, an EDF Renewables company, is a leading national provider of intelligent onsite energy solutions that support carbon-free electrification and transportation. The Company delivers integrated solar, storage, EV charging, and microgrid systems to businesses and organizations. As a single full-service provider, PowerFlex customizes clean technology solutions to help clients achieve their energy and sustainability goals. Through the comprehensive PowerFlex X platform, PowerFlex leverages patented smart software to control, monitor, and optimize a client's distributed energy resources to reduce cost and maximize return on investment. For more information, visit www.powerflex.com. Connect with us on LinkedIn, YouTube, and Twitter.


Contacts

Emily Lau | PowerFlex | This email address is being protected from spambots. You need JavaScript enabled to view it.
WASHINGTON--(BUSINESS WIRE)--#nodalexchange--Nodal Exchange today announced new records in power and environmental futures. In power, Nodal set a calendar month record for April with traded power futures volume of 244 million MWh, up 13.5% from 215 million MWh in April 2021. Nodal continues to be the market leader in North American power futures having the majority of the open interest at the end of April with a record 1.213 billion MWh representing $174 Billion of notional value based on both sides.


Open interest in environmental products on Nodal Exchange continued its steady growth, reaching a record high of 194,056 lots in April. At month-end, open interest across the product suite totaled 192,707 contracts, up 42% from 136,046 at the end of April 2021.

Two renewable energy certificate product groups represented much of the growth, with open interest in PJM-based REC contracts totaling 109,709, up 24% from 88,797 a year earlier. The product group hit a new open interest high of 110,760 contracts during the month. Texas CRS wind and solar open interest ended April at 31,705 contracts, up 88% from 16,837 a year earlier. The Texas CRS contracts also reached a new record of 31,812 in April.

Nodal, in collaboration with IncubEx, offers the largest suite of environmental contracts in the world, with more than 90 futures and options products listed on the exchange.

“These are extraordinary times, and we are seeing increased price volatility in energy markets which makes price risk hedging even more important. Nodal Exchange is proud to serve the power, natural gas and environmental markets in managing risk and appreciates the ongoing support of its community," said Paul Cusenza, Chairman and CEO of Nodal Exchange and Nodal Clear.

ABOUT NODAL

Nodal Exchange is a derivatives exchange providing price, credit and liquidity risk management solutions to participants in the North American commodities markets. Nodal Exchange is a leader in innovation, having introduced the world’s largest set of electric power locational (nodal) futures contracts and the world’s largest set of environmental contracts. As part of EEX Group, a group of companies serving international commodity markets, Nodal Exchange currently offers over 1,000 contracts on hundreds of unique locations, providing the most effective basis risk management available to market participants. In addition, Nodal Exchange offers natural gas and environmental contracts. All Nodal Exchange contracts are cleared by Nodal Clear which is a CFTC registered derivatives clearing organization. Nodal Exchange is a designated contract market regulated by the CFTC.


Contacts

PRESS:
Nodal
Nicole Ricard
Nodal Exchange Public Relations
P: 703-962-9816
This email address is being protected from spambots. You need JavaScript enabled to view it.
It’s Secure, Fast and Easy So Why Not Join the More than Half of PG&E Customers Saving 1,100 Trees Every Month by Going Paperless

OAKLAND, Calif.--(BUSINESS WIRE)--For the first time ever, more than 50 percent of Pacific Gas and Electric Company (PG&E) customers get a paperless bill each month, and that number continues to grow.

The 3.1 million customers currently enrolled in the program are saving 1,100 trees every month by opting to not receive a paper bill. The push to enroll more customers is part of PG&E’s larger effort to reduce the impacts of climate change. PG&E helped customers avoid 645,782 metric tons of carbon dioxide emissions through energy efficiency programs last year – roughly equal to $437 million in energy bill savings.

“We thank the millions of customers who have taken action to protect the environment and cut down on clutter. We want to encourage the remaining half of our customers to do the same. Going paperless is easy, it doesn’t affect your account, and there is no fee,” said Vincent Davis, PG&E Vice President of Customer Operations and Enablement.

And signing up is simple. Once signed up, customers receive an email with a link to view their bill, their monthly usage statements, and various resources in place of a traditional paper bill. The paperless bill has the same information as the paper bill. Click here to get started.

It’s convenient and clutter-free. And there are more reasons to go paperless including:

  • It’s secure: View up to 24 months of account history in your protected online account
  • It’s fast: Receive an email alert when your monthly statement arrives
  • It’s easy: You don’t need to go to the post office, buy a stamp and other hassles that come with paper bills
  • It’s good for the planet: Less paper benefits the environment

Customers can still obtain a paper bill by printing it at home and paperless bills are available 24/7.

About PG&E

Pacific Gas and Electric Company, a subsidiary of PG&E Corporation (NYSE:PCG), is a combined natural gas and electric utility serving more than 16 million people across 70,000 square miles in Northern and Central California. For more information, visit pge.com and pge.com/news.


Contacts

MEDIA RELATIONS:
415-973-5930

National Clean Energy Champion and Regulatory Expert to Lead National Solar Advocacy Nonprofit

OAKLAND, Calif.--(BUSINESS WIRE)--Vote Solar, a leading solar nonprofit in the U.S., today announced the appointment of Sachu Constantine as its new Executive Director. Reporting to Vote Solar’s Board of Directors, Constantine will be responsible for guiding the organization through its next stage of growth and impact. Under his adept leadership, Vote Solar will continue to advance just and equitable clean energy policy and regulatory solutions across the country.


“Vote Solar has long played a critical role in deploying clean energy solutions at scale across the country. I’m honored to work with this talented team to help make that transition happen with the growing urgency that climate change requires,” said Constantine. “As we partner with communities to build our clean energy future, Vote Solar will advance policies and programs that address the previous inequities of our fossil fuel dominant energy system and benefit communities that have historically been left out of the decision-making process. I look forward to continuing the fight for affordable and accessible solar power for all.”

With high profile roles in the energy and environmental field spanning nearly three decades, Constantine has a proven commitment to the fight for a just, sustainable world powered by clean energy. With experience at both the national and international level, Constantine brings to bear a well-rounded perspective on the value of solar energy, particularly in combination with efficiency and expanded electrification.

Since 2017, Constantine has served as Vote Solar’s Regulatory Managing Director, and most recently as the organization's Interim Executive Director. Prior to joining Vote Solar, Constantine served as the Director of Policy at the Center for Sustainable Energy (CSE) for five years. In that role, he was responsible for directing CSE’s policy, regulatory and legislative efforts as well as building its reputation as a regional, state and national leader in the clean energy arena. He has also served stints at SunPower Corporation, the California Public Utilities Commission and the Alliance to Save Energy.

“Sachu embodies Vote Solar’s core values and has a proven track record of strategic leadership,” said Zaid Ashai, Vote Solar’s board chair and CEO of Nexamp. “His wealth of expertise in building and scaling powerful solar solutions in the face of the mounting climate crisis will enable Vote Solar to drive even greater solar adoption as we grow our impact across the country”

In recent years, Vote Solar has expanded in both size and impact. With Constantine at the helm, the organization is poised to continue that growth and advance its mission to realize a 100% clean energy future through a solutions-driven, people-first approach. Vote Solar’s impact to date includes ensuring one in three Americans now live in a state with a 100% clean energy mandate. In addition, over the last two decades, Vote Solar has secured over 114,000 MW of new solar commitments, championed policies that will create over 250,000 new solar jobs, and enabled solar access for 1.43 million people from underserved communities.

Constantine is Vote Solar’s second Executive Director, following the term of co-founder Adam Browning, who guided the organization through its first 20 years.

About Vote Solar

Since 2001, Vote Solar has been working to lower solar costs and expand solar access across the United States. A 501(c)3 nonprofit with more than 94,000 members nationwide, Vote Solar advances state policies and programs needed to repower our electric grid with clean energy and achieve a more environmentally just society. By identifying and accelerating solar solutions in legislatures and public utility commissions in over 20 states, Vote Solar works to combat the climate crisis, lower energy costs for ratepayers, reduce harmful pollution, and build a brighter, cleaner, more equitable future.

Learn more at www.votesolar.org.


Contacts

Media:
Hannah Walford
This email address is being protected from spambots. You need JavaScript enabled to view it.
781-291-0441

Reaches Agreement with Army Corps on Maintenance Dredging

HOUSTON--(BUSINESS WIRE)--The Port Commission of the Port of Houston Authority met on Tuesday, April 26 for its regular monthly meeting. Port Chairman Ric Campo opened the meeting by announcing multiple outstanding achievements for the Houston Ship Channel and by Port Houston.


One of the most notable was a recent agreement with the U.S. Army Corps of Engineers, permitting it to assume maintenance dredging for a soon-to-be improved segment of the nation’s busiest ship channel. Chairman Campo highlighted the importance of the agreement, in addition to the opportunity it may provide Port Houston to develop and direct additional investment towards landside infrastructure, to continue to stay in front of increasing cargo volumes.

As gate movements at Port Houston’s two public container terminals continue to break daily records, Chairman Campo commended the staff team, industry, the International Longshoremen’s Association, and seafarers, “who all continue performing an amazing job every day to drive the historical volumes of commerce through our region.”

In his staff report, Executive Director Roger Guenther said Port Houston container volume had increased 23% overall. “More than 900,000 container TEUs moved through the public facilities over the first three months of 2022, our largest quarter ever by far,” he said.

Guenther also commented on a Memorandum of Agreement with FSX, LLC, an agenda item later approved by the Port Commission. The agreement permits the parties to pursue and explore opportunities to connect shore-side container facilities to more inland locations via the proposed freight shuttle infrastructure. The MOA aims to help improve air quality emissions by reducing truck miles traveled, enhance intermodal connectivity, and improve the capacity of existing terminals.

Guenther said, “We continue to think out of the box and take a hard look at technologies like the freight shuttle that may provide tremendous benefit for more efficient freight transportation.” The MOA also highlights Port Houston’s sustainability efforts, including the goal to reduce its greenhouse gas footprint to net-zero by 2050.

The next regular Port Commission meeting is Tuesday, May 24.

About Port Houston

For more than 100 years, Port Houston has owned and operated the public wharves and terminals along the Houston Ship Channel, including the area’s largest breakbulk facility and two of the most efficient and fastest-growing container terminals in the country. Port Houston is the advocate and a strategic leader for the Channel. The Houston Ship Channel complex and its more than 200 public and private terminals, collectively known as the Port of Houston, is the nation’s largest port for waterborne tonnage and an essential economic engine for the Houston region, the state of Texas, and the U.S. The Port of Houston supports the creation of nearly 1.35 million jobs in Texas and 3.2 million jobs nationwide, and economic activity totaling $339 billion in Texas – 20.6 percent of Texas’ total gross domestic product (GDP) – and $801.9 billion in economic impact across the nation. For more information, visit the website at www.PortHouston.com.


Contacts

Lisa Ashley, Director, Media Relations
Office: 713-670-2644; Mobile: 832-247-8179
E-mail: This email address is being protected from spambots. You need JavaScript enabled to view it.

Veransa, a Zero-Waste Leader in Transforming Green Waste Into Beneficial Re-Use Products, Bolsters C-Suite With New Chief Financial Officer (CFO), Jeremy Pfeifer.

SARASOTA, Fla.--(BUSINESS WIRE)--#CircularEconomy--Veransa Group, Inc, a zero-waste leader in transforming green waste into beneficial re-use products on an industrial scale through vertical integration of waste collection/recycling centers with manufacturing facilities, announced hiring new Chief Financial Officer (CFO), Jeremy Pfeifer, as it continues a period of significant growth.


Jeremy brings over 20 years of experience as an accomplished finance executive, having previously served in leadership roles at four private equity or institutionally backed businesses, including Valet Living, a nationwide multifamily amenity services company that doubled in size during his tenure, and ArrMaz, a global leader in the production of specialty chemicals for industries. Jeremy has extensive experience managing and executing on both organic and inorganic company growth strategies which makes him ideally suited for Veransa’s expansion strategy. Jeremy is a licensed Certified Public Accountant in the state of Florida with a degree in finance and accounting from University of South Florida.

“We are excited to have Jeremy join our team. Jeremy’s leadership will accelerate Veransa’s buildout of an engaged and scalable finance team prepared to undertake due-diligence and acquisition integration as we expand, while providing high-level strategic financial planning support to the Company,” said Marc Owensby, CEO of Veransa.

“I am enthusiastic about joining Veransa. The company is uniquely positioned for significant growth in the coming years with a compelling vision, market strategy, and seasoned leadership team,” said Jeremy.

About Veransa:

Veransa (www.veransa.com) is a zero-waste leader in transforming urban wood and yard waste into valuable beneficial re-use products on an industrial scale. Veransa vertically integrates green and wood waste collection and recycling centers with organic products manufacturing facilities to achieve highest-value use, waste-to-organic commodities production. Veransa aggregates green waste and transforms it, using electrically powered processing equipment, into beneficial re-use products, including soil-regenerating, OMRI Listed®, STA approved, organic compost and blended soils, that are free of biosolids or manure. It also processes wood waste into feedstock for mulch and renewable energy. Veransa is an Environmental, Social, and Governance (ESG) portfolio company of RFE Investment Partners.

About RFE:

RFE Investment Partners (www.rfeip.com) is a private equity firm focused on making control investments in established small market companies located in the United States. RFE is a long-standing Connecticut-based firm founded in 1980 with over 40 years of experience investing in the lower middle market. RFE’s investment strategy is to transform its portfolio companies from the lower end of the market to fully professionalized and market leading middle market companies. RFE is currently investing out of Fund IX.


Contacts

Media Contact:
Roxane Teymourtash
240-413-3949
This email address is being protected from spambots. You need JavaScript enabled to view it.

DUBLIN--(BUSINESS WIRE)--The "Petrol Stations in Ireland - Industry Market Research Report" report has been added to ResearchAndMarkets.com's offering.


Operators in this industry sell automotive fuel such as petrol, diesel, autogas and alternative fuels directly to consumers. The majority of petrol stations also operate convenience stores and additional services such as car-washing facilities. A significant proportion of sales are made to drivers of heavy goods vehicles. Buses and coaches are not included in the industry as these often go through wholesalers rather than retail forecourts.

This report covers the scope, size, disposition and growth of the industry including the key sensitivities and success factors. Also included are five year industry forecasts, growth rates and an analysis of the industry's key players and their market shares.

Key Topics Covered:

ABOUT THIS INDUSTRY

  • Industry Definition
  • Main Activities
  • Similar Industries
  • Additional Resources

INDUSTRY AT A GLANCE

INDUSTRY PERFORMANCE

  • Executive Summary
  • Key External Drivers
  • Current Performance
  • Industry Outlook
  • Industry Life Cycle

PRODUCTS & MARKETS

  • Supply Chain
  • Products & Services
  • Demand Determinants
  • Major Markets
  • International Trade
  • Business Locations

COMPETITIVE LANDSCAPE

  • Market Share Concentration
  • Key Success Factors
  • Cost Structure Benchmarks
  • Basis of Competition
  • Barriers to Entry
  • Industry Globalization

MAJOR COMPANIES

OPERATING CONDITIONS

  • Capital Intensity
  • Technology & Systems
  • Revenue Volatility
  • Regulation & Policy
  • Industry Assistance

KEY STATISTICS

  • Industry Data
  • Annual Change
  • Key Ratios

JARGON & GLOSSARY

Companies Mentioned

  • Valero Energy (Ireland) Ltd
  • Mullan Bros. Ltd
  • Applegreen Ltd
  • Hillingdon Investment Company Unlimited
  • Circle K Ireland Fuels Ltd


For more information about this report visit https://www.researchandmarkets.com/r/kugun5


Contacts

ResearchAndMarkets.com
Laura Wood, Senior Press Manager
This email address is being protected from spambots. You need JavaScript enabled to view it.

For E.S.T Office Hours Call 1-917-300-0470
For U.S./CAN Toll Free Call 1-800-526-8630
For GMT Office Hours Call +353-1-416-8900

Offshore Source Logo

Offshore Source keeps you updated with relevant information concerning the Offshore Energy Sector.

Any views or opinions represented on this website belong solely to the author and do not represent those of the people, institutions or organizations that Offshore Source or collaborators may or may not have been associated with in a professional or personal capacity, unless explicitly stated.

Corporate Offices

Technology Systems Corporation
8502 SW Kansas Ave
Stuart, FL 34997

info@tscpublishing.com