Business Wire News

  • Accelerates OPAL Fuels LLC’s (“OPAL Fuels”) mission to expand the role of low-carbon renewable natural gas across the transportation sector
  • OPAL Fuels Inc. (“New OPAL”) shares to begin trading on the Nasdaq July 22, 2022, under ticker “OPAL”

WHITE PLAINS, N.Y.--(BUSINESS WIRE)--OPAL Fuels, a vertically integrated producer and distributor of renewable natural gas (“RNG”), today announced that it has completed its previously announced business combination (the “Business Combination”) with ArcLight Clean Transition Corp. II (Nasdaq: ACTD) (“ArcLight”).


The transaction was unanimously approved by ArcLight’s board of directors and was approved at a special meeting of ArcLight shareholders on July 15, 2022.

The combined entity will be renamed OPAL Fuels Inc. and commencing on July 22, 2022, the Class A ordinary shares of New OPAL will trade on the Nasdaq under the ticker symbol “OPAL” and its warrants will trade on the Nasdaq under the ticker symbol “OPALW”.

Company Background

OPAL Fuels is a renewable energy company specializing in the capture and conversion of biogas for the production of RNG for use as a vehicle fuel for heavy and medium-duty trucking fleets, and the generation of renewable power for sale to utilities. OPAL Fuels also designs, develops, constructs, operates and services fueling stations for trucking fleets across the country that use natural gas to displace diesel as their transportation fuel. The biogas conversion projects currently use landfill gas and dairy manure as the source of the biogas. In addition, OPAL Fuels has recently begun implementing design, development, and construction services for hydrogen fueling stations.

As of May 1, 2022, OPAL Fuels owns and operates 24 biogas projects, five of which are RNG projects and 19 of which are renewable power projects. Additionally, OPAL Fuels currently has seven RNG projects under construction.

Management Commentary

Adam Comora, Co-CEO of OPAL Fuels, stated, “We are incredibly proud to complete this transaction and become a public company. This transformative step enables the next phase of growth at OPAL Fuels, and we look forward to our continued partnership with the ArcLight team and delivering value to all of our stakeholders.”

Jonathan Maurer, Co-CEO of OPAL Fuels, commented, “We remain focused on executing on our project pipeline and further expanding our portfolio of RNG production facilities and network of RNG fueling stations, which enables our customers to accelerate their transition to sustainable, renewable transportation fuels.”

Marco Gatti, CFO of ArcLight said, “ArcLight is proud to have partnered with OPAL Fuels, a leader in the energy transition segment delivering on tangible decarbonization solutions for the transportation sector. We are confident in management’s proven ability to create value as the RNG industry evolves and matures and look forward to the company’s continued growth.”

Leadership

OPAL Fuels’ senior management team will continue to lead the now combined company, including Adam Comora (Co-Chief Executive Officer), Jonathan Maurer (Co-Chief Executive Officer), Ann Anthony (Chief Financial Officer), John Coghlin (General Counsel), Scott Edelbach (Executive Vice President), Anthony Falbo (Chief Operating Officer) and Dave Unger (Executive Vice President).

New OPAL’s board of directors will be comprised of Mark Comora (Chairman), Betsy Battle, Scott Dols, Kevin Fogarty, Marco Gatti, Nadeem Nisar, and Ashok Vemuri.

Advisors

Sheppard Mullin Richter & Hampton LLP is serving as legal advisor to OPAL Fuels. Kirkland & Ellis LLP is serving as legal advisor to ArcLight.

About OPAL Fuels LLC

OPAL Fuels LLC is a leading vertically integrated renewable fuels platform involved in the production and distribution of renewable natural gas (RNG) for the heavy-duty truck market. RNG is a proven low-carbon fuel that is rapidly decarbonizing the transportation industry now while also significantly reducing costs for fleet owners. OPAL Fuels captures harmful methane emissions at the source and recycles the trapped energy into a commercially viable, lower-cost alternative to diesel fuel. OPAL Fuels also develops, constructs, and services RNG and hydrogen fueling stations. As a producer and distributor of carbon-reducing fuel for heavy-duty truck fleets for more than a decade, the company delivers best-in-class, complete renewable solutions to customers and production partners. To learn more about OPAL Fuels and how it is leading the effort to capture North America’s harmful methane emissions and decarbonize the transportation industry, please visit www.opalfuels.com and follow the company on LinkedIn and Twitter at @OPALFuels.

About ArcLight Clean Transition Corp. II

ArcLight, led by Chairman Daniel Revers and President and Chief Executive Officer Jake Erhard, is a special purpose acquisition company formed for the purpose of effecting a capital stock exchange, asset acquisition, share purchase, reorganization, or similar business combination with one or more businesses focused on opportunities created by the accelerating transition toward sustainable use of energy and natural resources.

# # #

Forward-Looking Statements

Certain statements in this communication may be considered forward-looking statements. Forward-looking statements are statements that are not historical facts and generally relate to future events or ArcLight’s or OPAL Fuels’ future financial or other performance metrics. In some cases, you can identify forward-looking statements by terminology such as “believe,” “may,” “will,” “potentially,” “estimate,” “continue,” “anticipate,” “intend,” “could,” “would,” “project,” “target,” “plan,” “expect,” or the negatives of these terms or variations of them or similar terminology. Such forward-looking statement are subject to risks and uncertainties, which could cause actual results to differ materially from those expressed or implied by such forward looking statements. New risks and uncertainties may emerge from time to time, and it is not possible to predict all risks and uncertainties. These forward-looking statements are based upon estimates and assumptions that, while considered reasonable by ArcLight and its management, and OPAL Fuels and its management, as the case may be, are inherently uncertain and subject to material change. Factors that may cause actual results to differ materially from current expectations include, but are not limited to, various factors beyond management’s control, including general economic conditions and other risks, uncertainties and factors set forth in the section entitled “Risk Factors” and “Cautionary Statement Regarding Forward-Looking Statements” in the Registration Statement and other filings with the SEC, as well as (1) factors associated with companies, such as OPAL Fuels, that are engaged in the production and integration of renewable natural gas (RNG), including anticipated trends, growth rates, and challenges in those businesses and in the markets in which they operate; (2) macroeconomic conditions related to the global COVID-19 pandemic; (3) the effects of increased competition; (4) contractual arrangements with, and the cooperation of, landfill and livestock waste site owners and operators, on which OPAL Fuels operates its landfill gas and livestock waste projects that generate electricity and RNG prices for environmental attributes, low carbon fuel standard credits and other incentives; (5) the ability to identify, acquire, develop and operate renewable projects and RNG fueling stations; (6) the outcome of any legal proceedings that may be instituted in connection with the Business Combination; and (7) the ability of New OPAL to issue equity or equity-linked securities or obtain debt financing in connection with the transaction or in the future. Nothing in this communication should be regarded as a representation by any person that the forward-looking statements set forth herein will be achieved or that any of the contemplated results of such forward-looking statements will be achieved. You should not place undue reliance on forward-looking statements in this communication, which speak only as of the date they are made and are qualified in their entirety by reference to the cautionary statements herein. Both ArcLight and OPAL Fuels expressly disclaim any obligations or undertaking to release publicly any updates or revisions to any forward-looking statements contained herein to reflect any change in ArcLight’s or OPAL Fuels’ expectations with respect thereto or any change in events, conditions or circumstances on which any statement is based.


Contacts

OPAL Fuels

Media
Jason Stewart
Senior Director Public Relations and Marketing
914-421-5336
This email address is being protected from spambots. You need JavaScript enabled to view it.

ICR, Inc.
This email address is being protected from spambots. You need JavaScript enabled to view it.

Investors
Todd Firestone
Vice President Investor Relations & Corporate Development
Phone: 914-705-4001
This email address is being protected from spambots. You need JavaScript enabled to view it.

ArcLight Clean Transition Corp. II

Marco Gatti
Chief Financial Officer
617-531-6300
This email address is being protected from spambots. You need JavaScript enabled to view it.

While Most Utilities Have Aggressive Carbon Reduction Goals, Few Have Solid Plans to Execute Them and Fewer Have Customer Awareness Needed to Achieve Them


TROY, Mich.--(BUSINESS WIRE)--Judging solely by their annual reports, press releases and public talking points, the nation’s electric utilities are all-in on carbon reduction. A significant majority (81%) of electric utility customers1 are now served by a utility with a stated carbon-reduction target. However, many utilities do not have plans that are disclosed or validated by independent groups such as CDP or the Science-Based Targets initiative (SBTi). According to the J.D. Power 2022 Sustainability Index, released today, even fewer utilities have the customer awareness and support they will need to make their goals a reality.

“If the aggressive carbon reduction goals most utilities have in place are ever going to be achieved, customers are going to need to play a key role, both in terms of modifying their current energy use habits and supporting the funding required to improve infrastructure and deliver the clean energy sources,” said Andrew Heath, senior director of utilities intelligence at J.D. Power. “Right now, even the best-performing utilities are not where they need to be in terms of customer engagement, awareness and support for sustainability initiatives.”

Following are some key findings of the 2022 index:

  • Persistently low consumer awareness for utility climate initiatives: The overall sustainability scores for electric utilities evaluated in the study—which are based on consumer awareness, engagement and advocacy for their local utility’s climate initiatives—is 28 (on a 100-point scale), up just one point from 2021.
  • Engagement and awareness of utility sustainability initiatives remains stubbornly low: Just 6% of residential electric utility customers and 28% of business customers are using environmental products and services. Similarly, just 41% of residential customers and 56% of business customers are aware of their utility’s efforts to improve their impact on the environment.
  • Despite low engagement, many customers care about climate change: Nearly half (49%) of electric utility customers believe that climate change is either a “serious” or “very serious” issue. Utilities serving coastal customers in the Northeast and West have the greatest percentage of customers who are concerned about climate change, with many serving 60% or more customers who believe climate change to be a serious issue.
  • Few utilities have clear carbon reduction plan/targets meeting highest level of ambition: According to the CDP,2 just 23 of 65 electric utilities evaluated receive a score of B- or better for their disclosed plans to reduce carbon emissions. Only two have committed to set science-based targets, according to the SBTi.3
  • Highest-scoring utilities: NextEra Energy and Sacramento Municipal Utility District have the highest scores for a second consecutive year, each with a score of 34.

The J.D. Power Sustainability Index evaluates electric utility customer awareness, support, engagement and advocacy for their local utility’s climate sustainability programs and goals. The index applies to the 35 largest U.S. electric utility companies and cities, each serving 500,000 or more residential customers and is based on responses from 71,959 business and residential electric utility customers and was fielded from June 2021 through May 2022.

Following is the full list of electric utility companies and cities that are evaluated, along with their index scores:

Utility

2022 Sustainability Index Score

NextEra Energy

34

Sacramento Municipal Utility District

34

DTE Energy

33

Portland General Electric

32

Salt River Project

32

Puget Energy

31

Xcel Energy

31

OGE Energy Corp.

30

Pacific Gas and Electric

30

Southern Company

30

Berkshire Hathaway Energy

29

CMS Energy

29

CPS Energy

29

Edison International

29

Emera

29

L.A. Dept. of Water & Power

29

Pinnacle West

29

Ameren

28

Con Edison

28

Dominion

28

Entergy

28

Sempra Energy

28

Industry Average

28

Duke Energy

27

Exelon

27

Alliant Energy

26

Evergy

26

PSEG

26

WEC Energy Group

26

AEP

25

PPL Corporation

25

Eversource

24

National Grid

24

Avangrid

23

Duquesne Light

21

FirstEnergy

21

For more information about the J.D. Power Sustainability Index, visit
https://www.jdpower.com/business/sustainability-certification-program.

See the online press release at http://www.jdpower.com/pr-id/2022085.

About J.D. Power

J.D. Power is a global leader in consumer insights, advisory services and data and analytics. A pioneer in the use of big data, artificial intelligence (AI) and algorithmic modeling capabilities to understand consumer behavior, J.D. Power has been delivering incisive industry intelligence on customer interactions with brands and products for more than 50 years. The world's leading businesses across major industries rely on J.D. Power to guide their customer-facing strategies.

J.D. Power has offices in North America, Europe and Asia Pacific. To learn more about the company’s business offerings, visit JDPower.com/business. The J.D. Power auto shopping tool can be found at JDPower.com.

About J.D. Power and Advertising/Promotional Rules: www.jdpower.com/business/about-us/press-release-info

__________________________________

1 SEPA Utility Carbon-Reduction Tracker.™ Smart Electric Power Alliance (SEPA). Retrieved July 10, 2022, from https://sepasandbox.wpengine.com/utility-transformation-challenge/utility-carbon-reduction-tracker.

2 Source: www.cdp.net 2021 climate change ratings for U.S. electric utilities, July 2022.

3 Source: www.sciencebasedtargets.org Companies taking action, July 2022.


Contacts

Geno Effler, J.D. Power; West Coast; 714-621-6224; This email address is being protected from spambots. You need JavaScript enabled to view it.
John Roderick; East Coast; 631-584-2200; This email address is being protected from spambots. You need JavaScript enabled to view it.

SAN ANTONIO--(BUSINESS WIRE)--The Board of Directors of Valero Energy Corporation (NYSE: VLO, “Valero”) has declared a regular quarterly cash dividend on common stock of $0.98 per share. The dividend is payable on September 1, 2022 to holders of record at the close of business on August 4, 2022.


About Valero

We are a multinational manufacturer and marketer of petroleum-based and low-carbon liquid transportation fuels and petrochemical products, and we sell our products primarily in the United States (U.S.), Canada, the United Kingdom (U.K.), Ireland, and Latin America. We own 15 petroleum refineries located in the U.S., Canada, and the U.K. with a combined throughput capacity of approximately 3.2 million barrels per day (BPD). We are a joint venture member in Diamond Green Diesel Holdings LLC (DGD), which owns a renewable diesel plant in Norco, Louisiana with a production capacity of 700 million gallons per year, and we own 12 ethanol plants located in the Mid-Continent region of the U.S. with a combined production capacity of approximately 1.6 billion gallons per year. We manage our operations through our Refining, Renewable Diesel, and Ethanol segments. Please visit www.investorvalero.com for more information.


Contacts

Investors:
Homer Bhullar, Vice President – Investor Relations and Finance, 210-345-1982
Eric Herbort, Director – Investor Relations, 210-345-3331
Gautam Srivastava, Senior Manager – Investor Relations, 210-345-3992

Media:
Lillian Riojas, Executive Director – Media Relations and Communications, 210-345-5002

SANTA CRUZ, Calif.--(BUSINESS WIRE)--Joby Aviation (NYSE: JOBY), a California-based company developing all-electric aircraft for commercial passenger service, today announced that it will release its second quarter 2022 earnings results after the market close on Thursday, August 11, 2022, with a webcast at 5:30 pm ET the same day during which management will discuss the results. The webcast will be publicly available in the Upcoming Events section of the company website (www.jobyaviation.com). If unable to attend the webcast, to listen by phone, please dial 1-877-407-3982 or 1-201-493-6780. A replay of the webcast will be available on the company website following the event.


About Joby Aviation

Joby Aviation, Inc. (NYSE: JOBY) is a California-based transportation company developing an all-electric vertical take-off and landing aircraft which it intends to operate as part of a fast, quiet, and convenient service in cities around the world. To learn more, visit www.jobyaviation.com.

Forward Looking Statements

This press release contains “forward-looking statements” within the meaning of the “safe harbor” provisions of the Private Securities Litigation Reform Act of 1995, including but not limited to, statements regarding the development and performance of Joby’s aircraft, the growth of its manufacturing capabilities and its regulatory outlook, progress and timing. You can identify forward-looking statements by the fact that they do not relate strictly to historical or current facts. These statements may include words such as “anticipate”, “estimate”, “expect”, “project”, “plan”, “intend”, “believe”, “may”, “will”, “should”, “can have”, “likely” and other words and terms of similar meaning in connection with any discussion of the timing or nature of future operating or financial performance or other events. All forward-looking statements are subject to risks and uncertainties that may cause actual results to differ materially including: Joby’s ability to launch its aerial ridesharing service and the growth of the urban air mobility market generally; Joby’s ability to produce aircraft that meet its performance expectations in the volumes and on the timelines that it projects; the competitive environment in which it operates; its future capital needs; its ability to adequately protect and enforce its intellectual property rights; its ability to effectively respond to evolving regulations and standards relating to its aircraft; its reliance on a third-party suppliers and service partners; uncertainties related to Joby’s estimates of the size of the market for its service and future revenue opportunities; and other important factors discussed in the section titled “Risk Factors” in its Annual Report on Form 10-K, filed with the Securities and Exchange Commission (the “SEC”) on March 28, 2022, and in other reports it files with or furnishes to the SEC. Any such forward-looking statements represent management’s estimates and beliefs as of the date of this press release. While Joby may elect to update such forward-looking statements at some point in the future, it disclaims any obligation to do so, even if subsequent events cause its views to change.


Contacts

Investors:
This email address is being protected from spambots. You need JavaScript enabled to view it.
+1-831-201-6006

Media:
This email address is being protected from spambots. You need JavaScript enabled to view it.

High-quality storage reservoir less than 5 miles from Company’s CO2 infrastructure

PLANO, Texas--(BUSINESS WIRE)--#blueoil--Denbury Inc. (NYSE: DEN) (“Denbury”) today announced that it has signed a definitive agreement with a landowner near Donaldsonville, Louisiana, to lease approximately 18,000 acres for future CO2 sequestration. The site is located in Assumption and St. James Parishes, less than five miles from the Company’s existing CO2 Green Pipeline and in close proximity to the Louisiana Industrial Corridor, one of the highest geographic concentrations of industrial CO2 emissions in the United States. Denbury estimates more than 50 million metric tons per year of existing stationary CO2 emissions are located within 30 miles of the site.


With excellent geologic characteristics, including thick laterally extensive, low dip reservoirs, the Company anticipates the site will have high CO2 injectivity and total sequestration capacity of more than 80 million metric tons of CO2. Denbury estimates first potential CO2 injection for the site as early as 2025. The addition of this sequestration site expands the potential volume of CO2 that the Company can sequester near Donaldsonville, Louisiana, to approximately 300 million metric tons, and the Company’s total sequestration site capacity has expanded to approximately 1.5 billion metric tons, which includes sites along the U.S. Gulf Coast in Alabama, Louisiana, and Texas. Denbury intends to drill a stratigraphic test well in one or more of its potential storage locations later this year to confirm the Company’s geologic understanding and progress Class VI permitting efforts with the EPA.

Nik Wood, Denbury’s Senior Vice President of Carbon Solutions, commented, “We are excited to announce this agreement which expands our Gulf Coast CO2 storage portfolio. We now have multiple sequestration sites in an area with tremendous existing and future potential CO2 emissions as we strive to provide an economic, low-risk solution for the storage of industrial carbon emissions. Our proven track record in providing highly reliable transportation and secure underground injection of CO2 emissions from our industrial partners, combined with our ideally positioned infrastructure, is unmatched in the industry and positions us well for continued success and growth in CCUS.”

ABOUT DENBURY

Denbury is an independent energy company with operations and assets focused on Carbon Capture, Use and Storage (CCUS) and Enhanced Oil Recovery (EOR) in the Gulf Coast and Rocky Mountain regions. For over two decades, the Company has maintained a unique strategic focus on utilizing CO2 in its EOR operations and since 2012 has also been active in CCUS through the injection of captured industrial-sourced CO2. The Company currently injects over four million tons of captured industrial-sourced CO2 annually, with an objective to fully offset its Scope 1, 2, and 3 CO2 emissions by 2030, primarily through increasing the amount of captured industrial-sourced CO2 used in its operations. For more information about Denbury, visit www.denbury.com.

The Denbury Carbon Solutions team was formed in January 2020 to advance Denbury’s leadership in the anticipated high-growth CCUS industry, leveraging Denbury’s unique capabilities and assets that were developed over the last 20-plus years through its focus on CO2 EOR.

Follow Denbury on Twitter and LinkedIn.

This press release contains forward looking statements that involve risks and uncertainties, including the timing and availability of CO2 to be sequestered, the Company’s successful preparation and testing of the site for permanent CO2 sequestration and obtaining Class VI permits required for permanent CO2 sequestration. These statements are based on engineering, geological, financial and operating assumptions that Denbury believes are reasonable based on currently available information; however, their achievement are subject to a wide range of business risks, and there is no assurance that these goals and projections can or will be met. Actual results may vary materially. In addition, any forward-looking statements represent Denbury’s estimates only as of today and should not be relied upon as representing its estimates as of any future date. Denbury assumes no obligation to update these forward-looking statements.


Contacts

DENBURY IR CONTACTS:
Brad Whitmarsh, 972.673.2020, This email address is being protected from spambots. You need JavaScript enabled to view it.
Beth Bierhaus, 972.673.2554, This email address is being protected from spambots. You need JavaScript enabled to view it.

  •  Company continues to build a culture of inclusion, embracing and empowering all employees

BOSTON--(BUSINESS WIRE)--#SchneiderElectric--Schneider Electric, the global leader in energy management and automation, today announced that the company has been featured in the 2022 “Best Places to Work for Disability Inclusion” list. This award from Disability:IN® recognizes the company’s commitment to disability, inclusion and equality within the workplace.


Schneider Electric was recognized after achieving a score of 80 or greater on the Disability Equality Index (DEI) – a comprehensive benchmarking tool that helps companies build a roadmap of measurable, tangible actions to achieve disability, inclusion and equality.

“We thank Disability:IN® for listing us among the top companies driving for disability inclusion and equality across industries. We recognize, however, that there is still much work to be done and embrace the journey ahead of us towards accessible work environments where people with disabilities can achieve their full potential,” said Mike O’Brien, Senior Service Offer Manager and National Leader of the Employee Resource Network for Disability, Accessibility, & Allies, Schneider Electric. To learn more about our journey and progress, read Schneider Electric’s U.S. Diversity, Equity, and Inclusion Transparency Report.

The DEI was created by the DEI Advisory Committee, a diverse group of business leaders, policy experts and disability advocates. Now in its eighth year, the DEI exists to help businesses make a positive impact on the unemployment/underemployment of people with disabilities.

“Disability inclusion is a rapidly expanding aspect of corporate culture, and it’s gratifying to partner with 415 companies on the 2022 Disability Equality Index,” said Jill Houghton, President and CEO of Disability:IN. “These top-scoring companies not only excel in disability inclusion, many are also adopting emerging trends and pioneering measures that can move the disability agenda from accommodation to inclusion and ultimately, genuine belonging."

The DEI is a joint initiative of the American Association of People with Disabilities (AAPD), the nation’s largest disability rights organization, and Disability:IN, the global business disability inclusion network, to collectively advance the inclusion of people with disabilities. The organizations are complementary and bring unique strengths that make the project relevant and credible to corporations and the disability community. Learn more at: www.DisabilityEqualityIndex.org.

About the American Association of People with Disabilities (AAPD)

AAPD is a convener, connector, and catalyst for change, increasing the political and economic power for people with disabilities. As a national cross-disability rights organization AAPD advocates for full civil rights for the 60+ million Americans with disabilities. Learn more at: www.aapd.com.

About Disability:IN®

Disability:IN is a global organization driving disability inclusion and equality in business. More than 400 corporations partner with Disability:IN to create long-term business and social impact through the world’s most comprehensive disability inclusion benchmarking and reporting tool, the Disability Equality Index (DEI); best-in-class conferences and programs; expert counsel and engagement; and public policy leadership. Join at disabilityin.org/AreYouIN #AreYouIN.

About Schneider Electric

Schneider’s purpose is to empower all to make the most of our energy and resources, bridging progress and sustainability for all. We call this Life Is On.

Our mission is to be your digital partner for Sustainability and Efficiency.

We drive digital transformation by integrating world-leading process and energy technologies, end-point to cloud connecting products, controls, software and services, across the entire lifecycle, enabling integrated company management, for homes, buildings, data centers, infrastructure and industries.

We are the most local of global companies. We are advocates of open standards and partnership ecosystems that are passionate about our shared Meaningful Purpose, Inclusive and Empowered values.

www.se.com

Discover Life Is On Follow us on: Twitter, Facebook, LinkedIn, YouTube, Instagram, Blog

Discover the newest perspectives shaping sustainability, electricity 4.0, and next generation automation on Schneider Electric Insights

Hashtags: #LifeIsOn #DisabilityInclusion #DEI2022


Contacts

Schneider Electric Media Relations – Thomas Eck, This email address is being protected from spambots. You need JavaScript enabled to view it.; (919) 266-8623 

Report provides ESG data three months sooner than previous years

HOUSTON--(BUSINESS WIRE)--Kinder Morgan, Inc. (NYSE: KMI) announced today the publication of its 2021 Environmental, Social and Governance (ESG) report. This report is being issued three months earlier than in prior years to provide stakeholders earlier access to the company’s ESG information. The 2021 report includes a new section describing KMI’s programs related to community engagement on energy and environmental justice. It also provides new metrics detailing the amount the company pays in property taxes each year and the percentage of female and minority employees who completed leadership training. An updated scenario analysis, that aligns with the Task Force on Climate-related Financial Disclosures guidelines, is now available as well as company-wide Scope 1 and Scope 2 greenhouse gas (GHG) emissions and emissions intensity. The emissions data includes both operational control and equity share, two types of reporting boundaries that are used to disclose GHG data.

“We are pleased to be publishing our report three months earlier than usual,” said KMI’s Chief Operating Officer James Holland. “Not only were we able to accomplish our goal of achieving this earlier publication date, but we also built on our prior year’s report by adding new metrics related to KMI’s social and environmental initiatives in 2021. This coverage further enhances our report, and along with our continued disclosure of emissions and emission sources, reflects Kinder Morgan’s continued commitment to transparent and responsible operations.”

The 2021 ESG report is available on the KMI website on the ESG Reports page. In addition, an updated presentation with information from the 2021 ESG report is available on the Events and Presentations page on the investor relations section of the KMI website.

About Kinder Morgan, Inc.

Kinder Morgan, Inc. (NYSE: KMI) is one of the largest energy infrastructure companies in North America. Access to reliable, affordable energy is a critical component for improving lives around the world. We are committed to providing energy transportation and storage services in a safe, efficient and environmentally responsible manner for the benefit of the people, communities and businesses we serve. We own an interest in or operate approximately 83,000 miles of pipelines, 141 terminals, and 700 billion cubic feet of working natural gas storage capacity. Our pipelines transport natural gas, refined petroleum products, renewable fuels, crude oil, condensate, CO2 and other products, and our terminals store and handle various commodities including gasoline, diesel fuel, renewable fuel feedstock, chemicals, ethanol, metals and petroleum coke. Learn more about our renewables initiatives on the low carbon solutions page at www.kindermorgan.com.


Contacts

Media Relations
Amy Baek
(713) 420 -4644
This email address is being protected from spambots. You need JavaScript enabled to view it.

Investor Relations
(800) 348-7320
This email address is being protected from spambots. You need JavaScript enabled to view it.
www.kindermorgan.com

LUGANO, Switzerland & WESTLAKE VILLAGE, Calif.--(BUSINESS WIRE)--Energy Vault Holdings, Inc. (NYSE: NRGV, NRGV WS) (“Energy Vault), a leader in sustainable grid-scale energy storage solutions, announced today that the Company will release its earnings results for the second quarter ended June 30, 2022 on Monday, August 8, 2022 followed by a conference call at 8:00 AM ET.

Participants may access the call at 1-877-704-4453, international callers may use 1-201-389-0920, and request to join the Energy Vault Holdings earnings call. A live webcast will also be available at https://investors.energyvault.com/events-and-presentations/events.

A telephonic replay of the call will be available shortly after the conclusion of the call and until August 22, 2022. Participants may access the replay at 1-844-512-2921, international callers may use 1-412-317-6671 and enter access code 13731405. An archived replay of the call will also be available on the investors portion of the Energy Vault website at https://investors.energyvault.com/.

About Energy Vault

Energy Vault develops sustainable energy storage solutions designed to transform the world’s approach to utility-scale energy storage for grid resiliency. The company’s proprietary, gravity-based Energy Storage Technology and the Energy Storage Management and Integration Platform are intended to help utilities, independent power producers and large industrial energy users significantly reduce their levelized cost of energy while maintaining power reliability. Utilizing eco-friendly materials with the ability to integrate waste materials for beneficial re-use, Energy Vault is facilitating the shift to a circular economy while accelerating the clean energy transition for its customers.

For more information on Energy Vault, please see the Company’s website at https://www.energyvault.com/


Contacts

Investors:
This email address is being protected from spambots. You need JavaScript enabled to view it.

Media:
This email address is being protected from spambots. You need JavaScript enabled to view it.

HOUSTON--(BUSINESS WIRE)--Aris Water Solutions, Inc. (NYSE: ARIS) (“Aris”, “Aris Water” or the “Company”) announced today that it will host a conference call to discuss its second quarter 2022 results on Thursday, August 4, 2022 at 9:30 a.m. Central Time (10:30 a.m. Eastern Time). Aris will issue its second quarter 2022 earnings release after market close on August 3, 2022.


Participants should call (877) 407-5792 and refer to Aris Water Solutions, Inc. when dialing in. Participants are encouraged to log in to the webcast or dial in to the conference call approximately ten minutes prior to the start time. To listen via live webcast, please visit the Investor Relations section of the Company’s website, www.ariswater.com.

An audio replay of the conference call will be available shortly after the conclusion of the call and will remain available for approximately fourteen days. It can be accessed by dialing (877) 660-6853 within the United States or (201) 612-7415 outside of the United States. The conference call replay access code is 13730563.

About Aris Water Solutions, Inc.

Aris Water Solutions, Inc. (NYSE: ARIS) is a leading, growth-oriented environmental infrastructure and solutions company that directly helps its customers reduce their water and carbon footprints. Aris Water delivers full-cycle water handling and recycling solutions that increase the sustainability of energy company operations. Its integrated pipelines and related infrastructure create long-term value by delivering high-capacity, comprehensive produced water management, recycling and supply solutions to operators in the core areas of the Permian Basin. Additional information is available on our website, www.ariswater.com.


Contacts

David Tuerff
Senior Vice President, Finance and Investor Relations
(281) 501-3070
This email address is being protected from spambots. You need JavaScript enabled to view it.

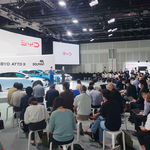
TOKYO--(BUSINESS WIRE)--On July 21, BYD JAPAN Inc., a branch of BYD Company Limited in Japan, held a brand conference in Tokyo, marking BYD's official entry into the passenger vehicle market in Japan. Three BYD models debuted at the conference - BYD ATTO 3, BYD DOLPHIN, and BYD SEAL.


BYD ATTO 3 is slated to become the first BYD passenger vehicle sold in Japan, with sales expected to begin in January 2023. BYD DOLPHIN and BYD SEAL are expected to follow soon after, hitting the market in the middle and second half of 2023, respectively. These three EVs bring more choices and further enhance the local electric passenger vehicle market.

Wang Chuanfu, Chairman and President of BYD, said: "As one of the first enterprises to develop electric vehicles in the world, BYD has accumulated 27 years of expertise and experience in the field of new energy vehicles, and has mastered the advanced technologies spanning batteries, electric motors, electronic control systems and automotive-grade chips. Today, with the support and expectation of consumers, BYD officially hits the new energy passenger vehicle market in Japan. Through the joint efforts of BYD and the local NEV market, we are dedicated to leading the way in e-mobility for a better life.”

Liu Xueliang, General Manager of BYD Asia-Pacific Auto Sales Division, stated: "Starting from today, BYD, along with Japanese dealers and partners, will gradually establish a complete sales and service system to bring a low-carbon lifestyle and a better customer experience for the local people."

BYD started serving Japanese customers with rechargeable batteries as early as 1999. Later, BYD began providing innovative new energy storage products, solar energy products, pure electric buses, pure electric forklifts, and other goods that expedited Japan’s green and sustainable development. BYD’s excellent operational performance has earned BYD an outstanding reputation in Japan.

Currently, BYD’s new energy vehicle footprint extends to over 400 cities and across 70 countries and regions on six continents. Driven by technological innovations, BYD is providing global customers with overall new energy solutions and helping to "Cool the Earth by 1℃."

About BYD

BYD (Build Your Dreams) is a multinational high-tech company devoted to leveraging technological innovations for a better life. BYD now has four industries including Auto, Electronics, New Energy, and Rail Transit. Since its foundation in 1995, the company quickly developed solid expertise in rechargeable batteries and has become a relentless advocate of sustainable development, successfully expanding its renewable energy solutions globally with operations in over 50 countries and regions. Its creation of a Zero Emissions Energy Ecosystem, comprising affordable solar power generation, reliable energy storage, and cutting-edge electrified transportation, has made it an industry leader in the energy and transportation sectors. BYD is a Warren Buffet-backed company and is listed both on the Hong Kong and Shenzhen Stock Exchanges. More information on the company can be found at http://www.byd.com.


Contacts

Asia-Pacific: Mia Gu, This email address is being protected from spambots. You need JavaScript enabled to view it. tel: +86-755-8988-8888-69666
Europe: Penny Peng, This email address is being protected from spambots. You need JavaScript enabled to view it. tel: +31-102070888
North America: Frank Girardot, This email address is being protected from spambots. You need JavaScript enabled to view it. tel: +1 213 245 6503
Latin America: Sofίa Mardones, This email address is being protected from spambots. You need JavaScript enabled to view it. tel: +56 9 9821 6851
Brazil: Adalberto Maluf, This email address is being protected from spambots. You need JavaScript enabled to view it. tel: +19 3514 2554
Africa: Nikki Li, This email address is being protected from spambots. You need JavaScript enabled to view it. tel: +86-18938862670

U.S.-based Solar Axiom LLC and On.Energy have partnered up to install an On.Energy BESS at Wyndham Hospitality's Turtle Island Beach Resort in Belize


MIAMI--(BUSINESS WIRE)--On.Energy has been awarded the deployment and operation for a Battery Energy Storage System (BESS) and Energy Management System (EMS) in an isolated microgrid application for Solar Axiom at the Turtle Island Beach Resort.

Located off the coast of Belize near San Pedro, this resort will switch from a diesel backup generation to a battery-powered clean energy system. The new On.Energy BESS will allow Turtle Island Beach Resort to eliminate its reliance on fossil fuels completely while also providing clean and reliable power for its facilities.

"We are excited to start this new isolated microgrid project alongside Solar Axiom to help Turtle Island Beach Resort achieve its goal of 100% renewable energy and the Belize government's goal of a green economy," said Salvatore Minopoli, On.Energy's President of North America. "On.Energy is committed to providing smarter and cleaner energy solutions for its customers, and this project is part of our efforts to help the energy transition happen."

By adding an On.Energy BESS to its existing solar system, Solar Axiom will enable Turtle Island Beach Resort to store solar-generated electricity for times when the sun is not shining. The batteries are designed for long-term use with minimal maintenance needed and, thanks to On.Energy's On.Command software, automatic operation, and remote monitoring will keep the system running safely and efficiently.

"Solar Axiom is proud to have teamed with Turtle Island Beach Resort and On.Energy on this extraordinary project. Adding a BESS to our existing solar system completes the 100% renewable energy loop in the microgrid for this isolated resort. Thanks to On.Energy, by integrating energy storage to our existing solar, we are demonstrating our commitment to make solar energy happen where it would not otherwise occur," said Elio Muller, President of Solar Axiom LLC, a leading developer in commercial and industrial solar energy systems in the Caribbean, with a focus on the resort industry and isolated islands.

The new system will make it possible for Turtle Island Beach Resort to operate entirely on renewable energy sources and reduce its carbon footprint significantly. By ceasing the use of its previously needed diesel backup generators, Turtle Island Beach Resort will also cease to incur high fuel and O&M costs while reducing its carbon emissions.

"This sets the climate-sensitive mandate for our current expansion plans on Turtle Island Beach Resort. It further demonstrates our commitment to a climate-friendly experience for our guests and support for the Belize Green Economy," said Jeremy Meighan, President of Turtle Island Beach Resorts (Castle Capital Development LTD).

About On.Energy

On.Energy is an end-to-end developer, provider, and integrator of energy solutions with proven experience in the development and deployment of BESS in the Americas utilizing its best-in-class EMS, On.Command. On.Energy has safely and successfully deployed dozens of storage projects in multiple countries across the Americas with both C&I and utility customers. Learn more at www.on.energy.


Contacts

Michelle Hargis
Mercom Communications
This email address is being protected from spambots. You need JavaScript enabled to view it.
512-215-4452

DUBLIN--(BUSINESS WIRE)--The "US Density Meter Market (2022-2027) by Type, Applications, Industry Vertical, Competitive Analysis and the Impact of Covid-19 with Ansoff Analysis" report has been added to ResearchAndMarkets.com's offering.


The US Density Meter Market is estimated to be USD 146.21 Mn in 2022 and is projected to reach USD 175.17 Mn by 2027, growing at a CAGR of 3.68%.

Market dynamics are forces that impact the prices and behaviors of the US Density Meter Market stakeholders. These forces create pricing signals which result from the changes in the supply and demand curves for a given product or service.

Forces of Market Dynamics may be related to macro-economic and micro-economic factors. There are dynamic market forces other than price, demand, and supply. Human emotions can also drive decisions, influence the market, and create price signals.

As the market dynamics impact the supply and demand curves, decision-makers aim to determine the best way to use various financial tools to stem various strategies for speeding the growth and reducing the risks.

Company Profiles

Some of the companies covered in this report are Ametek Inc, Berthold Technologies GmbH & Co. KG, Eagle Eye Power Solutions LLC, etc.

The report provides a detailed analysis of the competitors in the market. It covers the financial performance analysis for the publicly listed companies in the market. The report also offers detailed information on the companies' recent development and competitive scenario.

Competitive Quadrant

The report includes Competitive Quadrant, a proprietary tool to analyze and evaluate the position of companies based on their Industry Position score and Market Performance score.

The tool uses various factors for categorizing the players into four categories. Some of these factors considered for analysis are financial performance over the last 3 years, growth strategies, innovation score, new product launches, investments, growth in market share, etc.

Ansoff Analysis

The report presents a detailed Ansoff matrix analysis for the US Density Meter Market. Ansoff Matrix, also known as Product/Market Expansion Grid, is a strategic tool used to design strategies for the growth of the company.

The matrix can be used to evaluate approaches in four strategies viz. Market Development, Market Penetration, Product Development and Diversification. The matrix is also used for risk analysis to understand the risk involved with each approach.

The analyst analyses the US Density Meter Market using the Ansoff Matrix to provide the best approaches a company can take to improve its market position.

Market Dynamics

Drivers

  • Rising Demand from Oil & Gas and Pharmaceutical Industry
  • Government Initiatives in the Water and Wastewater Treatment Industry

Restraints

  • Tradeoff Between the Accuracy and Cost of the Density Meter Equipment

Opportunities

  • Rise in the Volume of Industrial Automation

Challenges

  • Illegal Supply of Patented Technologies

Market Segmentations

  • By Type, the market is classified into Benchtop, Portable, and Submersible.
  • By Applications, the market is classified into Ultrasonic, Microwave, Coriolis, and Others.
  • By Industry Vertical, the market is classified into Chemical & Petrochemical, Oil & Gas, Metals & Mining, Food & Beverages, Waste Water Treatment, and Others.

Company Profiles

  • Ametek Inc
  • Berthold Technologies GmbH & Co. KG
  • Eagle Eye Power Solutions LLC
  • Emerson Electric Co
  • Endress+Hauser
  • Koehler Instrument Company Inc
  • Lemis Baltic
  • Meidensha Corp
  • Mettler Toledo
  • Red Meters
  • SensoTech GmbH
  • Toshiba Infrastructure Systems & Solutions Corp
  • VWR International (Avantor)

For more information about this report visit https://www.researchandmarkets.com/r/8284p2


Contacts

ResearchAndMarkets.com
Laura Wood, Senior Press Manager
This email address is being protected from spambots. You need JavaScript enabled to view it.
For E.S.T Office Hours Call 1-917-300-0470
For U.S./CAN Toll Free Call 1-800-526-8630
For GMT Office Hours Call +353-1-416-8900

PERTH, Australia--(BUSINESS WIRE)--Woodside provides the following information in relation to its Second Quarter 2022 Report, changes to conversion factors, and the impact on reported production and full-year 2022 production guidance.


Woodside confirms that there is no change to the physical product volumes underpinning the full-year 2022 production guidance issued by Woodside in January 2022, which did not include BHP Petroleum (BHPP) production.1 There is also no impact on revenue as a result of the change in conversion factors announced in the Second Quarter 2022 Report.

The reduction in the contribution of the pre-merger Woodside assets to full-year 2022 production guidance is solely due to the change in conversion factors. A reconciliation is provided below.

Consistent with common industry practice, Woodside now applies a single volumetric conversion factor when calculating barrels of oil equivalent (boe) for gas products. This consistent methodology applies across the combined portfolio reflecting Woodside’s increased scale and diversified product mix following the merger.

Reconciliation of January 2022 and Second Quarter 2022 Report production guidance

The full-year 2022 production guidance included in the Second Quarter 2022 Report of 145 – 153 million barrels of oil equivalent (MMboe) combines:

  • 2022 production guidance for the pre-merger Woodside assets
  • 2022 production guidance for the BHPP assets from 1 June 2022, and
  • alignment of the conversion factors for the reporting of boe for all gas products.

The comparison of Woodside’s production guidance between January 2022 and in the Second Quarter 2022 Report is:


Production guidance issued
January 2022 (MMboe)

Production guidance issued
Q2 2022 (MMboe)

Relevant conversion factor:

Based on product-specific energy
conversion factors for gas

Based on volumetric conversion factor of
5,700 scf to 1 boe

LNG

71 – 74

67 – 70

Pipeline gas

4 – 5

4 – 5

Crude and condensate

16 – 18

16 – 18

Natural gas liquids (NGLs)

~0.5

~0.6

Woodside excluding BHPP

92 – 98

88 – 94


BHPP contribution (from 1 June)

-

57 – 59


Production range

92 – 98

145 – 153

Numbers are subject to minor rounding differences

LNG and pipeline gas for production and reserves will be reported in boe and calculated from a volumetric basis with a conversion factor of 5,700 standard cubic feet (scf) per boe. BHPP previously used 6,000 scf per boe. NGLs will be reported on a liquid volume basis.

The change has not impacted the previously reported production volumes of LNG in tonnes in the First Quarter 2022 Report. The Second Quarter 2022 Report has restated First Quarter 2022 realised price in boe to reflect the change in conversion factors.

This announcement was approved and authorised for release by Woodside’s Disclosure Committee.

1 Refer to Woodside’s Fourth Quarter 2021 Report, released to the ASX on 20 January 2022.

Forward-looking statements

This announcement contains forward-looking statements with respect to Woodside’s business and operations, market conditions, results of operations and financial condition which reflect Woodside’s views held as at the date of this announcement. All statements, other than statements of historical or present facts, are forward-looking statements and generally may be identified by the use of forward-looking words such as ‘guidance’, ‘foresee’, ‘likely’, ‘potential’, ‘anticipate’, ‘believe’, ‘aim’, ‘estimate’, ‘expect’, ‘intend’, ‘may’, ‘target’, ‘plan’, ‘forecast’, ‘project’, ‘schedule’, ‘will’, ‘should’, ‘seek’ and other similar words or expressions. These forward-looking statements include, but are not limited to, statements about our expectations for full-year 2022 production results. Forward-looking statements are not guarantees of future performance and are subject to inherent known and unknown risks, uncertainties, assumptions and other factors, many of which are beyond the control of Woodside, its related bodies corporate and their respective officers, directors, employees, advisers or representatives. Important factors that could cause actual results to differ materially from those in the forward-looking statements include, but are not limited to: fluctuations in commodity prices; the impact of armed conflict and political instability (such as the ongoing conflict in Ukraine) on economic activity and oil and gas supply and demand; operating hazards, natural disasters, severe storms and other adverse weather conditions; and a shortage of skilled labor and construction materials, equipment and supplies. Details of the key risks relating to Woodside and its business can be found in the “Risk” section of Woodside’s most recent Annual Report which was released to the Australian Securities Exchange on 17 February 2022 and Woodside’s filings with the U.S. Securities and Exchange Commission. You should review and have regard to these risks when considering the information contained in this announcement.

Investors are strongly cautioned not to place undue reliance on any forward-looking statements. Actual results or performance may vary materially from those expressed in, or implied by, any forward-looking statements. All information included in this announcement, including any forward-looking statements, speak only as of the date of this announcement and, except as required by law or regulation, Woodside does not undertake to update or revise any information or forward-looking statements contained in this announcement, whether as a result of new information, future events, or otherwise.


Contacts

INVESTORS

Australia & Europe | Damien Gare
W: +61 8 9348 4421
M: +61 417 111 697

Americas | Matthew Turnbull
M: +1 (713) 448-0956
E: This email address is being protected from spambots. You need JavaScript enabled to view it.

MEDIA

Christine Forster
M: +61 484 112 469
E: This email address is being protected from spambots. You need JavaScript enabled to view it.

KANSAS CITY, Mo.--(BUSINESS WIRE)--Kansas City Southern (KCS) has released a 2021 sustainability data update to its sustainability report, “For the Long Haul: Delivering Prosperity, Valuing People, Protecting the Planet.” The report is available in the Sustainability Report section of www.kcsouthern.com.


In 2021, KCS continued our sustainability journey by refreshing our materiality assessment and making meaningful progress towards our carbon reductions goals,” said KCS president and CEO Patrick J. Ottensmeyer. “We are proud to share 2021 updates to our sustainability report, which demonstrate our focus on safety, environmentally responsible operations and employee engagement.”

2021 Sustainability Data Update Highlights:

  • KCS greenhouse gas (GHG) emissions reduction targets were approved by the Science-Based Target initiative. In 2021, KCS established targets committing to reducing its scope 1 and 2 GHG emissions per million gross ton-miles at least 42 percent by 2034, from a 2019 base year.
  • KCS improved its reportable injury frequency rate, finishing the year with a six percent reduction from 2020.
  • KCS engaged key stakeholders across our value chain, refreshing our materiality assessment to enhance our sustainability commitments.
  • KCS improved its CDP climate change disclosure score to an A-, landing a spot in the Leadership Level category.

KCS’ sustainability report and 2021 sustainability data update follow the Global Reporting Initiative’s (GRI) latest standards for disclosing governance, economic, social, and environmental topics and is in alignment with the Sustainability Accounting Standards Board (SASB) and Task Force on Climate-related Financial Disclosures (TCFD) frameworks. These standards provide for the disclosure of measurable data and specific information related to sustainability.

Headquartered in Kansas City, Mo., KCS is a transportation holding company that has railroad investments in the U.S., Mexico and Panama. Its primary U.S. holding is The Kansas City Southern Railway Company, serving the central and south-central U.S. Its international holdings include Kansas City Southern de Mexico, S.A. de C.V., serving northeastern and central Mexico and the port cities of Lázaro Cárdenas, Tampico and Veracruz, and a 50 percent interest in Panama Canal Railway Company, providing ocean-to-ocean freight and passenger service along the Panama Canal. KCS' North American rail holdings and strategic alliances with other North American rail partners are primary components of a unique railway system, linking the commercial and industrial centers of the U.S., Mexico and Canada. More information about KCS can be found at www.kcsouthern.com.


Contacts

C. Doniele Carlson, 816-983-1372, This email address is being protected from spambots. You need JavaScript enabled to view it.

Planned Meetings through September also listed

HOUSTON--(BUSINESS WIRE)--The Port Commission of the Port of Houston Authority will hold its regular monthly meeting on Tuesday, August 2, 2022. It will be conducted as a hybrid meeting starting at 9:15 a.m. A quorum of the Port Commission, along with executive leadership and legal counsel, will be present in the boardroom of the Port Authority Executive Office Building, located at 111 East Loop North, Houston, TX 77029.


The meeting is open to the public to attend in person, and the meeting can also be accessed virtually via WebEx webinar.

The agenda and the instructions to access Port Houston public meetings are available at https://porthouston.com/leadership/public-meetings/.

Please note the following upcoming Port Houston public meetings (subject to change):

August 1

10:00 a.m.

Audit Committee Meeting

August 2

9:15 a.m.

Port Commission Regular Meeting


10:00 a.m.

Business Equity Committee Meeting


(Rescheduled from July 28th)

September 20

10:00 a.m.

Pension and Benefits Committee

September 27

9:15 a.m.

Port Commission Regular Meeting


10:00 a.m.

Community Relations Committee Meeting


Sign up for public comment is available up to an hour before these meetings by contacting Erik Eriksson at This email address is being protected from spambots. You need JavaScript enabled to view it. or Liana Christian at This email address is being protected from spambots. You need JavaScript enabled to view it.

About Port Houston

For more than 100 years, Port Houston has owned and operated the public wharves and terminals along the Houston Ship Channel – the nation’s largest port for waterborne tonnage and an essential economic engine for the Houston region, the state of Texas, and the U.S. nation. The more than 200 private and eight public terminals along the federal waterway supports the creation of nearly 1.35 million jobs in Texas and 3.2 million jobs nationwide, and economic activity totaling $339 billion in Texas – 20.6% of Texas’ total gross domestic product (GDP) – and a total of $801.9 billion in economic impact across the nation. For more information, visit the website: https://porthouston.com/


Contacts

Lisa Ashley, Director, Media Relations, Port Houston
Office: 713-670-2644; Mobile: 832-247-8179; E-mail: This email address is being protected from spambots. You need JavaScript enabled to view it.

  • Company increases 2022 full-year earnings guidance to $5.60 - $6.00 per diluted share
  • Demand for railcars remains strong across all regions
  • Investment volume was $314.1 million in the second quarter and totaled $684.5 million year to date


CHICAGO--(BUSINESS WIRE)--GATX Corporation (NYSE:GATX) today reported 2022 second-quarter net income of $2.6 million, or $0.07 per diluted share, compared to net income of $5.5 million, or $0.15 per diluted share, in the second quarter of 2021. The 2022 second-quarter results include net negative impacts of $35.9 million, or $1.00 per diluted share, from Tax Adjustments and Other Items. The most significant item was an impairment charge associated with the Company’s planned sale of its five remaining marine vessels.

Net income for the first six months of 2022 was $78.4 million, or $2.18 per diluted share, compared to $42.0 million, or $1.17 per diluted share, in the prior year period. The 2022 year-to-date results include net negative impacts of $44.4 million, or $1.23 per diluted share, from Tax Adjustments and Other Items. The 2021 second-quarter and year-to-date results included net negative impacts of $43.1 million, or $1.20 per diluted share, from Tax Adjustments and Other Items. Details related to these items are provided in the attached Supplemental Information under Tax Adjustments and Other Items.

"Despite ongoing macroeconomic uncertainty, the operating environment remains strong across our global railcar leasing markets," said Robert C. Lyons, president and chief executive officer of GATX. "Rail North America’s fleet utilization was 99.4% at the end of the second quarter and our renewal success rate was 87.7%. Demand for the majority of railcar types in our fleet remains robust, and absolute lease rates increased sequentially for the eighth consecutive quarter. The renewal lease rate change of GATX’s Lease Price Index was positive 18.3% for the quarter, with an average renewal term of 34 months. In this environment, our commercial team remains focused on improving lease rates while beginning to increase lease terms on many car types.

"Rail International performed well as we continued to experience increases in renewal lease rates. GATX Rail Europe and GATX Rail India expanded their fleets during the quarter while also achieving virtually full fleet utilization at quarter end. In Portfolio Management, the Rolls-Royce and Partners Finance affiliates performed as expected in the second quarter."

Mr. Lyons concluded, "Year-to-date investment volume was nearly $685 million, and we continue to take delivery of new railcars to meet customer demand worldwide. Based on current strength in the global rail markets and a robust secondary market for railcars, we are increasing our 2022 full-year earnings expectations to be in the range of $5.60 to $6.00 per diluted share, excluding any impact from Tax Adjustments and Other Items."

RAIL NORTH AMERICA

Rail North America reported segment profit of $53.1 million in the second quarter of 2022, compared to $77.6 million in the second quarter of 2021. Lower second-quarter segment profit was driven by lower gains on asset dispositions, partially offset by lower maintenance expense. Year to date 2022, Rail North America reported segment profit of $173.5 million, compared to $143.3 million in the same period of 2021. Higher 2022 year-to-date results were predominantly driven by higher gains on asset dispositions.

At June 30, 2022, Rail North America’s wholly owned fleet was comprised of approximately 111,600 cars, including approximately 10,300 boxcars. The following fleet statistics and performance discussion exclude the boxcar fleet.

Fleet utilization was 99.4% at the end of the second quarter, compared to 99.3% at the end of the prior quarter and 98.5% at the end of the second quarter of 2021. During the second quarter, the renewal lease rate change of the GATX Lease Price Index (LPI) was positive 18.3%. This compares to positive 9.3% in the prior quarter and negative 6.7% in the second quarter of 2021. The average lease renewal term for all cars included in the LPI during the second quarter was 34 months, compared to 30 months in the prior quarter and 29 months in the second quarter of 2021. Rail North America’s investment volume during the second quarter of 2022 was $253.7 million.

Additional fleet statistics, including information on the boxcar fleet, and macroeconomic data related to Rail North America’s business are provided on the last page of this press release.

RAIL INTERNATIONAL

Rail International’s segment profit was $28.3 million in the second quarter of 2022, compared to $27.3 million in the second quarter of 2021. Year to date 2022, Rail International reported segment profit of $53.2 million, compared to $49.1 million for the same period of 2021. Results in the comparative periods were favorably impacted by more railcars on lease and negatively impacted by changes in foreign currency exchange rates.

At June 30, 2022, GATX Rail Europe’s (GRE) fleet consisted of approximately 27,500 cars. Utilization was 99.9%, compared to 99.0% at the end of the prior quarter and 98.4% at the end of the second quarter of 2021. Additional fleet statistics for GRE are provided on the last page of this press release.

PORTFOLIO MANAGEMENT

Portfolio Management reported segment loss of $15.7 million in the second quarter of 2022, compared to segment profit of $12.2 million in the second quarter of 2021. Year to date 2022, segment loss was $19.6 million, compared to segment profit of $18.3 million for the same period of 2021.

Second-quarter 2022 segment results include an impairment charge of $31.5 million associated with the planned divestiture of five specialized gas vessels. These vessels represent the last assets of a legacy business activity that is not core to GATX operations. Additionally, year-to-date 2022 segment results include a net impairment charge associated with three aircraft spare engines in Russia that the Rolls-Royce and Partners Finance affiliates (RRPF) do not expect to recover, of which GATX’s share is $15.3 million. Excluding these impacts, second-quarter and year-to-date 2022 segment results increased relative to a year ago. Higher second-quarter 2022 segment results were primarily due to higher share of affiliates’ earnings from RRPF. Higher year-to-date 2022 segment results were driven by stronger marine operating results and higher share of affiliates’ earnings from RRPF.

COMPANY DESCRIPTION

At GATX Corporation (NYSE:GATX), we empower our customers to propel the world forward. GATX leases transportation assets including railcars, aircraft spare engines and tank containers to customers worldwide. Our mission is to provide innovative, unparalleled service that enables our customers to transport what matters safely and sustainably while championing the well-being of our employees and communities. GATX has been headquartered in Chicago, Illinois since its founding in 1898.

TELECONFERENCE INFORMATION

GATX Corporation will host a teleconference to discuss 2022 second-quarter results. Call details are as follows:

Thursday, July 21, 2022
11 a.m. Eastern Time
Domestic Dial-In: 1-800-289-0720
International Dial-In: 1-323-701-0160
Replay: 1-888-203-1112 or 1-719-457-0820 / Access Code: 4208735

Call-in details, a copy of this press release and real-time audio access are available at www.gatx.com. Please access the call 15 minutes prior to the start time. A replay will be available on the same site starting at 2 p.m. (Eastern Time), July 21, 2022.

AVAILABILITY OF INFORMATION ON GATX’S WEBSITE

Investors and others should note that GATX routinely announces material information to investors and the marketplace using SEC filings, press releases, public conference calls, webcasts and the GATX Investor Relations website. While not all of the information that the Company posts to the GATX Investor Relations website is of a material nature, some information could be deemed to be material. Accordingly, the Company encourages investors, the media and others interested in GATX to review the information that it shares on www.gatx.com under the “Investor Relations” tab.

FORWARD-LOOKING STATEMENTS

Statements in this Earnings Release not based on historical facts are “forward-looking statements” within the meaning of the Private Securities Litigation Reform Act of 1995 and, accordingly, involve known and unknown risks and uncertainties that are difficult to predict and could cause our actual results, performance, or achievements to differ materially from those discussed. These include statements as to our future expectations, beliefs, plans, strategies, objectives, events, conditions, financial performance, prospects, or future events. In some cases, forward-looking statements can be identified by the use of words such as “may,” “could,” “expect,” “intend,” “plan,” “seek,” “anticipate,” “believe,” “estimate,” “predict,” “potential,” “outlook,” “continue,” “likely,” “will,” “would”, and similar words and phrases. Forward-looking statements are necessarily based on estimates and assumptions that, while considered reasonable by us and our management, are inherently uncertain. Accordingly, you should not place undue reliance on forward-looking statements, which speak only as of the date they are made, and are not guarantees of future performance. We do not undertake any obligation to publicly update or revise these forward-looking statements.

The following factors, in addition to those discussed in our other filings with the SEC, including our Form 10-K for the year ended December 31, 2021, could cause actual results to differ materially from our current expectations expressed in forward-looking statements:

  • the duration and effects of the global COVID-19 pandemic and any mandated pandemic mitigation requirements, including adverse impacts on our business, personnel, operations, commercial activity, supply chain, the demand for our transportation assets, the value of our assets, our liquidity, and macroeconomic conditions
  • exposure to damages, fines, criminal and civil penalties, and reputational harm arising from a negative outcome in litigation, including claims arising from an accident involving our transportation assets
  • inability to maintain our transportation assets on lease at satisfactory rates due to oversupply of assets in the market or other changes in supply and demand
  • a significant decline in customer demand for our transportation assets or services, including as a result of:
    • weak macroeconomic conditions
    • weak market conditions in our customers’ businesses
    • adverse changes in the price of, or demand for, commodities
    • changes in railroad operations, efficiency, pricing and service offerings, including those related to "precision scheduled railroading"
    • changes in, or disruptions to, supply chains
    • availability of pipelines, trucks, and other alternative modes of transportation
    • changes in conditions affecting the aviation industry, including reduced demand for air travel, geographic exposure and customer concentrations
    • other operational or commercial needs or decisions of our customers
    • customers’ desire to buy, rather than lease, our transportation assets
  • higher costs associated with increased assignments of our transportation assets following non-renewal of leases, customer defaults, and compliance maintenance programs or other maintenance initiatives
  • events having an adverse impact on assets, customers, or regions where we have a concentrated investment exposure
  • financial and operational risks associated with long-term purchase commitments for transportation assets
  • reduced opportunities to generate asset remarketing income


  • inability to successfully consummate and manage ongoing acquisition and divestiture activities
  • reliance on Rolls-Royce in connection with our aircraft spare engine leasing businesses, and the risks that certain factors that adversely affect Rolls-Royce could have an adverse effect on our businesses
  • fluctuations in foreign exchange rates
  • inflation and deflation
  • failure to successfully negotiate collective bargaining agreements with the unions representing a substantial portion of our employees
  • asset impairment charges we may be required to recognize
  • deterioration of conditions in the capital markets, reductions in our credit ratings, or increases in our financing costs
  • changes in banks’ inter-lending rate reporting practices and the phasing out of LIBOR
  • competitive factors in our primary markets, including competitors with significantly lower costs of capital
  • risks related to our international operations and expansion into new geographic markets, including laws, regulations, tariffs, taxes, treaties or trade barriers affecting our activities in the countries where we do business
  • changes in, or failure to comply with, laws, rules, and regulations
  • U.S. and global political conditions, including the ongoing military action between Russia and Ukraine
  • inability to obtain cost-effective insurance
  • environmental liabilities and remediation costs
  • potential obsolescence of our assets
  • inadequate allowances to cover credit losses in our portfolio
  • operational, functional and regulatory risks associated with severe weather events, climate change and natural disasters
  • inability to maintain and secure our information technology infrastructure from cybersecurity threats and related disruption of our business
  • changes in assumptions, increases in funding requirements or investment losses in our pension and post-retirement plans
  • inability to maintain effective internal control over financial reporting and disclosure controls and procedures


GATX CORPORATION AND SUBSIDIARIES

CONDENSED CONSOLIDATED STATEMENTS OF INCOME (UNAUDITED)

(In millions, except per share data)


Three Months Ended

June 30


Six Months Ended

June 30


2022


2021


2022


2021


Revenues


Lease revenue

$

284.9


$

287.6


$

568.2


$

568.2


Marine operating revenue


5.2


5.1


11.4


8.7


Other revenue


22.6


24.4


49.7


46.0


Total Revenues


312.7


317.1


629.3


622.9


Expenses


Maintenance expense


70.8


76.6


145.4


150.9


Marine operating expense


3.9


5.5


8.1


10.1


Depreciation expense


90.0


91.5


179.5


180.1


Operating lease expense


9.0


10.2


18.1


21.1


Other operating expense


9.3


11.4


20.0


21.6


Selling, general and administrative expense


47.9


47.8


95.1


94.9


Total Expenses


230.9


243.0


466.2


478.7


Other Income (Expense)


Net (loss) gain on asset dispositions


(24.2

)


34.7


49.5


57.2


Interest expense, net


(51.9

)


(50.0

)


(103.1

)


(103.6

)

Other expense


(11.3

)


(8.1

)


(13.3

)


(9.4

)

Income before Income Taxes and Share of Affiliates’ Earnings


(5.6

)


50.7


96.2


88.4


Income taxes


(2.7

)


(13.6

)


(25.1

)


(22.0

)

Share of affiliates’ earnings (losses), net of taxes


10.9


(31.6

)


7.3


(24.4

)

Net Income

$

2.6


$

5.5


$

78.4


$

42.0


Share Data


Basic earnings per share

$

0.07


$

0.16


$

2.21


$

1.19


Average number of common shares


35.5


35.4


35.5


35.3


Diluted earnings per share

$

0.07


$

0.15


$

2.18


$

1.17


Average number of common shares and common share equivalents


36.0


36.0


36.0


35.9


Dividends declared per common share

$

0.52


$

0.50


$

1.04


$

1.00


GATX CORPORATION AND SUBSIDIARIES

CONDENSED CONSOLIDATED BALANCE SHEETS (UNAUDITED)

(In millions)


June 30


December 31


2022


2021


Assets


Cash and Cash Equivalents

$

180.3


$

344.3


Restricted Cash


0.2


0.2


Receivables


Rent and other receivables


68.4


69.8


Finance leases (as lessor)


103.1


100.2


Less: allowance for losses


(6.2

)


(6.2

)


165.3


163.8


Operating Assets and Facilities


11,200.7


11,163.6


Less: allowance for depreciation


(3,309.8

)


(3,378.8

)


7,890.9


7,784.8


Lease Assets (as lessee)


Right-of-use assets, net of accumulated depreciation


254.4


270.7


Finance leases, net of accumulated depreciation


1.5


254.4


272.2


Investments in Affiliated Companies


596.5


588.4


Goodwill


115.3


123.0


Other Assets ($73.8 million and $3.8 million related to assets held for sale)


321.3


265.0


Total Assets

$

9,524.2


$

9,541.7


Liabilities and Shareholders’ Equity


Accounts Payable and Accrued Expenses

$

166.5


$

215.8


Debt


Commercial paper and borrowings under bank credit facilities


20.0


18.1


Recourse


5,964.4


5,887.5


5,984.4


5,905.6


Lease Obligations (as lessee)


Operating leases


266.7


286.2


Finance leases


1.5


266.7


287.7


Deferred Income Taxes


1,005.8


1,001.0


Other Liabilities


119.3


112.4


Total Liabilities


7,542.7


7,522.5


Total Shareholders’ Equity


1,981.5


2,019.2


Total Liabilities and Shareholders’ Equity

$

9,524.2


$

9,541.7


GATX CORPORATION AND SUBSIDIARIES

SEGMENT DATA (UNAUDITED)

Three Months Ended June 30, 2022

(In millions)


Rail

North America


Rail
International


Portfolio
Management


Other


GATX
Consolidated

Revenues


Lease revenue

$

203.0


$

66.5


$

8.2


$

7.2


$

284.9


Marine operating revenue


5.2


5.2


Other revenue


18.8


1.9


0.1


1.8


22.6


Total Revenues


221.8


68.4


13.5


9.0


312.7


Expenses


Maintenance expense


57.8


12.2


0.8


70.8


Marine operating expense


3.9


3.9


Depreciation expense


64.9


17.2


4.9


3.0


90.0


Operating lease expense


9.0


9.0


Other operating expense


5.9


2.1


0.6


0.7


9.3


Total Expenses


137.6


31.5


9.4


4.5


183.0


Other Income (Expense)


Net gain (loss) on asset dispositions


5.1


1.4


(30.8

)


0.1


(24.2

)

Interest expense, net


(34.9

)


(11.1

)


(4.6

)


(1.3

)


(51.9

)

Other (expense) income


(1.3

)


1.1


(11.1

)


(11.3

)

Share of affiliates’ pre-tax earnings


15.6


15.6


Segment profit (loss)

$

53.1


$

28.3


$

(15.7

)


$

(7.8

)


$

57.9


Less:


Selling, general and administrative expense


47.9


Income taxes (includes $4.7 related to affiliates’ earnings)


7.4


Net income

$

2.6


Selected Data:


Investment volume

$

253.7


$

48.8


$


$

11.6


$

314.1


Net Gain on Asset Dispositions


Asset Remarketing Income:


Net gains on disposition of owned assets

$

1.2


$

0.3


$


$

0.1


$

1.6


Residual sharing income


0.1


0.7


0.8


Non-remarketing net gains (1)


3.8


1.1


4.9


Asset impairments


(31.5

)


(31.5

)


$

5.1


$

1.4


$

(30.8

)


$

0.1


$

(24.2

)

__________

(1) Includes net gains (losses) from scrapping of railcars.

GATX CORPORATION AND SUBSIDIARIES

SEGMENT DATA (UNAUDITED)

Three Months Ended June 30, 2021

(In millions)


Rail

North America


Rail
International


Portfolio
Management


Other


GATX
Consolidated

Revenues


Lease revenue

$

204.2


$

69.0


$

8.3


$

6.1


$

287.6


Marine operating revenue


5.1


5.1


Other revenue


19.2


2.7


0.2


2.3


24.4


Total Revenues


223.4


71.7


13.6


8.4


317.1


Expenses


Maintenance expense


61.5


14.2


0.9


76.6


Marine operating expense


5.5


5.5


Depreciation expense


65.2


18.4


5.0


2.9


91.5


Operating lease expense


10.2


10.2


Other operating expense


8.4


1.7


0.4


0.9


11.4


Total Expenses


145.3


34.3


10.9


4.7


195.2


Other Income (Expense)


Net gain on asset dispositions


33.1


0.8


0.5


0.3


34.7


Interest expense, net


(32.6

)


(11.1

)


(4.4

)


(1.9

)


(50.0

)

Other (expense) income


(1.0

)


0.2


(7.3

)


(8.1

)

Share of affiliates’ pre-tax earnings


13.4


13.4


Segment profit (loss)

$

77.6


$

27.3


$

12.2


$

(5.2

)


$

111.9


Less:


Selling, general and administrative expense


47.8


Income taxes (includes $45.0 related to affiliates’ earnings)


58.6


Net income

$

5.5


Selected Data:


Investment volume

$

106.4


$

40.8


$

0.5


$

6.2


$

153.9


Net Gain on Asset Dispositions


Asset Remarketing Income:


Net gains on disposition of owned assets

$

31.5


$

0.4


$


$

0.3


$

32.2


Residual sharing income


0.5


0.5


1.0


Non-remarketing net gains (1)


1.1


0.4


1.5


$

33.1


$

0.8


$

0.5


$

0.3


$

34.7


__________

(1) Includes net gains (losses) from scrapping of railcars.

GATX CORPORATION AND SUBSIDIARIES

SEGMENT DATA (UNAUDITED)

Six Months Ended June 30, 2022

(In millions)


Rail

North America


Rail
International


Portfolio
Management


Other


GATX
Consolidated

Revenues


Lease revenue

$

403.7


$

134.1


$

16.5


$

13.9


$

568.2


Marine operating revenue


11.4


11.4


Other revenue


41.8


4.2


0.1


3.6


49.7


Total Revenues


445.5


138.3


28.0


17.5


629.3


Expenses


Maintenance expense


117.7


26.2


1.5


145.4


Marine operating expense


8.1


8.1


Depreciation expense


128.4


35.2


9.9


6.0


179.5


Operating lease expense


18.1


18.1


Other operating expense


13.2


4.5


1.1


1.2


20.0


Total Expenses


277.4


65.9


19.1


8.7


371.1


Other Income (Expense)


Net gain (loss) on asset dispositions


76.7


2.4


(29.9

)


0.3


49.5


Interest expense, net


(69.3

)


(22.3

)


(9.3

)


(2.2

)


(103.1

)

Other (expense) income


(2.0

)


0.7


(0.1

)


(11.9

)


(13.3

)

Share of affiliates’ pre-tax earnings


10.8


10.8


Segment profit (loss)

$

173.5


$

53.2


$

(19.6

)


$

(5.0

)


$

202.1


Less:


Selling, general and administrative expense


95.1


Income taxes (includes $3.5 related to affiliates’ earnings)


28.6


Net income

$

78.4


Selected Data:


Investment volume

$

534.1


$

127.7


$


$

22.7


$

684.5


Net Gain on Asset Dispositions


Asset Remarketing Income:


Net gains on disposition of owned assets

$

65.6


$

0.7


$


$

0.2


$

66.5


Residual sharing income


2.1


1.6


3.7


Non-remarketing net gains (1)


9.0


1.7


0.1


10.8


Asset impairments


(31.5

)


(31.5

)


$

76.7


$

2.4


$

(29.9

)


$

0.3


$

49.5


__________

(1) Includes net gains (losses) from scrapping of railcars.

GATX CORPORATION AND SUBSIDIARIES

SEGMENT DATA (UNAUDITED)

Six Months Ended June 30, 2021

(In millions)


Rail

North America


Rail
International


Portfolio
Management


Other


GATX
Consolidated

Revenues


Lease revenue

$

411.0


$

135.9


$

11.6


$

9.7


$

568.2


Marine operating revenue


8.7


8.7


Other revenue


37.0


5.2


0.4


3.4


46.0


Total Revenues


448.0


141.1


20.7


13.1


622.9


Expenses


Maintenance expense


119.9


29.6


1.4


150.9


Marine operating expense


10.1


10.1


Depreciation expense


130.9


36.7


7.7


4.8


180.1


Operating lease expense


21.1


21.1


Other operating expense


16.0


3.7


0.6


1.3


21.6


Total Expenses


287.9


70.0


18.4


7.5


383.8


Other Income (Expense)


Net gain on asset dispositions


54.6


1.1


1.1


0.4


57.2


Interest expense, net


(69.6

)


(23.3

)


(7.5

)


(3.2

)


(103.6

)

Other (expense) income


(1.8

)


0.2


(7.8

)


(9.4

)

Share of affiliates’ pre-tax earnings


22.4


22.4


Segment profit (loss)

$

143.3


$

49.1


$

18.3


$

(5.0

)


$

205.7


Less:


Selling, general and administrative expense


94.9


Income taxes (includes $46.8 related to affiliates’ earnings)


68.8


Net income

$

42.0


Selected Data:


Investment volume

$

215.5


$

85.2


$

353.0


$

9.7


$

663.4


Net Gain on Asset Dispositions


Asset Remarketing Income:


Net gains on disposition of owned assets

$

47.8


$

0.4


$


$

0.3


$

48.5


Residual sharing income


0.6


1.1


1.7


Non-remarketing net gains (1)


6.2


0.7


0.1


7.0


$

54.6


$

1.1


$

1.1


$

0.4


$

57.2


__________

(1) Includes net gains (losses) from scrapping of railcars.


Contacts

GATX Corporation
Shari Hellerman
Senior Director
Investor Relations, ESG, and External Communications
312-621-4285
This email address is being protected from spambots. You need JavaScript enabled to view it.


Read full story here

  • Ford has added battery chemistries and secured contracts delivering 60 gigawatt hours (GWh) of annual battery capacity to deliver global 600,000 EV run rate by late 2023
  • Lithium iron phosphate battery packs coming for Mustang Mach-Es sold in North America next year and F-150 Lightnings in early 2024, creating more capacity for high-demand products
  • Ford already has sourced 70% of battery capacity to support 2 million+ annual EV global run rate by 2026; plans to localize 40 GWh per year of lithium iron phosphate capacity in N.A. in 2026; new deal with CATL on strategic cooperation for global battery supply; and direct-sourcing battery raw materials in U.S., Australia, Indonesia – and more
  • Company expects compound annual growth rate for EVs to top 90% through 2026; more than double forecasted global industry EV growth

DEARBORN, Mich.--(BUSINESS WIRE)--Building on strong demand for its new EVs, Ford today announced a series of initiatives for sourcing battery capacity and raw materials that light a clear path to reach its targeted annual run rate of 600,000 electric vehicles by late 2023 and more than 2 million by the end of 2026.


The company detailed its global vehicle portfolio plans supporting these production goals as part of its Ford+ plan. Ford expects a compound annual growth rate for EVs to exceed 90% through 2026, more than double forecasted global industry growth.

“Ford’s new electric vehicle lineup has generated huge enthusiasm and demand, and now we are putting the industrial system in place to scale quickly,” said Jim Farley, Ford’s president and CEO and president of Ford Model e. “Our Model e team has moved with speed, focus and creativity to secure the battery capacity and raw materials we need to deliver breakthrough EVs for millions of customers.”

Ford plans to invest over $50 billion in EVs through 2026, targeting total company adjusted EBIT margins of 10% and 8% EBIT margins for EVs by 2026.

As Ford creates a new EV supply chain that upholds its commitments to sustainability and human rights, the company continues to plan for more than half its global production to be EVs by 2030 and achieving carbon neutrality globally no later than 2050.

Driving to the 600,000 EV run rate by late 2023

Ford plans to reach a 600,000 global EV run rate by late 2023 with the following EVs:

  • 270,000 Mustang Mach-Es for North America, Europe and China
  • 150,000 F-150 Lightnings for North America
  • 150,000 Transit EVs for North America and Europe
  • 30,000 units of an all-new SUV for Europe, whose run rate will significantly ramp in 2024

Ford is adding lithium iron phosphate (LFP) cell chemistry to its portfolio, alongside its existing nickel cobalt manganese (NCM) chemistry. This creates even more capacity for high-demand products and provides customers many years of operation with minimal range loss. It also reduces the reliance on scarce critical minerals such as nickel and, at current costs, brings a 10 to 15% bill of material savings for Ford versus NCM batteries.

The company confirmed it has secured 100% of the annual battery cell capacity needed – 60 gigawatt hours (GWh) – to support this 600,000 EV run rate by working with leading battery companies around the globe.

Ford announced that Contemporary Amperex Technology Co., Ltd. (CATL) will provide full LFP battery packs for Mustang Mach-E models for North America starting next year as well as F-150 Lightings in early 2024. Ford’s EV architecture flexibility allows efficient incorporation of CATL’s prismatic LFP cell-to-pack technology, delivering incremental capacity quickly to scale and meet customer demand.

Ford also is leveraging its long-standing connection with LG Energy Solution (LGES) and its strategic relationship with SK On to meet its battery capacity target for late 2023.

Long-time supplier LGES has scaled quickly and doubled its capacity at its Wroclaw, Poland, facility to support incremental NCM cell production for Mustang Mach-E and E-Transit models.

Plus, SK On has installed capacity to support the scaling of Ford’s high-volume F-150 Lightning and E-Transits through late 2023 – scaling NCM cell production beyond earlier-planned levels from its Atlanta facility and providing new battery cell capacity from its Hungary operation.

Driving to more than 2 million EVs by late 2026

Ford is building on agreements tied to its 600,000 run rate milestone and is taking them even further. The company now has sourced approximately 70% of the battery cell capacity it needs to support an annual global run rate of more than 2 million EVs by late 2026.

Ford and CATL – the world’s largest battery producer – have signed a separate non-binding MOU to explore a cooperation for supplying batteries in Ford’s markets across China, Europe and North America.

Ford also announced it plans to localize and use 40 GWh of LFP capacity in North America starting in 2026.

The company intends to use this additional capacity to complement three previously announced battery plants in Kentucky and Tennessee that are part of the BlueOval SK joint venture between Ford and SK On, which was officially formed last week. Ford has signed an additional MOU with SK On as well as Koç Holdings to create a joint venture in Turkey for expanded battery capacity there.

To support its joint ventures, Ford is direct-sourcing battery cell raw materials as well.

“Our team has been actively engaged with partners in the United States and around the world,” said Lisa Drake, Ford Model e vice president, EV Industrialization. “We will move fast in the key markets and regions where critical supplies are available, meeting with government officials, mining companies and processors and signing MOUs and agreements that reflect Ford’s ESG expectations and underpin Ford’s plan to bring EVs to millions.”

Today, the company announced it is working with major mining collaborators and has sourced most of the nickel needed through 2026 and beyond. Ford has signed non-binding MOUs with:

  • Vale Canada Ltd.: To explore potential opportunities across the EV value chain.
  • PT Vale Indonesia and Huayou Cobalt: For exploring a three-way nickel processing project and, separately, an off-take agreement with Huayou that collectively will provide Ford with rights to the equivalent of 84 kilotons per annum (ktpa) of nickel.
  • BHP: For nickel supply from BHP's Nickel West operations in Australia. The targeted multi-year agreement could start as early as 2025 and may involve additional commodities over time.

Ford also has locked several key lithium contracts. Beyond the recently announced key asset in Western Australia secured through Liontown Resources, Ford also has signed a non-binding MOU with Rio Tinto, exploring a significant lithium off-take agreement from its Rincon project in Argentina. This is part of a multi-metal MOU that leverages the scale of Ford’s aluminum business and includes a potential opportunity on copper.

Ford also continues working to localize processing of key battery materials in North America. To that end, the company is announcing:

  • EcoPro BM and SK On: Have signed a non-binding Letter of Intent with Ford to establish a cathode production facility in North America.
  • ioneer: Has signed a binding off-take agreement with Ford for lithium carbonate from ioneer’s Rhyolite Ridge project in Nevada to support EV production beyond 2025.
  • Compass Minerals: Has signed a non-binding MOU for lithium hydroxide and lithium carbonate from its Utah operations on the Great Salt Lake.
  • Syrah Resources and SK On: Have signed a non-binding MOU to secure off-take for natural graphite from its processing site in Vidalia, Louisiana.

“It’s a very competitive landscape. These collaborators see value in the strong demand we have created with exceptional products like Mustang Mach-E and F-150 Lightning and the stability we can bring to these relationships,” Drake said. “We are excited to work with them – and others we haven’t yet announced – to build this new global supply chain for Ford.”

EV Demand

As Ford reinvents its new EV supply chain, consumer praise rolls in for its first-generation EVs already in-market while demand signals among potential EV buyers continue strengthening.

For the first time, the majority of consumers who intend to buy a car in the next two years say they will choose an EV or hybrid vehicle – up 11% from last year and 22% from 2020, according to research published by EY. Most of that increase is for full EVs.

Among commercial owners who don’t already deploy EVs, 60% of U.S. fleet managers said in a Ford Pro survey they plan to add EVs to their operations within two years.

Market reaction to F-150 Lightning and Mustang Mach-E is strong, bringing all-new customers to Ford. Mustang Mach-E shares the top spot in its segment for in-market vehicle shoppers’ favorable opinion, according to a Q1 Ford study, while F-150 Lightning’s favorable opinion was second only to the F-150 powered by an internal combustion engine.

To further stimulate demand, Ford is working to make EVs accessible to millions, addressing barriers to entry such as charging, cost and improving the EV customer purchase experience.

“This is our opportunity to win a whole new group of customers, building their loyalty and advocacy as we grow our market share," said Marin Gjaja, Ford Model e chief customer officer. "We're developing the digital and physical services and experiences those new customers expect when they purchase a product that to them is a new technology purchase. Our aim is to combine the convenience of digital shopping with Ford’s expertise, scale and the physical presence of our dealers to create the best possible experience for tomorrow’s EV owners.”

Ford News ConferenceThursday, July 21, at 8 a.m. EDT

Journalists and members of the investment community interested in asking questions should additionally dial in by phone.

Toll-Free: +1.844.282.4573

International: +1.412.317.5617

Participants should ask to join the “Ford Call”

Listen-only livestream and replay

The presentation and supporting material will be available at shareholder.ford.com

About Ford Motor Company

Ford Motor Company (NYSE: F) is a global company based in Dearborn, Michigan, that is committed to helping build a better world, where every person is free to move and pursue their dreams. The company’s Ford+ plan for growth and value creation combines existing strengths, new capabilities and always-on relationships with customers to enrich experiences for and deepen the loyalty of those customers. Ford develops and delivers innovative, must-have Ford trucks, sport utility vehicles, commercial vans and cars and Lincoln luxury vehicles, as well as connected services. Additionally, Ford is establishing leadership positions in mobility solutions, including self-driving technology, and provides financial services through Ford Motor Credit Company. Ford employs about 182,000 people worldwide. More information about the company, its products and Ford Credit is available at corporate.ford.com.

Cautionary Note on Forward-Looking Statements

Statements included or incorporated by reference herein may constitute “forward-looking statements” within the meaning of the Private Securities Litigation Reform Act of 1995. Forward -looking statements are based on expectations, forecasts, and assumptions by our management and involve a number of risks, uncertainties, and other factors that could cause actual results to differ materially from those stated, including, without limitation:

  • Ford and Ford Credit’s financial condition and results of operations have been and may continue to be adversely affected by public health issues, including epidemics or pandemics such as COVID-19;
  • Ford is highly dependent on its suppliers to deliver components in accordance with Ford’s production schedule, and a shortage of key components, such as semiconductors, or raw materials can disrupt Ford’s production of vehicles;
  • Ford’s long-term competitiveness depends on the successful execution of Ford+;
  • Ford’s vehicles could be affected by defects that result in delays in new model launches, recall campaigns, or increased warranty costs;
  • Ford may not realize the anticipated benefits of existing or pending strategic alliances, joint ventures, acquisitions, divestitures, or new business strategies;
  • Operational systems, security systems, vehicles, and services could be affected by cyber incidents, ransomware attacks, and other disruptions;
  • Ford’s production, as well as Ford’s suppliers’ production, could be disrupted by labor issues, natural or man-made disasters, financial distress, production difficulties, capacity limitations, or other factors;
  • Ford’s ability to maintain a competitive cost structure could be affected by labor or other constraints;
  • Ford’s ability to attract and retain talented, diverse, and highly skilled employees is critical to its success and competitiveness;
  • Ford’s new and existing products, digital and physical services, and mobility services are subject to market acceptance and face significant competition from existing and new entrants in the automotive, mobility, and digital services industries;
  • Ford’s near-term results are dependent on sales of larger, more profitable vehicles, particularly in the United States;
  • With a global footprint, Ford’s results could be adversely affected by economic, geopolitical, protectionist trade policies, or other events, including tariffs;
  • Industry sales volume in any of Ford’s key markets can be volatile and could decline if there is a financial crisis, recession, or significant geopolitical event;
  • Ford may face increased price competition or a reduction in demand for its products resulting from industry excess capacity, currency fluctuations, competitive actions, or other factors;
  • Inflationary pressure and fluctuations in commodity prices, foreign currency exchange rates, interest rates, and market value of Ford or Ford Credit’s investments, including marketable securities, can have a significant effect on results;
  • Ford and Ford Credit’s access to debt, securitization, or derivative markets around the world at competitive rates or in sufficient amounts could be affected by credit rating downgrades, market volatility, market disruption, regulatory requirements, or other factors;
  • Ford’s receipt of government incentives could be subject to reduction, termination, or clawback;
  • Ford Credit could experience higher-than-expected credit losses, lower-than-anticipated residual values, or higher-than-expected return volumes for leased vehicles;
  • Economic and demographic experience for pension and other postretirement benefit plans (e.g., discount rates or investment returns) could be worse than Ford has assumed;
  • Pension and other postretirement liabilities could adversely affect Ford’s liquidity and financial condition;
  • Ford and Ford Credit could experience unusual or significant litigation, governmental investigations, or adverse publicity arising out of alleged defects in products, services, perceived environmental impacts, or otherwise;
  • Ford may need to substantially modify its product plans to comply with safety, emissions, fuel economy, autonomous vehicle, and other regulations;
  • Ford and Ford Credit could be affected by the continued development of more stringent privacy, data use, and data protection laws and regulations as well as consumers’ heightened expectations to safeguard their personal information; and
  • Ford Credit could be subject to new or increased credit regulations, consumer protection regulations, or other regulations.

We cannot be certain that any expectation, forecast, or assumption made in preparing forward-looking statements will prove accurate, or that any projection will be realized. It is to be expected that there may be differences between projected and actual results. Our forward-looking statements speak only as of the date of their initial issuance, and we do not undertake any obligation to update or revise publicly any forward-looking statement, whether as a result of new information, future events, or otherwise. For additional discussion, see “Item 1A. Risk Factors” in our Annual Report on Form 10-K for the year ended December 31, 2021, as updated by our subsequent Quarterly Reports on Form 10-Q and Current Reports on Form 8-K.


Contacts

Media:
Jennifer Flake
313.903.0429
This email address is being protected from spambots. You need JavaScript enabled to view it.

Media:
Marty Gunsberg
313.316.5319
This email address is being protected from spambots. You need JavaScript enabled to view it.

Equity Investment Community:
Lynn Antipas Tyson
1.914.485.1150
This email address is being protected from spambots. You need JavaScript enabled to view it.

Fixed Income Investment Community:
Karen Rocoff
1.313.621.0965
This email address is being protected from spambots. You need JavaScript enabled to view it.

AUSTIN, Texas--(BUSINESS WIRE)--$ITI #IoT--Iteris, Inc. (NASDAQ: ITI), the world’s trusted technology ecosystem for smart mobility infrastructure management, today announced that it will conduct a conference call on Thursday, August 4 at 4:30 p.m. Eastern time (1:30 p.m. Pacific time) to discuss its financial results for the fiscal first quarter ended June 30, 2022. The financial results will be issued in a press release prior to the call.


Iteris president and CEO Joe Bergera and CFO Douglas Groves will host the call, followed by a question and answer period.

Date: Thursday, August 4, 2022
Time: 4:30 p.m. Eastern time (1:30 p.m. Pacific time)
Toll-free dial-in number: +1 877-545-0320
International dial-in number: +1 973-528-0002
Participant Access Code: 512955

If joining by phone, please call the conference telephone number 5-10 minutes prior to the start time and ask to join the Iteris earnings call. An operator will register your name and organization. If you have any difficulty connecting with the conference call, please contact MKR Investor Relations at 1-213-277-5550.

To listen to the live webcast or view the press release, please visit the investor relations section of the Iteris website at www.iteris.com.

During the question and answer period, management will take questions live from covering sell-side analysts, as well as answer select questions submitted to the company in advance of the call. If you would like to submit a question in advance, please do so before 5 p.m. Eastern time (2 p.m. Pacific time) on August 3, 2022 by emailing Iteris investor relations at This email address is being protected from spambots. You need JavaScript enabled to view it..

A telephone replay of the conference call will be available approximately two hours following the end of the call and will remain available for one week. To access the replay dial +1-877-481-4010 (US and Canada Toll Free), +1 919-882-2331 (International) and enter replay passcode 46154.

About Iteris, Inc.

Iteris is the world’s trusted technology ecosystem for smart mobility infrastructure management. Delivered through Iteris’ ClearMobility Platform, our cloud-enabled end-to-end solutions monitor, visualize and optimize mobility infrastructure around the world, and help bridge legacy technology silos to unlock the future of transportation. That’s why more than 10,000 public agencies and private-sector enterprises focused on mobility rely on Iteris every day. Visit www.iteris.com for more information, and join the conversation on Twitter, LinkedIn and Facebook.


Contacts

Iteris Contact
Douglas Groves
Senior Vice President and Chief Financial Officer
Tel: (949) 270-9643
Email: This email address is being protected from spambots. You need JavaScript enabled to view it.

Investor Relations
MKR Investor Relations, Inc.
Todd Kehrli
Tel: (213) 277-5550
Email: This email address is being protected from spambots. You need JavaScript enabled to view it.

CLEARWATER, Fla.--(BUSINESS WIRE)--MarineMax, Inc. (NYSE: HZO), the world’s largest recreational boat and yacht retailer, today announced that the Company will hold a webcast to review its third quarter fiscal 2022 results on Thursday, July 28, 2022, at 10:00 a.m. Eastern Time.

To access the webcast, please visit the investor relations section of the Company's website: http://www.marinemax.com. The online replay will be available for a limited time beginning within one hour of the conclusion of the call.

The Company will release its third quarter fiscal 2022 financial results prior to the market open on Thursday, July 28, 2022.

During the call, it is possible that the Company may make public disclosure of material nonpublic information and may make forward-looking statements regarding the Company's business, operations, and financial condition.

About MarineMax

MarineMax is the world’s largest recreational boat and yacht retailer, selling new and used recreational boats, yachts and related marine products and services, as well as providing yacht brokerage and charter services. MarineMax has over 100 locations worldwide, including 79 retail dealership locations, which includes 33 marinas or storage operations. Through Fraser Yachts and Northrop and Johnson, the Company also is the largest superyacht services provider, operating locations across the globe. Cruisers Yachts, a MarineMax company, manufactures boats and yachts with sales through our select retail dealership locations and through independent dealers. Intrepid Powerboats, a MarineMax company, manufactures powerboats and sells through a direct-to-consumer model. MarineMax provides finance and insurance services through wholly owned subsidiaries and operates MarineMax Vacations in Tortola, British Virgin Islands. The Company also operates Boatyard, a pioneering digital platform that enhances the boating experience. MarineMax is a New York Stock Exchange-listed company (NYSE: HZO). For more information, please visit www.marinemax.com.


Contacts

Michael H. McLamb
Chief Financial Officer
727-531-1700

Media:
Abbey Heimensen
MarineMax, Inc.

Investors:
Dawn Francfort or Brad Cohen
ICR, LLC
This email address is being protected from spambots. You need JavaScript enabled to view it.
NEW YORK--(BUSINESS WIRE)--White Oak Global Advisors LLC (“White Oak”) announced today it acted as the lead arranger for a $130 million senior secured term loan to Trecora Resources ("Trecora"), a Texas-based provider of petrochemicals, petrochemical manufacturing products and specialty waxes. Proceeds from the loan were used to consummate a take-private transaction by Balmoral Funds (”Balmoral”). Balmoral is a $1.5 billion AUM private equity firm managing committed funds, based in Los Angeles, CA.


“Trecora has built a strong business through delivering high-quality products and reliable service to its valued customers for more than 50 years,” said Albert Brandano, Director at White Oak. “We are proud to support the next chapter of Trecora’s growth as a private company in partnership with Balmoral.”

“We are enthusiastic about the opportunity to support Trecora’s next phase of growth. Over the years, Trecora’s success has been enabled by growing with its customers and we look forward to continuing that in the future,” said Richard Levernier, Vice President at Balmoral. “This represents Balmoral’s second acquisition with White Oak this year and we are excited about continuing to collaborate on forthcoming investments.”

About White Oak Global Advisors

White Oak Global Advisors, LLC (“WOGA”) is a leading alternative debt manager specializing in originating and providing financing solutions to facilitate the growth, refinancing and recapitalization of small and medium enterprises. Together with its financing affiliates, WOGA provides over twenty lending products to the market, including term, asset-based, and equipment loans, to all sectors of the economy. Since its inception in 2007, WOGA and its affiliates have deployed over $10 billion across its product lines, utilizing a disciplined investment process that focuses on delivering risk-adjusted investment returns to investors while establishing long-term partnerships with our borrowers. More information can be found at www.whiteoaksf.com.

About Balmoral Funds, LLC

Balmoral is a Los Angeles, CA-based private equity fund that was founded in 2005. Balmoral’s objective is to be the financial partner of choice for entrepreneurial and successful C-suite executives and operating advisors creating transformative, revitalizing change in the businesses they co-invest in together. Balmoral has approximately $1.5 billion of assets under management. Balmoral typically invests in companies that have revenues between $30 to $500 million and require equity investments of $10 to $100 million, with the capability of investing an additional $100 million or more in particularly compelling opportunities.

About Trecora Resources

Trecora owns and operates a specialty petrochemicals facility specializing in high purity hydrocarbons and other petrochemical manufacturing and a specialty wax facility, both located in Texas, and provides custom processing services at both facilities.


Contacts

Spencer Tait
Prosek Partners (on behalf of White Oak Global Advisors)
This email address is being protected from spambots. You need JavaScript enabled to view it.

Offshore Source Logo

Offshore Source keeps you updated with relevant information concerning the Offshore Energy Sector.

Any views or opinions represented on this website belong solely to the author and do not represent those of the people, institutions or organizations that Offshore Source or collaborators may or may not have been associated with in a professional or personal capacity, unless explicitly stated.

Corporate Offices

Technology Systems Corporation
8502 SW Kansas Ave
Stuart, FL 34997

info@tscpublishing.com