Business Wire News

DUBLIN--(BUSINESS WIRE)--The "Offshore Wind Turbine Market, By Installation Type (Fixed, Floating), By Turbine Capacity (Up to 3 MW, 3 MW to 5 MW, > 5 MW), By Region, Opportunity and Forecast, 2017-2027" report has been added to ResearchAndMarkets.com's offering.


The Global Offshore Wind Turbine Market value was $28.20 Billion in 2021, which is anticipated to grow with a CAGR of 13.75% during the forecast period, to achieve a market value of $62.79 Billion by 2027.

Companies Mentioned

  • Orsted A/S
  • GE Renewable Energy
  • ABB Ltd.
  • Vestas Wind Systems A/S
  • Siemens Gamesa
  • Schneider Electric SE
  • Nordex SE
  • Equinor ASA
  • Envision Group
  • Mingyang Smart Energy Group Co., Ltd
  • Xinjiang Goldwind Science & Technology Co., Ltd.
  • Rockwell Automation Inc.
  • Invenergy LLC
  • EDP Renewables North America LLC

The market growth can be attributed to growing demands for power generation through renewable sources. Higher energy and power consumption in various industries to generate electricity also drives the Global Offshore Wind Turbine Market in the next five years.

The availability of the advanced technology and turnkey solutions provided by various service providers also facilitates the growth of the Global Offshore Wind Turbine Market in the next five years. Increasing investments and advancements have intrigued the government to focus on offshore power generation, thereby fueling the Global Offshore Wind Turbine Market growth in the next five years.

Wind turbines convert wind kinetic energy into electricity. These are also implemented in the water bodies to generate electricity using wind and water as a resource. When the wind turbines are implanted in the water sources, they are called offshore wind turbines. Wind turbine blades turn between 13 and 20 revolutions per minute, depending on technology, at a constant or variable velocity, with the rotor's velocity varying about the wind's velocity to achieve greater efficiency.

The Global Offshore Wind Turbine Market is segmented by installation type, turbine capacity, regional distribution, and the competitive landscape. Based on installation type, the market is differentiated between fixed and floating. By turbine capacity, the market is bifurcated into up to 3 MW, 3 MW to 5 MW, and more than 5 MW. The market analysis also studies the regional segmentation divided among the Asia-Pacific, Europe, North American, Middle East & Africa, and South America.

By installation type, the fixed installation type of offshore wind turbine is anticipated to hold the largest revenue shares of the market and dominate the market segment in the upcoming five years on the ground advantage of the fixed installation for a longer duration of the power generation process. Surging demand for the power and energy to generate electricity to facilitate various end-use sectors further supports the growth of the Global Offshore Wind Turbine Market in the next five years.

Years considered for this report

  • Historical Years: 2017- 2020
  • Base Year: 2021
  • Estimated Year: 2022
  • Forecast Period: 2023 - 2027

Objective of the Study:

  • To analyze the market size of the Global Offshore Wind Turbine Market from 2017 to 2021.
  • To estimate and forecast the market size of the Global Offshore Wind Turbine Market from 2022 to 2027 and growth rate until 2027.
  • To classify and forecast the Global Offshore Wind Turbine Market based on installation type, turbine capacity, regional distribution, and competitional landscape.
  • To identify dominant region or segment in the Global Offshore Wind Turbine Market.
  • To identify drivers and challenges for the Global Offshore Wind Turbine Market.
  • To examine competitive developments such as expansions, new product launches, mergers & acquisitions, etc., in the Global Offshore Wind Turbine Market.
  • To identify and analyze the profile of leading players operating in the Global Offshore Wind Turbine Market.
  • To identify key sustainable strategies adopted by the market players in the Global Offshore Wind Turbine Market.

Report Scope:

In this report, the Global Offshore Wind Turbine Market has been segmented into following categories, in addition to the industry trends which have also been detailed below:

Offshore Wind Turbine Market, By Installation Type:

  • Installation Type
  • Turbine Capacity

Offshore Wind Turbine Market, By Turbine Capacity:

  • Up to 3 MW
  • 3 MW to 5 MW
  • > 5 MW

Offshore Wind Turbine Market, By Region:

  • Europe
  • United Kingdom
  • Germany
  • Denmark
  • Netherlands
  • Belgium
  • Sweden
  • Finland
  • Asia Pacific
  • China
  • Japan
  • Taiwan
  • South Korea
  • India
  • Vietnam
  • Australia
  • North America
  • United States
  • Canada
  • Mexico
  • South America
  • Argentina
  • Colombia
  • Brazil
  • Middle East & Africa
  • United Arab Emirates
  • Saudi Arabia
  • South Africa

For more information about this report visit https://www.researchandmarkets.com/r/e4zwx1


Contacts

ResearchAndMarkets.com
Laura Wood, Senior Press Manager
This email address is being protected from spambots. You need JavaScript enabled to view it.
For E.S.T Office Hours Call 1-917-300-0470
For U.S./CAN Toll Free Call 1-800-526-8630
For GMT Office Hours Call +353-1-416-8900

DUBLIN--(BUSINESS WIRE)--The "Cargo Inspection Market Intelligence Report - Global Forecast to 2027" report has been added to ResearchAndMarkets.com's offering.


The Global Cargo Inspection Market is projected to reach USD 5,754.14 million by 2027 from USD 4,230.07 million in 2021, at a CAGR 5.26% during the forecast period.

Market Statistics:

The report provides market sizing and forecast across 7 major currencies - USD, EUR, JPY, GBP, AUD, CAD, and CHF. It helps organization leaders make better decisions when currency exchange data is readily available. In this report, the years 2019 and 2020 are considered historical years, 2021 as the base year, 2022 as the estimated year, and years from 2023 to 2027 are considered the forecast period.

  • The Americas Cargo Inspection Market size was estimated at USD 1,130.04 million in 2021 and expected to reach USD 1,169.30 million in 2022, at a CAGR 4.72% to reach USD 1,490.89 million by 2027.
  • The Asia-Pacific Cargo Inspection Market size was estimated at USD 1,423.44 million in 2021 and expected to reach USD 1,517.40 million in 2022, at a CAGR 5.75% to reach USD 1,991.38 million by 2027.
  • The Europe, Middle East & Africa Cargo Inspection Market size was estimated at USD 1,676.57 million in 2021 and expected to reach USD 1,758.34 million in 2022, at a CAGR 5.19% to reach USD 2,271.87 million by 2027.

This research report categorizes the cargo inspection to forecast the revenues and analyze the trends in each of the following sub-markets:

Product:

  • Hardware
    • High-energy Inspection System
    • Low-energy Inspection System
    • Medium-energy Inspection System
  • Services

Type:

  • Cargo Labeling & Documentation Check
  • Cargo Loading Procedures Check
  • Order Accuracy Verification
  • Packaging Quality
  • Product Defects Check
  • Product Safety Check
  • Shipping Crate Quality Check
  • Transit-packaging Materials Check

Industry:

  • Agriculture
  • Automotive
  • Chemical
  • Machine Manufacturing
  • Medical Devices
  • Metals and Mining
  • Oil, Gas, & Petrochemicals

Region:

  • Americas
    • Argentina
    • Brazil
    • Canada
    • Mexico
    • United States
  • Asia-Pacific
    • Australia
    • China
    • India
    • Indonesia
    • Japan
    • Malaysia
    • Philippines
    • Singapore
    • South Korea
    • Taiwan
    • Thailand
  • Europe, Middle East & Africa
    • France
    • Germany
    • Italy
    • Netherlands
    • Qatar
    • Russia
    • Saudi Arabia
    • South Africa
    • Spain
    • United Arab Emirates
    • United Kingdom

Company Usability Profiles:

  • Aim Control Group
  • Alex Stewart International
  • Alfred H Knight Group
  • ALS Limited
  • Brookes Bell LLP
  • Bureau Veritas S.A.
  • Camin Cargo Control
  • Certispec Services Inc.
  • Cotecna SA
  • CWH Johnsons International
  • CWM Survey & Inspection B.V.
  • Hitachi, Ltd.
  • Intertek Group PLC
  • Marine Inspection LLC
  • Peterson and Control Union
  • Qtech Control Limited
  • SGS Group
  • Smiths Detection Group Ltd.
  • TUV SUD
  • Wakefield Inspection Services

For more information about this report visit https://www.researchandmarkets.com/r/xfiblt


Contacts

ResearchAndMarkets.com
Laura Wood, Senior Press Manager
This email address is being protected from spambots. You need JavaScript enabled to view it.

For E.S.T Office Hours Call 1-917-300-0470
For U.S./CAN Toll Free Call 1-800-526-8630
For GMT Office Hours Call +353-1-416-8900

  • Revenue of $6.8 billion increased 14% sequentially and 20% year on year
  • GAAP EPS of $0.67 increased 86% sequentially and 123% year on year
  • EPS, excluding charges and credits, of $0.50 increased 47% sequentially and 67% year on year
  • Cash flow from operations was $408 million
  • Board approved quarterly cash dividend of $0.175 per share
  • Full-year revenue outlook revised upward to at least $27 billion

PARIS--(BUSINESS WIRE)--Schlumberger Limited (NYSE: SLB) today announced results for the second-quarter 2022.


Second-Quarter Results (Stated in millions, except per share amounts)
Three Months Ended Change
Jun. 30, 2022 Mar. 31, 2022 Jun. 30, 2021 Sequential Year-on-year
Revenue

$6,773

$5,962

$5,634

14%


20%

Income before taxes - GAAP basis

$1,152

$638

$542

81%


113%

Net income - GAAP basis

$959

$510

$431

88%


123%

Diluted EPS - GAAP basis

$0.67

$0.36

$0.30

86%


123%


Adjusted EBITDA*

$1,530

$1,254

$1,198

22%


28%

Adjusted EBITDA margin*

22.6%

21.0%

21.3%

157 bps


132 bps

Pretax segment operating income*

$1,159

$894

$807

30%


44%

Pretax segment operating margin*

17.1%

15.0%

14.3%

212 bps


279 bps

Net income, excluding charges & credits*

$715

$488

$431

47%


66%

Diluted EPS, excluding charges & credits*

$0.50

$0.34

$0.30

47%


67%


Revenue by Geography


International

$5,188

$4,632

$4,511

12%


15%

North America

1,537

1,282

1,083

20%


42%

Other

48

48

40

n/m


n/m

$6,773

$5,962

$5,634

14%


20%

*These are non-GAAP financial measures. See sections titled "Charges & Credits", "Divisions", and "Supplemental Information" for details.
n/m = not meaningful
(Stated in millions)
Three Months Ended Change
Jun. 30, 2022 Mar. 31, 2022 Jun. 30, 2021 Sequential Year-on-year
Revenue by Division
Digital & Integration

$955

$857

$817

11%


17%

Reservoir Performance

1,333

1,210

1,117

10%


19%

Well Construction

2,686

2,398

2,110

12%


27%

Production Systems

1,893

1,604

1,681

18%


13%

Other

(94)

(107)

(91)

n/m


n/m

$6,773

$5,962

$5,634

14%


20%


Pretax Operating Income by Division


Digital & Integration

$379

$292

$274

30%


39%

Reservoir Performance

195

160

156

22%


25%

Well Construction

470

388

272

21%


73%

Production Systems

171

114

171

50%


0%

Other

(56)

(60)

(66)

n/m


n/m

$1,159

$894

$807

30%


44%


Pretax Operating Margin by Division


Digital & Integration

39.7%

34.0%

33.5%

570 bps


621 bps

Reservoir Performance

14.6%

13.2%

13.9%

143 bps


69 bps

Well Construction

17.5%

16.2%

12.9%

134 bps


462 bps

Production Systems

9.0%

7.1%

10.2%

190 bps


-114 bps

Other

n/m

n/m

n/m

n/m


n/m

17.1%

15.0%

14.3%

212 bps

279 bps

 
n/m = not meaningful

Schlumberger CEO Olivier Le Peuch commented, “The second quarter marked a significant inflection point for Schlumberger with a strong acceleration of revenue and earnings growth. Sequentially, revenue grew 14%, by more than $800 million; EPS—excluding charges and credits—increased 47%; and pretax segment operating margin expanded 212 basis points (bps). Growth was broad-based, driven by an increase in activity internationally, in North America, and across all Divisions. The quarter was also characterized by a favorable mix of exploration and offshore activity and the increasing impact of improved pricing, resulting in the largest sequential quarterly growth since 2010.

“On a year-over-year basis, revenue grew 20%; EPS—excluding charges and credits—increased 67%; and pretax segment operating margin expanded 279 bps.

Raising Full-Year Outlook

“The strength of our second-quarter outperformance highlights a firmly established growth inflection and our ability to comprehensively participate in drilling and completion activity growth globally. The multiyear upcycle continues to gain momentum with upstream activity and service pricing steadily increasing both internationally and in North America, resulting in a strengthened outlook for Schlumberger.

“As a result of this performance and based on our updated outlook for the remainder of the year, 2022 year-on-year revenue growth is now expected to be in the high-teens which translates to full-year revenue of at least $27 billion. “We expect this higher revenue to result in earnings that exceed our previous expectations, given our ambition to exit the year with adjusted EBITDA margins 200 basis points higher than in the fourth quarter of 2021,” Le Peuch said.

Second-Quarter Growth Broad-Based Across All Geographies

Second-quarter sequential revenue growth was broad-based, with international revenue increasing 12% and North America revenue growing 20%. International growth was widespread across all areas with more than 90% of our GeoUnits experiencing revenue growth. Growth was led by Europe/CIS/Africa which experienced 20% sequential growth due to higher Production Systems sales in Europe and Scandinavia, the seasonal drilling activity rebound in the Northern Hemisphere, and offshore activity increases in Sub-Sahara Africa benefitting all Divisions. Latin America sequential revenue growth of 10% was due to higher stimulation activity in Argentina, increased Production Systems sales in Brazil and Mexico, and higher offshore drilling in Guyana. Middle East & Asia revenue increased 7% sequentially due to higher drilling across Asia, particularly in China, Australia, and Indonesia, as well as multidivisional activity increases across the Middle East mainly in Oman, United Arab Emirates, Saudi Arabia, Egypt, and Iraq. In North America, sequential revenue growth of 20% was driven by a significant increase in land and offshore drilling activity and higher exploration data licensing in the US Gulf of Mexico.

Power of the Core—Complemented by Digital

Le Peuch said, “These results demonstrate the power of Schlumberger’s Core, which is performing exceedingly well and benefitting from the effects of improved operating leverage, favorable offshore activity mix, greater technology adoption, and an improving global service pricing environment.”

Sequentially, all Divisions posted double-digit revenue growth—outpacing rig count growth both in North America and internationally. Production Systems led the sequential growth, posting an 18% revenue increase on higher product deliveries and backlog conversion during the quarter, mostly internationally. Well Construction revenue increased 12% sequentially due to higher land and offshore drilling activity both in North America and internationally, in addition to improved pricing. Reservoir Performance revenue grew 10% due to higher intervention, evaluation, and stimulation activity, both on land and offshore along with improved pricing. This solid performance in the Core was complemented by Digital & Integration, which experienced an 11% sequential revenue increase, driven by higher exploration data licensing sales.

Overall, second-quarter pretax segment operating income increased 30% sequentially, and pretax segment operating margin expanded 212 bps to 17.1%—the highest quarterly operating margin level since 2015. All four Divisions expanded their margins sequentially.

Second-quarter cash from operations was $408 million and reflected the build-up of working capital in line with the significant revenue growth. Working capital is expected to improve and, consequently, free cash flow generation will accelerate through the second half of the year, consistent with our historical trends.

A Strengthened Outlook Aligned to Schlumberger’s Strengths

Le Peuch said, “Looking ahead, the second half of the year continues to shape up very well as highlighted in our revised expectations for the full year, encompassing all phases of oil and gas development and all operating environments—from high-volume onshore to deepwater offshore—and firmly establishing digital, decarbonization, and improved pricing as defining characteristics of this upcycle.

“Despite near-term concerns over a global economic slowdown, the combination of energy security, favorable break-even prices, and the urgency to grow oil and gas production capacity is expected to continue to support strong upstream E&P spending growth. Consequently, we are witnessing a decoupling of upstream spending from near-term demand volatility, resulting in resilient global oil and gas activity growth in 2022 and beyond.

“Our second-quarter results were a great demonstration of our revenue, operating margins, and earnings growth potential. I am very pleased with our execution thus far in the year and extend my appreciation to our team for delivering an exceptional quarter.”

Other Events

On July 21, 2022, Schlumberger’s Board of Directors approved a quarterly cash dividend of $0.175 per share of outstanding common stock, payable on October 13, 2022, to stockholders of record on September 7, 2022.

Revenue by Geographical Area

(Stated in millions)
Three Months Ended Change
Jun. 30, 2022 Mar. 31, 2022 Jun. 30, 2021 Sequential Year-on-year
North America

$1,537

$1,282

$1,083

20%


42%

Latin America

1,329

1,204

1,057

10%


26%

Europe/CIS/Africa

1,691

1,404

1,453

20%


16%

Middle East & Asia

2,168

2,024

2,001

7%


8%

Eliminations & other

48

48

40

n/m


n/m

$6,773

$5,962

$5,634

14%


20%


International

$5,188

$4,632

$4,511

12%


15%

North America

$1,537

$1,282

$1,083

20%


42%

 
n/m = not meaningful

International

Revenue in Latin America of $1.3 billion increased 10% sequentially due to higher stimulation activity in Argentina, higher Production Systems sales in Brazil and Mexico, and higher offshore drilling in Guyana.

Year on year, revenue grew 26% due to higher drilling activity in Mexico, Ecuador, and Brazil as well as increased stimulation activity in Argentina.

Europe/CIS/Africa revenue of $1.7 billion increased 20% sequentially. This significant growth was driven by activity that strengthened beyond the impact of the seasonal drilling activity recovery in the Northern Hemisphere with higher Production Systems sales in Europe and Scandinavia and multidivisional activity increases in Sub-Sahara Africa.

Year on year, revenue grew 16%, primarily from higher Production Systems sales in Europe and higher exploration drilling in offshore Sub-Sahara Africa, partially offset by the revenue decline in Russia.

Revenue in the Middle East & Asia of $2.2 billion increased 7% sequentially due to higher drilling across Asia, particularly in China, Australia, and Indonesia as well as multidivisional activity increases across the Middle East mainly in Oman, United Arab Emirates, Saudi Arabia, Egypt, and Iraq.

Year on year, revenue increased 8% due to higher drilling, stimulation, and intervention activity on new projects in Iraq, Oman, Egypt, Qatar and across Southeast Asia and Australia.

North America

North America revenue of $1.5 billion increased 20% sequentially and represented the highest sequential quarterly growth rate since 2017. US land revenue growth outperformed the rig count increase sequentially, while offshore revenue growth was more than double the pace of US land—boosted by increased exploration data licensing in the US Gulf of Mexico and higher drilling activity. US land revenue increased due to higher drilling activity and increased sales of surface production systems, while Canada land revenue increased despite the spring breakup due to higher Asset Performance Solutions (APS) project revenue.

Compared to the same quarter last year, North America revenue grew 42%. All Divisions experienced significant growth primarily from higher drilling and intervention activity, increased sales of production systems, increased exploration data licensing, and strong contribution from the APS project in Canada.

Second-Quarter Results by Division

Digital & Integration

(Stated in millions)
Three Months Ended Change
Jun. 30, 2022 Mar. 31, 2022 Jun. 30, 2021 Sequential Year-on-year
Revenue
International

$627

$631

$625

-1%


0%

North America

327

225

191

45%


71%

Other

1

1

1

n/m


n/m

$955

$857

$817

11%


17%


Pretax operating income

$379

$292

$274

30%


39%

Pretax operating margin

39.7%

34.0%

33.5%

570 bps


621 bps

 
n/m = not meaningful

Digital & Integration revenue of $955 million increased 11% sequentially and 17% year on year primarily due to higher exploration data licensing sales, including $95 million in transfer fees.

Digital & Integration pretax operating margin of 40% expanded 570 bps sequentially and 621 bps year on year, due to higher exploration data licensing sales in the US Gulf of Mexico and increased profitability in APS projects, particularly in Canada.

Reservoir Performance

(Stated in millions)
Three Months Ended Change
Jun. 30, 2022 Mar. 31, 2022 Jun. 30, 2021 Sequential Year-on-year
Revenue
International

$1,222

$1,105

$1,038

11%


18%

North America

111

103

79

8%


41%

Other

-

2

-

n/m


n/m

$1,333

$1,210

$1,117

10%


19%


Pretax operating income

$195

$160

$156

22%


25%

Pretax operating margin

14.6%

13.2%

13.9%

143 bps


69 bps

 
n/m = not meaningful

Reservoir Performance revenue of $1.3 billion increased 10% sequentially due to higher activity on land and offshore beyond the impact of the seasonal rebound in the Northern Hemisphere, along with improved pricing. International growth was driven by the seasonal rebound of activity in Scandinavia and China; higher offshore activity in Sub-Sahara Africa; increased evaluation, intervention, and stimulation work in Latin America; and increased evaluation and intervention work in the Middle East & Asia. North America growth was due to higher intervention activity in the US Gulf of Mexico.

Year on year, revenue growth was broad across all regions and GeoUnits, except for Russia & Central Asia. Double-digit growth was posted in evaluation, intervention, and stimulation services both on land and offshore, with higher exploration-related activity during the quarter.

Reservoir Performance pretax operating margin of 15% expanded 143 bps sequentially. Profitability was boosted by the seasonal recovery in the Northern Hemisphere, higher offshore and exploration activity, favorable technology mix, and improved pricing.

Year on year, pretax operating margin expanded 69 bps with profitability improving both in evaluation and intervention and geographically in North America, Europe/CIS/Africa, and Latin America.

Well Construction

(Stated in millions)
Three Months Ended Change
Jun. 30, 2022 Mar. 31, 2022 Jun. 30, 2021 Sequential Year-on-year
Revenue
International

$2,083

$1,865

$1,708

12%


22%

North America

553

485

352

14%


57%

Other

50

48

50

n/m


n/m

$2,686

$2,398

$2,110

12%


27%


Pretax operating income

$470

$388

$272

21%


73%

Pretax operating margin

17.5%

16.2%

12.9%

134 bps


462 bps

 
n/m = not meaningful

Well Construction revenue of $2.7 billion increased 12% sequentially due to higher land and offshore drilling activity both in North America and internationally, beyond the impact of the seasonal rebound in the Northern Hemisphere, in addition to improved pricing. In North America, sequential revenue growth outpaced the rig count increase in US land and offshore, despite the effects of the Canadian spring breakup. In addition to the seasonal rebound, international growth was also driven by improved pricing and new projects, particularly in Guyana, Argentina, and Sub-Sahara Africa, as well as higher drilling activity across Southeast Asia, Australia, and in the Middle East, mainly in Saudi Arabia and Qatar.

Year on year, revenue growth of 27% across all areas was led by North America and Latin America, both of which grew 50% or more. Middle East & Asia grew 17% while Europe/CIS/Africa increased 12% year on year. Double-digit growth was recorded in drilling fluids, measurements, and integrated drilling—both on land and offshore.

Well Construction pretax operating margin of 18% expanded 134 bps sequentially due to improved profitability across most of its business lines, particularly in the Europe/CIS/Africa and Middle East & Asia areas. Margin expansion was due to the seasonal recovery in the Northern Hemisphere, higher offshore and exploration activity, favorable technology mix, and improved pricing.

Year on year, pretax operating margin expanded 462 bps with profitability improving across most regions, driven by higher activity and improved pricing.

Production Systems

(Stated in millions)
Three Months Ended Change
Jun. 30, 2022 Mar. 31, 2022 Jun. 30, 2021 Sequential Year-on-year
Revenue
International

$1,341

$1,127

$1,220

19%


10%

North America

550

473

458

16%


20%

Other

2

4

3

n/m


n/m

$1,893

$1,604

$1,681

18%


13%


Pretax operating income

$171

$114

$171

50%


0%

Pretax operating margin

9.0%

7.1%

10.2%

190 bps


-114 bps

 
n/m = not meaningful

Production Systems revenue of $1.9 billion increased 18% sequentially as supply chain and logistics constraints abated, facilitating increased product deliveries and backlog conversion, mostly internationally. The increase was driven by double-digit revenue growth across all business lines, led by Europe/CIS/Africa on higher deliveries of midstream and subsea production systems; by Latin America due to higher sales of subsea production systems; and by North America, mainly US Land, on increased sales of surface production systems.

Year on year, double-digit growth was driven by new projects and increased product deliveries mainly in Europe/CIS/Africa, North America, and Latin America.

Production Systems pretax operating margin of 9% expanded 190 bps sequentially due to improved profitability from higher sales of surface, well, and subsea production systems.

Year on year, pretax operating margin contracted 114 bps due to higher logistics costs and unfavorable revenue mix.

Quarterly Highlights

Schlumberger continues to secure a pipeline of new contract awards as customers announce new projects and with the expansion of existing developments globally. Schlumberger is increasingly being selected for its superior performance and execution and its innovative technology that enhances customer success. Examples of awards from the quarter include the following:

  • In Norway, Aker BP ASA has awarded a frame agreement to Cameron, a Schlumberger company, for surface wellheads and production trees for up to 64 wells on the North of Alvheim, King Lear, and Valhall New Central Platform projects in the Norwegian sector of the North Sea. The ten-year agreement contains optional extensions for the life of the field and covers engineering, qualification, and manufacture of digitalized wellhead equipment and production trees capable of up to 15,000-psi operation and condition-based monitoring, as well as a new 21-in metal-to-metal Fontus* configurable production wellhead system. Installation is scheduled to begin in 2024.
  • In Brazil, Petrobras awarded Schlumberger a contract for integrated intelligent completions for wells in the presalt area. The advanced completion design selected for these wells includes premium interval flow control valves, an inductive coupling downhole wet disconnect tool and a wireless real-time running tool, GeoGuard* high-performance deepwater safety valves, and Metris* permanent monitoring systems. This intelligent completion technology package will enable Petrobras to more accurately monitor and control production—enhancing ultimate recovery. This contract, for which work is expected to commence in the first quarter of 2023, is a precursor to the development of an all-electric completion, currently underway in Brazil at the Schlumberger Taubaté Engineering Center.
  • OneSubsea®, the subsea technologies, production, and processing systems business of Schlumberger, has been awarded an engineering, procurement, construction, and installation (EPCI) contract by OKEA for the supply of three subsea high-boost pumps to increase production from the Draugen Field, located in the southern part of the Norwegian Sea. Under the contract, which is part of a frame agreement signed in 2017 by OKEA and Subsea Integration Alliance, OneSubsea will deliver a new high-boost pump module and modify two existing pump modules into high-boost pumps capable of handling higher differential pressure and throughput to maximize production from this asset. Delivery of the pump modules is scheduled for 2023.
  • Sarawak Shell Berhad has awarded Schlumberger a contract for integrated drilling services on seven exploration wells offshore Malaysia. The scope of the contract includes drilling and measurement, electrical wireline, drilling fluids, solids control, cementing, casing drilling, bits, and mud logging. Schlumberger will apply a variety of technologies, including the Allegro CD* directional casing-while-drilling service with the sonicVISION* sonic-while-drilling service to enhance performance of this operation, which commenced during the second quarter of 2022.
  • Equinor has made a direct award to Schlumberger for downhole completion and artificial lift equipment to extend the life of the Statfjord Field in the North Sea. Supporting Equinor's dual objective of increasing recovery from the field while significantly reducing the carbon intensity of incremental production, the award includes a Shuttle* rigless electric submersible pump (ESP) using a REDA* pump powered through a completion-integrated downhole wet-mate docking station. Because an ESP can more completely drain the reservoir using less electricity per barrel than compressor-driven gas lift, this solution will increase annual production and lower carbon intensity. Installation of the completions using the Shuttle rigless ESP technology is expected to commence in the first quarter of 2023.

  • Chariot, the African-focused transitional energy company, has signed a front-end engineering and design (FEED) contract with Schlumberger and Subsea 7, as part of a consortium, for the Anchois gas development project offshore Morocco. The scope of the agreement incorporates offshore components including well completions; subsea production systems; and subsea umbilicals, risers, and flowlines (SURF) that will be delivered by Subsea Integration Alliance. Onshore components include a central processing facility (CPF) and flowlines and controls from the CPF to the shore crossing that will be delivered by Schlumberger.
  • Talos Energy has awarded Schlumberger contracts for well construction services including drilling fluids, directional drilling, bits and reamers, and logging while drilling in the deepwater Gulf of Mexico. This adds to previous awards on ongoing Talos projects, including developmental drilling from the Pompano platform on the Continental Shelf. The new awards include technologies that will deliver demanding 3D directional drilling profiles and high-quality data with superior logging-while-drilling technology. Talos is scheduled to deploy a semisubmersible rig in August 2022 for this multiwell, deepwater campaign—the latest project in a collaboration between the two companies that has developed over years to deliver best-in-class wells.
  • The Abu Dhabi National Oil Company (ADNOC) has awarded Schlumberger a five-year wireline services contract. The contract, which includes an optional two-year extension, covers open- and cased-hole wireline logging, as well as perforating and coiled tubing logging services. Schlumberger technologies, including the Pulsar* multifunction spectroscopy service and Saturn* 3D radial probe, will be deployed to maximize the production of existing wells and appraise new fields for production expansion. Work is expected to commence in the third quarter of 2022.

Digital adoption across the industry continues to gather momentum, expanding how customers access their data, improve existing or create new workflows, and use data to guide decisions that boost performance in the field.


Contacts

Investor Relations Contacts:
Ndubuisi Maduemezia – Vice President of Investor Relations, Schlumberger Limited
Joy V. Domingo – Director of Investor Relations, Schlumberger Limited
Office +1 (713) 375-3535
This email address is being protected from spambots. You need JavaScript enabled to view it.

Media Contacts:
Josh Byerly, Vice President of Communications, Schlumberger Limited
Moira Duff, Director of External Communications, Schlumberger Limited
Office +1 (713) 375-3407
This email address is being protected from spambots. You need JavaScript enabled to view it.


Read full story here

DUBLIN--(BUSINESS WIRE)--The "US Ultrasonic Testing Equipment Market (2022-2027) by Type, Equipment, Service, Competitive Analysis and the Impact of Covid-19 with Ansoff Analysis" report has been added to ResearchAndMarkets.com's offering.


The US Ultrasonic Testing Equipment Market is estimated to be USD 274.21 Mn in 2022 and is projected to reach USD 424.62 Mn by 2027, growing at a CAGR of 9.14%.

Market dynamics are forces that impact the prices and behaviors of the US Ultrasonic Testing Equipment Market stakeholders. These forces create pricing signals which result from the changes in the supply and demand curves for a given product or service.

Forces of Market Dynamics may be related to macro-economic and micro-economic factors. There are dynamic market forces other than price, demand, and supply. Human emotions can also drive decisions, influence the market, and create price signals.

As the market dynamics impact the supply and demand curves, decision-makers aim to determine the best way to use various financial tools to stem various strategies for speeding the growth and reducing the risks.

Company Profiles

Some of the companies covered in this report are Acuren Inspection Inc, Amerapex Corp, Ametek Inc, Applied Technical Services Inc, etc.

The report provides a detailed analysis of the competitors in the market. It covers the financial performance analysis for the publicly listed companies in the market. The report also offers detailed information on the companies' recent development and competitive scenario.

Competitive Quadrant

The report includes Competitive Quadrant, a proprietary tool to analyze and evaluate the position of companies based on their Industry Position score and Market Performance score. The tool uses various factors for categorizing the players into four categories. Some of these factors considered for analysis are financial performance over the last 3 years, growth strategies, innovation score, new product launches, investments, growth in market share, etc.

Ansoff Analysis

The report presents a detailed Ansoff matrix analysis for the US Ultrasonic Testing Equipment Market. Ansoff Matrix, also known as Product/Market Expansion Grid, is a strategic tool used to design strategies for the growth of the company. The matrix can be used to evaluate approaches in four strategies viz. Market Development, Market Penetration, Product Development and Diversification. The matrix is also used for risk analysis to understand the risk involved with each approach.

The analyst analyses the US Ultrasonic Testing Equipment Market using the Ansoff Matrix to provide the best approaches a company can take to improve its market position.

Based on the SWOT analysis conducted on the industry and industry players, The analyst has devised suitable strategies for market growth.

Market Dynamics

Drivers

  • Development of Portable Phased Array Ultrasonic Testing Equipment
  • Need for Reliable Non-Destructive Testing Technique for Fiberglass and Carbon Fiber Composites in Manufacturing
  • Growth in Ultrasonic Testing Market Services
  • Government Mandates Regarding Employee Safety and Stringent Quality Control Requirements

Restraints

  • Limitations of Manual Ultrasonic Testing in Detecting Early Stages of Damage
  • High Cost of Automated Ultrasonic Testing Equipment

Opportunities

  • Growing Infrastructure Development in Emerging Economies
  • Opportunities in Power Generation Sector

Challenges

  • Decreasing Oil and Gas Prices
  • Lack of Skilled Technicians

Market Segmentations

The US Ultrasonic Testing Equipment Market is segmented based on Type, Equipment, Service, and Vertical.

  • By Type, the market is classified into Phased Array, Time-Of-Flight Diffraction, Immersion Testing, Guided Wave Testing, Acoustography, and Others.
  • By Equipment, the market is classified into Flaw Detectors, Thickness Gauges, Transducers And Probes, Industrial Scanners, Tube Inspection Systems, Bond Testers, Imaging Systems, and Others.
  • By Service, the market is classified into Inspection Services, Equipment Rental Services, Calibration Services, and Training Services.
  • By Vertical, the market is classified into Manufacturing, Oil & Gas, Aerospace, Infrastructure, Automotive, Power Generation, and Others.

Company Profiles

  • Acuren Inspection Inc
  • Amerapex Corp
  • Ametek Inc
  • Applied Technical Services Inc
  • Ashtead Technology
  • Baker Hughes Company
  • Cygnus Instruments Ltd
  • DEKRA SE
  • Eddyfi Technologies
  • FPrimeC Solutions Inc
  • Intertek Group plc
  • Labquip NDT Ltd
  • Mistras Group Inc
  • NDT Global GmbH & Co. KG
  • NDT Systems Inc
  • Olympus Corp
  • Sonatest Ltd
  • T. D. Williamson Inc
  • TecScan Systems Inc
  • Zetec Inc

For more information about this report visit https://www.researchandmarkets.com/r/5eoos0


Contacts

ResearchAndMarkets.com
Laura Wood, Senior Press Manager
This email address is being protected from spambots. You need JavaScript enabled to view it.

For E.S.T Office Hours Call 1-917-300-0470
For U.S./CAN Toll Free Call 1-800-526-8630
For GMT Office Hours Call +353-1-416-8900

MINNEAPOLIS--(BUSINESS WIRE)--Northern Oil and Gas, Inc. (NYSE: NOG) (“NOG” or the “Company”) announced today that it plans to issue its earnings release with respect to second quarter 2022 financial and operating results on Wednesday, August 3, 2022, after the market closes. Additionally, the Company will host a conference call on Thursday, August 4, 2022, at 11:00 a.m. Central Time.


Those wishing to listen to the conference call may do so via phone or the Company’s webcast.

Conference Call and Webcast Details:


Date:

August 4, 2022

Time:

11:00 a.m. Central Time

Dial-In:

(866) 373-3407

International Dial-In:

(412) 902-1037

Conference ID:

13731750

Webcast:

Second Quarter 2022 Earnings Call (themediaframe.com)


Replay Information:


A replay of the conference call will be available through August 11, 2022, by dialing:

Dial-In:

(877) 660-6853

International Dial-In:

(201) 612-7415

Conference ID:

13731750

ABOUT NORTHERN OIL AND GAS

NOG is a company with a primary strategy of investing in non-operated minority working and mineral interests in oil & gas properties, with a core area of focus in the premier basins within the United States.

More information about NOG can be found at www.NorthernOil.com.


Contacts

Investor Relations
(952) 476-9800
This email address is being protected from spambots. You need JavaScript enabled to view it.

DUBLIN--(BUSINESS WIRE)--The "Global Hydrogen Fuel Cell Vehicle Market (2022-2027) by Technology, Vehicle Type, Geography, Competitive Analysis and the Impact of Covid-19 with Ansoff Analysis" report has been added to ResearchAndMarkets.com's offering.


The Global Hydrogen Fuel Cell Vehicle Market is estimated to be USD 710.71 Mn in 2022 and is projected to reach USD 1506.29 Mn by 2027, growing at a CAGR of 16.21%.

Market dynamics are forces that impact the prices and behaviors of the Global Hydrogen Fuel Cell Vehicle Market stakeholders. These forces create pricing signals which result from the changes in the supply and demand curves for a given product or service.

Forces of Market Dynamics may be related to macro-economic and micro-economic factors. There are dynamic market forces other than price, demand, and supply. Human emotions can also drive decisions, influence the market, and create price signals.

As the market dynamics impact the supply and demand curves, decision-makers aim to determine the best way to use various financial tools to stem various strategies for speeding the growth and reducing the risks.

Company Profiles

Some of the companies covered in this report are Ballard Power Systems, Borgwarner, Ceres Power, Cummins, Doosan Group, Hyster-Yale, Hyundai Group, etc.

The report provides a detailed analysis of the competitors in the market. It covers the financial performance analysis for the publicly listed companies in the market. The report also offers detailed information on the companies' recent development and competitive scenario.

Competitive Quadrant

The report includes Competitive Quadrant, a proprietary tool to analyze and evaluate the position of companies based on their Industry Position score and Market Performance score.

The tool uses various factors for categorizing the players into four categories. Some of these factors considered for analysis are financial performance over the last 3 years, growth strategies, innovation score, new product launches, investments, growth in market share, etc.

Ansoff Analysis

The report presents a detailed Ansoff matrix analysis for the Global Hydrogen Fuel Cell Vehicle Market. Ansoff Matrix, also known as Product/Market Expansion Grid, is a strategic tool used to design strategies for the growth of the company.

The matrix can be used to evaluate approaches in four strategies viz. Market Development, Market Penetration, Product Development and Diversification. The matrix is also used for risk analysis to understand the risk involved with each approach.

The analyst analyses the Global Hydrogen Fuel Cell Vehicle Market using the Ansoff Matrix to provide the best approaches a company can take to improve its market position.

Based on the SWOT analysis conducted on the industry and industry players, The analyst has devised suitable strategies for market growth.

Market Dynamics

Drivers

  • Rise in Environmental Concern to Boost Market Growth
  • Technological Advancements in Hydrogen Fuel Cell

Restraints

  • High Initial Investment in Infrastructure

Opportunities

  • Increasing Government Initiative for Development of Hydrogen Fuel Cell
  • Rapid R&D to Propel the Adoption of Hydrogen Fuels

Challenges

  • Performance Constraints

Market Segmentations

  • By Technology, the market is classified into Proton Exchange Membrane Fuel Cell, Phosphoric Acid Fuel Cell, and Others.
  • By Vehicle Type, the market is classified into Passenger Vehicle and Commercial Vehicle.
  • By Geography, the market is classified into Americas, Europe, Middle-East & Africa and Asia-Pacific.

Company Profiles

  • Ballard Power Systems
  • Borgwarner
  • Ceres Power
  • Cummins
  • Doosan Group
  • Hyster-Yale
  • Hyundai Group
  • ITM Power
  • Nedstack
  • Plug Power
  • Powercell AB
  • Proton Motor Power Systems
  • Toshiba
  • Toyota Motor Corp

For more information about this report visit https://www.researchandmarkets.com/r/ddem8z


Contacts

ResearchAndMarkets.com
Laura Wood, Senior Press Manager
This email address is being protected from spambots. You need JavaScript enabled to view it.

For E.S.T Office Hours Call 1-917-300-0470
For U.S./CAN Toll Free Call 1-800-526-8630
For GMT Office Hours Call +353-1-416-8900

BOSTON--(BUSINESS WIRE)--Advent Technologies Holdings, Inc. (NASDAQ: ADN) (“Advent” or the “Company”), an innovation-driven leader in the fuel cell and hydrogen technology space, proudly announces that Dr. Panoraia ‘Nora’ Gourdoupi has agreed to join its board of directors.


Dr. Gourdoupi is Advent’s Senior Vice President of Corporate Business Developments and has been with Advent since its beginning, joining the Company in 2006 as a Senior Scientist. She is intimately involved in both developing the polymers which form the heart of the Company’s MEA and fuel cell products, as well as acting as a vital liaison to both government and industry partners. Dr. Gourdoupi holds a Bachelor of Sciences in Chemistry and a PhD from the University of Patras, specializing in the synthesis and characterization of polymers for fuel cell applications. She is co-inventor of eighteen patents in the field.

Without Nora’s innovation and dedication to our technology, we would not have a best in class MEA powering a portfolio of fuel cell products poised to revolutionize how energy is created,” said Dr. Vasilis Gregoriou, Advent’s Chief Executive Officer and Chairman. “Without her tireless advocacy and diligence in working with the European Commission over the past eighteen months, Advent would not have received the approval and ratification of Green HiPo, a colossal project which will transform the Company and ensure that Advent is positioned among the world leaders in green energy technology. I welcome her to the board.”

My entire professional career has been dedicated to developing efficient, cost-effective fuel cells to create clean energy,” said Dr. Gourdoupi. “From my start at the Company more than fifteen years ago as a Senior Scientist to now as I join its board of directors, I have always known that Advent’s best in class technology and world class team will power the green energy revolution. With the Green HiPo project approved and ratified, the widespread adoption of fuel cells as a truly viable fossil fuel alternative is closer than ever.”

Dr. Gourdoupi will assume the remainder of Dr. Christos Kaskavelis’ Class III term as director. Dr. Kaskavelis resigned from the Advent board on July 19, 2022. He will remain with the Company as its Chief Marketing Officer. Dr. Kaskavelis stated “With Nora shepherding the approval and ratification of Green HiPo, I am thrilled that she will now join our board of directors. I have known Nora for many years and cannot imagine any other potential board member who could combine her scientific acumen with her proven dedication to the Company. I look forward to focusing completely on my role as an executive at Advent, and I welcome the opportunity to assist Nora in any way possible as she joins the board.”

About Advent Technologies Holdings, Inc.

Advent Technologies Holdings, Inc. is a U.S. corporation that develops, manufactures, and assembles complete fuel cell systems as well as supplying customers with critical components for fuel cells in the renewable energy sector. Advent is headquartered in Boston, Massachusetts, with offices in California, Greece, Denmark, Germany, and the Philippines. With more than 150 patents issued, pending, and licensed for fuel cell technology, Advent holds the IP for next-generation HT-PEM that enables various fuels to function at high temperatures and under extreme conditions – offering a flexible “Any Fuel. Anywhere.” option for the automotive, aviation, defense, oil and gas, marine, and power generation sectors. For more information, visit www.advent.energy.

Cautionary Note Regarding Forward-Looking Statements

This press release includes forward-looking statements. These forward-looking statements generally can be identified by the use of words such as “anticipate,” “expect,” “plan,” “could,” “may,” “will,” “believe,” “estimate,” “forecast,” “goal,” “project,” and other words of similar meaning. Each forward-looking statement contained in this press release is subject to risks and uncertainties that could cause actual results to differ materially from those expressed or implied by such statement. Applicable risks and uncertainties include, among others, the Company’s ability to maintain the listing of the Company’s common stock on Nasdaq; future financial performance; public securities’ potential liquidity and trading; impact from the outcome of any known and unknown litigation; ability to forecast and maintain an adequate rate of revenue growth and appropriately plan its expenses; expectations regarding future expenditures; future mix of revenue and effect on gross margins; attraction and retention of qualified directors, officers, employees and key personnel; ability to compete effectively in a competitive industry; ability to protect and enhance Advent’s corporate reputation and brand; expectations concerning its relationships and actions with technology partners and other third parties; impact from future regulatory, judicial and legislative changes to the industry; ability to locate and acquire complementary technologies or services and integrate those into the Company’s business; future arrangements with, or investments in, other entities or associations; and intense competition and competitive pressure from other companies worldwide in the industries in which the Company will operate; and the risks identified under the heading “Risk Factors” in Advent’s Annual Report on Form 10-K filed with the Securities and Exchange Commission (“SEC”) on March 31, 2022, as well as the other information filed with the SEC. Investors are cautioned not to place considerable reliance on the forward-looking statements contained in this press release. You are encouraged to read Advent’s filings with the SEC, available at www.sec.gov, for a discussion of these and other risks and uncertainties. The forward-looking statements in this press release speak only as of the date of this document, and the Company undertakes no obligation to update or revise any of these statements. Advent’s business is subject to substantial risks and uncertainties, including those referenced above. Investors, potential investors, and others should give careful consideration to these risks and uncertainties.


Contacts

Elisabeth Maragoula/Michael Trontzos
Advent Technologies Holdings, Inc.
This email address is being protected from spambots. You need JavaScript enabled to view it.

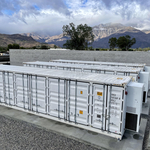
SAN FRANCISCO--(BUSINESS WIRE)--Generate Capital, a leading sustainable infrastructure investment and operating platform, today announced it has acquired large-scale battery storage developer esVolta LP to accelerate the availability of energy storage projects critical to decarbonizing the electric grid and improving resiliency.


The acquisition enables Generate to expand into the front-of-the-meter battery storage market by adding a fast-growing and experienced team with a pipeline of attractive projects.

One of the leading large-scale energy storage developers in the United States, esVolta was founded in California in 2017 and has a portfolio of more than 900 megawatt hours of operational and utility-contracted projects in the U.S. and Canada. The company also has a portfolio of projects under active development in Texas, Arizona, Montana, California, Virginia, Colorado, Washington and New Mexico.

“Our team at esVolta is excited to be joining forces with Generate to expand the battery storage market amid increasing demand from offtakers and utilities throughout the United States,” said Randolph Mann, president of esVolta. “Generate is the ideal choice to support our long-term growth – sharing our vision of a modernized and decarbonized grid and the comprehensive approach to building it out.”

The acquisition represents Generate’s entry into the front-of-meter storage market, expanding its focus on grid-connected storage, where the company has been building infrastructure since 2014.

“We have long believed that battery storage is critical to building a sustainable energy system and ensuring grid reliability as we scale up renewables and accelerate the energy transition. That is why we have been investing money and effort to grow this market since we started the company,” said Scott Jacobs, chief executive and co-founder of Generate. “Our partnership with esVolta today highlights the enormous potential for battery storage projects to rebuild our energy system. We’re excited to work with this innovative and expert team to expand our collective leadership in storage and resiliency markets nationwide.”

The acquisition was facilitated by Kirkland & Ellis LLP as legal adviser for Generate and Nomura Greentech as financial adviser. For esVolta, Citi served as financial adviser and Hogan Lovells US LLP as legal adviser.

About esVolta

esVolta, LP is a developer, owner, and operator of utility-scale energy storage projects across North America. The company’s portfolio of operational plus contracted projects totals over 900 megawatt hours of storage capacity, and the firm is developing a large pipeline of future storage projects. Additional information about esVolta is available at www.esVolta.com.

About Generate

Generate Capital, PBC is a leading sustainable infrastructure company driving the infrastructure revolution. Generate builds, owns, operates and finances solutions for clean energy, transportation, water, waste and digital infrastructure. Founded in 2014, Generate partners with over 50 technology and project developers and owns and operates more than 2,000 assets globally. Generate is the one-stop shop offering pioneers of the infrastructure revolution the money and help they need to get projects built. Our Infrastructure-as-a-Service model delivers affordable, reliable and sustainable resources to thousands of customers, companies, communities, school districts and universities. Together, we are rebuilding the world. For more information, please visit http://www.generatecapital.com.


Contacts

For Generate
Emily Chasan
(415) 480-2914
This email address is being protected from spambots. You need JavaScript enabled to view it.

  • Time for acceptance of the Offer has been extended to September 9, 2022
  • Due diligence for SEC Order Condition is ongoing
  • Amendments to Financing Agreement have been updated and clarified

TORONTO--(BUSINESS WIRE)--Viston United Swiss AG (“Viston”), together with its indirect, wholly-owned subsidiary, 2869889 Ontario Inc. (the “Offeror”) today announced that it is extending the time for acceptance of the Offeror’s all-cash offer (the “Offer”) to acquire all of the issued and outstanding common shares (“Common Shares”) of Petroteq Energy Inc. (“Petroteq”) (TSX-V: PQE; OTC: PQEFF; FSE: PQCF) to 5:00 p.m. (Toronto time) on September 9, 2022 (the “Expiry Time”). The Offeror will mail a notice of extension dated July 22, 2022 (the “Fifth Notice of Extension”) to the registered shareholders of Petroteq and will file the Fifth Notice of Extension on Petroteq’s SEDAR profile at www.sedar.com and with the U.S. Securities and Exchange Commission at www.sec.gov.

Fifth Notice of Extension

The Offeror will mail and file the Fifth Notice of Extension to the registered shareholders of Petroteq extending the time for acceptance of the Offer to 5:00 p.m. (Toronto time) on September 9, 2022, in order to allow additional time for the Offeror to obtain the CFIUS Clearance (as defined below) and to allow the Offeror time to assess the implications of the SEC Order (as defined below) and review information and documents from Petroteq relating thereto, in connection with the Offeror’s conditions to the Offer.

If any of the conditions to the Offer have not been satisfied by the Expiry Time (including in particular, if the CFIUS Clearance has not been obtained by the Expiry Time or if the SEC Order Conditions (as defined below) have not been satisfied by the Expiry Time), the Offeror may extend the Offer through one or more extensions until the date on which the conditions to the Offer have been satisfied or the Offeror may withdraw the Offer.

Except for the extension of the Offer as described above, all other terms and conditions of the Offer continue to remain in effect and unchanged.

CFIUS Clearance

On May 16, 2022, the Offeror and Petroteq formally submitted to the Committee on Foreign Investment in the United States (“CFIUS”) a voluntary notice (the “Notice”) in connection with the transactions contemplated by the Offer. The purpose of the Notice was to obtain a clearance by CFIUS in respect of the Offeror’s acquisition of Common Shares pursuant to the Offer and the subsequent second-step acquisition, if any, by the Offeror of any Common Shares not acquired by it in the Offer (the “Transactions”), as reflected in: (i) a written notice from CFIUS that the Transactions do not constitute a “covered transaction” under relevant government regulations, (ii) a written notice from CFIUS that it has completed its assessment, review, or investigation of the Transactions and has concluded all action under Section 721 of the U.S. Defense Production Act of 1950, as amended (the “DPA”), or (iii) an announcement by the President of the United States, made within the period required by the DPA, of a decision not to take any action to suspend or prohibit the Transactions (each of (i), (ii), or (iii) being a “CFIUS Clearance”).

On May 24, 2022, the United States Department of the Treasury notified the Offeror and Petroteq that the Notice had been accepted by CFIUS for review, that the 45-day notice review period had commenced on May 24, 2022 and that the review would conclude no later than July 7, 2022.

On July 7, 2022, the United States Department of the Treasury notified both the Offeror and Petroteq that CFIUS would be undertaking an investigation of the Transactions pursuant to Section 721(b)(2) of the DPA and that the investigation will be completed no later than August 22, 2022. On July 8, 2022, Viston and the Offeror issued a news release regarding such notification and advising that Viston and the Offeror at that time intended to extend the Offer to a date after August 22, 2022 in order to allow additional time for the satisfaction of all of the conditions to the Offer.

Due Diligence for SEC Order Condition Ongoing

On June 13, 2022, the United States Securities and Exchange Commission (the “SEC”) issued an Order Instituting Cease-and-Desist Proceedings Pursuant to Section 8A of the Securities Act of 1933 and Section 21C of the Securities Exchange Act of 1934, Making Findings and Imposing a Cease-and-Desist Order and Notice of Hearing (the “SEC Order”) against Petroteq and Aleksandr Blyumkin, as respondents. Given the seriousness of the SEC Order and the limited time to assess the implications of it before the June 17, 2022 expiry date, in connection with the extension of that expiry date the Offeror determined to vary the Offer to add new conditions in subsections (o) and (p) of Section 4 of the Offer (the “SEC Order Conditions”). In its June 22, 2022 news release, Petroteq expressed its willingness to provide Viston with (non-privileged) information to assist Viston in its due diligence with respect to the SEC Order. This was confirmed by representatives of Petroteq during a video conference call with representatives of the Offeror later that day. Counsel to Viston and the Offeror circulated an initial due diligence request list to Petroteq’s counsel on June 24, 2022 and additional questions on June 27, 2022. On July 15, 2022, Petroteq’s counsel confirmed that it was working on providing information and documents responsive to Viston and the Offeror’s due diligence questions and, on July 18, 2022, Petroteq’s counsel provided counsel to Viston and the Offeror with initial access to certain documents and files in connection therewith. Viston and the Offeror and its counsel are in the process of reviewing those initial documents and files in connection with the SEC Order Conditions and are expecting further information to be provided by Petroteq. The Offeror may have additional due diligence questions arising from its review of the documents, files and information provided by (or to be provided by) Petroteq, which may require the furnishing of additional documents, files and information for further review by the Offeror and its counsel prior to a determination being made by the Offeror as to the satisfaction of (or failure to satisfy) the SEC Order Conditions.

Update and Clarification on Amendments to Financing Agreement

On June 16, 2022, Viston, as borrower, Mr. Zbigniew Roch (the “Guarantor”), as guarantor and Uniexpress Investment Holding PLC (the “Lender”), as lender, entered into a first amending agreement (the “First Amending Agreement”) to the binding long-term debt financing agreement dated October 22, 2021 (the “Financing Agreement”) to increase the amount available to Viston under the term loan under the Financing Agreement from EUR 420 million to EUR 450 million. A copy of the First Amending Agreement was filed as an Exhibit to the Schedule TO filed with the SEC on June 17, 2022.

Due to changes to the exchange rate between the Euro and Canadian dollars since the date of the Fourth Notice of Variation and Extension (on July 21, 2022, the daily average exchange rate published by the Bank of Canada for Euros was EUR1.00 = $1.3151 as compared to EUR1.00 = $1.3594 on June 16, 2022), the Borrower and the Lender have amended and restated the first amending agreement dated June 16, 2022 (the “Amended and Restated First Amending Agreement”) to increase the amount available to the Borrower under the term loan from EUR450 million to EUR465 million. A copy of the Amended and Restated First Amending Agreement, including an updated and correct debt payment schedule attached as Appendix II, will be filed as an Exhibit to the Schedule TO filed with the SEC and will be available at www.sec.gov.

On June 29, 2022, Viston, the Guarantor and the Lender entered into a second amending agreement (the “Second Amending Agreement”) to the Financing Agreement. Pursuant to the terms of the Second Amending Agreement, the Lender and Viston had agreed to amend the Financing Agreement to remove the obligation of the Guarantor to personally guarantee the obligations of Viston under the Financing Agreement, and in replacement thereof, the Guarantor and the Lender had agreed to put in place a surety insurance bond (the “Insurance Bond”) in form and substance acceptable to the Lender. A copy of the Second Amending Agreement was filed as an Exhibit to the Schedule TO filed with the SEC on July 6, 2022.

Based on inquiries, including from Petroteq’s counsel on July 19, 2022, it has come to the attention of Viston that the effective date of the Second Amending Agreement and the Insurance Bond require clarification. The Second Amending Agreement expressly states that it becomes effective on the date on which the Lender has received and is satisfied that the Insurance Bond has become fully effective and binding, the Lender has received an executed copy of the insurance certificate in the form appended to the Second Amending Agreement and the Lender has received confirmation of the initial premium payment having been made. Viston expects this to occur when the proceeds to be advanced under the term loan under the Financing Agreement are first drawn down by Viston, with the initial premium for the Insurance Bond being paid at that time. Viston has been advised by the Lender that the Annex to the Second Amending Agreement was intended to express the intent of the Lender’s insurer in issuing the Insurance Bond, on the one hand, to the Lender, as insured, on the other hand. Viston has been advised that the Annex was provided by the Lender’s insurer to the Lender who, in agreeing to relieve the Guarantor of his personal guarantee of Viston’s obligations to repay the term loan under the Financing Agreement, will be the insured under the Insurance Bond. An executed copy of the insurance certificate has not been issued by the insurer and is not expected to be issued until Viston is ready to draw down under the term loan under the Financing Agreement, at which time the Guarantor will be relieved of his obligations to personally guarantee the obligations of Viston under the Financing Agreement. An amended and restated copy of the Second Amending Agreement clarifying these matters will be filed as an Exhibit to the Schedule TO filed with the SEC and will be available at www.sec.gov.

Common Shares Tendered to Offer

Kingsdale Advisors, the Depositary and Information Agent for the Offer, has advised the Offeror that, as of 5:00 p.m. (Toronto time) on July 21, 2022, approximately 577,983,746 Common Shares had been validly tendered to the Offer and had not been validly withdrawn. Based on Viston’s understanding of the share capitalization of Petroteq1, the tendered Common Shares represent approximately 74.32% of the currently issued and outstanding Common Shares, and approximately 73.59% of the Common Shares, measured on a fully diluted basis.2

Holders of Common Shares who have previously validly tendered and not withdrawn their shares do not need to re-tender their Common Shares or take any other action in response to the extension of the Offer.

Summary of Offer Details

Viston reminds Shareholders of the following key terms and conditions of the Offer:

  • Shareholders will receive C$0.74 in cash for each Common Share. The Offer represents a significant premium of approximately 279% based on the closing price of C$0.195 per Common Share on the TSX-V on August 6, 2021, being the last trading day prior to the issuance of a cease trade order by the Ontario Securities Commission at which time the TSX-V halted trading in the Common Shares. The Offer also represents a premium of approximately 1,032% to the volume weighted average trading price of C$0.065 per Common Share on the TSX-V for the 52-weeks preceding the German voluntary public purchase offer in April 2021.
  • The Offer is expressed in Canadian dollars but Shareholders may elect to receive their consideration in the U.S. dollar equivalent amount.
  • The Offer is open for acceptance until 5:00 p.m. (Toronto time) on September 9, 2022, unless the Offer is extended or withdrawn by the Offeror in accordance with its terms.
  • Registered Shareholders may tender by sending their completed Letter of Transmittal, share certificates or DRS statements and any other required documents to Kingsdale, as Depositary and Information Agent. Registered Shareholders are encouraged to contact Kingsdale promptly to receive guidance on the requirements and assistance with tendering.
  • Beneficial Shareholders should provide tender instructions and currency elections to their financial intermediary. Beneficial Shareholders may also contact Kingsdale for assistance.
  • The Offer is subject to specified conditions being satisfied or waived by the Offeror. These conditions include, without limitation: the Canadian statutory minimum tender condition of at least 50% +1 of the outstanding Common Shares being validly deposited under the Offer and not withdrawn (this condition cannot be waived); at least 50% +1 of the outstanding Common Shares on a fully diluted basis being validly deposited under the Offer and not withdrawn; the Offeror having determined, in its reasonable judgment, that no Material Adverse Effect exists; the SEC Order Conditions; and receipt of all necessary regulatory approvals. Assuming that the statutory minimum tender condition is met and all other conditions are met or waived, the Depositary will pay Shareholders promptly following the public announcement of take-up and pay.

For More Information and How to Tender Shares to the Offer

Shareholders who hold Common Shares through a broker or intermediary should promptly contact them directly and provide their instructions to tender to the Offer, including any U.S. dollar currency election. Taking no action and not accepting the Offer comes with significant risks of shareholder dilution and constrained share prices. The deadline for Shareholders to tender their shares is 5:00 p.m. (Toronto time) on September 9, 2022.

For assistance or to ask any questions, Shareholders should visit www.petroteqoffer.com or contact Kingsdale Advisors, the Information Agent and Depositary in connection with the Offer, within North America toll-free at 1-866-581-1024, outside North America at 1-416-867-2272 or by e-mail at This email address is being protected from spambots. You need JavaScript enabled to view it..

Advisors

The Offeror has engaged Gowling WLG (Canada) LLP to advise on certain Canadian legal matters and Dorsey & Whitney LLP to advise on certain U.S. legal matters. Kingsdale Advisors is acting as Information Agent and Depositary.

About the Offeror

The Offeror is an indirect, wholly-owned subsidiary of Viston, a Swiss company limited by shares (AG) established in 2008 under the laws of Switzerland. The Offeror was established on September 28, 2021 under the laws of the Province of Ontario. The Offeror’s registered office is located at 100 King Street West, Suite 1600, 1 First Canadian Place, Toronto, Ontario, Canada M5X 1G5. The registered and head office of Viston is located at Haggenstreet 9, 9014 St. Gallen, Switzerland.

Viston was created to invest in renewable energies and clean technologies, as well as in the environmental protection industry. Viston aims to foster innovative technologies, environmentally-friendly and clean fossil fuels and to help shape the future of energy. Since October 2008, Viston has undertaken its research, development and transfer initiatives in Saint Gallen, Switzerland. Viston has been working to optimize and adapt these technologies to current market requirements to create well-engineered products. Viston’s work also includes the determination of technical and economic risks, as well as the search for financing opportunities.

Caution Regarding Forward-Looking Statements

Certain statements contained in this news release contain “forward-looking information” and are prospective in nature. Forward-looking information is not based on historical facts, but rather on current expectations and projections about future events, and are therefore subject to risks and uncertainties that could cause actual results to differ materially from the future results expressed or implied by the forward-looking information. Often, but not always, forward-looking information can be identified by the use of forward-looking words such as “plans”, “expects”, “intends”, “anticipates”, or variations of such words and phrases or statements that certain actions, events or results “may”, “could”, “should”, “would”, “might” or “will” be taken, occur or be achieved. Forward-looking information contained in this news release includes, but is not limited to, statements relating to a further variation of and/or extension of the time for acceptance of the Offer; the expectations regarding the process for, and timing of, obtaining regulatory approvals; statements relating to the Insurance Bond; expectations relating to the Offer; estimations regarding the issued and outstanding Common Shares, including as measured on a fully-diluted basis; and the satisfaction or waiver of the conditions to consummate the Offer (including without limitation the SEC Order Conditions).

Although the Offeror and Viston believe that the expectations reflected in such forward-looking information are reasonable, such statements involve risks and uncertainties, and undue reliance should not be placed on such statements. Certain material factors or assumptions are applied in making forward-looking information, and actual results may differ materially from those expressed or implied in such statements. Important factors that could cause actual results, performance or achievements of the Offeror or the completion of the Offer to differ materially from any future results, performance or achievements expressed or implied by such forward-looking information include, among other things, the availability of the Insurance Bond, the ultimate outcome of any possible transaction between Viston and Petroteq, including the possibility that Petroteq will not accept a transaction with Viston or enter into discussions regarding a possible transaction, actions taken by Petroteq, actions taken by security holders of Petroteq in respect of the Offer, that the conditions of the Offer may not be satisfied or waived by Viston at the expiry of the Offer period, the ability of the Offeror to acquire 100% of the Common Shares through the Offer, the ability to obtain regulatory approvals and meet other closing conditions to any possible transaction, including any necessary shareholder approvals, potential adverse reactions or changes to business relationships resulting from the announcement, pendency or completion of the Offer transaction or any subsequent transaction, competitive responses to the announcement or completion of the Offer, unexpected costs, liabilities, charges or expenses resulting from the proposed transaction, exchange rate risk related to the financing arrangements, litigation relating to the proposed transaction, the inability to engage or retain key personnel, any changes in general economic and/or industry-specific conditions, industry risk, risks inherent in the running of the business of the Offeror or its affiliates, legislative or regulatory changes, Petroteq’s structure and its tax treatment, competition in the oil & gas industry, obtaining necessary approvals, financial leverage for additional funding requirements, capital requirements for growth, interest rates, dependence on skilled staff, labour disruptions, geographical concentration, credit risk, liquidity risk, changes in capital or securities markets and that there are no inaccuracies or material omissions in Petroteq’s publicly available information, and that Petroteq has not disclosed events which may have occurred or which may affect the significance or accuracy of such information. These are not necessarily all of the important factors that could cause actual results to differ materially from those expressed in any of the Offeror’s forward-looking information. Other unknown and unpredictable factors could also impact its results. Many of these risks and uncertainties relate to factors beyond the Offeror’s ability to control or estimate precisely. Consequently, there can be no assurance that the actual results or developments anticipated by the Offeror will be realized or, even if substantially realized, that they will have the expected consequences for, or effects on, the Offeror, its future results and performance.

Forward-looking information in this news release is based on the Offeror and Viston’s beliefs and opinions at the time the information is given, and there should be no expectation that this forward-looking information will be updated or supplemented as a result of new information, estimates or opinions, future events or results or otherwise, and each of the Offeror and Viston disavows and disclaims any obligation to do so except as required by applicable Law. Nothing contained herein shall be deemed to be a forecast, projection or estimate of the future financial performance of the Offeror or any of its affiliates or Petroteq.

Unless otherwise indicated, the information concerning Petroteq contained herein has been taken from or is based upon Petroteq’s and other publicly available documents and records on file with the Securities Regulatory Authorities and other public sources at the time of the Offer. Although the Offeror and Viston have no knowledge that would indicate that any statements contained herein relating to Petroteq, taken from or based on such documents and records are untrue or incomplete, neither the Offeror, Viston nor any of their respective officers or directors assumes any responsibility for the accuracy or completeness of such information, or for any failure by Petroteq to disclose events or facts that may have occurred or which may affect the significance or accuracy of any such information, but which are unknown to the Offeror and Viston.

Additional Information

This news release relates to a tender offer which Viston, through the Offeror, has made to Shareholders. The Offer is being made pursuant to a tender offer statement on Schedule TO (including the Offer to Purchase and Circular, the Notice of Variation and Extension dated February 1, 2022, the Second Notice of Extension dated February 24, 2022, the Third Notice of Extension dated April 14, 2022, the Fourth Notice of Variation and Extension dated June 17, 2022 and the Fifth Notice of Extension, the letter of transmittal and other related offer documents) initially filed by Viston on October 25, 2021, as subsequently amended. These materials, as may be amended from time to time, contain important information, including the terms and conditions of the Offer. Subject to future developments, Viston (and, if applicable, Petroteq) may file additional documents with the Securities and Exchange Commission (the “SEC”). This press release is not a substitute for any tender offer statement, recommendation statement or other document Viston and/or Petroteq may file with the SEC in connection with the proposed transaction.

This communication does not constitute an offer to buy or solicitation of an offer to sell any securities. Investors and security holders of Petroteq are urged to read the tender offer statement (including the Offer to Purchase and Circular, the Notice of Variation and Extension dated February 1, 2022, the Second Notice of Extension dated February 24, 2022, the Third Notice of Extension dated April 14, 2022, the Fourth Notice of Variation and Extension dated June 17, 2022 and the Fifth Notice of Extension, the letter of transmittal and other related offer documents) and any other documents filed with the SEC carefully in their entirety if and when they become available as they will contain important information about the proposed transaction.


Contacts

For More Information

Media inquiries:

Hyunjoo Kim
Vice President, Strategic Communications and Marketing
Kingsdale Advisors,
Direct: 416-867-2357
This email address is being protected from spambots. You need JavaScript enabled to view it.

For assistance in depositing Petroteq Common Shares to the Offer:

Kingsdale Advisors
130 King Street West, Suite 2950
Toronto, ON M5X 1E2
North American Toll Free: 1-866-581-1024
Outside North America: 1-416-867-2272
Email: This email address is being protected from spambots. You need JavaScript enabled to view it.
www.petroteqoffer.com


Read full story here

MELBOURNE, Fla.--(BUSINESS WIRE)--L3Harris Technologies (NYSE:LHX) today announced that Christina L. Zamarro, Vice President, Finance and Treasurer at The Goodyear Tire & Rubber Company, has been elected to its Board of Directors. Her addition expands the L3Harris Board to 14 members.


“Christina is a strong finance leader with experience in strategy, business operations, mergers and acquisitions, capital markets and international transactions,” said Christopher E. Kubasik, Chair and CEO. “Her professional background and skillsets will be tremendous assets as we continue to expand our global market presence and reposition our company as a Trusted Disruptor within the defense industry.”

Zamarro, 50, oversees Goodyear’s global treasury, strategic planning & analysis, risk management and investor relations functions. She is responsible for the company’s capital allocation management, including Goodyear’s global debt and pension asset portfolios. Additionally, Zamarro led the company’s $2.8 billion acquisition and financing of Cooper Tire in 2021.

Zamarro joined Goodyear in 2007 and has held key roles in strengthening the company’s financial position, including Assistant Treasurer, Capital Markets and Risk Management, where she was responsible for Goodyear’s global capital markets, creditor relations, risk management and pension asset management. In 2014, she was named Vice President, Investor Relations, and in 2018 added responsibility for Goodyear’s Financial Planning & Analysis function. Prior to Goodyear, she held finance positions at Ford Motor Company.

Zamarro earned a bachelor’s degree in economics from Ohio Wesleyan University and a master’s degree in business administration from Vanderbilt University’s Owen Graduate School of Management.

“I am excited to join L3Harris’ Board of Directors as the company continues its strategy to rapidly introduce innovative new technologies and to help transform the defense industry both domestically and internationally,” said Zamarro. “I look forward to serving on an already strong Board made up of members with diversified backgrounds and broad industry and functional experience.”

Biography High resolution photograph

About L3Harris Technologies

L3Harris Technologies is an agile global aerospace and defense technology innovator, delivering end-to-end solutions that meet customers’ mission-critical needs. The company provides advanced defense and commercial technologies across space, air, land, sea and cyber domains. L3Harris has approximately $17 billion in annual revenue and 47,000 employees, with customers in more than 100 countries. L3Harris.com.


Contacts

Jim Burke
Media Relations
This email address is being protected from spambots. You need JavaScript enabled to view it.
321-727-9131

WALTHAM, Mass.--(BUSINESS WIRE)--Global Partners LP (NYSE: GLP) (the “Partnership”) today announced that it will release its second-quarter 2022 financial results before the market opens on Friday, August 5, 2022. At 10:00 a.m. ET, the Partnership will conduct a conference call for investors and analysts hosted by Eric Slifka, President and Chief Executive Officer, Gregory B. Hanson, Chief Financial Officer, and Mark Romaine, Chief Operating Officer.


The call can be accessed by dialing (877) 709-8155 (U.S. and Canada) or (201) 689-8881 (International). The live and archived audio replay of the conference call can be accessed by visiting the “Events & Presentations” section of the “Investors” portion of the Global Partners website, https://ir.globalp.com.

About Global Partners LP

With approximately 1,700 locations primarily in the Northeast, Global Partners is one of the region’s largest independent owners, suppliers and operators of gasoline stations and convenience stores. Global also owns, controls or has access to one of the largest terminal networks in New England and New York, through which it distributes gasoline, distillates, residual oil and renewable fuels to wholesalers, retailers and commercial customers. In addition, Global engages in the transportation of petroleum products and renewable fuels by rail from the mid-continental U.S. and Canada. Global, a master limited partnership, trades on the New York Stock Exchange under the ticker symbol “GLP.” For additional information, visit www.globalp.com.


Contacts

Gregory B. Hanson
Chief Financial Officer
Global Partners LP
(781) 894-8800

Sean T. Geary
Chief Legal Officer and Secretary
Global Partners LP
(781) 894-8800

DUBLIN, Ohio--(BUSINESS WIRE)--Great Place to Work® and Fortune magazine have honored IGS Energy as one of the 2022 Best Workplaces for Millennials. Earning a spot means that IGS Energy is one of the top 100 companies for millennials to work for in the country.


Great Place to Work measured the differences in over 413,000 Millennials’ survey responses to those of other generations taken from America’s largest ongoing annual workforce study of over 1 million employee survey responses and data from companies that represent more than 6.1 million U.S. employees. In that survey, 93% of IGS Energy’s employees said the company is a great place to work. This number is 36% higher than the average U.S. company.

“We strive to make sure all employees, including millennials, love working here and have everything they need to be happy and successful in their careers,” said Jenni Kovach, Chief People Officer. “We want people to feel like family, so we’re delighted that so many employees think so highly of IGS Energy.

“And with the growth that we continue to experience, we’re happy to show others how great it is to work here.”

The Best Workplaces for Millennials list is highly competitive. Great Place to Work, the global authority on workplace culture, selected the list using rigorous analytics and confidential employee feedback. Companies were only considered if they are a Great Place to Work-Certified™ organization.

Great Place to Work is the only company culture award in America that selects winners based on how fairly employees are treated. Companies are assessed on how well they are creating a great employee experience that cuts across race, gender, age, disability status, or any aspect of who employees are or what their role is.

“These companies value their millennial workers by showing genuine care, flexibility and purpose in ways that matter to this generation,” said Michael C. Bush, CEO of Great Place to Work. “They expect company values to be lived by their leaders, which, in turn, elicits their loyalty and trust. Congratulations to the Best Workplaces for Millennials for their hard work.”

About IGS Energy

IGS Energy is redefining what it means to be an energy retailer. We are leading a transition to a more sustainable energy future for a healthier planet by empowering home and business customers to source the energy that’s right for them, manage their costs and carbon footprint, and protect the systems that keep their homes running efficiently.

As a proudly private company that follows the principles of Conscious Capitalism, we prioritize the needs of our customers, our employees and the communities where we live and work.

IGS Energy offers sustainable technologies and services, including 100% renewable electricity, carbon-neutral natural gas, solar energy systems and other energy-efficiency products. We serve as a trusted advisor to more than 1 million customers nationwide, making an ever-changing and complex industry simpler. ​For more information, click here.

About the Best Workplaces for Millennials™

Great Place to Work selected the Best Workplaces for Millennials by gathering and analyzing over 1 million confidential survey responses and data from companies representing more than 6.1 million U.S. employees at Great Place to Work-Certified™ organizations. Company rankings are derived from 60 employee experience questions within the Great Place to Work Trust Index™ survey. Read the full methodology.

To get on this list next year, start here.

About Great Place to Work®

Great Place to Work is the global authority on workplace culture. Since 1992, it has surveyed more than 100 million employees worldwide and used those deep insights to define what makes a great workplace: trust. Its employee survey platform empowers leaders with the feedback, real-time reporting and insights they need to make data-driven people decisions. Everything it does is driven by the mission to build a better world by helping every organization become a great place to work For All™.

Learn more at greatplacetowork.com and on LinkedIn, Twitter, Facebook and Instagram.


Contacts

David Gilligan
IGS Energy Public Relations
This email address is being protected from spambots. You need JavaScript enabled to view it. | 614.787.6094

SAN ANTONIO--(BUSINESS WIRE)--Synthica Energy, LLC today announced the development of a new anaerobic digestion facility in northeast San Antonio, TX. The facility will focus on converting organic byproducts from food and beverage producers into Renewable Natural Gas (RNG).


Synthica’s facility is being developed at an industrial site located along IH 35 to ensure easy access to manufacturers in the region along with rail access. The project is expected to be completed in late 2024 and will produce approximately 250,000 MMBTU of carbon negative RNG per year, and process 200,000 tons per year of food waste that otherwise ends up in landfills and emitting greenhouse gases into the atmosphere.

“San Antonio, as a major food production hub in Texas, makes perfect sense as a location for our food waste focused renewable natural gas facilities,” said Sam Schutte, Synthica Energy CEO. “Upwards of 30% of the materials currently going into local landfills has an energy potential that is currently wasted - and using our Urban Friendly Digestion model, we can process that material safely and cleanly into an untapped energy source. We are pleased to join the San Antonio manufacturing community in its efforts to achieve carbon neutrality in the coming years.”

“We’re proud to welcome Synthica and the 50 new jobs they plan to add to support their new facility in San Antonio. Synthica is making a smart investment here in our region where they can work in partnership with our robust food and beverage manufacturing cluster to turn waste into energy,” said Tom Long, Managing Director at greater:SATX Regional Economic Partnership.

The facility, along with a recently announced facility in Houston, TX, will be the largest AD facilities of their kind in the state, and are part of Synthica’s aggressive expansion plan to scale their model to target markets in the next five years. Engineering and Design for the facility is being performed by RETTEW, a leading anaerobic digestion engineering consultant based in Lancaster, PA.

About Synthica Energy

Synthica Energy is an anaerobic digestion and renewable natural gas (RNG) development company focused on the creation of organics-to-energy facilities in underserved markets. The company is currently developing the largest food waste to energy facility in the State of Ohio, based in the Cincinnati region, as well as facilities in Houston, TX and Lebanon Junction, KY. To learn more, visit https://synthica.com.


Contacts

Valerie McDonough
513-268-6688
Email: This email address is being protected from spambots. You need JavaScript enabled to view it.

DALLAS--(BUSINESS WIRE)--The Board of Directors of Holly Energy Partners, L.P. (NYSE:HEP) has declared a cash distribution of $0.35 per unit for the second quarter of 2022. The distribution will be paid on August 12, 2022 to unitholders of record on August 1, 2022.


HEP plans to announce results for its second quarter of 2022 on August 8, 2022 before the opening of trading on the NYSE and has scheduled a webcast conference on August 8, 2022 at 8:30 a.m. Eastern time to discuss financial results.

The webcast may be accessed at:
https://events.q4inc.com/attendee/167295545

About Holly Energy Partners, L.P.:

Holly Energy Partners, L.P., headquartered in Dallas, Texas, provides petroleum product and crude oil transportation, terminalling, storage and throughput services to the petroleum industry, including subsidiaries of HF Sinclair Corporation. HEP, through its subsidiaries and joint ventures, owns and/or operates petroleum product and crude pipelines, tankage and terminals in Colorado, Idaho, Iowa, Kansas, Missouri, Nevada, New Mexico, Oklahoma, Texas, Utah, Washington and Wyoming, as well as refinery processing units in Kansas and Utah.

This press release is intended to be a qualified notice under Treasury Regulation Section 1.1446-4(b). Please note that one hundred percent (100.0%) of HEP’s distributions to foreign investors are attributable to income that is effectively connected with a United States trade or business. Accordingly, HEP’s distributions to foreign investors are subject to federal income tax withholding at the highest applicable effective tax rate.

Forward Looking Statements:

This press release contains various “forward-looking statements” within the meaning of the federal securities laws. These forward-looking statements are identified as any statement that does not relate strictly to historical or current facts. When used in this press release, words such as “anticipate,” “project,” “expect,” “will,” “plan,” “goal,” “forecast,” “strategy,” “intend,” “should,” “would,” “could,” “believe,” “may” and similar expressions and statements regarding our plans and objectives for future operations are intended to identify forward-looking statements. These forward-looking statements are based on our beliefs and assumptions and those of our general partner, using currently available information and expectations as of the date hereof, are not guarantees of future performance and involve certain risks and uncertainties, including those contained in our filings with the Securities and Exchange Commission. Although we and our general partner believe that such expectations reflected in such forward-looking statements are reasonable, neither we nor our general partner can give assurance that our expectations will prove to be correct. All statements concerning our expectations for future results of operations are based on forecasts for our existing operations and do not include the potential impact of any future acquisitions. Our forward-looking statements are subject to a variety of risks, uncertainties and assumptions. If one or more of these risks or uncertainties materialize, or if underlying assumptions prove incorrect, our actual results may vary materially from those anticipated, estimated, projected or expected. Certain factors could cause actual results to differ materially from results anticipated in the forward-looking statements. These factors include, but are not limited to:

  • HF Sinclair Corporation’s (“HF Sinclair”) and our ability to successfully integrate the Sinclair Oil Corporation (now known as Sinclair Oil LLC) and Sinclair Transportation Company LLC businesses acquired from The Sinclair Companies (now known as REH Company) (collectively, the “Sinclair Transactions”) with our existing operations and fully realize the expected synergies of the Sinclair Transactions or on the expected timeline;
  • the demand for and supply of crude oil and refined products, including uncertainty regarding the effects of the continuing COVID-19 pandemic on future demand and increasing societal expectations that companies address climate change;
  • risks and uncertainties with respect to the actual quantities of petroleum products and crude oil shipped on our pipelines and/or terminalled, stored or throughput in our terminals and refinery processing units;
  • the economic viability of HF Sinclair, our other customers and our joint ventures’ other customers, including any refusal or inability of our or our joint ventures’ customers or counterparties to perform their obligations under their contracts;
  • the demand for refined petroleum products in the markets we serve;
  • our ability to purchase and integrate future acquired operations;
  • our ability to complete previously announced or contemplated acquisitions;
  • the availability and cost of additional debt and equity financing;
  • the possibility of temporary or permanent reductions in production or shutdowns at refineries utilizing our pipelines, terminal facilities and refinery processing units, due to reasons such as infection in the workforce, in response to reductions in demand or lower gross margins due to the economic impact of the COVID-19 pandemic, and any potential asset impairments resulting from such actions;
  • the effects of current and future government regulations and policies, including the effects of current and future restrictions on various commercial and economic activities in response to the COVID-19 pandemic;
  • delay by government authorities in issuing permits necessary for our business or our capital projects;
  • our and our joint venture partners’ ability to complete and maintain operational efficiency in carrying out routine operations and capital construction projects;
  • the possibility of terrorist or cyberattacks and the consequences of any such attacks;
  • uncertainty regarding the effects and duration of global hostilities and any associated military campaigns which may disrupt crude oil supplies and markets for refined products and create instability in the financial markets that could restrict our ability to raise capital;
  • general economic conditions, including uncertainty regarding the timing, pace and extent of an economic recovery in the United States;
  • the impact of recent or proposed changes in the tax laws and regulations that affect master limited partnerships; and
  • other financial, operational and legal risks and uncertainties detailed from time to time in our filings with the U.S. Securities and Exchange Commission.

The forward-looking statements speak only as of the date made and, other than as required by law, we undertake no obligation to publicly update or revise any forward-looking statements, whether as a result of new information, future events or otherwise.


Contacts

Holly Energy Partners, L.P.
Craig Biery, 214-954-6511
Vice President, Investor Relations
or
Trey Schonter, 214-954-6511
Manager, Investor Relations

TULSA, Okla.--(BUSINESS WIRE)--Unit Corporation (OTC Pink: UNTC) (Company) today reported preliminary and unaudited selected financial and operational highlights for the three months ended June 30, 2022.

Second Quarter Results

Net income (loss) attributable to Unit Corporation for the three months ended June 30, 2022 is expected to be $80.1 million, or $7.82 per diluted share, compared to $(13.0) million, or $(1.09) per diluted share, for the three months ended June 30, 2021. Total revenues for the three months ended June 30, 2022 is expected to be $134.6 million, compared to $134.1 million for the three months ended June 30, 2021.

For the six months ended June 30, 2022, net income (loss) attributable to Unit Corporation is expected to be $33.2 million, or $3.25 per diluted share, compared to $(14.9) million, or $(1.25) per diluted share, for the six months ended June 30, 2021. Total revenues for the six months ended June 30, 2022 is expected to be $322.9 million, compared to $255.0 million for the six months ended June 30, 2021.

Philip B. Smith, the Company’s Chairman and Chief Executive Officer, commented, “We are pleased with our quarterly results and excited about future opportunities given the recent decision to terminate our upstream sales process. With a June 30, 2022 cash balance in excess of $115 million augmented by proceeds received in July from the sale of our Gulf Coast oil and gas properties, zero long-term debt, full utilization of our BOSS rig fleet, and an attractive inventory of upstream development opportunities, we are poised to further create and return substantial value to our shareholders. Given the Company’s growing cash balance, the Company is currently updating its calculation of tax earnings and profits. This will be important information which can be used by the Board in implementing any future plan for return of cash via dividends and distributions to the shareholders in a tax efficient manner.”

The Company has not yet completed its reporting process for the three months ended June 30, 2022. The preliminary results presented herein are based on its reasonable estimates and the information available to it at this time. As such, the Company's actual results may materially vary from the preliminary results presented herein and will not be finalized until the Company reports its final results for the three and six months ended June 30, 2022 after the completion of its normal quarter end accounting procedures and the execution of its internal controls over financial reporting. In addition, any statements regarding the Company's estimated financial performance for the three and six months ended June 30, 2022 do not present all information necessary for an understanding of the Company's financial condition and results of operations as of and for the three and six months ended June 30, 2022. Our independent registered public accounting firm has not audited, compiled, performed any procedures on, or reviewed the preliminary financial data, and accordingly does not express an opinion or any other form of assurance with respect to the preliminary financial data. We plan to report our full results for the three months ended June 30, 2022 on or before August 15, 2022.

Operational highlights for the oil and natural gas and contract drilling segments during three and six months ended June 30, 2022 and 2021 include:

Three Months Ended June 30,

Six Months Ended June 30,


2022


2021


Percent

Change


2022


2021


Percent

Change


(In thousands unless otherwise specified)

Oil and Natural Gas:


Avg. oil price (Bbl)

$

56.28


$

48.38


16

%


$

58.23


$

47.82


22

%

Avg. oil price excl. derivatives (Bbl)

$

110.29


$

64.38


71

%


$

100.03


$

60.12


66

%

Avg. NGLs price (Bbl)

$

34.72


$

17.95


93

%


$

33.82


$

17.95


88

%

Avg. NGLs price excl. derivatives (Bbl)

$

34.72


$

17.95


93

%


$

33.82


$

17.95


88

%

Avg. natural gas price (Mcf)

$

4.24


$

2.98


42

%


$

3.78


$

2.87


32

%

Avg. natural gas price excl. derivatives (Mcf)

$

6.62


$

3.00


121

%


$

5.60


$

2.86


96

%

Oil production (MBbls)


309


389


(21

) %


714


801


(11

) %

NGL production (MBbls)


620


662


(6

) %


1,233


1,303


(5

) %

Natural gas production (MMcf)


6,821


7,543


(10

) %


13,336


14,946


(11

) %


Contract Drilling:


Average drilling rigs in use


16.3


10.0


63

%


15.9


9.7


64

%

Drilling rigs available (end of the period)


21


21


%


21


21


%

Average dayrate on daywork contracts

$

21,285


$

18,269


17

%


$

20,555


$

18,200


13

%

Divestiture Program and Borrowing Base Reduction

The Company initiated an asset divestiture program at the beginning of 2021 to sell certain non-core oil and gas properties and reserves (the “Divestiture Program”). On October 4, 2021, the Company announced that it was expanding the Divestiture Program to now include the potential sale of additional properties, including up to all of UPC’s oil and gas properties and reserves, and on January 20, 2022, the Company announced that it had retained a financial advisor and launched the process. On June 10, 2022, the Company announced that it had ended its engagement with the financial advisor and terminated the process. During the process, the Company entered into an agreement to sell its Gulf Coast oil and gas properties.

On July 1, 2022, the Company closed on the sale of certain wells and related leases near the Texas Gulf Coast for cash proceeds of $43.7 million, subject to customary post-closing adjustments based on an effective date of April 1, 2022. These proceeds reduced the net book value of our full cost pool with no gain or loss recognized as the sale did not result in a significant alteration of the full cost pool. Also on July 1, 2022, the RBL Facility borrowing base was automatically reduced to $31.3 million as a result of closing the Gulf Coast properties sale.

Share Repurchase Program

In June 2022, the Company's board of directors increased the previously authorized share repurchase program to $100.0 million. The repurchases will be made through open market purchases, privately negotiated transactions, or other available means. The Company has no obligation to repurchase any shares under the repurchase program and may suspend or discontinue it at any time without prior notice. As of June 30, 2022, we had repurchased a total of 1,519,392 shares under the repurchase program at an average share price of $36.00 for an aggregate purchase price of $54.7 million. There were 9,831,169 shares of common stock outstanding as of June 30, 2022. Subsequent to June 30, 2022, we have repurchased an additional 75,000 shares under the repurchase program for an aggregate purchase price of $3.8 million.

Commodity Derivatives

Cash settlements paid on commodity derivatives totaled $32.9 million and $54.1 million during the three and six months ended June 30, 2022, respectively, compared to $6.4 million and $9.7 million for the three and six months ended June 30, 2021, respectively. The Company had net current derivative liabilities and net non-current derivative liabilities of $48.8 million and $17.2 million, respectively, as of June 30, 2022, compared to net current derivative liabilities and net non-current derivative liabilities of $40.9 million and $17.9 million, respectively, as of December 31, 2021. The following non-designated commodity hedges were outstanding as of June 30, 2022:

Term


Commodity


Contracted Volume


Weighted Average

Fixed Price for Swaps


Contracted Market

Apr'22 - Dec'22


Natural gas - swap


5,000 MMBtu/day


$2.61


IF - NYMEX (HH)

Jul'22 - Feb'23


Natural gas - swap


18,765 MMBtu/day


$9.14


IF - NYMEX (HH)

Jan'23 - Dec'23


Natural gas - swap


22,000 MMBtu/day


$2.46


IF - NYMEX (HH)

Apr'22 - Dec'22


Natural gas - collar


35,000 MMBtu/day


$2.50 - $2.68


IF - NYMEX (HH)

Apr'22 - Dec'22


Crude oil - swap


2,300 Bbl/day


$42.25


WTI - NYMEX

Jul'22 - Dec'22


Crude oil - swap


596 Bbl/day


$103.98


WTI - NYMEX

Jan'23 - Feb'23


Crude oil - swap


1,339 Bbl/day


$95.40


WTI - NYMEX

Jan'23 - Dec'23


Crude oil - swap


1,300 Bbl/day


$43.60


WTI - NYMEX

Superior Distributions

Superior is expected to pay approximately $13.9 million of distributions to SP Investor Holdings, LLC in late July 2022 related to available cash generated during the three months ended June 30, 2022. These distributions are expected to reduce the remaining Drilling Commitment Adjustment Amount (as defined in the Amended and Restated Limited Liability Company Agreement) to approximately $48.2 million. As of June 30, 2022, liquidation distributions paid first to SP Investor of $353.7 million would be required for SP Investor to reach its 7% Liquidation IRR Hurdle at which point Unit would then be entitled to receive up to $353.7 million of the remaining liquidation distributions to satisfy Unit's 7% Liquidation IRR Hurdle with any remaining liquidation distributions paid as outlined within the Agreement.

Warrants

On April 7, 2022, the Company delivered notice of the initial $63.74 exercise price resulting in the warrants being exercisable for shares of the Company’s common stock and meeting the definition of an equity instrument. Accordingly, we recognized the change in the fair value of the warrant liability in our unaudited condensed consolidated statements of operations and reclassified the $49.1 million warrant liability to capital in excess of par value on the unaudited condensed consolidated balance sheets as of April 7, 2022. On or about April 25, 2022, the warrants began trading over-the-counter under the symbol "UNTCW".

About Unit Corporation

Unit Corporation is a Tulsa-based, publicly held energy company engaged through its wholly-owned subsidiaries in oil and gas production and contract drilling as well as its partial investment in natural gas gathering and processing. For more information about Unit Corporation, visit its website at http://www.unitcorp.com.

Forward-Looking Statements

This news release contains forward-looking statements within the meaning of the Private Securities Litigation Reform Act. All statements, other than statements of historical facts, included in this release that address activities, events, or developments that the Company expects, believes, or anticipates will or may occur are forward-looking statements. Several risks and uncertainties could cause actual results to differ materially from these statements, including changes in commodity prices, the productive capabilities of the Company’s wells, future demand for oil and natural gas, future drilling rig utilization and dayrates, projected rate of the Company’s oil and natural gas production, the amount available to the Company for borrowings, its anticipated borrowing needs under its credit agreements, the number of wells to be drilled by the Company’s oil and natural gas segment, the potential productive capability of its prospective plays, and other factors described occasionally in the Company’s publicly available SEC reports. The Company assumes no obligation to update publicly such forward-looking statements, whether because of new information, future events, or otherwise.

Unit Corporation

Selected Financial Highlights (Unaudited)


Three Months Ended June 30,


Six Months Ended June 30, 2022


2022


2021


2022


2021


(In thousands except per share amounts)

Revenues:


Oil and natural gas

$

100,912


$

41,970


$

177,722


$

96,994


Contract drilling


33,642


18,061


62,524


33,735


Gas gathering and processing


74,026


82,673


124,225


Total revenues


134,554


134,057


322,919


254,954


Expenses:


Operating costs:


Oil and natural gas


27,619


15,487


51,094


34,636


Contract drilling


25,763


14,080


52,000


25,951


Gas gathering and processing


45,056


62,388


84,719


Total operating costs


53,382


74,623


165,482


145,306


Depreciation, depletion, and amortization


5,661


16,364


16,931


33,875


General and administrative


7,421


5,751


13,947


12,920


Gain on disposition of assets


(2,066

)


(1,710

)


(4,241

)


(2,182

)

Total operating expenses


64,398


95,028


192,119


189,919


Income from operations


70,156


39,029


130,800


65,035


Other income (expense):


Interest, net


(97

)


(487

)


(371

)


(3,193

)

Gain (loss) on derivatives


2,609


(42,400

)


(61,467

)


(65,231

)

Gain (loss) on change in fair value of warrants


7,289


(3,574

)


(29,323

)


(3,574

)

Loss on deconsolidation of Superior


(13,141

)


Reorganization items, net


(39

)


(1,852

)


(42

)


(2,988

)

Other, net


175


(831

)


932


(755

)

Total other income (expense)


9,937


(49,144

)


(103,412

)


(75,741

)

Income (loss) before income taxes


80,093


(10,115

)


27,388


(10,706

)

Income tax expense (benefit):


Current


Deferred


Total income taxes


Net income (loss)


80,093


(10,115

)


27,388


(10,706

)

Net income (loss) attributable to non-controlling interest


2,879


(5,828

)


4,225


Net income (loss) attributable to Unit Corporation

$

80,093


$

(12,994

)


$

33,216


$

(14,931

)

Net income (loss) attributable to Unit Corporation per common share:


Basic

$

7.99


$

(1.09

)


$

3.31


$

(1.25

)

Diluted

$

7.82


$

(1.09

)


$

3.25


$

(1.25

)

Unit Corporation

Selected Financial Highlights (Unaudited) - Continued


June 30,
2022


December 31,
2021

Balance Sheet Data:

(In thousands)

Cash and cash equivalents

$

115,628


$

64,140

Current assets

$

187,363


$

156,930

Total assets

$

422,392


$

629,477

Current liabilities

$

107,564


$

151,138

Long-term debt

$


$

19,200

Other long-term liabilities and non-current derivative liability

$

54,460


$

59,471

Total shareholders’ equity attributable to Unit Corporation

$

260,368


$

187,397

Unit Corporation

Selected Financial Highlights (Unaudited) - Continued


Three Months Ended June 30, 2022


Oil and
Natural Gas


Contract
Drilling


Mid-Stream


Corporate and
Other


Eliminations


Total
Consolidated


(In thousands)

Revenues:


Oil and natural gas


$

100,896


$


$


$


$

16


$

100,912


Contract drilling


33,642


33,642


Total revenues


100,896


33,642


16


134,554


Expenses:


Operating costs:


Oil and natural gas


27,603


16


27,619


Contract drilling


25,763


25,763


Total operating costs


27,603


25,763


16


53,382


Depreciation, depletion, and amortization


4,027


1,558


76


5,661


Total expenses


31,630


27,321


76


16


59,043


General and administrative


7,421


7,421


Gain on disposition of assets


(25

)


(2,041

)


(2,066

)

Income (loss) from operations


69,291


8,362


(7,497

)


70,156


Gain on derivatives


2,609


2,609


Gain on change in fair value of warrants


7,289


7,289


Reorganization items, net


(39

)


(39

)

Interest, net


(97

)


(97

)

Other


13


9


153


175


Income before income taxes


$

69,304


$

8,371


$


$

2,418


$


$

80,093


Capital expenditures


$

1,753


$

3,225


$


$

44


$


$

5,022


Unit Corporation

Selected Financial Highlights (Unaudited) - Continued


Six Months Ended June 30, 2022


Oil and
Natural Gas


Contract
Drilling


Mid-Stream (1)


Corporate and
Other


Eliminations (1)


Total
Consolidated


(In thousands)

Revenues: (1)


Oil and natural gas


$

188,478


$


$


$


$

(10,756

)


$

177,722


Contract drilling


62,524


62,524


Gas gathering and processing


83,198


(525

)


82,673


Total revenues


188,478


62,524


83,198


(11,281

)


322,919


Expenses:


Operating costs:


Oil and natural gas


51,603


(509

)


51,094


Contract drilling


52,000


52,000


Gas gathering and processing


73,771


(11,383

)


62,388


Total operating costs


51,603


52,000


73,771


(11,892

)


165,482


Depreciation, depletion, and amortization


8,075


3,092


5,614


150


16,931


Total expenses


59,678


55,092


79,385


150


(11,892

)


182,413


General and administrative


13,336


611


13,947


(Gain) loss on disposition of assets


(79

)


(4,165

)


3


(4,241

)

Income (loss) from operations


128,879


11,597


3,813


(13,489

)


130,800


Loss on derivatives


(61,467

)


(61,467

)

Loss on change in fair value of warrants


(29,323

)


(29,323

)

Loss on deconsolidation of Superior


(13,141

)


(13,141

)

Reorganization items, net


(42

)


(42

)

Interest, net


(179

)


(192

)


(371

)

Other


721


28


17


166


932


Income (loss) before income taxes


$

129,600


$

11,625


$

3,651


$

(117,488

)


$


$

27,388


Capital expenditures


$

8,199


$

4,232


$

1,167


$

49


$


$

13,647


1. Includes Superior activity for the two months prior to the March 1, 2022 deconsolidation of Superior.


Contacts

Rene Punch
Investor Relations
(918) 493-7700
www.unitcorp.com

DALLAS--(BUSINESS WIRE)--Energy Transfer LP (“ET”) today announced the quarterly cash distribution of $0.4609375 per Series C Preferred Unit (NYSE: ETprC), the quarterly cash distribution of $0.4765625 per Series D Preferred Unit (NYSE: ETprD), and the quarterly cash distribution of $0.4750000 per Series E Preferred Unit (NYSE: ETprE). These cash distributions will be paid on August 15, 2022 to Series C, Series D and Series E unitholders of record as of the close of business on August 1, 2022.


Energy Transfer LP (NYSE: ET) owns and operates one of the largest and most diversified portfolios of energy assets in North America, with a strategic footprint in all of the major U.S. production basins. Energy Transfer is a publicly traded limited partnership with core operations that include complementary natural gas midstream, intrastate and interstate transportation and storage assets; crude oil, natural gas liquids (NGL) and refined product transportation and terminalling assets; and NGL fractionation. Energy Transfer also owns Lake Charles LNG Company, as well as the general partner interests, the incentive distribution rights and 28.5 million common units of Sunoco LP (NYSE: SUN), and the general partner interests and 46.1 million common units of USA Compression Partners, LP (NYSE: USAC). For more information, visit the Energy Transfer LP website at www.energytransfer.com

Forward Looking Statements

This press release may include certain statements concerning expectations for the future that are forward-looking statements as defined by federal law. Such forward-looking statements are subject to a variety of known and unknown risks, uncertainties, and other factors that are difficult to predict and many of which are beyond management’s control. An extensive list of factors that can affect future results are discussed in the Partnership’s Annual Report on Form 10-K and other documents filed from time to time with the Securities and Exchange Commission. In addition to the risks and uncertainties previously disclosed, the Partnership has also been, or may in the future be, impacted by new or heightened risks related to the COVID-19 pandemic, and we cannot predict the length and ultimate impact of those risks. The Partnership undertakes no obligation to update or revise any forward-looking statement to reflect new information or events.

This release serves as qualified notice to nominees as provided for under Treasury Regulation section 1.1446-4(b)(4) and (d). Please note that 100 percent of Energy Transfer LP’s distributions to foreign investors are attributable to income that is effectively connected with a United States trade or business. Accordingly, all of Energy Transfer LP’s distributions to foreign investors are subject to federal tax withholding at the highest applicable effective tax rate. Nominees, and not Energy Transfer LP, are treated as withholding agents responsible for withholding distributions received by them on behalf of foreign investors.

The information contained in this press release is available on our website at energytransfer.com.


Contacts

Investor Relations:
Bill Baerg
Brent Ratliff
Lyndsay Hannah
214-981-0795

Media Relations:
Vicki Granado
214-840-5820

LOWELL, Ark.--(BUSINESS WIRE)--J.B. Hunt Transport Services, Inc. (NASDAQ:JBHT) announced today that its Board of Directors adopted a new share repurchase program authorizing the repurchase of an additional $500 million of the Company’s common stock. The specific timing and amount of the repurchase will vary based on market conditions, cash flows, securities law limitations and other factors. The repurchase program may be suspended, extended or discontinued at any time without prior notice.


About J.B. Hunt

J.B. Hunt Transport Services, Inc., an S&P 500 company, provides innovative supply chain solutions for a variety of customers throughout North America. Utilizing an integrated, multimodal approach, the company applies technology-driven methods to create the best solution for each customer, adding efficiency, flexibility, and value to their operations. J.B. Hunt services include intermodal, dedicated, refrigerated, truckload, less-than-truckload, flatbed, single source, final mile, and more. J.B. Hunt Transport Services, Inc. stock trades on NASDAQ under the ticker symbol JBHT and is a component of the Dow Jones Transportation Average. J.B. Hunt Transport, Inc. is a wholly owned subsidiary of JBHT. For more information, visit www.jbhunt.com.


Contacts

J.B. Hunt Transport Services, Inc.
Brad Delco
Senior Vice President - Finance
(479) 820-2723

HOUSTON--(BUSINESS WIRE)--Today Western Midstream Partners, LP (NYSE: WES) (“WES” or the “Partnership”) announced that the board of directors of its general partner declared a quarterly cash distribution of $0.50 per unit for the second quarter of 2022. This distribution is in line with the prior quarter’s distribution and is consistent with the partnership’s previously disclosed annualized regular quarterly distribution (“Base Distribution”) target of $2.00 per unit. WES’s second-quarter 2022 distribution is payable August 12, 2022, to unitholders of record at the close of business on August 1, 2022.


The Partnership plans to report its second-quarter 2022 results after market close on Wednesday, August 3, 2022. Management will host a conference call on Thursday, August 4, 2022, at 1 p.m. CDT (2 p.m. EDT) to discuss the Partnership’s quarterly results. The full text of the release announcing the results will be available on the Partnership’s website at www.westernmidstream.com.

Second-Quarter 2022 Results
Thursday, August 4, 2022
1 p.m. CDT (2 p.m. EDT)
Dial-in number: 888-330-2354
 International dial-in number: 240-789-2706
Participant access code: 32054

To participate in WES’s scheduled second-quarter 2022 earnings call, refer to the above-listed dial-in number and participant access code. To access the live audio webcast of the conference call, please visit the investor relations section of the Partnership’s website at www.westernmidstream.com. A replay of the conference call also will be available on the website following the call.

ABOUT WESTERN MIDSTREAM

Western Midstream Partners, LP (“WES”) is a Delaware master limited partnership formed to acquire, own, develop, and operate midstream assets. With midstream assets located in the Rocky Mountains, North-central Pennsylvania, Texas, and New Mexico, WES is engaged in the business of gathering, compressing, treating, processing, and transporting natural gas; gathering, stabilizing, and transporting condensate, NGLs, and crude oil; and gathering and disposing of produced water for its customers. In addition, in its capacity as a processor of natural gas, WES also buys and sells natural gas, NGLs, and condensate on behalf of itself and as an agent for its customers under certain of its contracts.

For more information about Western Midstream Partners, LP and Western Midstream Flash Feed updates, please visit www.westernmidstream.com.

This news release contains forward-looking statements. WES and its general partner believe that their expectations are based on reasonable assumptions. No assurance, however, can be given that such expectations will prove to have been correct. A number of factors could cause actual results to differ materially from the projections, anticipated results or other expectations expressed in this news release. These factors include our ability to meet distribution expectations and financial guidance; the timeline for a full recovery in commodity demand and prices; our ability to safely and efficiently operate WES’s assets; the supply of, demand for, and price of oil, natural gas, NGLs, and related products or services; our ability to meet projected in-service dates for capital-growth projects; construction costs or capital expenditures exceeding estimated or budgeted costs or expenditures; and the other factors described in the “Risk Factors” section of WES’s most-recent Form 10-K and Form 10-Q filed with the Securities and Exchange Commission and other public filings and press releases. WES undertakes no obligation to publicly update or revise any forward-looking statements.

Note regarding Non-United States Investors: This release is intended to be a qualified notice under Treasury Regulation Section 1.1446-4(b). Brokers and nominees should treat one hundred percent (100.0%) of Western Midstream Partners, LP’s distributions to non-U.S. investors as being attributable to income that is effectively connected with a United States trade or business. Accordingly, Western Midstream Partners, LP’s distributions to non-U.S. investors are subject to federal income tax withholding at the highest applicable effective tax rate.


Contacts

Daniel Jenkins
Director, Investor Relations
This email address is being protected from spambots. You need JavaScript enabled to view it.
832.636.1009

Shelby Keltner
Manager, Investor Relations
This email address is being protected from spambots. You need JavaScript enabled to view it.
832.636.1009

CANONSBURG, Pa.--(BUSINESS WIRE)--Equitrans Midstream Corporation (NYSE: ETRN) today declared quarterly cash dividends of $0.15 per common share and $0.4873 per share of Series A Perpetual Convertible Preferred Stock for the second quarter 2022. The dividends will be paid on August 12, 2022, to all applicable ETRN shareholders of record at the close of business on August 3, 2022.


About Equitrans Midstream Corporation:

Equitrans Midstream Corporation (ETRN) has a premier asset footprint in the Appalachian Basin and, as the parent company of EQM Midstream Partners, is one of the largest natural gas gatherers in the United States. Through its strategically located assets in the Marcellus and Utica regions, ETRN has an operational focus on gas transmission and storage systems, gas gathering systems, and water services that support natural gas development and production across the Basin. With a rich 135-year history in the energy industry, ETRN was launched as a standalone company in 2018 with the vision to be the premier midstream services provider in North America. ETRN is helping to meet America’s growing need for clean-burning energy, while also providing a rewarding workplace and enriching the communities where its employees live and work.

For more information on Equitrans Midstream Corporation, visit www.equitransmidstream.com; and to learn more about our environmental, social, and governance practices visit ETRN Sustainability Reporting.


Contacts

Analyst inquiries:
Nate Tetlow – Vice President, Corporate Development and Investor Relations
412.553.5834
This email address is being protected from spambots. You need JavaScript enabled to view it.

Media inquiries:
Natalie A. Cox – Communications and Corporate Affairs
412.395.3941
This email address is being protected from spambots. You need JavaScript enabled to view it.

HOUSTON--(BUSINESS WIRE)--Natural Resource Partners L.P. (NYSE: NRP) plans to report its second quarter 2022 financial results before the market opens on Thursday, August 4, 2022. Management will host a conference call beginning at 9:00 a.m. ET to discuss the results.

To register for the conference call please use this link https://conferencingportals.com/event/kfJdSHYP. After registering, a confirmation will be sent via email and include dial in details and unique conference call codes for entry. Registration is open through the live call, however, to ensure you are connected for the full conference call we suggest registering a day in advance or at minimum 10 minutes before the start of the call. Investors may also listen to the conference call live via the Investor Relations section of the NRP website at www.nrplp.com.

Audio replays of the conference call will be available on the Investor Relations section of NRP’s website.

Company Profile

Natural Resource Partners L.P., a master limited partnership headquartered in Houston, TX, is a diversified natural resource company that owns, manages and leases a diversified portfolio of properties in the United States including coal, industrial minerals and other natural resources, as well as rights to conduct carbon sequestration and renewable energy activities. NRP also owns an equity investment in Sisecam Wyoming LLC, one of the world’s lowest-cost producers of soda ash.

Further information about NRP is available on the partnership’s website at http://www.nrplp.com.


Contacts

NRP Contact
Tiffany Sammis, Investor Relations, 713.751.7515, This email address is being protected from spambots. You need JavaScript enabled to view it.

Offshore Source Logo

Offshore Source keeps you updated with relevant information concerning the Offshore Energy Sector.

Any views or opinions represented on this website belong solely to the author and do not represent those of the people, institutions or organizations that Offshore Source or collaborators may or may not have been associated with in a professional or personal capacity, unless explicitly stated.

Corporate Offices

Technology Systems Corporation
8502 SW Kansas Ave
Stuart, FL 34997

info@tscpublishing.com