Business Wire News

Impersonators take advantage of hectic schedules to steal money and personal information

CHICAGO--(BUSINESS WIRE)--Media Alert: ComEd can make company representatives available for interviews to share scam-awareness tips for Utility Scam Awareness Day, Wednesday, Nov. 16.

In advance of Utility Scam Awareness Day, which is Wednesday, Nov. 16, ComEd urges families and businesses to be on the lookout for impersonators looking to steal money and information from unsuspecting individuals.

Scammers posing as ComEd employees will call homes and businesses from a number that appears to be from ComEd and threaten to turn off electric service unless payment is made to a bogus website or phone number. Sometimes imposters will visit in person to collect personal information that can be used to steal identities or access bank accounts.

During the holidays, scammers and imposters will up their game… knowing people are busier, distracted with holiday plans and paying less attention to their spending and bill-paying habits,” said Nichole Owens, ComEd vice president of customer channels. “The best defense against scams is knowing what to look for and sharing scam-awareness tips with family and friends.”

Adds Steve J. Bernas, president and CEO of Better Business Bureau, and a strategic partner with ComEd in raising awareness of utility scams: “Fraudsters use fear and distraction to trick their victims. They put the fear in people that they may lose their electricity during the holidays as well as the coldest of winter months and peak summer heat. We always see a spike in these reports to the BBB Scamtracker when staying warm or cool is most important, and your well-being may depend on it.”

Tips to Help Identify Scams

ComEd will never call or visit your home or business to:

  • ask for direct payment with a prepaid cash card, cryptocurrency such as Bitcoin, or third-party payment app like Cash App, QuickPay, Venmo or Zelle;
  • demand immediate payment; or
  • ask for personal information, such as a Social Security number, driver’s license number of bank information; we also will not ask for your ComEd account number unless you contact us first to enroll in a program or service.

Tips to Help Identify a True ComEd Employee

  • All ComEd field employees wear a uniform with the ComEd logo and visibly display a company ID badge with the logo and employee’s name.
  • ComEd recently changed its logo, so customers may continue to see the former ComEd logo on uniforms, badges and vehicles until the logo is phased out.
  • If customers are ever unsure about whether a person knocking at their door is a true ComEd employee, they are encouraged to close and lock their door, and call ComEd from a trusted phone number – which is 800-EDISON1 (800-334-7661). A true ComEd employee will not mind waiting.

Assistance With Past-Due Balances

Scammers sometimes find success with individuals and businesses who may be behind in their bills and pressure them into sending immediate payment. For anyone facing difficulty paying their electric bill, ComEd offers a number of payment assistance programs to help customers avoid late notices and disconnection. For information, visit ComEd.com/PaymentAssistance.

To make it easier for customers to find ways to pay electric bills and energy-saving tips, ComEd offers its Smart Assistance Manager (SAM), an online self-service tool that can match customers with payment-assistance programs and energy-efficiency offerings to help them manage their electric bills now and into the future.

ComEd is a unit of Chicago-based Exelon Corporation (NASDAQ: EXC), a Fortune 200 energy company with approximately 10 million electricity and natural gas customers – the largest number of customers in the U.S. ComEd powers the lives of more than 4 million customers across northern Illinois, or 70 percent of the state’s population. For more information visit ComEd.com and connect with the company on Facebook, Twitter, Instagram and YouTube.


Contacts

ComEd Media Relations
312-394-3500

Strong performance continues in 2022, with reliability for the first 10 months of the year better than in any prior year

CHICAGO--(BUSINESS WIRE)--Families and businesses served by ComEd experienced fewer power outages on average than customers of any comparable electric company for a fifth consecutive year in 2021, based on industry standard measures for reliability. And when ComEd customers did experience an outage last year, their service was restored as fast or faster on average than customers of the other electric companies. This is according to a company analysis of 25 peer U.S. energy companies with approximately 1 million customers or more.


“Our customers appreciate that the energy we deliver is some of the cleanest and lowest cost in the nation, but what they value most is the 24/7 reliability of our critical service,” said ComEd CEO Gil Quiniones. “It’s gratifying to see the difference a decade’s worth of investment to make our power grid stronger and more intelligent has made for the 9 million people we have the privilege of serving every day.”

ComEd has continued its consistent record of strong reliability performance in 2022. Overall reliability for the first 10 months of the year was better than in any prior year and 82 percent better than when ComEd began to increase its smart grid improvements in 2012. More than 3.6 million of ComEd’s 4.1 million customers have experienced either zero or no more than one outage in 2022. Since it began its smart grid investments, ComEd and its more than 6,200 employees have helped customers avoid nearly 19 million outages, saving more than $3 billion in outage-related costs.

ComEd continues to provide industry-leading reliability at some of the lowest costs to customers in the nation. Based on data from the U.S. Energy Information Administration, in 2021, the average monthly bill for a ComEd residential customer was lower than the average in 49 out of 50 U.S. states. The average monthly residential bill for ComEd customers in 2022 is less than it was at the same time last year.

ComEd is a unit of Chicago-based Exelon Corporation (NASDAQ: EXC), a Fortune 200 energy company with approximately 10 million electricity and natural gas customers – the largest number of customers in the U.S. ComEd powers the lives of more than 4 million customers across northern Illinois, or 70 percent of the state’s population. For more information visit ComEd.com and connect with the company on Facebook, Twitter, Instagram and YouTube.


Contacts

ComEd Media Relations
312-394-3500

  • Third quarter revenue increased 69% year-over-year to $14.4 million
  • Record media revenue of $12.2 million, an increase of 9% quarter-over-quarter and 66% year-over-year
  • Volta’s network of installed charging stalls was 3,093 as of September 30, 2022, adding 173 charging stalls, up 6% quarter-over-quarter and up 45% year-over-year
  • Volta Media™ Network surpassed 5,700 screens and one billion monthly media impressions; new advertisers included Google, Neiman Marcus, FIJI Water, Peacock, and Capital One; repeat advertisers included Jeep, Target, Disney, Bank of America, and Coca-Cola
  • Volta reduced run-rate cash SG&A by 43%, which included a 54% reduction of U.S. full-time headcount

NEW YORK--(BUSINESS WIRE)--Volta Inc. (NYSE: VLTA, VLTA WS) (“Volta” or the “Company”), an industry-leading electric vehicle (“EV”) charging and media company, today announced financial results for its third quarter ended September 30, 2022.


Volta’s business continues to grow, demonstrating the power and value of our business model and media network,” said Vince Cubbage, Interim CEO at Volta. “While Volta’s short-term challenges have been significant, we continue to take aggressive action to reduce costs and grow revenue, while positioning the Company for long-term success. We're a powerful dual energy and media network, delivering the best charging solution for drivers, advertisers, commercial properties, and municipalities. I remain as excited as ever about the opportunity in front of us and the prospects for our business.”

Third Quarter and Recent Business Highlights

Organizational Realignment & Cost Reductions: Volta reduced run-rate cash SG&A by 43%, which included a 54% reduction of U.S. full-time headcount. The Company continued to streamline the organization and prioritize resources toward revenue-driving initiatives, including expanding its digital advertising business and accelerating its role as an EV charging partner for commercial properties and government agencies.

Federal Funds: Volta realigned a component of its sales organization to emphasize its unique offerings as an ideal public-private partner for state and federal government agencies to ensure high-value deployment of the $7.5 billion of federal funding under the Bipartisan Infrastructure Law. Results of this realignment include Volta’s work with the City of Hoboken, which demonstrates the attractiveness of Volta’s model to communities developing EV charging infrastructure to serve growing demand. Volta will continue to prioritize future EV charging station installations that qualify for government-provided funds by leveraging its PredictEV® infrastructure planning software. By analyzing multiple data sources, including local economic and equity data, PredictEV can identify locations within Volta’s signed pipeline of over 7,200 EV charging stalls, nearly 4,000 of which Volta believes satisfy the government’s requirements.

Accelerating National Digital Advertising Business: In the quarter, the Volta Media™ Network surpassed 5,700 screens and one billion monthly media impressions. This network footprint, combined with advanced digital media capabilities such as data-driven audience targeting, programmatic media buying, dynamic creative triggers, mobile retargeting, and a suite of measurement analytics, offered value to an increasingly diversified roster of clients. AdExchanger recently awarded Volta the Best Commerce Media Technology for its campaign with Coca-Cola®, demonstrating the power of the Volta Media Network to drive measurable sales for leading advertisers.

Third Quarter 2022 Financial Highlights

  • Total third quarter revenue increased 69% year-over-year to $14.4 million.
  • Record media revenue of $12.2 million, an increase of 9% quarter-over-quarter and 66% year-over-year.

Revenue by Category


Three months ended September 30,


2022


2021


Revenues

(in thousands)

Media Revenue

$

12,245


$

7,360


Network Development


1,878


1,071


Charging Network Operations


38


(1

)

Network Intelligence


196


60


Total Revenues

$

14,357


$

8,490


  • Selling, general and administrative expenses were $40.0 million, compared to $55.7 million in the prior-year period.
  • Net loss was $42.5 million, compared to a loss of $69.7 million in the prior-year period.
  • Adjusted EBITDA was $30.9 million loss, compared to $22.1 million loss in the prior-year period.
  • Cash and marketable securities were $15.6 million as of September 30, 2022.
  • Weighted-average shares outstanding for the three months ended September 30, 2022 were 168.8 million.

Total Stalls Connected, including for Network Development Customers

In the third quarter, Volta’s installed base increased by 173 stalls, bringing Volta’s installed base of total stalls connected as of September 30, 2022 to 3,093, representing a 45% year-over-year increase. A stall is attributed to a station based on the number of vehicles that can charge concurrently from that station, and there are certain configurations of Volta sites where one station is capable of charging more than one vehicle at a time. The Company now has stalls in 31 states and territories.

Webcast and Conference Call Information

Company management will host a webcast and conference call on November 14, 2022, at 5:00 p.m. Eastern Time, to discuss the Company’s financial results and business operations updates.

Interested investors and other parties can listen to a webcast of the live conference call and access the Company’s third quarter update presentation by logging onto the Investor Relations section of the Company’s website at https://investors.voltacharging.com/.

The conference call can be accessed live over the phone by dialing +1-888-999-6281 (domestic) or +1-848-280-6550 (international). A telephonic replay will be available approximately three hours after the call by dialing +1-844-512-2921, or for international callers, +1-412-317-6671. The pin number for the replay is 11152525. The replay will be available until 11:59 p.m. Eastern Time on November 28, 2022.

About Volta Inc.

Volta Inc. (NYSE: VLTA) is an industry-leading electric vehicle (“EV”) charging and media company. Volta's unique network of charging stations powers vehicles and drives business growth while accelerating a clean energy future. Volta delivers value to site hosts, brands, and consumers by installing charging stations that feature large-format digital advertising screens located steps away from the entrances of popular commercial locations. Retailers can attract and influence foot traffic, advertisers can precisely target audiences, and EV drivers can charge their vehicles seamlessly as they go about their daily routines. Volta's extensive network leverages its proprietary PredictEV® platform, which uses sophisticated behavioral science and machine learning technology to help commercial property owners, cities, and electric utilities plan EV infrastructure intelligently, efficiently, and equitably. To learn more, visit www.voltacharging.com.

Non-GAAP Financial Information

This press release contains references to EBITDA and Adjusted EBITDA of Volta, which are adjusted from results based on generally accepted accounting principles in the United States (“GAAP”) and exclude certain expenses, gains and losses. The Company defines and calculates EBITDA as net loss attributable to Volta before the impact of interest income or expense, provision for income taxes, depreciation and amortization. The Company defines and calculates Adjusted EBITDA as EBITDA adjusted to exclude stock-based compensation expense and change in fair value of warrant liabilities.

These non-GAAP financial measures are provided to enhance the user’s understanding of our prospects for the future and the historical performance for the context of the investor. The Company’s management team uses these non-GAAP financial measures in assessing performance, as well as in planning and forecasting future periods. These non-GAAP financial measures are not computed according to GAAP and the methods the Company uses to compute them may differ from the methods used by other companies. Non-GAAP financial measures are supplemental, should not be considered a substitute for financial information presented in accordance with GAAP and should be read only in conjunction with our consolidated financial statements prepared in accordance with GAAP.

Refer to the attached financial supplement for a reconciliation of these non-GAAP financial measures to their most directly comparable GAAP measures for the three and nine months ended September 30, 2022, and 2021.

Total Stalls Installed

Volta management considers “Total Stalls Installed” as the total size of its installed charging network at the end of the period, including Volta-owned and network development customer-owned charging stations operated by Volta. Volta’s management uses Total Stalls Installed for internal network planning and forecasting purposes, including evaluating the potential Media (previously Behavior and Commerce) revenue generating capacity of its charging network, which is generated through delivery of content by Volta’s advertisers across both Volta-owned and its network development customer-owned charging stalls. In addition, Total Stalls Installed provides the basis for Volta’s assessment of its charging network operations. Volta believes that this performance measure provides meaningful, supplemental information regarding the Volta charging network that helps illustrate trends in its business and operating performance. Volta believes that this performance measure is helpful to its investors as it is used by management in assessing the growth of the Volta charging network.

Forward-Looking Statements

This press release contains certain forward-looking statements within the meaning of federal securities laws, including statements regarding Volta’s future business, operations and financial performance. These forward-looking statements generally are identified by words such as “anticipate,” “believe,” “estimate,” “expect,” “future,” “intend,” “may,” “opportunity,” “plan,” “potential,” “project,” “should,” “strategy,” “will,” “would,” and similar expressions. Forward-looking statements are predictions, projections and other statements about future events that are based on current expectations and assumptions and, as a result, are subject to risks and uncertainties. Many factors could cause actual future events to differ materially from the forward-looking statements in this press release, including but not limited to the factors, risks and uncertainties included in our Annual Report on Form 10-K for the fiscal year ended December 31, 2021, as updated in our subsequent Quarterly Reports on Form 10-Q, as such factors may be updated from time to time in our other filings with the Securities and Exchange Commission (the "SEC"), accessible on the SEC’s website at www.sec.gov and the Investor Relations section of our website at www.voltacharging.com. These filings identify and address other important risks and uncertainties that could cause actual events and results to differ materially from those contained in the forward-looking statements. Forward-looking statements speak only as of the date they are made. Readers are cautioned not to put undue reliance on forward-looking statements, and, except as required by law, we assume no obligation and do not intend to update or revise these forward-looking statements, whether as a result of new information, future events, or otherwise.

Volta Inc.

Unaudited Condensed Consolidated Balance Sheets


September 30, 2022


December 31, 2021


(in thousands, except share data)

ASSETS


Current assets:


Cash and cash equivalents

$

15,646


$

262,260


Accounts receivable, net


18,515


12,587


Inventory


2,132


2,726


Prepaid partnership costs


7,965


8,982


Prepaid expenses and other current assets


12,582


12,091


Total current assets


56,840


298,646


Operating lease right-of-use assets, net


95,503


76,364


Property and equipment, net


202,160


97,728


Restricted cash


12,953


Other noncurrent assets


742


321


Intangible assets, net


1,254


643


Goodwill


221


221


Total assets

$

369,673


$

473,923


LIABILITIES


Current liabilities:


Accounts payable


36,084


18,461


Accrued expenses and other current liabilities


22,322


20,168


Current portion of operating leases


9,082


5,952


Deferred revenue


13,352


8,450


Term loan payable, net of unamortized issuance costs - current


15,998


15,998


Warrant liabilities


5,094


27,071


Total current liabilities


101,932


96,100


Term loan payable, net of unamortized issuance costs and current term loan payable


11,999


23,997


Noncurrent operating leases


81,383


64,422


Other noncurrent liabilities


8,182


7,268


Total liabilities

$

203,496


$

191,787


STOCKHOLDERS’ EQUITY


Class A and Class B common stock, $0.0001 and $0.0001 par value respectively: 400,000,000 (Class A 350,000,000, Class B 50,000,000) shares authorized as of both September 30, 2022 and December 31, 2021


17


16


Additional paid-in capital


722,867


710,638


Accumulated other comprehensive income


134


213


Accumulated deficit


(556,841

)


(428,731

)

Total stockholders’ equity


166,177


282,136


Total liabilities and stockholders’ equity

$

369,673


$

473,923


Volta Inc.

Unaudited Condensed Consolidated Statements of Operations and Comprehensive Loss


Three Months Ended September 30,


Nine Months Ended September 30,


2022


2021


2022


2021


(in thousands, except share data)

OPERATING REVENUE


Service

$

13,987


$

8,058


$

36,752


$

19,115


Product


124


372


399


670


Other


246


60


936


387


Total operating revenue


14,357


8,490


38,087


20,172


OPERATING EXPENSE


Service costs


8,665


5,347


27,871


15,087


Product costs


143


528


440


881


Selling, general and administrative


40,015


55,664


140,172


133,873


Depreciation and amortization


5,252


3,116


13,564


7,812


Other operating expense


854


203


2,532


1,067


Total operating expense


54,929


64,858


184,579


158,720


Operating Loss


(40,572

)


(56,368

)


(146,492

)


(138,548

)


OTHER EXPENSE (INCOME)


Interest expense, net


1,080


1,639


3,592


5,030


Other expense, net


188


467


Change in fair value of warrant liabilities


873


11,554


(21,978

)


11,436


Total other expense (income)


1,953


13,381


(18,386

)


16,933


LOSS BEFORE INCOME TAXES


(42,525

)


(69,749

)


(128,106

)


(155,481

)

Income tax expense


2


4


24


NET LOSS

$

(42,527

)


$

(69,749

)


$

(128,110

)


$

(155,505

)


OTHER COMPREHENSIVE LOSS


Foreign currency translation adjustment


(137

)


(79

)


TOTAL COMPREHENSIVE LOSS

$

(42,664

)


$

(69,749

)


$

(128,189

)


$

(155,505

)


Weighted-average Class A common stock outstanding, basic and diluted


168,750,399


65,923,212


163,265,514


27,998,369


Net loss per share Class A common stock, basic and diluted

$

(0.25

)


$

(0.94

)


$

(0.76

)


$

(4.20

)

Weighted-average Class B common stock outstanding, basic and diluted


8,481,143


6,077,937


8,998,756


Net loss per share Class B common stock, basic and diluted

$


$

(0.94

)


$

(0.76

)


$

(4.20

)

Volta Inc.
Non-GAAP Reconciliation

EBITDA and Adjusted EBITDA

The following table provides a reconciliation of EBITDA and Adjusted EBITDA to net loss, the most directly comparable U.S. GAAP measure reported in Volta’s unaudited condensed consolidated financial statements for the following periods:


Three Months Ended September 30,


Nine Months Ended September 30,


2022


2021


2022


2021


(in thousands)

Net loss

$

(42,527

)


$

(69,749

)


$

(128,110

)


$

(155,505

)

Income tax expense


2


4


24


Interest expense, net


1,080


1,639


3,592


5,030


Depreciation and amortization


5,252


3,116


13,564


7,812


EBITDA

$

(36,193

)


$

(64,994

)


$

(110,950

)


$

(142,639

)

Stock-based compensation


4,376


31,312


27,207


78,112


Change in fair value of warrant liabilities


873


11,554


(21,978

)


11,436


Adjusted EBITDA

$

(30,944

)


$

(22,128

)


$

(105,721

)


$

(53,091

)


Contacts

For Investor/Analyst:
Drew Lipsher, Chief Development Officer
This email address is being protected from spambots. You need JavaScript enabled to view it.

For Media/Press:
Jette Speights, SVP of Communications
This email address is being protected from spambots. You need JavaScript enabled to view it.

STAMFORD, Conn.--(BUSINESS WIRE)--Altus Power, Inc. (“Altus Power” or the “Company”) (NYSE: AMPS), the premier independent developer, owner and operator of commercial-scale solar facilities, today announced that it has closed on the acquisition of approximately 88 megawatts (MW) of operating solar assets. These assets were purchased from D. E. Shaw Renewable Investments (DESRI), under definitive agreements that were previously announced on September 27, 2022.

Gregg Felton, Co-CEO of Altus Power, said “We were pleased to be able to partner with DESRI’s talented team to execute this transaction. With closing now complete, we’re excited to incorporate these new long-term assets and customer relationships into our portfolio.”

“We were impressed by the Altus Power team’s ability to transact with efficiency, notwithstanding the complexity of a portfolio spanning several states with multiple stakeholders,” commented Bryan Martin, Executive Chairman of DESRI. “We expect that Altus Power will continue to operate these projects with the same thought and care that DESRI has.”

These commercial and industrial scale assets include rooftop, ground and carport-mounted solar arrays which deliver clean electricity under long-term contracts to predominantly investment-grade customers. Altus Power owns, operates and services customers across its portfolio of 469 MW of long-term contracted solar assets with the potential to offer additional electrification solutions, including battery storage, as well as electric vehicle or fleet charging stations.

About Altus Power, Inc.

Altus Power, based in Stamford, Connecticut, is the premier commercial-scale clean electrification company serving commercial, industrial, public sector and community solar customers with an end-to-end solution. Altus Power originates, develops, owns and operates locally-sited solar generation, energy storage and charging infrastructure across the nation. Visit www.altuspower.com to learn more.

About D.E. Shaw Renewable Investments

D. E. Shaw Renewable Investments (DESRI) and its affiliates develop, acquire, own, and operate long-term contracted renewable energy assets in the U.S. DESRI's portfolio of contracted, operating, and in-construction renewable energy projects currently includes more than 65 solar and wind projects representing more than 6 gigawatts of aggregate capacity. DESRI is a member of the D. E. Shaw group, a global investment and technology development firm with more than $60 billion in investment and committed capital as of September 1, 2022, and offices in North America, Europe, and Asia. For more information, visit www.desri.com.

Forward-Looking Statements

This press release contains forward-looking statements. Forward-looking statements may be identified by the use of words such as "aims," "believes," "expects," "intends," "aims", "may," “could,” "will," "should," "plans," “projects,” “forecasts,” “seeks,” “anticipates,” “goal,” “objective,” “target,” “estimate,” “future,” “outlook,” "strategy," “vision,” or variations of such words or similar terminology that predict or indicate future events or trends or that are not statements of historical matters. These statements, which involve risks and uncertainties, relate to analyses and other information that are based on forecasts of future results and estimates of amounts not yet determinable and may also relate to Altus Power’s future prospects, developments and business strategies. These statements are based on Altus Power’s management’s current expectations and beliefs, as well as a number of assumptions concerning future events.

Such forward-looking statements are subject to known and unknown risks, uncertainties, assumptions and other important factors, many of which are outside Altus Power’s control, that could cause actual results to differ materially from the results discussed in the forward-looking statements. These risks, uncertainties, assumptions and other important factors include, but are not limited to: (1) the risk that pending acquisitions may not close in the anticipated timeframe or at all due to a closing condition not being met; (2) failure to obtain required consents or regulatory approvals in a timely manner or otherwise; (3) the ability of Altus Power to successfully integrate the acquisition of solar assets into its business and generate profit from their operations; (4) the ability of Altus Power to retain customers and maintain and expand relationships with business partners, suppliers and customers; (5) the risk of litigation and/or regulatory actions related to the proposed acquisition of solar assets; (6) the possibility that Altus Power may be adversely affected by other economic, business, regulatory and/or competitive factors; and (7) the impact of COVID-19, inflationary pressures, and supply chain issues on Altus Power's business.

Additional factors that could cause actual results to differ materially from those expressed or implied in forward-looking statements can be found under the heading “Risk Factors” in Altus Power’s Form 10-K filed with the Securities and Exchange Commission on March 24th, 2022, as well as the other information we file with the Securities and Exchange Commission. New risks and uncertainties arise from time to time, and it is impossible for us to predict these events or how they may affect us. You are cautioned not to place undue reliance upon any forward-looking statements, which speak only as of the date made and the information and assumptions underlying such statement as we know it and on the date such statement was made, and Altus Power undertakes no obligation to update or revise the forward-looking statements, whether as a result of new information, changes in expectations, future events or otherwise.

This press release is not intended to be all-inclusive or to contain all the information that a person may desire in considering an investment in Altus Power and is not intended to form the basis of an investment decision in Altus Power. All subsequent written and oral forward-looking statements concerning Altus Power or other matters and attributable to Altus Power or any person acting on its behalf are expressly qualified in their entirety by the cautionary statements above.


Contacts

Altus Power Contacts:

Chris Shelton
Head of IR
This email address is being protected from spambots. You need JavaScript enabled to view it.

  • Third quarter 2022 revenue of $1.7 million, driven by revenue from the energy storage projects with Jupiter Power in Texas and California.
  • Revenue for the first nine months ending September 30, 2022, totaled $45.6 million, driven mainly by gravity energy storage licensing revenue with Atlas Renewable.
  • Third quarter GAAP loss from operations of $(36.2) million, and GAAP net loss of $(28.8) million.
  • Third quarter 2022 adjusted EBITDA totaled $(17.2) million; for the first nine months of 2022 ending September 30, 2022, adjusted EBITDA was approximately breakeven totaling $(0.2) million.
  • Total cash on the balance sheet of $274.7 million as of September 30, 2022, vs $299.1 million as of June 30, 2022.
  • Operating Highlights:
    • Signed and booked orders for 495 megawatt hours (MWh), converting prior project awards, for approximately $210 million.
    • New projects awards of approximately 2 gigawatt hours (GWh) of energy storage systems, including our first 48-hour long-duration hybrid system utilizing green hydrogen. This approximately 300 MWh project, awarded by a leading western public utility, is expected to be one of the largest green hydrogen energy storage projects globally.
    • Total signed contracts and project awards are now approximately 4.8 GWh, representing approximately $2 billion of potential revenue.
    • Gravity systems: Construction progressed as planned in China, completing foundation activities, and moving to fixed frame structural erection and power electronic staging; test piling activity commenced in Snyder, Texas for Enel Green Power.
    • Battery systems: Engineering, procurement and construction commenced for Jupiter’s Texas and California projects, and Wellhead’s Stanton, California project. These battery projects are expected to be operational between the second and third quarter of 2023.
    • Global infrastructure and commercial build-out progressed with legal entity establishment underway in Australia and China to complement our United States and European presence.
    • Total headcount grew 18% from the second quarter of 2022 to the third quarter of 2022, bringing YTD 2022 headcount growth to 104% versus end of year 2021.
  • Appointed Jan Kees van Gaalen as Chief Financial Officer replacing interim Chief Financial Officer, David Hitchcock, who will remain as an advisor to Energy Vault through December 31, 2022.
  • Re-affirming prior guidance: 2022 revenue of $75 million to $100 million and adjusted EBITDA of $(10) million to $3 million, driven by Gravity Energy Storage System territory expansions and execution on initial project construction starts in California and Texas with Jupiter Power and Wellhead. Expect to end 2022 with total cash balance of $260 million to $280 million.
  • Re-affirming 2-year aggregate revenue guidance of approximately $680 million for combined full year 2022 and full year 2023.

LUGANO, Switzerland & WESTLAKE VILLAGE, Calif.--(BUSINESS WIRE)--Energy Vault Holdings, Inc. (NYSE: NRGV) (“Energy Vault” or “the Company”), a leader in sustainable, grid-scale energy storage solutions, announced financial results for the third quarter ended September 30, 2022.


Robert Piconi, Chairman and CEO of Energy Vault, stated, “We made strong progress during the quarter across all commercial, operational and financial facets of our business. Customers are choosing Energy Vault given the innovative portfolio of solutions that address their needs across short and long duration storage, as well as addressing their complex requirements to optimize energy density, economics, and overall performance. During the quarter, we announced contract signings totaling 495 megawatt hours for our battery energy storage solutions for immediate delivery in 2023 with top tier customers. This highlights the readiness of our solutions and software capabilities, and more importantly, the trust that our customers have in us to deliver projects on-time and on-budget.

Additionally, we have received awards for approximately 2 gigawatt hours of energy storage solutions to address our customer’s immediate needs. This includes a 500 MWh short-duration battery storage project with Meadow Creek in Australia as previously announced, an 820 MWh short-duration battery storage project in Europe and our previously announced 440 MWh award with a large western utility. These projects mark our first entrance into the European market and our first shorter duration project to complement our long duration gravity projects in Australia, regions that we have seen increased demand for energy storage driven by supportive policy and macro events. I am also pleased to announce one of the first and largest utility-scale green hydrogen storage projects, for approximately 300 MWh of storage capacity with another large western utility. The introduction of green hydrogen into our technology portfolio further validates our technical differentiation with our energy management software platform and the market for hybrid short and long duration integrated systems.”

Mr. Piconi continued, “Looking ahead to the balance of 2022 and 2023, we will continue to scale our talent base and global infrastructure to enable commercial and operational execution for our customers. We will leverage, in a disciplined manner, our position as the only energy storage company offering a hardware agnostic portfolio of both short and long duration storage solutions, bringing innovative gravity, green hydrogen and hybrid solutions to the market for the first time.”

Third Quarter 2022 and Recent Business Highlights:

Realized significant commercial momentum on our utility-scale battery energy storage projects:

  • Signed contract with Wellhead Electric and W Power for 275 MWh energy storage project in Southern California.
    • Energy Vault has signed a contract to deploy a 68.8 megawatt (275 MWh) battery energy storage system (BESS) at Wellhead’s Energy Reliability Center in Stanton, California to provide enhanced resources and improved grid reliability in the Southern California Edison territory. The Stanton ESS will be one of the largest energy storage systems in southern California and will be based on Energy Vault Solutions’ (EVS) proprietary system design and EVS’s Energy Management Software for optimal economic dispatching. This contract reflects successful validation of EVS’s technology-agnostic strategy, to provide customers with the most flexible and cost-effective energy storage solutions. The project is expected to be completed in the second half of 2023.
  • Signed contract with Jupiter Power for 220 MWh energy storage project in Texas and California.
    • Energy Vault and Jupiter Power will deploy a BESS in Texas to provide energy and ancillary services to the ERCOT energy-only market and a battery energy storage system in California to provide similar services through participation in the CAISO Resource Adequacy program. The storage systems will be based on EVS’s proprietary integration system design and EVS’ Energy Management Software for optimal economic dispatching. The project is expected to be completed in the second half of 2023.
  • Awarded a 250 MW/500 MWh grid-connected battery storage agreement in Victoria, Australia.
    • Meadow Creek Solar pty Ltd., a developer of the Meadow Creek Solar Farm has awarded Energy Vault a 250 MW/500 MWh BESS project to support its 330 MW solar project. Under the notice of award, Energy Vault will begin the advanced grid studies and modeling with technical advisor DNV, as required by the Australian Energy Market Operator (AEMO) for interconnected power systems in Australia's eastern and south-eastern seaboard, which will be located 2 hours north of Melbourne, Australia. The battery storage system, being co-located with the solar PV, will provide the flexibility of charge and discharge, essential to shoring up renewable energy supply across the network as Australia adopts the Australian Energy Market Operator's Integrated System Plan. The project is expected to be completed in 2024.
  • Awarded a 410 MW/820 MWh project in Europe with a large renewable energy developer.
    • Energy Vault announced it was awarded an 820 MWh battery energy storage system project with a large renewable energy developer with expected completion in 2024.
  • Awarded an approximately 300 MWh, utility-scale battery plus green hydrogen storage project with an additional large western public utility for long duration storage, marking our first hydrogen deployment.
    • The hybrid battery plus hydrogen storage project will provide 300 MWh of carbon-free energy over 48 hours. The hybrid architecture will allow for grid forming and black start capabilities. Energy Vault’s Energy Management System will provide full system control and optimal dispatching among the batteries, hydrogen tanks and fuel-cells.
  • Previously announced award for a 220 MW/440 MWh energy storage project with a large western utility is in the final stages of contract execution.
    • The project is expected to reach commercial operation by the end of 2023.

Large scale gravity-energy storage projects utilizing our EVx system continues multi-continent progress:

  • Received a limited notice to proceed with the Enel Green Power project which has resulted in groundbreaking on location in Snyder, Texas for an 18 MW / 36 MWh gravity energy storage system. This project will be the first gravity storage deployment in the western hemisphere.
  • First 100 MWh project in China progressing in line with plan
    • Energy Vault will continue to support the 100 MWh project in the fourth quarter of 2022 and into next year. We expect the project to achieve commercial deployment in the first half of 2023.
  • 2 GWh Mandate announced for Energy Vault’s EVx™ Gravity Energy Storage Platform for Initial Zero Carbon Industrial Parks in China
    • In partnership with Atlas Renewable, EIPC (a policy oriented supporting organization of the Investment Association of China), in conjunction with China Tianying and selected provincial and local governments, will develop five national zero carbon industrial parks. The parks will utilize Energy Vault’s gravity energy storage technology and its Energy Management Software platform to support China’s mandated climate change and environmental policy. The first announced site has been confirmed for a 2 GWh system located in Inner Mongolia.

Other recent updates:

  • Energy Vault announced key executive appointments.
    • Jan Kees van Gaalen will be appointed as Chief Financial Officer effective November 16, 2022, and is replacing interim Chief Financial Officer David Hitchcock, who will remain as an advisor to Energy Vault through December 31, 2022.
    • E.B. Jensen has joined as Senior Vice President, Project Execution and Delivery. Jensen will lead the teams responsible for energy storage deployment across the global landscape.
    • Dr. Craig Horne has joined as Vice President of Advanced Energy Storage Development, responsible for the expansion of Energy Vault’s portfolio of storage solutions.

Outlook:

  • Energy Vault reiterates its expectation for full year 2022 revenue in the range of $75 million to $100 million and adjusted EBITDA range of $(10.0) million to $3.0 million.
  • Energy Vault maintains its two-year aggregate revenue guidance of approximately $680 million for full year 2022 and full year 2023.
  • Expect to end 2022 with total cash balance in the range of $260 million to $280 million.

Conference Call Information

Energy Vault will host a conference call today at 4:30 PM ET to discuss the results, followed by a Q&A session. A live webcast of the call can be accessed https://www.energyvault.com/. To access the call, participants may dial 1-877-704-4453, international callers may use 1-201-389-0920, and request to join the Energy Vault earnings call.

A telephonic replay will be available shortly after the conclusion of the call and until, November 28, 2022. Participants may access the replay at 1-844-512-2921, international callers may use 1-412-317-6671, and enter access code 13733498. The call will also be available for replay via webcast link on the Investors portion of the Energy Vault website at https://www.energyvault.com/.

About Energy Vault

Energy Vault develops and deploys turnkey sustainable energy storage solutions designed to transform the world’s approach to utility-scale energy storage in realizing decarbonization while maintaining grid resiliency. The company’s proprietary energy management system and optimization software suite is technology agnostic in its ability to orchestrate various generation and energy storage resources to help utilities, independent power producers and large industrial energy users to significantly reduce their levelized cost of energy while maintaining power quality and grid reliability. Energy Vault’s EVx™ gravity energy storage system utilizes eco-friendly materials with the ability to integrate waste materials for beneficial re-use. Energy Vault is facilitating the shift to a circular economy while accelerating the clean energy transition for its customers. For additional information, please visit: www.energyvault.com

Non- GAAP measures

Energy Vault has provided a reconciliation of Adjusted EBITDA to net loss, the most directly comparable GAAP measures, for the historical period in the appendix hereto. A reconcilation of projected non-GAAP measures for the full-year 2022 has not been provided because certain information necessary to calculate such measures on a GAAP basis is unavailable or dependent on the timing of future events outside of our control. Therefore, because of the uncertainty and variability of the nature of the amount of future adjustments, which could be significant, the Company is unable to provide a reconciliation for these forward-looking non-GAAP measures without unreasonable effort.

Forward-Looking Statements

This press release includes forward-looking statements that reflect the Company’s current views with respect to, among other things, the Company’s operations and financial performance. Forward-looking statements include information concerning possible or assumed future results of operations, including descriptions of our business plan and strategies. These statements often include words such as “ anticipate,” “expect,” “suggest,” “plan,” “believe,” “intend,” “project,” “forecast,” “estimates,” “targets,” “projections,” “should,” “could,” “would,” “may,” “might,” “will” and other similar expressions. We base these forward-looking statements or projections on our current expectations, plans and assumptions, which we have made in light of our experience in our industry, as well as our perceptions of historical trends, current conditions, expected future developments and other factors we believe are appropriate under the circumstances at the time. These forward-looking statements are based on our beliefs, assumptions and expectations of future performance, taking into account the information currently available to us. These forward-looking statements are only predictions based upon our current expectations and projections about future events. These forward-looking statements involve significant risks and uncertainties that could cause our actual results, level of activity, performance or achievements to differ materially from the results, level of activity, performance or achievements expressed or implied by the forward-looking statements, including changes in our strategy, expansion plans, customer opportunities, future operations, future financial position, estimated revenues and losses, projected costs, prospects and plans; the implementation, market acceptance and success of our business model and growth strategy; our ability to develop and maintain our brand and reputation; developments and projections relating to our business, our competitors, and industry; the impact of health epidemics, including the COVID-19 pandemic, on our business and the actions we may take in response thereto; our expectations regarding our ability to obtain and maintain intellectual property protection and not infringe on the rights of others; expectations regarding the time during which we will be an emerging growth company under the JOBS Act; our future capital requirements and sources and uses of cash; our ability to obtain funding for our operations and future growth; our business, expansion plans and opportunities and other important factors discussed under the caption “Risk Factors” in our Quarterly Report on Form 10-Q for the quarter ended June 30, 2022 and in our Quarterly Report on Form 10-Q for the quarter ended September 30, 2022 to be filed with the SEC, as such factors may be updated from time to time in its other filings with the SEC, accessible on the SEC’s website at www.sec.gov. New risks emerge from time to time and it is not possible for our management to predict all risks, nor can we assess the impact of all factors on our business or the extent to which any factor, or combination of factors, may cause actual results to differ materially from those contained in any forward-looking statements we may make. Any forward-looking statement made by us in this press release speaks only as of the date of this press release and is expressly qualified in its entirety by the cautionary statements included in this press release. We undertake no obligation to publicly update or review any forward-looking statement, whether as a result of new information, future developments or otherwise, except as may be required by any applicable laws. You should not place undue reliance on our forward-looking statements.


ENERGY VAULT HOLDINGS, INC.

Condensed Consolidated Balance Sheets
(Unaudited)
(In thousands except par value)


September 30,
2022


December 31,
2021

Assets

Current Assets

Cash and cash equivalents

$

249,649


$

105,125


Restricted cash


25,086


Accounts receivable


22,824


Contract assets


24,714


Prepaid expenses and other current assets


9,421


5,538


Total current assets


331,694


110,663


Property and equipment, net


1,577


11,868


Right-of-Use assets, net


1,378


1,238


Other assets


3,900


1,525


Total Assets

$

338,549


$

125,294


Liabilities, Convertible Preferred Stock, and Stockholders’ Equity (Deficit)


Current Liabilities


Accounts payable

$

2,801


$

1,979


Accrued expenses


3,669


4,704


Contract liabilities, current portion


27,517


Long-term finance leases, current portion


37


48


Long-term operating leases, current portion


676


612


Total current liabilities


34,700


7,343


Deferred pension obligation


166


734


Asset retirement obligation


819


978


Contract liabilities, long-term portion


1,500


1,500


Long-term finance leases


23


34


Long-term operating leases


760


662


Warrant liability


271


Total liabilities


38,239


11,251


Commitments and contingencies


Convertible preferred stock, $0.0001 par value; 85,741 shares authorized, 85,741 shares issued and outstanding at December 31, 2021; liquidation preference of $171,348


182,709


Stockholders’ Equity (Deficit)


Preferred stock, $0.0001 par value; 5,000 shares authorized, none issued


Common stock, $0.0001 par value; 500,000 shares authorized, 137,839 shares issued, and 137,839 outstanding at September 30, 2022; 120,568 shares authorized, 20,432 shares issued, and 20,432 outstanding at December 31, 2021


14


Additional paid-in capital


424,499


713


Accumulated deficit


(123,988

)


(68,966

)

Accumulated other comprehensive loss


(215

)


(413

)

Total stockholders’ equity (deficit)


300,310


(68,666

)

Total Liabilities, Convertible Preferred Stock, and Stockholders’ Equity (Deficit)

$

338,549


$

125,294


ENERGY VAULT HOLDINGS, INC.

Condensed Consolidated Statements of Operations and Comprehensive Loss
(Unaudited)
(In thousands except per share data)


Three Months Ended September 30,


Nine Months Ended September 30,


2022


2021


2022


2021


Revenue

$

1,694


$


$

45,555


$


Operating expenses:


Cost of revenue


1,623


2,194


Sales and marketing


3,758


169


8,287


443


Research and development


16,731


1,697


36,155


4,920


General and administrative


12,960


3,759


33,434


8,620


Asset impairment


2,828


(11

)


2,828


2,733


Loss from operations


(36,206

)


(5,614

)


(37,343

)


(16,716

)

Other income (expense)


Interest expense


(1

)


(7

)

Change in fair value of warrant liability


6,706


2,061


Transaction costs


(20,586

)


Other income (expense), net


920


(549

)


1,205


(1,866

)

Loss before income taxes


(28,580

)


(6,163

)


(54,664

)


(18,589

)

Provision for income taxes


185


358


Net loss

$

(28,765

)


$

(6,163

)


$

(55,022

)


$

(18,589

)


Net loss per share — basic and diluted

$

(0.21

)


$

(0.45

)


$

(0.46

)


$

(1.54

)

Weighted average shares outstanding — basic and diluted


140,302


13,598


118,560


12,094


Other comprehensive income (loss) — net of tax


Actuarial gain (loss) on pension

$

1


$

63


$

561


$

295


Foreign currency translation gain (loss)


(8

)


(596

)


(363

)


303


Total other comprehensive income (loss)


(7

)


(533

)


198


598


Total comprehensive loss

$

(28,772

)


$

(6,696

)


$

(54,824

)


$

(17,991

)


ENERGY VAULT HOLDINGS, INC.

Condensed Consolidated Statements of Cash Flows
(Unaudited)
(In thousands)


Nine Months Ended September 30,


2022


2021


Cash Flows From Operating Activities

Net loss

$

(55,022

)


$

(18,589

)

Adjustments to reconcile net loss to net cash used in operating activities:


Depreciation and amortization


7,562


976


Non-cash lease expense


548


319


Non-cash interest income


(217

)


Stock based compensation


26,757


452


Asset Impairment


2,828


3,236


Change in fair value of warrant liability


(2,061

)


Change in pension obligation


21


53


Asset retirement obligation accretion expense


(93

)


Foreign exchange gains and losses


163


100


Change in operating assets


(55,247

)


664


Change in operating liabilities


26,966


(1,286

)

Net cash used in operating activities


(47,795

)


(14,075

)

Cash Flows From Investing Activities


Purchase of property and equipment


(679

)


(76

)

Purchase of convertible notes


(2,000

)


Net cash used in investing activities


(2,679

)


(76

)

Cash Flows From Financing Activities


Proceeds from exercise of stock options


131


Proceeds from reverse recapitalization and PIPE financing, net


235,940


Proceeds from exercise of warrants


7,855


Payment of transaction costs related to reverse recapitalization


(20,651

)


(469

)

Payment of taxes related to net settlement of equity awards


(3,017

)


Repayment of debt


(765

)

Proceeds from promissory note


125


Payment of finance lease obligations


(51

)


(43

)

Proceeds from Series B-1 preferred Stock, net of issuance costs


15,295


Proceeds from Series C preferred Stock, net of issuance costs


105,520


Proceeds from issue of shares, net of issuance costs


5


Net cash provided by financing activities


220,207


119,668


Effect of exchange rate changes on cash, cash equivalents, and restricted cash


(123

)


723


Net increase in cash, cash equivalents, and restricted cash


169,610


106,240


Cash, cash equivalents, and restricted cash  –  beginning of the period


105,125


10,051


Cash, cash equivalents, and restricted cash –  end of the period


274,735


116,291


Less: Restricted cash at end of period


25,086


Cash and cash equivalents - end of period

$

249,649


$

116,291


Contacts

Investors:
This email address is being protected from spambots. You need JavaScript enabled to view it.

Media:
This email address is being protected from spambots. You need JavaScript enabled to view it.


Read full story here

HAMILTON, Bermuda--(BUSINESS WIRE)--Valaris Limited (NYSE: VAL) ("Valaris" or the "Company") today announced that President and Chief Executive Officer Anton Dibowitz will present at the BofA Securities Global Energy Conference on Wednesday, November 16, 2022, beginning at 8:45 am ET.


Investor materials to be used during the conference will be available on Valaris’ website at www.valaris.com the morning of the event. A live webcast will be available at the time of the presentation in the "Investors – Events & Presentations" section of the Company’s website www.valaris.com. A replay of the presentation will be available for 90 days following the completion of the conference.

About Valaris Limited

Valaris Limited (NYSE: VAL) is the industry leader in offshore drilling services across all water depths and geographies. Operating a high-quality rig fleet of ultra-deepwater drillships, versatile semisubmersibles and modern shallow-water jackups, Valaris has experience operating in nearly every major offshore basin. Valaris maintains an unwavering commitment to safety, operational excellence, and customer satisfaction, with a focus on technology and innovation. Valaris Limited is a Bermuda exempted company (Bermuda No. 56245). To learn more, visit our website at www.valaris.com.


Contacts

Investor & Media Contacts:
Darin Gibbins
Vice President - Investor Relations and Treasurer
+1-713-979-4623

Tim Richardson
Director - Investor Relations
+1-713-979-4619

HOUSTON--(BUSINESS WIRE)--SilverBow Resources, Inc. (NYSE: SBOW) (“SilverBow” or “the Company”) announced today it has been awarded a Top Workplaces 2022 honor by the Houston Chronicle. The list is based solely on employee feedback gathered through a third-party survey administered by employee engagement technology partner Energage LLC. The confidential survey uniquely measures 15 culture drivers that are critical to the success of any organization: including alignment, execution, and connection, just to name a few.


Sean Woolverton, SilverBow’s Chief Executive Officer, commented, “We are honored to have received this recognition for the third consecutive year. Marking our debut in the Houston Chronicle’s Top Workplaces list in 2020 was a historic milestone for the Company, and maintaining that Top Workplace status for 2021 and 2022 is a remarkable accomplishment and a reflection of SilverBow’s culture and focus on its employees which continue to be our number one asset.”

“Earning a Top Workplaces award is a badge of honor for companies, especially because it comes authentically from their employees,” said Eric Rubino, Energage CEO. “That's something to be proud of. In today's market, leaders must ensure they’re allowing employees to have a voice and be heard. That's paramount. Top Workplaces do this, and it pays dividends.”

ABOUT SILVERBOW RESOURCES, INC.

SilverBow Resources, Inc. (NYSE: SBOW) is a Houston-based energy company actively engaged in the exploration, development, and production of oil and gas in the Eagle Ford Shale and Austin Chalk in South Texas. With over 30 years of history operating in South Texas, the Company possesses a significant understanding of regional reservoirs which it leverages to assemble high quality drilling inventory while continuously enhancing its operations to maximize returns on capital invested. For more information, please visit www.sbow.com. Information on the Company’s website is not part of this release.


Contacts

Jeff Magids
Director of Finance & Investor Relations
(281) 874-2700, (888) 991-SBOW

Two high-performing Caterpillar dealers will join forces to create stronger service and support to their customers in the Southwest

HENDERSON, Nev.--(BUSINESS WIRE)--Cashman Equipment Company, founded by James Cashman Sr. during the construction of Hoover Dam in 1931, is announcing that our Company will be acquired by our neighboring Cat Dealer to the South, Empire Southwest, of Arizona at the end of December 2022. During our long tenure of ninety-one years, our team has grown to over 1100 highly talented and dedicated employees, partnering with our customers to find the best solutions for their business needs.


The Company expanded from Southern Nevada to include most of Northern Nevada and portions of several California border counties in the early 60s. Cashman has been led over these nine decades by James Cashman Sr., James Cashman Jr., James Cashman III and most recently, during the last twenty-seven years, by MaryKaye Cashman. The Company is one of the most successful and highly respected Cat Dealerships in North America today, supplying machinery, service, parts, power generation, pumps and rental options, across the full Cat product line.

We are pleased and confident knowing that our customers will continue to receive superior support for all their construction, mining, landscaping and industrial needs from Empire Southwest, as we know they share our values and commitment to providing the Best Customer Experience. Empire Southwest is also a third generation, family owned business, and was founded in 1950.

Going forward, we are confident that the combination of these two great companies will provide new synergies, great customer satisfaction and very importantly, even more options and enhanced capabilities.

About Cashman Equipment

Founded in 1931 by James "Big Jim" Cashman, Cashman Equipment is one of the highest-rated Cat equipment dealers in North America. A full-service dealership, Cashman provides new and used equipment for sale and rental, as well as high-quality parts and service to construction, paving, mining, truck engine, technology, and power system industries throughout Nevada and the Eastern Sierras. For more information, visit cashmanequipment.com.

About Empire Southwest

Empire Southwest is an authorized Cat® dealer for heavy equipment and power systems throughout Arizona and Southeastern California. In addition, Empire is a provider of Tier 1 commercial solar products and microgrids, an authorized AGCO equipment dealer representing Fendt and Massey Ferguson, an authorized Trimble dealer through SITECH Southwest, and a premiere distributor of Maintainer, Trail King and other leading truck and trailer brands. The third-generation, family-owned company was founded in 1950 and has over 2,300 employees across 22 locations. Learn more about Empire's products, services, partnerships, and careers at empirecat.com.


Contacts

Darin Perry
This email address is being protected from spambots. You need JavaScript enabled to view it.

ANAHEIM, Calif.--(BUSINESS WIRE)--Phoenix Motor Inc. (Nasdaq: PEV) (“Company” or “Phoenix”), a leader in manufacturing of all-electric, medium-duty vehicles, today announced its financial results for the third quarter ended September 30, 2022.


Financial Highlights Third Quarter

  • Revenue totaled $409,000 for the third quarter, a decrease of approximately 26% compared to the prior-year period of $554,000 principally due to software-related issues and battery supply constraints that resulted in a delay in delivery of electric vehicles (“EVs”) from the third quarter into the fourth quarter of 2022 and the first quarter of 2023.
  • Gross profit increased to $121,000 in the third quarter of 2022, compared to a loss of $49,000 in the third quarter of 2021, primarily driven by a shift in the product mix to higher gross margin products, particularly lithium ion powered electric forklifts.
  • Net losses increased to $3.9 million in the third quarter of 2022, compared to a loss of $2.2 million in the prior-year period.
  • Total assets were $20.5 million as of September 30, 2022.
  • Cash and cash equivalents were $1.3 million as of September 30, 2022.

Financial Highlights Nine Months Ending September 30

  • Revenues for the nine months ended September 30, 2022 were $2.6 million, an increase of 53.5% compared to the prior-year period, primarily driven by the increase in sales of electric forklifts.
  • Gross profit increased to $566,000 for the most recent nine-month period, compared to a loss of $156,000 for the prior-year period, due to a shift in product mix, particularly attributable to the 20.1% gross margin of electric forklifts products.
  • Net losses increased to $8.1 million during the nine-month period ending September 30, 2022, compared to $6.4 million in the prior-year period.

Recent Highlights

  • Phoenix just received a nomination letter from CATL (Contemporary Amperex Technology Co., Limited), the world’s largest EV battery manufacturer, forming a strategic partnership and outlining the terms for the procurement of K-Pack batteries and related products for Phoenix Motorcars’ product lines.
  • In October, the Company and Pegasus Specialty Vehicles announced the formation of a strategic partnership to jointly develop Class A electric school buses, targeted for the North American market.
  • Also in October, the Company engaged IAT to advance engineering and design work for Phoenix’s Gen 4 EVs, to maximize cost efficiencies, speed time to market and ensure the highest quality standards.

“We are excited to have received the Board’s approval for our Gen 4 Development Program,” Phoenix Motorcars CEO, Dr. Lance Zhou commented. “We are well underway in the design, development and engineering processes and have already built a strong order book for our Gen 4 vehicles.”

“We expect our Gen 4 development to be a game changer for Phoenix. The project will demonstrate our “asset light” business model, which will allow for lower costs and shorter time to market than before. We will have standardized design and production processes, which combined with the proven project management experience of our executive leadership team, will enable us to ramp production quickly. We look forward to providing regular updates regarding our strategic plans, important milestones and our progress in the coming quarters for both our Gen 4 and our Gen 5 ground-up chassis vehicles.”

Gen 4 is the “Bridge” to Gen 5

In 2023, Phoenix will introduce its fourth generation “Gen 4” vehicles to the medium-duty EV market. The development of Gen 4 will provide a natural a bridge between our current Gen 3 vehicles and the introduction of our Gen 5 ground-up chassis design. The Gen 4 development will provide several advantages versus our current Gen 3 models, specifically:

  • Asset Light Business Model: Gen 4 will mark the deployment of the Company’s “asset light” business model both upstream and downstream. Upstream, Phoenix will leverage its strategic partnerships with R&D partners and engineering suppliers such as IAT, Aulton and Fangsheng. Downstream, Phoenix is partnering with customers and third parties to develop manufacturing and assembly facilities.
  • Scale: The Company anticipates efficient scaling of its production, utilizing customer and third-party assembly facilities. Phoenix is reconfiguring its current Anaheim manufacturing facility to increase production capacity and to utilize it as a showcase facility and training center to ensure its processes and procedures are standardized across all partner-operated locations.
  • Reduced Costs: Gen 4 is expected to achieve lower production and materials costs compared to Gen 3 vehicles, benefiting from standardization of processes and procedures, as well as components and sub-assemblies—a benefit which will carry over to Gen 5 production as well.
  • Battery Supply: The Company expects it will benefit from its recent partnership with CATL for long-term strategic supply of K-Packs and related products for our Gen 4 electric vehicles.

Gen 5 Will Offer Chassis Independence Beginning in 2024

Design, development and production planning for Phoenix’s Gen 5 vehicles will leverage on Phoenix’s experience and benefit from the development of its Gen 4 line of vehicles. Unique highlights of Gen 5 are expected to include:

  • Ground-up Chassis Design: The Company will be producing its own ‘ground-up’ chassis in 2024.
  • Chassis Independence: The development of Gen 5 will provide Phoenix with chassis independence, overcoming one of the major impediments facing businesses such as ours.
  • Lower Cost: Phoenix should be able to produce its chassis for far less than the cost it is currently paying to acquire each chassis.
  • Increased Design Flexibility and Customer Satisfaction: Phoenix’s ground up chassis will enable it to customize vehicle designs to meet specialized needs, while maintaining standardized processes and procedures, increasing the Company’s capacity to accommodate customer requirements and meet the evolving needs of the transforming electric vehicle market.

EdisonFuture: The Platform for Growth in 2025 and Beyond

Phoenix continues to make progress in the design and development of its EdisonFuture line of light-duty electric vehicles. This product line is anticipated to provide the market with both consumer and commercial pick-up trucks, SUVs and delivery vans. The development of EdisonFuture will, much like Gen 5, benefit greatly from the development of prior generations, which will further lower costs and speed time-to-market.

Conference Call Information

Phoenix Motor will host a conference call today at 5:00 PM ET to discuss the results. Interested investors and other parties may access a live webcast of the conference call which will be available on the Events and Presentations page on the Investor Relations section of Phoenix’s website at https://ir.phoenixmotorcars.com/events-and-presentations/default.aspx. The call can also be accessed live via telephone by dialing (888) 660-6373 or for international callers (929) 203-1975 and referencing Phoenix Motorcars.

An archive of the webcast will be available after the call on the Events and Presentations page on the Investor Relations section of Phoenix’s website, along with Phoenix’s earnings press release.

About Phoenix Motor Inc.

Phoenix Motor Inc., a pioneer in the electric vehicle (“EV”) industry, designs, builds, and integrates electric drive systems and light and medium duty EVs and sells electric forklifts and electric vehicle chargers for the commercial and residential markets. Phoenix operates two primary brands, “Phoenix Motorcars”, which is focused on commercial products including medium duty EVs (shuttle buses, school buses, municipal transit vehicles and delivery trucks, among others), electric vehicle chargers and electric forklifts, and “EdisonFuture”, which intends to offer light-duty EVs. Phoenix endeavors to be a leading designer, developer and manufacturer of electric vehicles and electric vehicle technologies. For more information, please visit: www.phoenixmotorcars.com and www.edisonfuture.com.

Forward-Looking Statement

This press release contains forward-looking statements as defined by the Private Securities Litigation Reform Act of 1995. Forward-looking statements include statements concerning plans, objectives, goals, strategies, future events or performance, and underlying assumptions and other statements that are other than statements of historical facts. When the Company uses words such as “may,” “will,” “intend,” “should,” “believe,” “expect,” “anticipate,” “project,” “estimate” or similar expressions that do not relate solely to historical matters, it is making forward-looking statements. No assurance can be given that the net proceeds of the Offering will be used as indicated. Forward-looking statements are no guarantee of future performance and involve risks and uncertainties that may cause the actual results to differ materially from the Company’s expectations discussed in the forward-looking statements. These statements are subject to uncertainties and risks including, but not limited to, the following: the Company’s ability to convert concept trucks and vans into production and sales; the Company’s product development timeline and expected start of production; development of competitive trucks and vans manufactured and sold by the Company’s competitors and major industry vehicle companies; the Company’s ability to scale in a cost-effective manner; the Company’s future capital requirements and sources and uses of cash; the Company’s ability to obtain funding for its future operations; the Company’s financial and business performance; changes in the Company’s strategy, future operations, financial position, estimated revenues and losses, projected costs, prospects and plans; the implementation, market acceptance and success of its business model; expectations regarding the Company’s ability to obtain and maintain intellectual property protection and not infringe on the rights of others; and other risks contained in the Offering prospectus and reports filed by the Company with the SEC. For these reasons, among others, investors are cautioned not to place undue reliance upon any forward-looking statements in this press release. Additional factors are discussed in the Company’s filings with the SEC, including those set forth in the Risk Factors section of the Company's registration statement and Offering prospectus, which are available for review at www.sec.gov. The Company undertakes no obligation to publicly revise these forward-looking statements to reflect events or circumstances that arise after the date hereof.

Phoenix Motor, Inc.

Consolidated Statement of Operations

For the three and nine months ended September 30, 2022 and September 30, 2021

(Dollars in thousands, except per share data)

 
Three Months Ended Nine Months Ended
September 30, 2022 September 30, 2021 September 30, 2022 September 30, 2021
Net sales $

409


$

554


$

2,579


$

1,680


Cost of revenues

288


603


2,013


1,836


Gross profit (loss)

121


(49

)

566


(156

)

Operating expenses:
Selling, general and administrative

3,847


2,117


9,160


6,216


Operating loss

(3,726

)

(2,166

)

(8,594

)

(6,372

)

 
Other income (expense):
Interest expense, net

(2

)

(4

)

(6

)

(2

)

Others

(202

)

1


437


1


Total other (expense) income, net

(204

)

(3

)

431


(1

)

Loss before income taxes

(3,930

)

(2,169

)

(8,163

)

(6,373

)

Income tax provision

-


-


(14

)

(3

)

Net loss $

(3,930

)

$

(2,169

)

$

(8,177

)

$

(6,376

)

 
Net loss per share of common stock:
Basic and Diluted $

(0.20

)

$

(0.12

)

$

(0.44

)

(0.36

)

Weighted average shares outstanding

19,664,273


17,500,000


18,390,891


17,500,000


Phoenix Motor, Inc.

Consolidated Balance Sheet

As of September 30, 2022, and December 31, 2021

 
September 30, 2022 December 31, 2021
(Unaudited)
Assets
Current assets
Cash and cash equivalents $

1,317


$

2,683


Accounts receivable, net

1,422


1,201


Inventories

5,682


2,225


Prepaid expenses and other current assets

3,464


528


Amount due from related party

103


-


Total current assets

11,988


6,637


Restricted cash, non current

250


-


Property and equipment, net

1,942


2,205


Security deposits

209


-


Intangible assets, net

1,859


2,323


Goodwill

4,271


4,271


Total assets $

20,519


$

15,436


Liabilities
Current liabilities
Accounts payable $

1,245


$

1,786


Accrued liabilities

594


779


Advance from customers

1,124


803


Deferred revenue

477


714


Warranty reserve

325


360


Long-term borrowing, current portion

25


10


Total current liabilities

3,790


4,452


Long-term borrowings

148


756


Total liabilities

3,938


5,208


Commitments and contingencies (Note 9)
 
Equity
Common stocks, par $0.0004, 450,000,000 shares authorized,
20,185,625 and 17,500,000 shares issued and outstanding
as of September 30, 2022 and December 31, 2021, respectively*

8


7


Subscription receivable

-


(7

)

Additional paid in capital

40,607


26,085


Accumulated deficit

(24,034

)

(15,857

)

Total equity

16,581


10,228


Total liabilities and equity $

20,519


$

15,436


Phoenix Motor, Inc.

Consolidated Statement of Cash Flows

For the nine months ended September 30, 2022 and September 30, 2021


Nine months ended September 30,


2022


2021


Cash flows from operating activities:
Net loss

$

(8,177

)

$

(6,376

)

Adjustments to reconcile net loss to cash used in operating activities:
Depreciation and amortization


1,305


1,384


Gain on disposal of fixed assets


(54

)


-


Forgiveness of PPP loan


(586

)


-


Stock-based compensation expenses


947


49


Changes in operating assets and liabilities:
Accounts receivable


(221

)


20


Inventories


(3,532

)


(600

)

Prepaid expenses and other assets


(3,145

)


(3,586

)

Accounts receivable, related party


(103

)


-


Accounts payable


(541

)


(399

)

Accrued liabilities


(185

)


26


Warranty reserve


(35

)


(115

)

Deferred revenue


(237

)


87


Advance from customer


321


(102

)

Net cash used in operating activities


(14,243

)


(9,612

)

 
Cash flows from investing activities:
Proceeds from disposal of property and equipment


273


-


Purchase of property and equipment


(722

)


(680

)

Net cash used in investing activities


(449

)


(680

)

 
Cash flows from financing activities:
Proceeds from borrowings


-


586


Proceeds from a related party


1,676


-


Repayment to a related party


(1,676

)


-


Repayment of borrowings


(7

)


(17

)

Proceeds from IPO


13,438


-


Proceeds from capital injection by a shareholder


7


-


Proceeds from exercise of employee stock options


138


Net cash generated from financing activities


13,576


569


Decrease in cash, cash equivalents and restricted cash


(1,116

)


(9,723

)

Cash, cash equivalents and restricted cash at beginning of the period


2,683


15,699


Cash, cash equivalents and restricted cash at end of the period


1,567


5,976


Reconciliation of cash, cash equivalents, and restricted cash to the consolidated balance sheets
Cash and cash equivalents


1,317


5,976


Restricted cash


250


-


Total cash, cash equivalents, and restricted cash


1,567


5,976


Supplemental cash flow information:
Interest paid


6


7


Income tax paid


7


3


Non-cash investing activities:
Inventories transferred to property and equipment


75


-


Contacts

Investor Relations Contacts:
Mark Hastings, SVP & Head of Investor Relations
Sioban Hickie, ICR Inc.
This email address is being protected from spambots. You need JavaScript enabled to view it.

Two high-performing Caterpillar dealers will join forces to create stronger service and support to their clients in the Southwest

MESA, Ariz. & HENDERSON, Nev.--(BUSINESS WIRE)--Arizona-based Empire Southwest (“Empire”), the Cat dealer serving the service territory of Arizona and Southeastern California, has agreed to acquire Nevada-based Cashman Equipment (“Cashman”), the Cat dealer serving the service territory of Nevada and parts of Eastern California.


Empire and Cashman are both third-generation, family-owned Cat dealers. They share similar rich histories, values-driven corporate cultures, and strong reputations for exceptional customer and community service. Empire, which was founded in 1950, operates 22 dealership locations; Cashman, founded in 1931, operates 7 locations. Together, the combined dealership will be positioned to provide even stronger service and solutions to clients in the construction, mining, energy, agricultural, and industrial sectors as well as expanded capabilities to serve one of the country’s fastest growing areas.

Jeff Whiteman, Empire President, and CEO, said, “We have tremendous respect and admiration for MaryKaye Cashman and her team. Cashman is a very high performing dealership that has been dedicated to their people, customers, and communities for generations. We are honored and humbled by the trust MaryKaye and Caterpillar have placed in us. Like Empire, the Cashman organization is full of amazing men and women who are committed to making things better. I’m confident that the new combined team will take the business in both service territories to new levels of client success by building on the industry-leading strengths of both dealerships.”

MaryKaye Cashman, Owner, CEO & Chairman of Cashman Equipment, said, “Since taking the reins of the company in 1995, I have dedicated my life to Cashman Equipment and our fantastic team, which has done such exceptional work supporting our customers and rallying around me in my unique and new role as the head of a Cat dealership. Empire has long had a reputation for excellence among Cat dealers and, as I pursue a new chapter in my life, it is an exciting opportunity for our teams to be able to join forces. I have known the Whiteman family for decades and appreciate not just what their company does but how they have built it – with honesty, respect, and integrity, and with employees and customers always at the center. Our cultures and values share a lot of common ground, and I know that our team members will thrive in this new, combined business that will deliver even more for the customers and communities we serve.”

This transaction is expected to close in December 2022. The combined company will be led by Empire’s current CEO Jeff Whiteman and will continue to provide exceptional support to its clients while focusing on growing the business and attracting great people in one of the country’s fastest growing regions. All Cashman and Empire employees will be important for the continued success of the combined company.

About Empire Southwest

Empire Southwest is an authorized Cat® dealer for heavy equipment and power systems throughout Arizona and Southeastern California. In addition, Empire is a provider of Tier 1 commercial solar products and microgrids, an authorized AGCO equipment dealer representing Fendt and Massey Ferguson, an authorized Trimble dealer through SITECH Southwest, and a premiere distributor of Maintainer, Trail King and other leading truck and trailer brands. The third-generation, family-owned company was founded in 1950 and has over 2,300 employees across 22 locations. Learn more about Empire's products, services, partnerships, and careers at empirecat.com.

About Cashman Equipment

Founded in 1931 by James "Big Jim" Cashman, Cashman Equipment is one of the highest-rated Cat equipment dealers in North America. A full-service dealership, Cashman provides new and used equipment for sale and rental, as well as high-quality parts and service to construction, paving, mining, truck engine, technology, and power system industries throughout Nevada and the Eastern Sierras. For more information, visit cashmanequipment.com.


Contacts

Christy Van Quathem
This email address is being protected from spambots. You need JavaScript enabled to view it.

BETHESDA, Md.--(BUSINESS WIRE)--Enviva Inc. (NYSE: EVA) (“Enviva,” “our,” “we,” or the “Company”) today announced that Thomas Meth, Enviva’s President, has been appointed the Company’s Chief Executive Officer and will become a member of Enviva’s board of directors (the “Board”), while retaining his title as President.


The Company also announced that John Keppler, Chairman and Chief Executive Officer, is expected to assume the role of Executive Chairman, consistent with the succession plan developed by the Board. Prior to doing so, Mr. Keppler will be stepping down from his responsibilities to pursue medical and surgical treatment to address a cardiac valve issue. The Company expects Mr. Keppler, who co-founded Enviva in 2004 with Mr. Meth, to remain available to the Company, and to return in the active Executive Chairman role early in 2023.

Additionally, the Company announced that Ralph Alexander, who has been a member of the Board since 2013, will fulfill Mr. Keppler’s duties as Chairman of the Board until Mr. Keppler’s return, when Mr. Alexander is expected to become Lead Independent Director.

“After careful consideration, I have decided with my medical team and family to step back and focus on my heart condition,” said Mr. Keppler. “The Board and I are delighted that Thomas Meth will serve as our next CEO. Thomas has been my closest business partner in building Enviva into the great company it is today, and I know he will continue to excel in leading Enviva’s growth trajectory as we execute our plan for the future. Thomas is an exceptionally skilled leader who has full command of all facets of the Company and has earned the respect of our employees, customers, investors, and other key stakeholders.”

“We have had the privilege of working with Thomas since Enviva’s earliest days and, during our succession planning process, the Board has had the opportunity to see firsthand Thomas’s substantial contributions to the Company and the leadership team. He is the right person to lead Enviva into the future,” said Ralph Alexander. “We are especially pleased that John is expected to continue as Executive Chairman when he completes what we expect to be a full recovery.”

“All of us at Enviva wish John the best as he prioritizes his health and full recovery, and we look forward to his return as Executive Chairman,” said Thomas Meth. “We are laser-focused on executing the previously announced business plan and are on track to deliver results for 2022 in line with the expectations we outlined recently on our third-quarter earnings call. The world wants cost-effective, ready-to-deploy bio-based alternatives to fossil fuels, from secure sources, and that’s exactly what we offer.”

Mr. Keppler concluded, “I am incredibly proud of the executive team we have built and the tremendous leadership they have demonstrated and continue to demonstrate, not only in building a remarkable business, but also in delivering exceptional shareholder value. Enviva is a company with a robust backlog of fully contracted long-term revenues, a strong growth profile with a large and growing high-quality customer base around the globe, and a durable and sustainable cash flow generation capability. I am confident this trajectory will continue under Thomas, as the team grows and scales Enviva’s manufacturing and customer footprint, and helps customers accelerate their transition from traditional fossil fuel feedstocks for power and heat generation and for hard-to-abate industries. Enviva has a tremendous team leading this company and I look forward to joining them for our investor day and launch of full-year 2023 guidance early in the new year.”

Brief Bio on Thomas Meth

Mr. Meth is a co-founder of Enviva and, prior to his appointment as CEO, he held the position of President, working closely with Mr. Keppler, with responsibility for the Company’s activities from the forest, through our operations and logistics, and ultimately to our customers’ discharge. Mr. Meth has led Enviva’s business development, sales and commercial customer relations, fiber procurement, and sustainability functions. In addition, he has had oversight over the broader plant and port operations and global public affairs initiatives. Mr. Meth holds a Bachelor of Commerce from Vienna University of Economics and Business Administration in Austria as well as an M.B.A. from The Darden Graduate School of Business Administration at The University of Virginia.

About Enviva

Enviva is the world’s largest producer of industrial wood pellets, a renewable and sustainable energy source produced by aggregating a natural resource, wood fiber, and processing it into a transportable form, wood pellets. Enviva owns and operates ten plants with a combined production capacity of approximately 6.2 million metric tons per year in Virginia, North Carolina, South Carolina, Georgia, Florida, and Mississippi, and is constructing its 11th plant in Epes, Alabama. Enviva sells most of its wood pellets through long-term, take-or-pay off-take contracts with creditworthy customers in the United Kingdom, the European Union, and Japan, helping to accelerate the energy transition and to decarbonize hard-to-abate sectors like steel, cement, lime, chemicals, and aviation fuels. Enviva exports its wood pellets to global markets through its deep-water marine terminals at the Port of Chesapeake, Virginia, the Port of Wilmington, North Carolina, and the Port of Pascagoula, Mississippi, and from third-party deep-water marine terminals in Savannah, Georgia, Mobile, Alabama, and Panama City, Florida.

Cautionary Note Concerning Forward-Looking Statements

The information included herein and in any oral statements made in connection herewith include “forward-looking statements” within the meaning of Section 27A of the Securities Act of 1933, as amended, and Section 21E of the Securities Exchange Act of 1934, as amended. All statements, other than statements of present or historical fact included herein, regarding Enviva’s strategy, future operations, financial position, estimated revenues and losses, projected costs, prospects, plans, and objectives of management are forward-looking statements. When used herein, including any oral statements made in connection herewith, the words “could,” “should,” “will,” “may,” “believe,” “anticipate,” “intend,” “estimate,” “expect,” “project,” the negative of such terms, and other similar expressions are intended to identify forward-looking statements, although not all forward-looking statements contain such identifying words. These forward-looking statements are based on management’s current expectations and assumptions about future events and are based on currently available information as to the outcome and timing of future events. Except as otherwise required by applicable law, Enviva disclaims any duty to revise or update any forward-looking statements, all of which are expressly qualified by the statements in this section, to reflect events or circumstances after the date hereof. Enviva cautions you that these forward-looking statements are subject to risks and uncertainties, most of which are difficult to predict and many of which are beyond the control of Enviva. These risks include, but are not limited to: adverse changes to Mr. Keppler’s health; changes in leadership plans and strategies; overall domestic and global political and economic conditions; and other factors, as described in Enviva’s filings with the Securities and Exchange Commission (the “SEC”), including the detailed factors discussed under the heading “Risk Factors” in Enviva’s Annual Report on Form 10-K for the fiscal year ended December 31, 2021, as supplemented in the Company’s Quarterly Reports on Form 10-Q for the fiscal quarters ended March 31, June 30, and September 30, 2022.

Should one or more of the risks or uncertainties described herein and in any oral statements made in connection therewith occur, or should underlying assumptions prove incorrect, actual results and plans could different materially from those expressed in any forward-looking statements. Additional information concerning these and other factors that may impact Enviva’s expectations and projections can be found in Enviva’s periodic filings with the SEC. Enviva’s SEC filings are available publicly on the SEC’s website at www.sec.gov.

To learn more about Enviva please visit our website at www.envivabiomass.com. Follow Enviva on social media @Enviva.


Contacts

INVESTOR CONTACT:
Kate Walsh
Vice President, Investor Relations
+1 240-482-3856
This email address is being protected from spambots. You need JavaScript enabled to view it.

WHITE PLAINS, N.Y.--(BUSINESS WIRE)--OPAL Fuels Inc. (“OPAL Fuels” or the “Company”) (Nasdaq: OPAL), a leading vertically integrated producer and distributor of renewable natural gas (RNG), today announced financial and operating results for the three and nine months ended September 30, 2022.


Financial Highlights

  • Revenues for the three and nine months ended September 30, 2022, were $66.6 million and $168.8 million, respectively, up 41% and 61%, compared to prior-year periods.
  • Net income for the three and nine months ended September 30, 2022, was $5.4 million and $0.6 million, respectively, compared to $0.8 million and $19.0 million, in the same period last year.
  • Adjusted EBITDA1 for the three and nine months ended September 30, 2022, was $25.5 million and $40.6 million, respectively, up 130% and 78%, compared to prior-year periods.

Full Year 2022 Guidance Expectations

  • Estimated Adjusted EBITDA2 for the full year 2022 is anticipated to range between $60.0 million and $63.0 million.
  • 2022 RNG production for the full year 2022 is anticipated to range between 2.2 million MMBtu and 2.3 million MMBtu.3

1 Adjusted EBITDA is a non-GAAP measure. A reconciliation of GAAP Net (Loss) Income to Adjusted EBITDA has been provided in the financial tables included in this press release. An explanation of this measure and how it is calculated is also included below under the heading “Non-GAAP Financial Measures."

2 Estimated Adjusted EBITDA is a non-GAAP financial measure. A reconciliation of the full year estimated Adjusted EBITDA to net income (loss), the closest GAAP measure, cannot be provided due to the inherent difficulty in quantifying certain amounts including but not limited to changes in fair value of the derivative instruments and other items, due to a number of factors including the unpredictability of underlying price movements, which may be significant.

3 Reflects OPAL Fuels proportional ownership with respect to RNG projects owned with joint venture partners.

Management Commentary

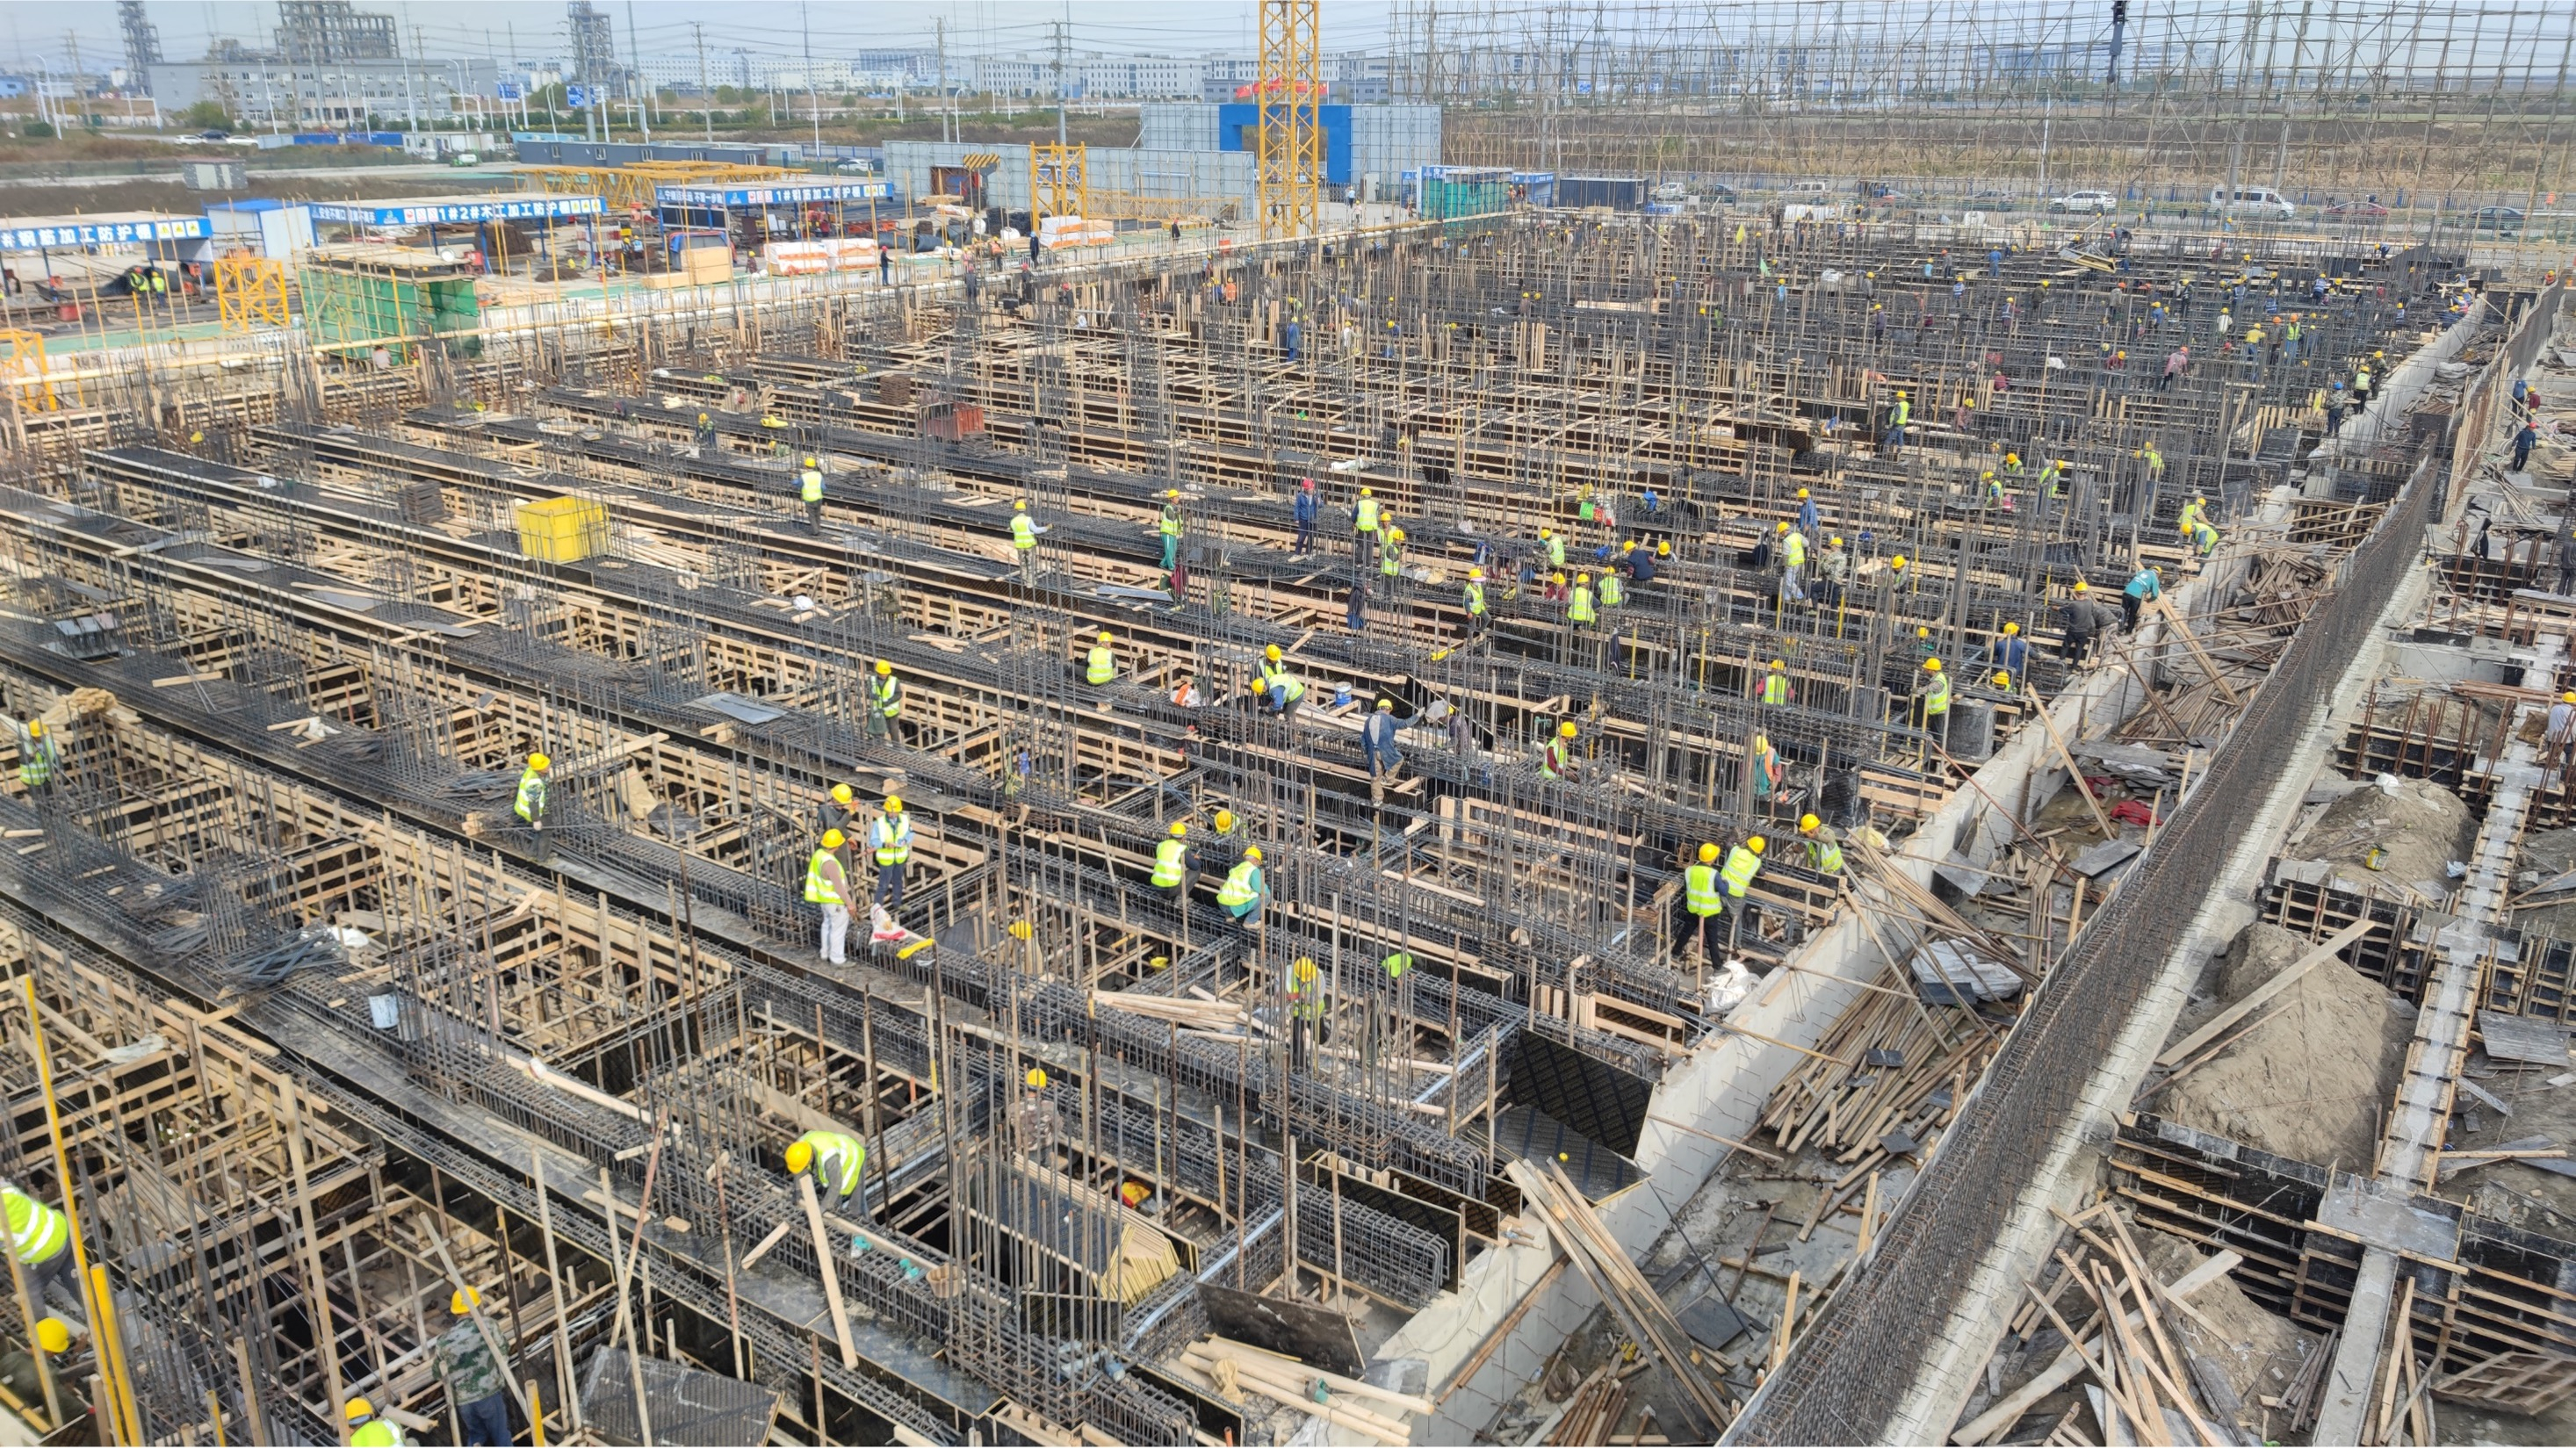
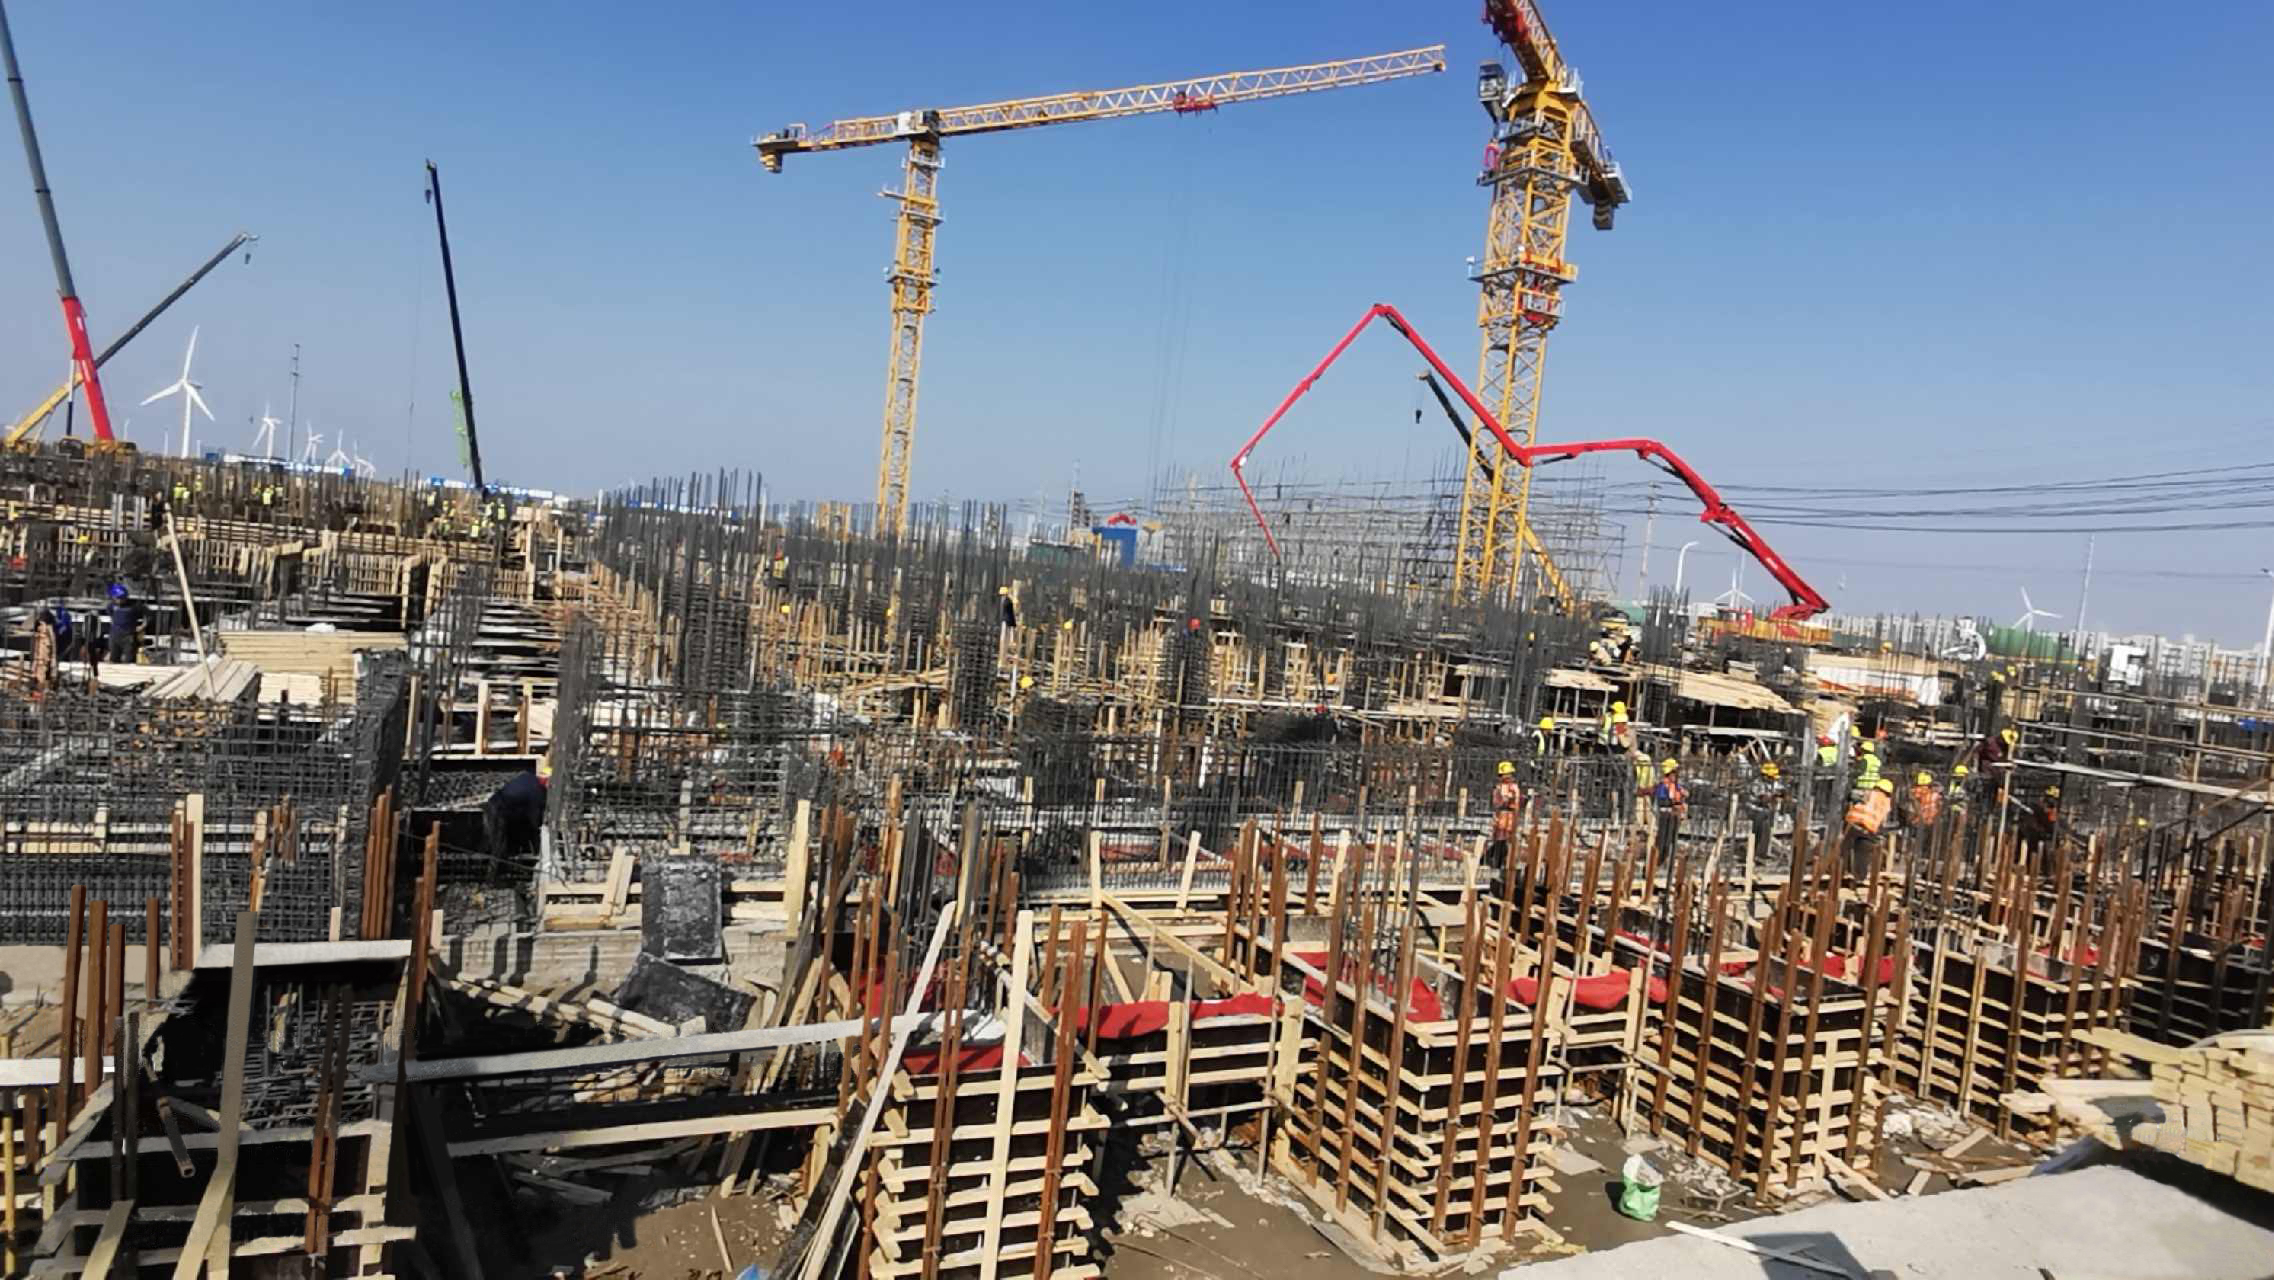
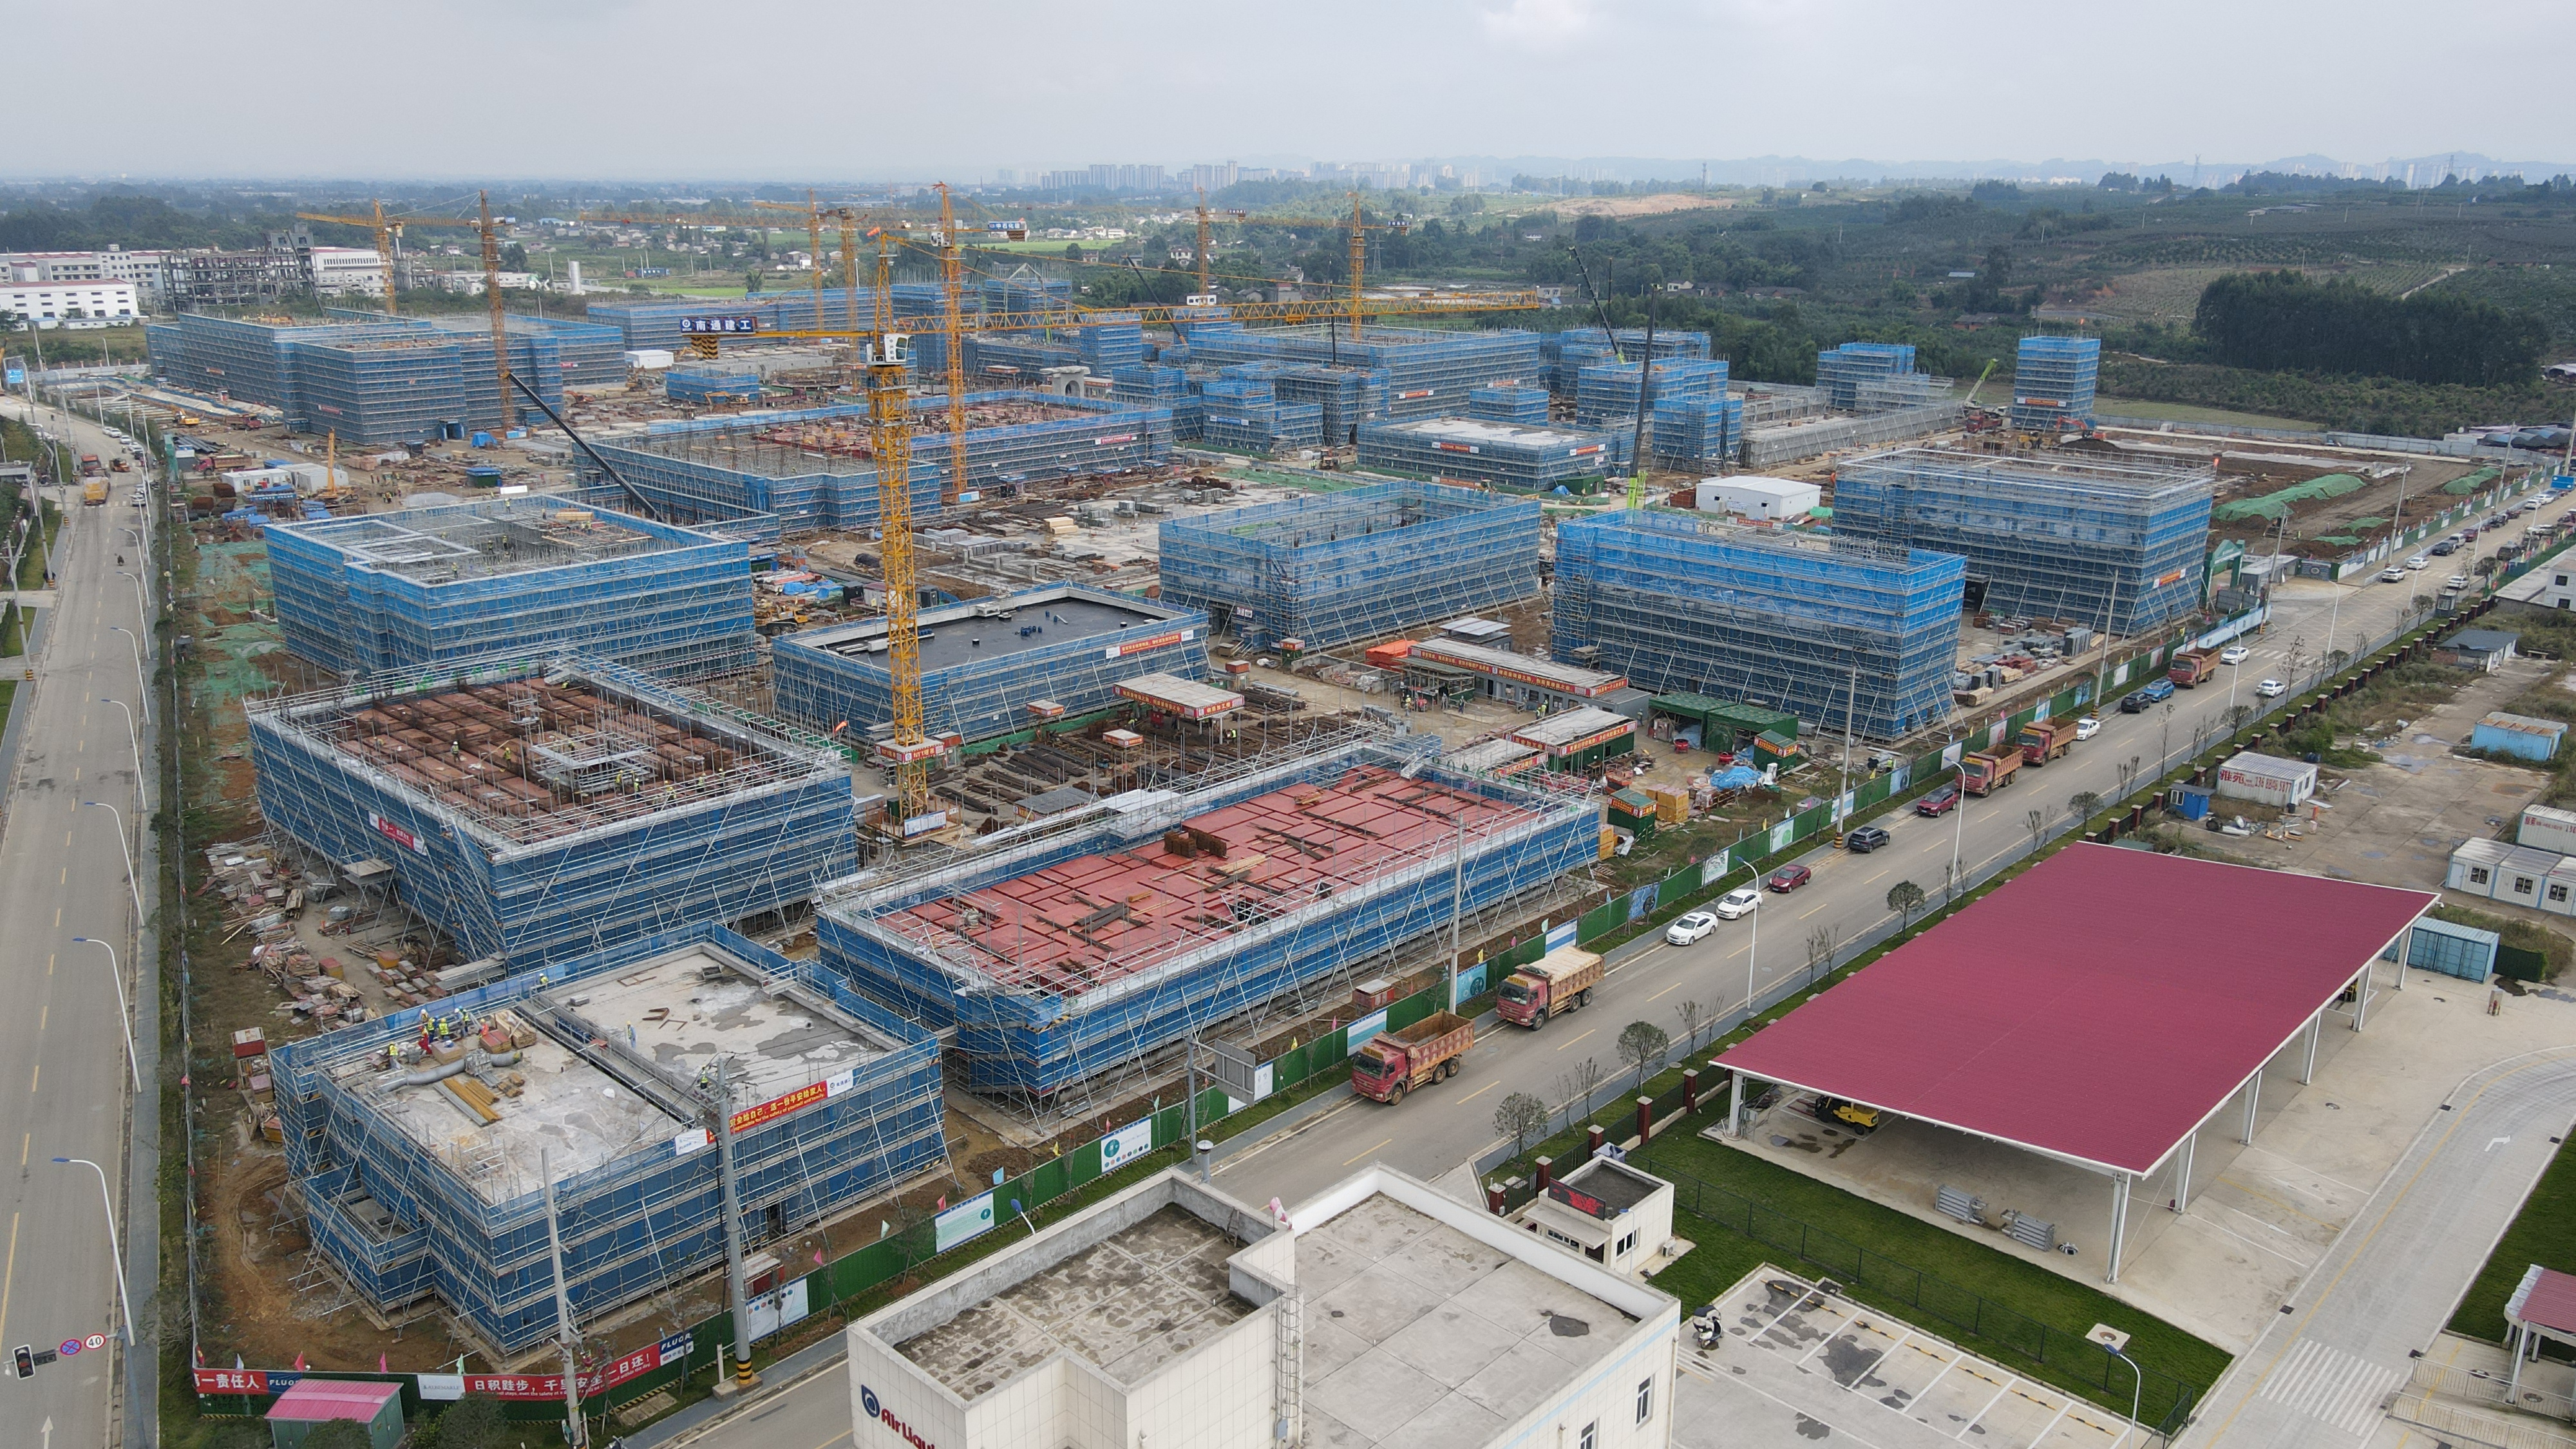
Adam Comora, Co-CEO of OPAL Fuels, commented, “We are pleased to report our third quarter earnings. First, and most importantly we continue to execute on our strategic goals and operational priorities. As of today, six RNG projects are in operation and seven are in construction. These construction projects are expected to come online throughout 2023 and into 2024. Second, we are on a solid trajectory towards realizing the significant long-term earnings power of our company. We also continue to grow our development portfolio adding to our pipeline of future RNG projects further supporting our long-term growth.”

Jonathan Maurer, Co-CEO of OPAL Fuels, stated, “The passage of the Inflation Reduction Act and recent industry consolidation are clear endorsements of the RNG industry and the strength of our integrated business model. Over OPAL Fuels' long operating history in this sector, never has a period of positive momentum existed like the present. Our portfolio of RNG projects combined with our integrated downstream operations enable us to offer a differentiated value proposition that resonates with our customers and partners.”

Operational Highlights

  • Produced 0.6 million and 1.6 million MMBtu of RNG, for the three and nine months ended September 30, 2022, respectively, up 50% and 33%, compared to prior-year periods.
  • Sold 7.4 million and 20.5 million GGEs of RNG as transportation fuel for the three and nine months ended September 30, 2022, respectively, up 17% and 45%, compared to prior- year periods.
  • Delivered 30.7 million and 82.6 million GGEs through a combination of owned station fuel provider agreements and third-party service and dispensing agreements for the three and nine months ended September 30, 2022, respectively, up 33% and 20%, compared to prior-year periods.
  • During the first nine months of 2022, the Pine Bend, New River and Noble Road RNG projects commenced commercial operations, bringing OPAL Fuels' share of annual nameplate capacity across our six RNG projects in operation to 3.7 million MMBtu for landfill projects and 0.2 million MMBtu for dairy projects.4

4 Nameplate capacity is the annual design output for each facility and may not reflect actual production from the projects, which depends on many variables including, but not limited to, quantity and quality of the biogas, operational up-time of the facility, and actual productivity of the facility.

Construction Update

  • The Company has begun construction on a renewable power to RNG conversion project in the Northeast bringing to seven the number of RNG facilities under construction as of September 30, 2022, with anticipated aggregate nameplate capacity of 4.2 million MMBtu of landfill biogas and 0.6 million MMBtu of dairy biogas.
  • Received RIN certification for New River in October and anticipate receiving RIN certification for Pine Bend by end of 2022.
  • Emerald and Prince William RNG projects are expected to commence commercial operations by mid-2023 and the Sapphire RNG project by early 2024. OPAL Fuels’ share of annual nameplate capacity for these landfill projects is 3.8 million MMBtu.
  • Construction is progressing at two Central Valley California dairy RNG projects with commercial operations anticipated in 2024.

Development Update

  • The Company's Advanced Development Pipeline5 comprises 16 projects representing 7.4 million MMBtu of feedstock biogas per year consisting of 6.2 million MMBtu of landfill biogas, 0.5 million MMBtu dairy biogas, and 0.7 million MMBtu of food waste and wastewater biogas.6
  • The Company is evaluating nine of our existing renewable power projects comprising 3.2 million MMBtu per year of landfill biogas in light of the incentives in the Inflation Reduction Act.
  • The Company's total number of RNG dispensing stations grew from 69 at December 31, 2021, to 123 at September 30, 2022.

5 The Company's Advanced Development Pipeline comprises projects that have been qualified and are reasonably expected to be in construction within the next twelve to eighteen months. The associated MMBtu associated with these projects is presented as available biogas resource and assumes a conversion ratio of 90% for output gas.

6 OPAL Fuels proportional share with respect to RNG projects owned with joint venture partners.

2022 Guidance

All guidance is current as of the date of this release and is subject to change.

($ millions, except production data)


Full Year 2022


Low Est.


High Est.

Adjusted EBITDA


$60

-

$63

RNG Production (million MMBtu)7


2.2

-

2.3

We anticipate providing guidance for 2023 concurrently with our results for fiscal 2022.

7 RNG Production reflects OPAL Fuels' proportional share with respect to RNG projects owned with joint venture partners.

Results of Operations

($ thousands of dollars)


Three Months Ended
September 30,


Nine Months Ended
September 30,


2022


2021


2022


2021

Revenue


RNG Fuel


$

32,381


$

17,892


$

83,196


$

37,066

Fuel Station Services


23,227


18,387


55,524


35,560

Renewable Power


10,942


10,905


30,094


32,342

Total Revenue


$

66,550


$

47,184


$

168,814


$

104,968


Net income


$

5,369


$

773


$

560


$

18,950


Adjusted EBITDA


$

25,462


$

11,079


$

40,593


$

22,785


RNG Fuel volume produced (Million MMBtus)


0.6


0.4


1.6


1.2

RNG Fuel volume sold (Million GGEs)


7.4


6.3


20.5


14.1

Total volume delivered (Million GGEs)


30.7


23.1


82.6


68.8

Revenue for the three months ended September 30, 2022, were $66.6 million, an increase of 41%, or $19.4 million, compared to $47.2 million in the prior-year period. While each business segment experienced growth, the increase was primarily driven by the RNG Fuel segment. Total revenues for the nine months ended September 30, 2022, were $168.8 million compared to $105.0 million in the prior-year period.

Net income for the three months ended September 30, 2022, was $5.4 million, compared to $0.8 million in the prior-year period. The third quarter benefited from higher brown gas prices as well as higher sales of environmental attributes as a result of Noble Road having achieved RIN certification in the second quarter and the release of higher levels of stored gas. We also benefited from approximately $2.5 million of one-time income from an equity method investment that was recognized in the third quarter. Net income for the nine months ended September 30, 2022, was $0.6 million compared to $19.0 million in the prior-year period. The nine month period ended September 30, 2022, reflects the impacts of higher transaction costs associated with becoming a public company offset by higher brown gas prices and higher RIN pricing under forward sales contracts and the $2.5 million one-time benefit from an equity method investment, while the prior year period includes a $19.8 million one-time gain associated with the acquisition of our remaining interest in the Imperial and Greentree projects in May, 2021.

Adjusted EBITDA(1) for the three months ended September 30, 2022, was $25.5 million, reflecting an increase of 130%, compared to $11.1 million for the prior-year period. Adjusted EBITDA for the nine months ended September 30, 2022, was $40.6 million compared to $22.8 million in the prior-year period.

Timing of Sales of RINs for Gas in Storage

At September 30, 2022, the Company had biogas in storage from second and third quarter production that was pending certification for generation of environmental credits from New River and Pine Bend. Upon completion of certification, which occurred in October for New River and is expected prior to year-end for Pine Bend, this stored biogas is anticipated to generate approximately 2.4 million RINs. These RINs will be monetized under forward sales contracts as they are generated, at a weighted-average price of $3.20.

Under generally accepted accounting principles (“GAAP”), the timing of revenue recognition for stand-alone RIN sales contracts is tied to the delivery of the RIN to our counterparties and not the production of the RIN. Of the $7.5 million that is anticipated to be generated from these RIN sales, $6.6 million is allocated to third quarter Adjusted EBITDA and represents the volume of the stored biogas produced in the third quarter. The remainder would have been allocated to the second quarter.

Segment Revenues

RNG Fuel

Revenue from RNG Fuel increased was $32.4 million, an increase of $14.5 million, or 81%, for the three months ended September 30, 2022, compared to the three months ended September 30, 2021. This change was attributable primarily due to an increase in RIN sales and brown gas sales driven by additional volumes and higher prices.

For the nine months ended September 30, 2022, revenue from RNG Fuel increased by $46.1 million, or 124%, compared to the nine months ended September 30, 2021. $28.0 million of this increase was attributable primarily to the impact of nine months of Beacon revenues in 2022 versus only five months in 2021. The remainder of the increase is due to higher sales of environmental credits, higher brown gas sales and incremental fuel dispensing primarily due to increased volumes.

Fuel Station Services

Revenue from Fuel Station Services was $23.2 million an increase of $4.8 million, or 26%, for the third quarter of 2022 compared to the three months ended September 30, 2021. This change was primarily attributable to additional fuel station projects and incremental service volumes from four new fueling service sites.

For the nine months ended September 30, 2022, revenue from Fuel Station Services increased by $20.0 million, or 56% compared to the nine months ended September 30, 2021. This was primarily attributable to increased fuel station construction projects.

Renewable Power

Revenue from Renewable Power was $10.9 million flat for the three months ended September 30, 2022, compared to the third quarter 2021.

For the nine months ended September 30, 2022, revenue from Renewable Power decreased by $2.2 million, or 7%, compared to the third quarter 2021. This change was attributable primarily to a positive mark to market change in commodity swaps.

Liquidity

As of September 30, 2022, our liquidity consisted of cash and cash equivalents including restricted cash of $71.4 million, plus an additional $146.9 million in short-term investments maturing within 90 days. Additionally, we entered into an aggregate $105 million senior secured credit facility to be used to fund up to $100 million of the construction costs of a portfolio of fully- and jointly-owned RNG projects owned, either in full or through a joint venture with a third party over a two year delayed draw period, with the remaining funds to be maintained in the debt service reserve account. No funds have been drawn under this facility. During the quarter three months ended September 30, 2022, we drew $12.5 million under the OPAL term loan, and recently. Subsequent to quarter-end, we drew an additional $12.5 million. We also entered into an amendment to this term loan which extended the commitment available date to March 2023 for the remaining $10.0 million.

We believe that our available cash, anticipated cash flows from operations, available lines of credit under existing debt facilities, and access to expected sources of capital will be sufficient to meet our existing commitments and funding needs.

Capital Expenditures

During the third quarter, OPAL Fuels invested $24.4 million across six RNG projects and 21 owned fueling stations in construction as compared to $19.2 million as of the comparable period in 2021. On a year-to-date basis, we have invested $61.8 million compared to $41.8 million for the nine months ended September 30, 2021.8

8 Capital Expenditures reflect net investment in RNG projects net of proceeds received from our non-redeemable non-controlling interests. We received $6.2 million and $6.4 million from such parties for the three months ended September 30, 2022 and 2021, respectively. We received $23.1 million and $15.2 million from these parties for the nine months ended September 30, 2022 and 2021, respectively. These amounts have been excluded to reflect only capital expenditures attributable to OPAL Fuels.

Earnings Call

A webcast to review OPAL Fuels’ Third Quarter 2022 results is being held tomorrow, November 15, 2022 at 11:00AM Eastern Time.

Materials to be discussed in the webcast will be available before the call on the Company's website.

Participants may access the call at https://edge.media-server.com/mmc/p/5oahi7s2, and a live webcast will also be available at https://investors.opalfuels.com/news-events/events-presentations.

Glossary of terms

“Environmental Attributes” refer to federal, state, and local government incentives in the United States, provided in the form of Renewable Identification Numbers, Renewable Energy Credits, Low Carbon Fuel Standard credits, rebates, tax credits and other incentives to end users, distributors, system integrators and manufacturers of renewable energy projects that promote the use of renewable energy.

“GGE” refers to Gasoline gallon equivalent. It is used to measure the total volume of RNG production that OPAL Fuels expects to dispense each year. The conversion ratio is 1MMBtu equal to 7.74 GGE.

“LFG” refers to landfill gas.

“MMBtu” refers to British thermal units.

“Renewable Power” refers to electricity generated from renewable sources.

“RNG” refers to renewable natural gas.

“D3” refers to cellulosic biofuel with a 60% GHG reduction requirement.

“RIN” refers to Renewal Identification Numbers.

“EPA” refers to Environmental Protection Agency.

About OPAL Fuels Inc.

OPAL Fuels Inc. (Nasdaq: OPAL) is a leading vertically integrated renewable fuels platform involved in the production and distribution of renewable natural gas (RNG) for the heavy-duty truck market. RNG is a proven low-carbon fuel that is rapidly decarbonizing the transportation industry now while also significantly reducing fuel costs for fleet owners. OPAL Fuels captures harmful methane emissions at the source and recycles the trapped energy into a commercially viable, lower-cost alternative to diesel fuel. The company also develops, constructs, and services RNG and hydrogen fueling stations. As a producer and distributor of carbon-reducing fuel for heavy-duty truck fleets for more than a decade, OPAL Fuels delivers complete renewable solutions to customers and production partners. To learn more about OPAL Fuels and how it is leading the effort to capture North America’s harmful methane emissions and decarbonize the transportation industry, please visit www.opalfuels.com and follow the company on LinkedIn and Twitter at @OPALFuels.

Forward-Looking Statements

Certain statements in this communication may be considered forward-looking statements within the meaning of the “safe harbor” provisions of the United States Private Securities Litigation Reform Act of 1995. Forward-looking statements are statements that are not historical facts and generally relate to future events or OPAL Fuels’ (the “Company”) future financial or other performance metrics. In some cases, you can identify forward-looking statements by terminology such as “believe,” “may,” “will,” “potentially,” “estimate,” “continue,” “anticipate,” “intend,” “could,” “would,” “project,” “target,” “plan,” “expect,” or the negatives of these terms or variations of them or similar terminology. Such forward-looking statements are subject to risks and uncertainties, which could cause actual results to differ materially from those expressed or implied by such forward looking statements. New risks and uncertainties may emerge from time to time, and it is not possible to predict all risks and uncertainties. These forward-looking statements are based upon estimates and assumptions that, while considered reasonable by the Company and its management, as the case may be, are inherently uncertain and subject to material change. Factors that may cause actual results to differ materially from current expectations include various factors beyond management’s control, including but not limited to general economic conditions and other risks, uncertainties and factors set forth in the sections entitled “Risk Factors” and “Cautionary Statement Regarding Forward-Looking Statements” in the Company's quarterly report on Form 10Q filed on November 14, 2022, and other filings the Company makes with the Securities and Exchange Commission. Nothing in this communication should be regarded as a representation by any person that the forward-looking statements set forth herein will be achieved or that any of the contemplated results of such forward-looking statements will be achieved. You should not place undue reliance on forward-looking statements in this communication, which speak only as of the date they are made and are qualified in their entirety by reference to the cautionary statements herein. The Company expressly disclaims any obligations or undertaking to release publicly any updates or revisions to any forward-looking statements contained herein to reflect any change in the Company’s expectations with respect thereto or any change in events, conditions or circumstances on which any statement is based.

Disclaimer

This communication is for informational purposes only and is neither an offer to purchase, nor a solicitation of an offer to sell, subscribe for or buy, any securities, nor shall there be any sale, issuance or transfer or securities in any jurisdiction in contravention of applicable law. No offer of securities shall be made except by means of a prospectus meeting the requirements of Section 10 of the Securities Act of 1933, as amended.


OPAL FUELS INC.
CONDENSED CONSOLIDATED BALANCE SHEETS
(In thousands of U.S. dollars, except per share data)


September 30,
2022


December 31,
2021


(Unaudited)


Assets


Current assets:


Cash and cash equivalents (includes $10,045 and $1,991 at September 30, 2022 and December 31, 2021, respectively, related to consolidated VIEs)

$

25,286


$

39,314

Accounts receivable, net (includes $1,129 and $40 at September 30, 2022 and December 31, 2021, respectively, related to consolidated VIEs)


36,660


25,391

Restricted cash - current (includes $7,623 and $— at September 30, 2022 and December 31, 2021, respectively, related to consolidated VIEs)


41,419


Short term investments ( includes $15,411 and $— at September 30, 2022 and December 31, 2021, respectively, related to consolidated VIEs)


146,936


Fuel tax credits receivable


3,442


2,393

Contract assets


14,676


8,484

Parts inventory


6,570


5,143

Environmental credits held for sale


1,224


386

RNG inventory


2,094


Prepaid expense and other current assets (includes $268 and $113 at September 30, 2022 and December 31, 2021, respectively, related to consolidated VIEs)


6,513


5,482

Derivative financial assets, current portion


1,435


382

Total current assets


286,255


86,975

Capital spares


3,333


3,025

Property, plant, and equipment, net (includes $50,099 and $27,794 at September 30, 2022 and December 31, 2021, respectively, related to consolidated VIEs)


250,355


169,770

Investment in other entities


48,708


47,150

Note receivable


9,200

Note receivable - variable fee component


1,865


1,656

Deferred financing costs


3,522


2,370

Other long-term assets


489


489

Intangible assets, net


2,266


2,861

Restricted cash - non-current (includes $2,867 and $1,163 at September 30, 2022 and December 31, 2021, respectively, related to consolidated VIEs)


4,655


2,740

Goodwill


54,608


54,608

Total assets

$

656,056


$

380,844

Liabilities and Equity


Current liabilities:


Accounts payable (includes $2,783 and $544 at September 30, 2022 and December 31, 2021, respectively, related to consolidated VIEs)


5,798


12,581

Accounts payable, related party


489


166

Fuel tax credits payable


2,668


1,978

Accrued payroll


5,266


7,652

Accrued capital expenses (includes $1,493 and $1,722 at September 30, 2022 and December 31, 2021, respectively, related to consolidated VIEs)


9,284


5,517

Accrued expenses and other current liabilities


16,063


7,220

Contract liabilities


6,750


9,785

Senior Secured Credit Facility - term loan, current portion, net of debt issuance costs


70,179


73,145

Senior Secured Credit Facility - working capital facility, current portion


7,500


7,500

OPAL Term Loan, current portion


28,432


13,425

Sunoma loan, current portion (includes $— and $756 at September 30, 2022 and December 31, 2021, respectively, related to consolidated VIEs)


756

Convertible Note Payable


27,964


Municipality loan


121


194

Derivative financial liability, current portion


4,648


992

Other current liabilities


832


374

Asset retirement obligation, current portion


1,586


831

Total current liabilities


187,580


142,116

Asset retirement obligation, non-current portion


4,382


4,907

OPAL Term Loan


60,816


59,090

Convertible Note Payable


58,710

Sunoma loan, net of debt issuance costs (includes $22,080 and $16,199 at September 30, 2022 and December 31, 2021, respectively, related to consolidated VIEs)


22,080


16,199

Municipality loan


84

Derivative warrant liabilities


22,410


Earn out liabilities


39,500


Other long-term liabilities


597


4,781

Total liabilities


337,365


285,887

Commitments and contingencies


Redeemable preferred non-controlling interests


135,303


30,210

Redeemable non-controlling interests


1,222,657


63,545

Stockholders' (deficit) equity


Class A common stock, $0.0001 par value, 337,852,251 shares authorized as of September 30, 2022; 25,671,390 and 0 shares, issued and outstanding at September 30, 2022 and December 31, 2021, respectively


2


Class B common stock, $0.0001 par value, 157,498,947 shares authorized as of September 30, 2022; None issued and outstanding as of September 30, 2022 and December 31, 2021


Class C common stock, $0.0001 par value, 154,309,729 shares authorized as of September 30, 2022; None issued and outstanding as of September 30, 2022 and December 31, 2021


Class D common stock, $0.0001 par value, 154,309,729 shares authorized as of September 30, 2022; 144,399,037 issued and outstanding at September 30, 2022 and December 31, 2021


14


14

Additional paid-in capital


Accumulated deficit


(1,066,137

)


Accumulated other comprehensive income


178


Total Stockholders' (deficit) equity attributable to the Company


(1,065,943

)


14

Non-redeemable non-controlling interests


26,674


1,188

Total Stockholders' (deficit) equity


(1,039,269

)


1,202

Total liabilities, Redeemable preferred, Redeemable non-controlling interests and Stockholders' (deficit) equity

$

656,056


$

380,844


Contacts

Media
Jason Stewart
Senior Director Public Relations & Marketing
914-421-5336
This email address is being protected from spambots. You need JavaScript enabled to view it.
ICR, Inc.
This email address is being protected from spambots. You need JavaScript enabled to view it.

Investors
Todd Firestone
Vice President Investor Relations & Corporate Development
914-705-4001
This email address is being protected from spambots. You need JavaScript enabled to view it.


Read full story here

Guidance Adjusted for 2022; Backlog Grows Over $100 Million; Litigation Complete

ATLANTA--(BUSINESS WIRE)--Williams Industrial Services Group Inc. (NYSE American: WLMS) (“Williams” or the “Company”), an energy and industrial infrastructure services company, today reported financial results for the fiscal third quarter ended September 30, 2022.

Recent Highlights

  • Williams posted revenue of $56.7 million in the third quarter of 2022 compared with $73.4 million in the prior-year period
  • In the third quarter of 2022 Williams reached two legal settlements that, in aggregate, resulted in net cash receipts of $10.8 million, recorded as “other income” in the Company’s statement of operations and used a portion of the cash to pay down approximately $8.1 million of its term-loan
  • Williams reported net income from continuing operations of $3.6 million, or $0.14 per diluted share, in the third quarter of 2022 compared with net income from continuing operations of $0.8 million, or $0.03 per diluted share, in the third quarter of 2021
  • Adjusted EBITDA1 was $6.2 million for the third quarter of 2022 compared with $3.8 million in the prior-year period
  • Williams secured a multi-year extension of existing business providing maintenance and modification services at various sites owned and operated by a large southern-based utility during the quarter. The work, through a longstanding joint venture, is estimated to be worth approximately $120 million of revenue over the next four years
  • In addition, Eversource Energy (NYSE: ES) expanded its previously-announced Master Service Agreement with the Company, covering additional geographic areas over a three-year period, with a two-year optional extension
  • As of September 30, 2022, the Company’s backlog was $352.7 million compared to $234.3 million as of June 30, 2022; approximately $168.2 million of the current backlog is expected to be converted to revenue over the next twelve months
  • The Company has updated its 2022 guidance to reflect lower than anticipated revenue and further margin compression on certain projects this year

“Williams’ guidance is being adjusted to reflect near-term challenges,” said Tracy Pagliara, President and CEO of Williams. “During 2022 we have not converted as much of our pipeline to revenue as anticipated, particularly with respect to our nuclear end market. Furthermore, after ongoing project reviews, we identified additional losses in our Florida water business which significantly impacted our overall gross margin.

“At the same time, we are pleased by other recent events that have a positive impact on our outlook. Settling two ongoing litigation issues brought in net cash receipts of $10.8 million that was used to pay down debt. We were also awarded a multi-year Master Service Agreement with Eversource Energy that covers Connecticut and certain surrounding areas, where we provide installation, maintenance, repair and other services associated with natural gas distribution. In addition, Williams recently secured a multi-year extension of maintenance and modification service work at various sites owned and operated by a large southern-based utility. This business is estimated to be worth approximately $120 million of revenue over the next four years and accounted for a large portion of our backlog increase this quarter.”

1See NOTE 1 — Non-GAAP Financial Measures in the attached tables for important disclosures regarding Williams’ use of Adjusted EBITDA, as well as a reconciliation of income (loss) from continuing operations to Adjusted EBITDA.

Third Quarter 2022 Financial Results Compared to Third Quarter 2021

Revenue in the third quarter was $56.7 million compared with $73.4 million in the third quarter of 2021, largely reflecting reduced decommissioning and nuclear business. Gross profit was $0.7 million, or 1.3% of revenue, compared with $6.8 million, or 9.2% of revenue, in the prior-year period, with the lower margin primarily due to the impact of certain loss contracts in Florida, as previously announced, and start-up costs tied to the Company’s further expansion into the energy delivery market. Excluding the aforementioned business start-up expenses and negative impact from the Company’s Florida water projects, adjusted gross margin would have been 9.7% of revenue.

Operating expenses were $7.0 million in the 2022 third quarter compared with $4.6 million in the prior-year period. The $2.4 million increase was largely driven by professional fees primarily associated with the legal actions settled during the quarter, as well as the reversal of incentive compensation in 2021. The Company reported an operating loss of $6.3 million during the third quarter of 2022 versus operating profit of $2.2 million in the same period of 2021. Interest expense was $1.5 million in the third quarter of 2022 versus $1.2 million in 2021. The Company reported net income from continuing operations of $3.6 million, or $0.14 per diluted share, in the third quarter of 2022 compared with net income from continuing operations of $0.8 million, or $0.03 per diluted share, in the third quarter of 2021. In 2022 Williams achieved two legal settlements that, in aggregate, resulted in net cash receipts of $10.8 million, recorded as “other income” in the Company’s statement of operations.

Liquidity and Balance Sheet

The Company’s total liquidity (the sum of unrestricted cash and availability under the Company’s revolving credit facility) was $7.3 million as of September 30, 2022 versus $27.7 million at the beginning of 2022. As of September 30, 2022, the Company had $1.0 million of unrestricted cash and cash equivalents, $0.5 million of restricted cash, and $37.4 million of bank debt compared with $2.5 million of unrestricted cash and cash equivalents, $0.5 million of restricted cash, and $32.1 million of bank debt as of December 31, 2021.

The Company had negative cash flows from operations during the nine months ended September 30, 2022. These negative cash flows were primarily a consequence of the following factors:

  • Significant losses incurred on a number of fixed price contracts in the Company’s Florida water business, which have been the subject of prior disclosures;
  • Start-up costs related to the Company’s entry into the transmission and distribution market, which have utilized cash resources and, while ultimately anticipated to benefit the Company’s business, have negatively impacted liquidity;
  • Failure to convert pipeline opportunities into revenue, which has had the effect of delaying the Company’s receipt of cash from such opportunities; and
  • Delays in collecting cash receipts from customers.

To address negative cash flows in the Company’s business, Williams has developed a liquidity plan to reduce operating expenses and eliminate unprofitable projects. The Company will continue to refine its liquidity plan as circumstances dictate. For further information, please see the Company’s Quarterly Report on Form 10-Q for the period ended September 30, 2022.

Backlog

Total backlog as of September 30, 2022 was $352.7 million compared with $234.3 million on June 30, 2022. During the third quarter of 2022 the Company recognized revenue of $56.7 million, booked new awards of $159.0 million, and saw net adjustments and cancellations of $16.1 million.


Three Months Ended September 30, 2022


Nine Months Ended September 30, 2022

Backlog - beginning of period


$

234,303


$

631,693


New awards


158,960


214,480


Adjustments and cancellations, net


16,145


(311,147

)

Revenue recognized


(56,685

)


(182,303

)

Backlog - end of period


$

352,723


$

352,723


Williams estimates that approximately $168.2 million of its current backlog will be converted to revenue within the next twelve months compared with $144.6 million of backlog as of June 30, 2022 that the Company anticipated would be converted to revenue over the succeeding twelve-month period.

Outlook

The Company adjusted guidance for the current fiscal year from that previously provided on August 4, 2022, as follows:

2022 Guidance


Revenue:

$245 to $255 million (previously, $275 to $295 million)

Gross margin:

5.50% to 5.75% (previously, 9.0% to 9.5%)

SG&A:

10.5% to 11.0% of revenue (previously, 8.25% to 8.75% of revenue)

Adjusted EBITDA*:

$2.5 to $3.5 million (previously, $5.0 to $7.5 million)

*See Note 1 — Non-GAAP Financial Measures for information regarding the use of Adjusted EBITDA and forward-looking non-GAAP financial measures.

Webcast and Teleconference

The Company will host a conference call, November 15, 2022, at 10:00 a.m. Eastern time. A webcast of the call and an accompanying slide presentation will be available at www.wisgrp.com. To access the conference call by telephone, listeners should dial 201-493-6780.

An audio replay of the call will be available later that day by dialing 412-317-6671 and entering conference ID number 13734113; alternatively, a webcast replay can be found at http://ir.wisgrp.com/, where a transcript will be posted once available.

About Williams

Williams Industrial Services Group has been safely helping plant owners and operators enhance asset value for more than 50 years. The Company is a leading provider of infrastructure related services to blue-chip customers in energy and industrial end markets, including a broad range of construction maintenance, modification, and support services. Williams’ mission is to be the preferred provider of construction, maintenance, and specialty services through commitment to superior safety performance, focus on innovation, and dedication to delivering unsurpassed value to its customers.

Additional information about Williams can be found on its website: www.wisgrp.com.

Forward-looking Statement Disclaimer

This press release contains “forward-looking statements” within the meaning of the term set forth in the Private Securities Litigation Reform Act of 1995. The forward-looking statements include statements or expectations regarding the Company’s ability to perform in accordance with guidance, to contain margin reductions within the Florida business, build and diversify its backlog and convert backlog to revenue, realize opportunities, including receiving contract awards on outstanding bids and successfully pursuing future opportunities, successfully perform and realize revenue as a result of the multi-year extension of existing business and the expansion of the Eversource Energy Master Service Agreement, achieve higher growth and increased margins in 2023 and beyond and successfully achieve its growth, strategic and business development initiatives, including decreasing the Company’s outstanding indebtedness, future demand for the Company’s services, and expectations regarding future revenues, cash flow, and other related matters. These statements reflect the Company’s current views of future events and financial performance and are subject to a number of risks and uncertainties, including implementation of the Company’s liquidity plan and its ability to continue as a going concern, the Company’s level of indebtedness and ability to make payments on, and satisfy the financial and other covenants contained in, its amended debt facilities, as well as its ability to engage in certain transactions and activities due to limitations and covenants contained in such facilities; its ability to generate sufficient cash resources to continue funding operations, including investments in working capital required to support growth-related commitments that it makes to customers, and the possibility that it may be unable to obtain any additional funding as needed or incur losses from operations in the future; exposure to market risks from changes in interest rates; the Company’s ability to obtain adequate surety bonding and letters of credit; the Company’s ability to maintain effective internal control over financial reporting and disclosure controls and procedures; the Company’s ability to attract and retain qualified personnel, skilled workers, and key officers; failure to successfully implement or realize its business strategies, plans and objectives of management, and liquidity, operating and growth initiatives and opportunities, including any expansion into new markets and its ability to identify potential candidates for, and consummate, acquisition, disposition, or investment transactions; the loss of one or more of its significant customers; its competitive position; market outlook and trends in the Company’s industry, including the possibility of reduced investment in, or increased regulation of, nuclear power plants, declines in public infrastructure construction, and reductions in government funding; costs exceeding estimates the Company uses to set fixed-price contracts; harm to the Company’s reputation or profitability due to, among other things, internal operational issues, poor subcontractor performances or subcontractor insolvency; potential insolvency or financial distress of third parties, including customers and suppliers; the Company’s contract backlog and related amounts to be recognized as revenue; its ability to maintain its safety record, the risks of potential liability and adequacy of insurance; adverse changes in the Company’s relationships with suppliers, vendors, and subcontractors, including increases in cost, disruption of supply or shortage of labor, freight, equipment or supplies, including as a result of the COVID-19 pandemic; compliance with environmental, health, safety and other related laws and regulations, including those related to climate change; limitations or modifications to indemnification regulations of the U.S.; the Company’s expected financial condition, future cash flows, results of operations and future capital and other expenditures; the impact of unstable market and economic conditions on our business, financial condition and stock price, including inflationary cost pressures, supply chain disruptions and constraints, labor shortages, the effects of the Ukraine-Russia conflict and ongoing impact of COVID-19, and a possible recession; our ability to meet publicly announced guidance or other expectations about our business, key metrics and future operating results; the impact of the COVID-19 pandemic on the Company’s business, results of operations, financial condition, and cash flows, including global supply chain disruptions and the potential for additional COVID-19 cases to occur at the Company’s active or future job sites, which potentially could impact cost and labor availability; information technology vulnerabilities and cyberattacks on the Company’s networks; the Company’s failure to comply with applicable laws and regulations, including, but not limited to, those relating to privacy and anti-bribery; the Company’s ability to successfully implement its new enterprise resource planning (ERP) system; the Company’s participation in multiemployer pension plans; the impact of any disruptions resulting from the expiration of collective bargaining agreements; the impact of natural disasters, which may worsen or increase due to the effects of climate change, and other severe catastrophic events (such as the ongoing COVID-19 pandemic); the impact of corporate citizenship and environmental, social and governance matters; the impact of changes in tax regulations and laws, including future income tax payments and utilization of net operating loss and foreign tax credit carryforwards; volatility of the market price for the Company’s common stock; the Company’s ability to maintain its stock exchange listing; the effects of anti-takeover provisions in the Company’s organizational documents and Delaware law; the impact of future offerings or sales of the Company’s common stock on the market price of such stock; expected outcomes of legal or regulatory proceedings and their anticipated effects on the Company’s results of operations; and any other statements regarding future growth, future cash needs, future operations, business plans and future financial results.

Other important factors that may cause actual results to differ materially from those expressed in the forward-looking statements are discussed in the Company’s filings with the U.S. Securities and Exchange Commission, including the “Risk Factors” section of the Annual Report on Form 10-K for its 2021 fiscal year and its Quarterly Report on Form 10-Q for the quarter ended September 30, 2022. Any forward-looking statement speaks only as of the date of this press release. Except as may be required by applicable law, the Company undertakes no obligation to publicly update or revise any forward-looking statements, whether as a result of new information, future events or otherwise, and you are cautioned not to rely upon them unduly.

Financial Tables Follow

WILLIAMS INDUSTRIAL SERVICES GROUP INC. AND SUBSIDIARIES

CONDENSED CONSOLIDATED STATEMENTS OF OPERATIONS (UNAUDITED)


Three Months Ended September 30,


Nine Months Ended September 30,

($ in thousands, except share and per share amounts)


2022


2021


2022


2021

Revenue


$

56,685


$

73,351


$

182,303


$

225,773


Cost of revenue


55,936


66,590


173,564


203,561


Gross profit


749


6,761


8,739


22,212


Gross margin


1.3

%


9.2

%


4.8

%


9.8

%


Selling and marketing expenses


322


267


1,054


709


General and administrative expenses


6,657


4,248


19,022


16,931


Depreciation and amortization expense


61


50


173


137


Total operating expenses


7,040


4,565


20,249


17,777


Operating income (loss)


(6,291

)


2,196


(11,510

)


4,435


Operating margin


(11.1

)%


3.0

%


(6.3

)%


2.0

%


Interest expense, net


1,485


1,227


3,965


3,733


Other (income) expense, net


(11,114

)


181


(11,533

)


(1,411

)

Total other (income) expense, net


(9,629

)


1,408


(7,568

)


2,322


Income (loss) from continuing operations before income tax


3,338


788


(3,942

)


2,113


Income tax expense (benefit)


(272

)


(6

)


(214

)


256


Income (loss) from continuing operations


3,610


794


(3,728

)


1,857


Income (loss) from discontinued operations before income tax


(45

)


(34

)


(92

)


130


Income tax expense (benefit)


(3

)


22


(626

)


59


Income (loss) from discontinued operations


(42

)


(56

)


534


71


Net income (loss)


$

3,568


$

738


$

(3,194

)


$

1,928


Basic income (loss) per common share


Income (loss) from continuing operations


$

0.14


$

0.03


$

(0.14

)


$

0.07


Income (loss) from discontinued operations


(0.00

)


(0.00

)


0.02


0.00


Basic income (loss) per common share


$

0.14


$

0.03


$

(0.12

)


$

0.07


Diluted income (loss) per common share


Income (loss) from continuing operations


$

0.14


$

0.03


$

(0.14

)


$

0.07


Income (loss) from discontinued operations


(0.01

)


(0.00

)


0.02


0.00


Diluted income (loss) per common share


$

0.13


$

0.03


$

(0.12

)


$

0.07


Weighted average common shares outstanding (basic)


26,102,308


25,699,545


26,009,465


25,306,130


Weighted average common shares outstanding (diluted)


26,437,681


26,506,575


26,009,465


26,097,700

WILLIAMS INDUSTRIAL SERVICES GROUP INC. AND SUBSIDIARIES

REVENUE BRIDGE ANALYSIS*


Third Quarter 2022 Revenue Bridge


(in millions)


$ Change

Third quarter 2021 revenue


$

73.4


Decommissioning


(13.5

)

Canada Nuclear


(9.0

)

U.S. Nuclear


(4.0

)

Energy Delivery


4.1


Chemical


2.1


Water


2.1


Other


1.5


Total change


(16.7

)

Third quarter 2022 revenue*


$

56.7


*Numbers may not sum due to rounding

WILLIAMS INDUSTRIAL SERVICES GROUP INC. AND SUBSIDIARIES
GROSS MARGIN RECONCILIATION
NON-GAAP FINANCIAL MEASURE (UNAUDITED)


The following table reconciles adjusted gross margin to actual gross margin by deducting the energy transmission and distribution projects that are incurring start-up costs and lump sum projects in the water markets that are generating a loss. The Company believes this information is meaningful as it isolates the impact that the start-up costs and the non-profitable lump sum projects have on gross margin. Because adjusted gross margin is not calculated in accordance with GAAP, it may not be comparable to other similarly titled measures of other companies and should not be considered in isolation or as substitute for, or superior to, financial measures prepared in accordance with GAAP.


(in thousands)


Three Months Ended September 30, 2022


Nine Months Ended June 30, 2022

Revenue


$

56,685


$

182,303


Cost of revenue


55,936


173,564


Gross profit


749


8,739


Gross margin


1.3

%


4.8

%


Minus: revenue from transmission and distribution start-up business


(2,900

)


(5,440

)

Minus: revenue from Florida lump sum water projects


(3,322

)


(16,995

)

Minus: total revenue deducted


(6,222

)


(22,435

)


Minus: cost of revenue from transmission and distribution start-up business


(3,622

)


(8,947

)

Minus: cost of revenue from the Florida lump sum water projects


(6,759

)


(22,178

)

Minus: total cost of revenue deducted


(10,381

)


(31,125

)


Adjusted revenue


50,463


159,868


Adjusted cost of revenue


45,555


142,439


Adjusted gross profit


$

4,908


$

17,429


Adjusted gross profit margin


9.7

%


10.9

%

WILLIAMS INDUSTRIAL SERVICES GROUP INC. AND SUBSIDIARIES

CONDENSED CONSOLIDATED BALANCE SHEETS (UNAUDITED)


September 30,


December 31,

($ in thousands, except per share amounts)


2022


2021

ASSETS


Current assets:


Cash and cash equivalents


$

1,013


$

2,482


Restricted cash


468


468


Accounts receivable, net of allowance of $318 and $427, respectively


37,339


35,204


Contract assets


10,076


12,683


Other current assets


10,675


11,049


Total current assets


59,571


61,886


Property, plant and equipment, net


1,016


653


Goodwill


35,400


35,400


Intangible assets, net


12,500


12,500


Other long-term assets


7,732


5,712


Total assets


$

116,219


$

116,151


LIABILITIES AND STOCKHOLDERS’ EQUITY


Current liabilities:


Accounts payable


$

11,732


$

12,168


Accrued compensation and benefits


14,312


12,388


Contract liabilities


3,440


3,412


Short-term borrowings


14,525


676


Current portion of long-term debt


1,050


1,050


Other current liabilities


4,630


11,017


Current liabilities of discontinued operations


106


316


Total current liabilities


49,795


41,027


Long-term debt, net


21,809


30,328


Deferred tax liabilities


2,263


2,442


Other long-term liabilities


4,440


1,647


Long-term liabilities of discontinued operations


3,513


4,250


Total liabilities


81,820


79,694


Commitments and contingencies


Stockholders’ equity:


Common stock, $0.01 par value, 170,000,000 shares authorized and 26,865,064 and 26,408,789 shares issued, respectively, and 26,422,761 and 25,939,621 shares outstanding, respectively


264


261


Paid-in capital


93,705


92,227


Accumulated other comprehensive loss


(440

)


(95

)

Accumulated deficit


(59,124

)


(55,930

)

Treasury stock, at par (442,303 and 469,168 common shares, respectively)


(6

)


(6

)

Total stockholders’ equity


34,399


36,457


Total liabilities and stockholders’ equity


$

116,219


$

116,151


Contacts

Chris Witty
Darrow Associates
646-345-0998
This email address is being protected from spambots. You need JavaScript enabled to view it.


Read full story here

Rep. Mikie Sherrill and Bloomfield Leaders Visit Store to Celebrate New Electric Vehicle Charging Stalls

BLOOMFIELD, N.J.--(BUSINESS WIRE)--The newly renovated Brookdale ShopRite today hosted a ribbon cutting ceremony to debut an EVgo Inc. (NASDAQ: EVGO) (EVgo) electric vehicle (EV) fast charging station at its 1409 Broad Street parking lot in Bloomfield, NJ.


This EVgo charging station features charging from 100kW up to 350kW and can serve four vehicles simultaneously. The station was supported with funding through the PSE&G Electric Vehicle Charging Program, which is designed to support the deployment of EV chargers for a range of customers. This latest launch is part of a push to install and offer charging stations in communities where ShopRite stores operate. EVgo is one of the nation’s largest public fast charging networks for EVs and is powered by 100% renewable energy.

“We are excited to work with EVgo to unveil this new charging station for our ShopRite customers and the people of Bloomfield,” said Neil Greenstein, a third-generation grocer and owner and operator of Brookdale ShopRite. “We recently completed an extensive renovation of the Brookdale store, and the next step was providing a fast electric vehicle charging station in our parking lot. At ShopRite, we are always looking for ways to provide the best possible shopping experience for our customers, and making it easier for people to charge their electric vehicles is part of that commitment.”

A family-owned business that has served the local community for more than 50 years, Brookdale ShopRite completed an extensive remodel earlier this year that included storewide upgrades, new departments and fresh food offerings, and the installation of new energy efficient LED lighting and refrigerated cases.

The new EVgo charging station outside the store complements all the great work inside the store and is available to both customers shopping in-store and people in the community.

Greenstein was joined at the ribbon cutting by community leaders and guests, including Congresswoman Mikie Sherrill, Bloomfield Mayor Michael J. Venezia, Essex County Commissioner VP Carlos Pomares and Councilman Nicholas Joanow.

“EVgo builds charging stations in convenient locations where drivers can charge their EV while completing their everyday activities, like going to the grocery store,” said Stacy Huston, Director of Portfolio Accounts at EVgo. “As more drivers transition to electric vehicles, EVgo is excited to expand partnerships with site hosts like Brookdale ShopRite to increase access to EV charging and build more infrastructure in communities in New Jersey and beyond.”

ShopRite has supported sustainability efforts – both in stores and communities – for more than four decades and plans to add more electric vehicle charging stations to its stores, enabling additional drivers to go electric with convenient access to public charging. Wakefern Food Corp., the logistics, distribution and merchandising arm of ShopRite, is working with Wakefern Members and stores to identify locations for new charging stations.

“Wakefern’s electric vehicle charging initiative is important to the cooperative and our supermarket banners. This is an ambitious effort to work with providers to bring this critical infrastructure to many of our stores and communities,” said Andrew Pittel, manager of real estate at Wakefern.

EVgo fast charging stations are compatible with all fast-charge capable EV models currently on the market such as the Chevrolet Bolt EV, GMC Hummer EV, Kia EV6, the Nissan LEAF and more. EV drivers can easily initiate a fast charging session on the network with the EVgo app, EVgo program card (RFID card), EVgo Autocharge+ or credit card. In addition, all drivers with an EVgo account can earn points toward a charging credit through EVgo Rewards™.

The EVgo network has more than 850 public fast charging locations and serves over 60 metropolitan areas across more than 30 states, including nearly 20 EVgo fast charging locations across the Garden State. New Jersey is a leader in electric vehicle adoption on the East Coast, and public EV fast charging stations are important to helping the state reach its goal of reducing greenhouse gas emissions by 50 percent by 2030.

About ShopRite

ShopRite is the registered trademark of Wakefern Food Corp., a retailer-owned cooperative based in Keasbey, NJ, and the largest supermarket cooperative in the United States. With hundreds of supermarkets located throughout New Jersey, New York, Pennsylvania, Connecticut, Delaware and Maryland, ShopRite serves millions of customers each week. Through its ShopRite Partners In Caring program, ShopRite is dedicated to fighting hunger in the communities it serves. Since the program began in 1999, ShopRite Partners In Caring has donated nearly $62 million to food banks that support more than 2,200 worthy charities. As a title sponsor of the ShopRite LPGA Classic Presented by Acer, ShopRite has donated more than $35 million to local organizations, hospitals and community groups. For more information, please visit www.shoprite.com.

About EVgo

EVgo (Nasdaq: EVGO) is a leader in charging solutions, building and operating the infrastructure and tools needed to expedite the mass adoption of electric vehicles for individual drivers, rideshare and commercial fleets, and businesses. Since its founding in 2010, EVgo has led the way to a cleaner transportation future and its network has been powered by 100% renewable energy since 2019 through renewable energy certificates. As one of the nation’s largest public fast charging networks, EVgo’s owned and operated charging network features over 850 fast charging locations – currently serving over 60 metropolitan areas across more than 30 states – and continues to add more DC fast charging locations through EVgo eXtend™, its white label service offering. EVgo is accelerating transportation electrification through partnerships with automakers, fleet and rideshare operators, retail hosts such as grocery stores, shopping centers, and gas stations, policy leaders, and other organizations. With a rapidly growing network, robust software products and unique service offerings for drivers and partners including EVgo Optima™, EVgo Inside™, EVgo Rewards™, and Autocharge+, EVgo enables world-class charging experience where drivers live, work, travel and play.


Contacts

For Investors:
This email address is being protected from spambots. You need JavaScript enabled to view it.

For Media:
This email address is being protected from spambots. You need JavaScript enabled to view it.

NEWCASTLE & HOUSTON--(BUSINESS WIRE)--TechnipFMC (NYSE: FTI) announced today that Doug Pferdehirt, Chair and Chief Executive Officer, will address attendees on Wednesday, November 16, at 3:30 p.m. EST at the following event:


BofA Securities 2022 Global Energy Conference
November 15 – 18, 2022

Location: 1 Hotel South Beach, 2341 Collins Ave, Miami Beach, FL 33139

The live webcast will be available at the time of the event and can be accessed at the Investor Relations website. There will be no presentation materials associated with the event.

About TechnipFMC

TechnipFMC is a leading technology provider to the traditional and new energy industries, delivering fully integrated projects, products, and services.

With our proprietary technologies and comprehensive solutions, we are transforming our clients’ project economics, helping them unlock new possibilities to develop energy resources while reducing carbon intensity and supporting their energy transition ambitions.

Organized in two business segments – Subsea and Surface Technologies – we will continue to advance the industry with our pioneering integrated ecosystems (such as iEPCI™, iFEED™ and iComplete™), technology leadership and digital innovation.

Each of our approximately 20,000 employees is driven by a commitment to our clients’ success, and a culture of strong execution, purposeful innovation, and challenging industry conventions.

TechnipFMC uses its website as a channel of distribution of material company information. To learn more about how we are driving change in the industry, go to www.TechnipFMC.com and follow us on Twitter @TechnipFMC.


Contacts

Investor relations
Matt Seinsheimer
Senior Vice President, Investor Relations and Corporate Development
Tel: +1 281 260 3665
Email: This email address is being protected from spambots. You need JavaScript enabled to view it.

James Davis
Senior Manager, Investor Relations
Tel: +1 281 260 3665
Email: This email address is being protected from spambots. You need JavaScript enabled to view it.

Media relations
Nicola Cameron
Vice President, Corporate Communications

Tel: +44 1383 742297
Email: This email address is being protected from spambots. You need JavaScript enabled to view it.

Catie Tuley
Director, Public Relations
Tel: +1 281 591 5405
Email: This email address is being protected from spambots. You need JavaScript enabled to view it.

LIBERTY LAKE, Wash.--(BUSINESS WIRE)--#IIoT--Itron, Inc. (NASDAQ: ITRI), which is innovating the way utilities and cities manage energy and water, announced that PUB, Singapore’s national water agency, is leveraging SP Group’s existing Itron industrial IoT network canopy for smart water metering. The smart water metering rollout will connect some 300,000 Itron residential and C&I smart water meters to the existing network to achieve its water conservation goals.


The deployment, which is managed by Singapore’s national electricity and gas network operator, SP Group, is an important part of PUB’s Smart Water Meter Program, which aims to transform the organization into a smart utility. The first phase of the Smart Water Meter Program will be rolled out in Bukit Batok, Hougang, Jurong West, Tampines and Tuas, as well as in the new housing estates of Tampines North and Tengah.

With smart water meters, meter readings can be done remotely on a daily basis, eliminating the labor-intensive manual meter reading process which is currently read every two months. Households and businesses can track their daily water usage on their MySmartWaterMeter account, hence giving them greater visibility and control over their water usage to conserve resources. Users can also receive timely notifications on high usage and suspected leaks in their household or premises. This will enable households and non-domestic customers to better understand their water usage pattern, be empowered to adjust their water habits, and ultimately, save on utility bills. The rollout of smart meters at scale will be a major boost to water conservation efforts.

“We are excited to see SP Group’s existing Itron network canopy be used for the Smart Water Meter Program in Singapore. This deployment truly demonstrates the power and potential of a high-performance, multi-application industrial IoT network,” said John Marcolini, senior vice president of Networked Solutions at Itron. “As part of this project, we look forward to helping PUB meet its water conservation goals and furthering Itron’s vision to create a more resourceful world.”

About Itron

Itron enables utilities and cities to safely, securely and reliably deliver critical infrastructure solutions to communities in more than 100 countries. Our portfolio of smart networks, software, services, meters and sensors helps our customers better manage electricity, gas and water resources for the people they serve. By working with our customers to ensure their success, we help improve the quality of life, ensure the safety and promote the well-being of millions of people around the globe. Itron is dedicated to creating a more resourceful world. Join us: www.itron.com.

Itron® is a registered trademark of Itron, Inc. All third-party trademarks are property of their respective owners and any usage herein does not suggest or imply any relationship between Itron and the third party unless expressly stated.


Contacts

Itron, Inc.
Alison Mallahan
Senior Manager, Corporate Communications
509-891-3802
This email address is being protected from spambots. You need JavaScript enabled to view it.

Second Quarter Revenues of $20.8M, up 21% from $17.2M in the Second Quarter Last Year and up 18% Year-over-Year for the First Half of Fiscal 2023

Second Quarter Adjusted EBITDA Improved 19% Year-over-Year and 66% Year-over-Year for the First Half of Fiscal 2023

LOS ANGELES--(BUSINESS WIRE)--$CGRN #Biogas--Capstone Green Energy Corporation (NASDAQ: CGRN), announced its financial results for the second quarter ended September 30, 2022, as the Company continues to execute on its Energy-as-a-Service (EaaS) business plan.


Second Quarter and First Half Fiscal 2023 Highlights:

  • Revenues for the second quarter ending September 30, 2022, were $20.8 million, up 11% from $18.7 million in revenue during the first quarter ended June 30, 2022, and up 21% from $17.2 million in the year-ago September quarter.
  • Revenues for the first half of fiscal 2023 totaled $39.4 million, up 18% from $33.3 million from the first half of fiscal 2022, as the Company executes its EaaS growth strategy.
  • Gross margins for the second quarter ending September 30, 2022, were 11% compared to 25% in the first quarter, which ended June 30, 2022. Gross margins decreased primarily due to increased costs in the company's supply chain, specifically related to C1000 enclosures and the need to source alternative recuperator materials at a higher relative cost to meet customer delivery requirements.
  • Net loss of $4.9 million for the second quarter ending September 30, 2022, improved 18% from a net loss of $6.0 million in the year-ago September quarter. Net loss increased from $2.1 million from the first quarter 2023, in large part due to approximately $1.6 million of additional supply chain expenses, freight and expediting charges.
  • Adjusted EBITDA improved 19% to negative $2.2 million from negative $2.7 million in the second quarter year-over-year but decreased from a positive $0.4 million for the first quarter ending June 30, 2022, in part as a result of the approximately $1.6 million of additional supply chain expenses, freight and expediting charges.
  • Adjusted EBITDA improved 66% to negative $1.7 million for the first half of fiscal 2023 compared to negative $5.0 million in the first half of fiscal 2022 as a result of the continued growth of the high-margin EaaS business and reduced operating expenses offset by the additional supply chain expenses, freight and expediting charges.
  • EaaS long-term rental units and re-rental units under contract on September 30, 2022, totaled approximately 34 MW versus 12.7 MW on September 30, 2021, representing 168% growth year-over-year. Today, the EaaS long-term rental units under contract are approximately 39 MW, representing significant progress toward the company's goal of 50 MW under contract by March 31, 2023.
  • Total revenue from EaaS rentals was $1.8 million for the second quarter, up $1.2 million or 200% from $0.6 million year-over-year. The gross margin for the EaaS rental business continued to be strong at 72% for the second quarter.
  • Gross product bookings for the second quarter ending September 30, 2022, were robust at $15.4 million, up from $12.4 million in the previous quarter ended June 30, 2022, demonstrating the ongoing success of the company's current growth strategy.
  • The product Book-to-Bill Ratio improved to 1.6:1 in the second quarter ending September 30, 2022. The ending product backlog on September 30, 2022, was $28.9 million, up $4.1 million or 16.5% from $24.8 million on June 30, 2022.
  • Total cash as of September 30, 2022, was $23.8 million, up from $16.9 million as of June 30, 2022. The increase of $6.9 million was primarily related to the net proceeds of the $7.3 million Lake Street public equity offering on August 23, 2022.
  • Net cash provided by operating activities was $0.9 million, primarily as a result of $3.8 million in cash provided by working capital as the company’s Days Sales Outstanding, or DSO, dropped from 123 days in the quarter ending June 30, 2022, to 85 days in the most recent quarter.
  • To mitigate global supply chain shortages, parts price increases, and higher freight costs, the Company plans to enact a new across-the-board product, spare parts, and FPP service contract price increase on January 30, 2023 in addition to remediating the recent higher costs associated with C1000 enclosures and recuperator materials.

"The top-line revenue growth in our second quarter is very encouraging and reinforces our belief in our strategic direction. However we faced a strong headwind in significantly higher C1000 enclosure costs and expensive alternative recuperator materials that we needed to procure in order to maintain our customers’ scheduled deliveries. We believe these cost increases are short-term and expect to work through both of these supply chain issues in the current quarter. We look forward to a return to more normal Adjusted EBITDA results in the fourth quarter and beyond as costs normalize,” said Darren Jamison, President and Chief Executive Officer of Capstone Green Energy.

“The most important take-away from our second quarter results is the continued growth of our EaaS rental business and the benefits it brings. Specifically, it drives higher margins, generates more constant and predictable revenue, and enables us to leverage a more streamlined staffing model relative to that of a traditional industrial manufacturing company. Furthermore, the solution is attractive to our customers across various industries as it helps them to manage capital costs and meet environmental impact targets directly, while generating an attractive return for Capstone and our stockholders," continued Jamison.

"Capstone’s key goals for the current fiscal year remain growing the top-line and achieving positive Adjusted EBITDA on a sustainable basis. We intend to accomplish this by accelerating the growth of our EaaS business and boosting balance sheet liquidity through a combination of revenue growth and leveraging the benefits from last year’s cost reduction efforts. We see several factors helping to drive the growth, including the efforts of our Capstone Direct Sales organization, expansion of our global Distribution network, and increased demand related to the US Inflation Reduction Act (IRA). Not only do we expect these factors to drive growth in the second half of this year, but we also expect to see continued tailwinds well into next year,” concluded Mr. Jamison.

The signing of the Inflation Reduction Act (IRA) in September was pivotal event for Capstone and its customers. For example, the tax credit available to microturbine combined heat and power (CHP) projects, which is a common customer solution for Capstone, will increase from 10% to 30% for projects that are placed in service or safe harbored by the end of 2024, and the IRA reinstates the tax credit for biogas energy projects. This is significant incentive for these projects and is expected to provide a robust backdrop for Capstone’s CHP technology platform.

Additionally, a bonus credit of 10% is available for projects that meet domestic content requirements or are in energy communities. Capstone expects its US based manufacturing facility to be eligible for the domestic production credit to further bolster the attractiveness and economics of our products. The legislation also adds new covered technologies, including energy storage, microgrid controllers, and hydrogen production facilities, several of which relate to Capstone’s core products.

About Capstone Green Energy

Capstone Green Energy (NASDAQ: CGRN) is a leading provider of customized microgrid solutions and on-site energy technology systems focused on helping customers around the globe meet their environmental, energy savings, and resiliency goals. Capstone Green Energy focuses on four key business lines. Through its Energy as a Service (EaaS) business, it offers rental solutions utilizing its microturbine energy systems and battery storage systems, comprehensive Factory Protection Plan (FPP) service contracts that guarantee life-cycle costs, as well as aftermarket parts. Energy Generation Technologies (EGT) are driven by the Company's industry-leading, highly efficient, low-emission, resilient microturbine energy systems offering scalable solutions in addition to a broad range of customer-tailored solutions, including hybrid energy systems and larger frame industrial turbines. The Energy Storage Solutions (ESS) business line designs and installs microgrid storage systems creating customized solutions using a combination of battery technologies and monitoring software. Through Hydrogen & Sustainable Products (H2S), Capstone Green Energy offers customers a variety of hydrogen products, including the Company's microturbine energy systems.

To date, Capstone has shipped over 10,000 units to 83 countries and estimates that in FY22 it saved customers over $213 million in annual energy costs and approximately 388,000 tons of carbon. Total savings over the last four years are estimated to be approximately $911 million in energy savings and approximately 1,503,100 tons of carbon savings.

For customers with limited capital or short-term needs, Capstone offers rental systems; for more information, contact: This email address is being protected from spambots. You need JavaScript enabled to view it..

For more information about the Company, please visit www.CapstoneGreenEnergy.com. Follow Capstone Green Energy on Twitter, LinkedIn, Instagram, Facebook, and YouTube.

Cautionary Note Regarding Forward-Looking Statements

This release contains forward-looking statements as defined in the Private Securities Litigation Reform Act of 1995, including statements regarding growth in the Company’s EAAS business, expectations regarding future costs (including the anticipated impact of cost reduction efforts), supply chain issues and liquidity and other statements regarding the Company's expectations, beliefs, plans, intentions, and strategies. The Company has tried to identify these forward-looking statements by using words such as "expect," "anticipate," "believe," "could," "should," "estimate," "intend," "may," "will," "plan," "goal" and similar terms and phrases, but such words, terms and phrases are not the exclusive means of identifying such statements. Actual results, performance and achievements could differ materially from those expressed in, or implied by, these forward-looking statements due to a variety of risks, uncertainties and other factors, including, but not limited to, the following: worldwide supply chain issues that affect the Company’s ability get direct material products on a timely and cost-effective basis cost; the ongoing effects of the COVID-19 pandemic; the availability of credit, compliance with the agreements governing the Company's senior secured indebtedness and the Company’s ability to refinance that indebtedness; the Company's ability to develop new products and enhance existing products; product quality issues, including the adequacy of reserves therefor and warranty cost exposure; intense competition; financial performance of the oil and natural gas industry and other general business, industry and economic conditions; the Company's ability to adequately protect its intellectual property rights; and departures and other changes in management and other key employees. For a detailed discussion of factors that could affect the Company's future operating results, please see the Company's filings with the Securities and Exchange Commission, including the disclosures under "Risk Factors" in those filings. Except as expressly required by the federal securities laws, the Company undertakes no obligation to update or revise any forward-looking statements, whether as a result of new information, changed circumstances or future events, or for any other reason.

CAPSTONE GREEN ENERGY CORPORATION AND SUBSIDIARIES

CONDENSED CONSOLIDATED BALANCE SHEETS

(In thousands, except share amounts)

(Unaudited)


September 30,


March 31,


2022


2022


Assets


Current Assets:


Cash and cash equivalents

$

23,780


$

22,559


Accounts receivable, net of allowances of $916 at September 30, 2022 and $845 at March 31, 2022


18,189


24,665


Inventories, net


21,801


18,465


Prepaid expenses and other current assets


7,039


5,519


Total current assets


70,809


71,208


Property, plant, equipment and rental assets, net


25,375


18,038


Non-current portion of accounts receivable


1,109


1,212


Non-current portion of inventories


2,277


1,680


Other assets


11,735


8,635


Total assets

$

111,305


$

100,773


Liabilities and Stockholders’ Equity


Current Liabilities:


Accounts payable and accrued expenses

$

24,344


$

25,130


Accrued salaries and wages


1,123


1,147


Accrued warranty reserve


1,662


1,483


Deferred revenue


10,686


9,185


Current portion of notes payable and lease obligations


3,215


675


Total current liabilities


41,030


37,620


Deferred revenue - non-current


915


981


Term note payable, net


50,966


50,949


Long-term portion of notes payable and lease obligations


12,321


5,809


Total liabilities


105,232


95,359


Commitments and contingencies (Note 14)


Stockholders’ Equity:


Preferred stock, $.001 par value; 1,000,000 shares authorized; none issued


Common stock, $.001 par value; 51,500,000 shares authorized, 18,449,567 shares issued and 18,332,553 shares outstanding at September 30, 2022; 15,398,368 shares issued and 15,296,735 shares outstanding at March 31, 2022


18


15


Additional paid-in capital


954,750


946,969


Accumulated deficit


(946,556

)


(939,482

)


Treasury stock, at cost; 117,014 shares at September 30, 2022 and 101,633 shares at March 31, 2022


(2,139

)


(2,088

)


Total stockholders’ equity


6,073


5,414


Total liabilities and stockholders' equity $

111,305

$

100,773


CAPSTONE GREEN ENERGY CORPORATION AND SUBSIDIARIES

CONDENSED CONSOLIDATED STATEMENTS OF OPERATIONS

(In thousands, except per share data)

(Unaudited)


Three Months Ended

Six Months Ended


September 30,


September 30,


2022


2021


2022


2021


Revenue:


Product and accessories


$

10,603


$

8,465


$

19,770


$

16,854


Parts, service and rentals


10,172


8,731


19,657


16,424


Total revenue


20,775


17,196


39,427


33,278


Cost of goods sold:


Product and accessories


12,496


8,797


21,387


17,790


Parts, service and rentals


6,103


5,689


11,158


10,130


Total cost of goods sold


18,599


14,486


32,545


27,920


Gross margin


2,176


2,710


6,882


5,358


Operating expenses:


Research and development


603


987


1,093


1,870


Selling, general and administrative


5,107


6,438


10,026


11,762


Total operating expenses


5,710


7,425


11,119


13,632


Loss from operations


(3,534

)


(4,715

)


(4,237

)


(8,274

)

Other income


(50

)


(5

)


(48

)


660


Interest income


26


6


32


11


Interest expense


(1,356

)


(1,278

)


(2,718

)


(2,513

)

Gain (loss) on debt extinguishment


1,950


Loss before provision for income taxes


(4,914

)


(5,992

)


(6,971

)


(8,166

)

Provision for income taxes


4


2


6


10


Net loss


(4,918

)


(5,994

)


(6,977

)


(8,176

)

Less: Deemed dividend on purchase warrant for common shares


97


97


Net loss attributable to common stockholders


$

(5,015

)


$

(5,994

)


$

(7,074

)


$

(8,176

)


Net loss per common share attributable to common stockholders—basic and diluted


$

(0.30

)


$

(0.40

)


$

(0.44

)


$

(0.58

)

Weighted average shares used to calculate basic and diluted net loss per common share attributable to common stockholders


16,785


15,167


16,056


14,202


CAPSTONE GREEN ENERGY CORPORATION AND SUBSIDIARIES

RECONCILIATION OF NON-GAAP FINANCIAL MEASURE

(In thousands, except per share data)

(Unaudited)


Three Months Ended
September 30,


Six Months Ended
September 30,

Reconciliation of Reported Net Loss to EBITDA and Adjusted EBITDA


2022


2021


2022


2021


Net loss, as reported


$

(4,918

)


$

(5,994

)


$

(6,977

)


$

(8,176

)

Interest expense


1,361


1,278


2,723


2,513


Provision for income taxes


4


2


6


10


Depreciation and amortization


831


458


1,526


844


EBITDA


$

(2,722

)


$

(4,256

)


$

(2,722

)


$

(4,809

)


Gain on debt extinguishment


(1,950

)

Additional PPP Loan forgiveness


(660

)

Stock-based compensation and other expense


154


780


386


1,650


Debt compliance costs/legal settlements


387


750


587


750


Adjusted EBITDA


$

(2,181

)


$

(2,726

)


$

(1,749

)


$

(5,019

)

To supplement the company’s unaudited financial data presented on a generally accepted accounting principles (GAAP) basis, management has presented Adjusted EBITDA, a non-GAAP financial measure. This non-GAAP financial measure is among the indicators management uses as a basis for evaluating the company’s financial performance as well as for forecasting future periods. Management establishes performance targets, annual budgets and makes operating decisions based in part upon this metric. Accordingly, disclosure of this non-GAAP financial measure provides investors with the same information that management uses to understand the company’s economic performance year-over-year.

EBITDA is defined as net income before interest, provision for income taxes, and depreciation and amortization expense. Adjusted EBITDA is defined as EBITDA before gain on debt extinguishment, additional PPP loan forgiveness, stock-based compensation, consulting and legal expenses related to compliance with debt covenants, and legal settlements. Gain on debt extinguishment and additional PPP loan forgiveness relates to the Paycheck Protection Program loan forgiveness. Stock-based compensation and other expense includes expense related to stock issued to employees, directors, vendors, and for extraordinary, non-recurring expenses.

Adjusted EBITDA is not a measure of the company’s liquidity or financial performance under GAAP and should not be considered as an alternative to net income or any other performance measure derived in accordance with GAAP, or as an alternative to cash flows from operating activities as a measure of its liquidity.

While management believes that the non-GAAP financial measure provides useful supplemental information to investors, there are limitations associated with the use of this measure. The measures are not prepared in accordance with GAAP and may not be directly comparable to similarly titled measures of other companies due to potential differences in the exact method of calculation. Management compensates for these limitations by relying primarily on the company’s GAAP results and by using Adjusted EBITDA only supplementally and by reviewing the reconciliations of the non-GAAP financial measure to its most comparable GAAP financial measure.

Non-GAAP financial measures are not in accordance with, or an alternative for, generally accepted accounting principles in the United States. The company’s non-GAAP financial measures are not meant to be considered in isolation or as a substitute for comparable GAAP financial measures and should be read only in conjunction with the company’s consolidated financial statements prepared in accordance with GAAP.


Contacts

Capstone Green Energy
Investor and investment media inquiries:
818-407-3628
This email address is being protected from spambots. You need JavaScript enabled to view it.

TULSA, Okla.--(BUSINESS WIRE)--Empire Petroleum (NYSE American: EP) (“Empire” or the “Company”), today reported operational and financial results for the third quarter of 2022.


KEY THIRD QUARTER 2022 HIGHLIGHTS

  • Increased sales volumes by 3% to 2,232 barrels of oil equivalent per day (“Boe/d”) (60% oil, 19% natural gas and 21% natural gas liquids (“NGLs”)) from 2,158 Boe/d (62% oil, 18% natural gas and 20% NGLs) for the second quarter of 2022;
  • Recorded revenue of $14.8 million that resulted in net income of $0.2 million, or $0.01 per diluted share, and Adjusted Net Income1 of $3.7 million, or $0.16 per diluted share;
  • Generated Adjusted EBITDA1 of $4.8 million, or $23.36 per barrel of oil equivalent (“Boe”);
  • Increased cash position in the third quarter by 27% to $15.7 million, reduced debt $0.4 million to $7.8 million during the quarter, and ended the period with $16.0 million of liquidity; and
  • Made significant progress on the Company’s Starbuck Field Enhancement Program (the “Starbuck Program”), including beginning the waterflood conformance phase, re-perforated and stimulated productive intervals to ensure maximum hydrocarbon recovery, completed seven sidetracks, and finished certain surface facility upgrades that began in 2021. The Starbuck Program is targeted to provide a material increase in production and reserves, with the first three phases of the project expected to be completed by the end of 2022.; and
  • Spudded four new non-operated Bakken wells with completion expected during the fourth quarter of 2022.
  1. Adjusted Net Income, EBITDA and Adjusted EBITDA are non-GAAP financial measures. See “Non-GAAP Information” section later in this release for more information including reconciliations to the most comparable GAAP measure.

MANAGEMENT COMMENTARY

Tommy Pritchard, Chief Executive Officer of Empire, commented, “We were pleased with our overall results for the third quarter, which included increased collective production levels across our portfolio of assets. While the industry saw some pull back in commodity pricing levels during the third quarter, we continue to expect pricing levels to remain strong through the fourth quarter and into next year given current and projected supply and demand dynamics. I am also pleased to report that we continue to make significant progress on our Starbuck Program. We look forward to providing the market more details on our development activities as appropriate as we move through the program.”

Mike Morrisett, President of Empire, added, “During the third quarter we remained focused on improving our financial standing, including further paydown of our outstanding debt as well as enjoying an enhanced liquidity position that increased more than 25% since the end of the second quarter that benefits our Company and its shareholders. We will continue to execute on targeted field development opportunities to organically expand our production while evaluating additional strategic opportunities to prudently expand our operational footprint and ensure our long-term success.”

FINANCIAL AND OPERATIONAL RESULTS FOR THIRD QUARTER 2022


Q3 2022


Q2 2022


% Change Q3 2022 vs. Q2 2022


Q3 2021


% Change Q3 2022 vs. Q3 2021


Net sales (Boe/d)


2,232


2,158


3

%


2,090


7

%

Net sales (Boe)


205,380


196,412


5

%


192,303


7

%

Realized price ($/Boe)


$

71.30


$

83.48


(15

%)


$

50.11


42

%

Revenue ($M)


$

14,792


$

16,540


(11

%)


$

10,096


47

%

Net income ($M)


$

216


$

5,534


(96

%)


$

(3,726)


106

%

Adjusted Net Income ($M)


$

3,747


$

5,967


(37

%)


$

(2,434)


254

%

Adjusted EBITDA ($M)


$

4,799


$

6,922


(31

%)


$

7,778


(38

%)


Net sales for the third quarter of 2022 were 2,232 Boe/d, including 1,346 net barrels of oil per day; 2,517 thousand cubic feet per day (“Mcf/d”), or 419 Boe/d, of natural gas; and 19,625 gallons per day, or 467 Boe/d, of NGLs. Contributing to the sequential increase from the second quarter of 2022 was increased sales volumes associated with Empire’s assets in New Mexico, Texas and Louisiana. This was partially offset by transitory declines in production for the Company’s assets in the Rockies Region primarily associated with taking certain well production offline temporarily as the Company completes the execution of the Starbuck Program.

Empire reported $14.8 million of revenue for the third quarter of 2022 versus $16.5 million for the second quarter of 2022. The increase in sales volumes for all products was offset by lower realized pricing as compared to the second quarter.

Operating expenses for the third quarter of 2022 were $8.5 million, which included a $1.4 million non-cash write-off associated with the Company’s joint development agreement with Petroleum & Independent Exploration, LLC and related entities (“PIE”). Excluding the PIE write-off, operating expenses were $7.1 million compared to $5.5 million for the second quarter of 2022 primarily as a result of increased workovers and other activities executed in advance of capital development programs at our New Mexico and Rockies Region assets.

General and administrative expenses, excluding non-cash share-based compensation, was $2.0 million, or $9.93 per Boe, in the third quarter of 2022 versus $2.8 million, or $14.23 per Boe, for the second quarter of 2022. Contributing to the sequential decrease was lower professional service fees.

Other expense for the third quarter of 2022 was $1.1 million compared to $0.2 million in the second quarter of 2022. Driving the increase was a non-cash $1.4 million settlement related to the purchase of Empire’s New Mexico assets.

Net income for the third quarter was $0.2 million, or $0.01 per diluted share, versus $5.5 million, or $0.24 per diluted share, in the second quarter of 2022. Contributing to the sequential decrease was lower realized pricing partially offset by higher production, the non-cash $1.4 million PIE write-off and the non-cash $1.4 million settlement related to the purchase of the Company’s New Mexico assets.

Adjusted Net Income for the third quarter was $3.7 million, or $0.16 per diluted share, versus $6.0 million, or $0.26 per diluted share, in the second quarter of 2022, with the decrease substantially due to lower realized pricing partially offset by higher production.

Adjusted EBITDA was $4.8 million for the third quarter compared to $6.9 million in the second quarter of 2022, with the decrease substantially due to lower realized pricing partially offset by higher production.

CAPITAL SPENDING, BALANCE SHEET & LIQUIDITY

For the nine months ended September 30, 2022, the Company spent approximately $500,000 on additions to oil and natural gas properties as a result of non-operated drilling, and an additional $1.0 million on capitalized additions to oil and natural gas properties. The Company anticipates additional capital expenditures in the coming quarters that will be funded with cash flows from operations, debt, and/or equity issuances.

Total liquidity at the end of the third quarter of 2022 was $16.0 million, including $15.7 million of cash and $0.3 million available on the Company’s Credit Facility. This represents a more than 25% increase in liquidity from $12.7 million as of June 30, 2022. As of September 30, 2022, the Company had total debt of $7.8 million and working capital of $11.3 million, which was a material increase from Empire’s working capital position of $1.1 million at December 31, 2021. Empire remains squarely focused on continuing to execute on its proven strategy to remain financially conservative as it evaluates additional opportunities to prudently invest in its current business and expand through targeted acquisitions that provide long-term value for its shareholders.

CONFERENCE CALL INFORMATION

An investor conference call to review the Company’s results will be held on Tuesday, November 15, 2022, at 12:00 p.m. Eastern (11:00 a.m. Central). The call will be hosted by Tommy Pritchard, the Company’s Chief Executive Officer, and Mike Morrisett, Empire’s President. Details for the conference call are as follows:

Date: Tuesday, November 15, 2022

Time: 12:00 p.m. Eastern (11:00 a.m. Central)

Telephone: 1-877-270-2148 (Toll free); 1-412-902-6510 (International); participants should ask to be joined into the Empire Petroleum Corporation call.

Webcast: https://event.choruscall.com/mediaframe/webcast.html?webcastid=foO19cFK

Replay: A webcast replay will be available on Empire’s website (www.empirepetroleumcorp.com) under "Investors Relations" on the "Events & Presentations" page following the call or via the webcast link listed above. The replay will be available through November 15, 2023.

ABOUT EMPIRE PETROLEUM

Empire Petroleum Corporation is a publicly traded, Tulsa-based oil and gas company with current producing assets in Texas, Louisiana, North Dakota, Montana, and New Mexico. Management is focused on organic growth and targeted acquisitions of proved developed assets with synergies with its existing portfolio of wells. More information about Empire can be found at www.empirepetroleumcorp.com.

SAFE HARBOR STATEMENT

This release contains forward-looking statements within the meaning of Section 27A of the Securities Act of 1933 and Section 21E of the Securities Exchange Act of 1934. Forward-looking statements involve a wide variety of risks and uncertainties, and include, without limitations, statements with respect to the Company’s estimates, strategy and prospects. Such statements are subject to certain risks and uncertainties which are disclosed in the Company’s reports filed with the SEC, including its Form 10-K for the fiscal year ended December 31, 2021, and its other filings with the SEC. Readers and investors are cautioned that the Company’s actual results may differ materially from those described in the forward-looking statements due to a number of factors, including, but not limited to, the Company’s ability to acquire productive oil and/or gas properties or to successfully drill and complete oil and/or gas wells on such properties, general economic conditions both domestically and abroad, and other risks and uncertainties related to the conduct of business by the Company.

EMPIRE PETROLEUM CORPORATION
Condensed Consolidated Statements of Operations
(Unaudited)
 
Three Months Ended Nine Months Ended
September 30, June 30, September 30, September 30,


2022


2022


2021


2022


2021


Revenue:
Oil Sales

$

11,501,521


$

13,329,366


$

7,761,584


$

35,247,309


$

13,882,077


Gas Sales


1,587,542


1,446,435


855,507


4,019,400


1,536,569


Natural Gas Liquids Sales


1,637,808


1,763,546


1,439,799


5,133,872


1,913,191


Other


22,921


24,913


71,043


71,877


154,018


Net Realized and Unrealized Gain (Loss) on Derivatives


42,474


(23,893

)


(32,271

)


(93,740

)


(572,220

)

Total Revenue


14,792,266


16,540,367


10,095,662


44,378,718


16,913,635


Costs and Expenses:
Operating


8,505,640


5,503,850


3,597,124


19,200,436


7,328,066


Taxes - Production


1,112,246


1,137,841


678,295


3,151,325


1,266,808


Depletion, Depreciation & Amortization


539,543


455,799


1,279,534


1,429,788


2,025,407


Accretion of Asset Retirement Obligation


342,619


336,488


327,018


1,009,107


881,638


General and Administrative


2,850,059


3,282,452


1,914,326


8,587,891


6,040,475


Total Cost and Expenses


13,350,107


10,716,430


7,796,297


33,378,547


17,542,394


Operating Income (Loss)


1,442,159


5,823,937


2,299,365


11,000,171


(628,759

)

 
Other Income and (Expense):
Convertible Debt Modification Inducement Expense


-


-


(2,276,813

)


-


(2,276,813

)

Unrealized Gain on Embedded Conversion Option


-


-


689,215


-


92,931


Other Income (Expense)


(1,100,888

)


(177,872

)


29,687


(1,278,760

)


190,387


Interest Expense


(125,330

)


(111,785

)


(4,467,679

)


(347,763

)


(7,373,113

)

 
Net Income (Loss)

$

215,941


$

5,534,280


$

(3,726,225

)

$

9,373,648


$

(9,995,367

)

 
Net Income (Loss) per Common Share:
Basic

$

0.01


$

0.27


$

(0.23

)

$

0.45


$

(0.75

)

Diluted

$

0.01


$

0.24


$

(0.23

)

$

0.41


$

(0.75

)

Weighted Average Number of Common Shares Outstanding:
Basic


21,651,383


20,424,970


16,560,705


20,654,294


13,278,341


Diluted


24,065,485


23,294,723


16,560,705


22,778,836


13,278,341


EMPIRE PETROLEUM CORPORATION
Condensed Operating Data
(Unaudited)
 
Three Months Ended Nine Months Ended
September 30, June 30, September 30, September 30,

2022

2022

2021

2022

2021

 
Net Production Volumes:
Oil (Bbl)


123,804


123,167


114,495


361,226


220,780

Natural gas (Mcf)


231,522


208,363


224,118


653,829


379,600

Natural gas liquids (Gal)


1,805,523


1,617,751


1,699,112


5,109,649


2,598,655

Total (Boe)


205,380


196,412


192,303


591,856


345,919

 
Average daily equivalent sales (Boe/d)


2,232


2,158


2,090


2,168


1,267

 
Average Price per Unit:
Oil ($/Bbl)

$

92.22

$

108.06

$

64.98

$

96.90

$

59.80

Natural gas ($/Mcf)

$

6.86

$

6.37

$

3.82

$

6.15

$

4.05

Natural gas liquids ($/Gal)

$

0.91

$

1.09

$

0.85

$

1.00

$

0.74

Total ($/Boe)

$

71.30

$

83.48

$

50.11

$

74.45

$

50.10

 
Operating Costs and Expenses per Boe:
Oil and natural gas production

$

41.41

$

28.02

$

18.71

$

32.44

$

21.18

Production and ad valorem taxes

$

5.42

$

5.79

$

3.53

$

5.32

$

3.66

Depreciation, depletion, amortization and accretion

$

4.30

$

4.03

$

8.35

$

4.12

$

8.40

General & administrative (including share-based compensation)

$

13.88

$

16.71

$

9.95

$

14.51

$

17.46

General & administrative (excluding share-based compensation)

$

9.93

$

14.23

$

9.95

$

11.68

$

16.29

 
EMPIRE PETROLEUM CORPORATION
Condensed Consolidated Balance Sheets
 
(Unaudited)
September 30, December 31,


2022


2021


ASSETS
Current Assets:
Cash

$

15,733,842


$

3,611,871


Accounts Receivable


5,981,533


7,733,905


Unrealized Gain on Derivative Instruments


348,665


55,242


Inventory - Oil in Tanks


1,605,357


1,037,880


Prepaids


724,484


679,122


Total Current Assets


24,393,881


13,118,020


Property and Equipment:
Oil and Natural Gas Properties, Successful Efforts


53,064,338


46,914,326


Less: Accumulated Depreciation, Depletion and Impairment


(18,703,073

)


(17,525,918

)


34,361,265


29,388,408


Other Property and Equipment, Net


1,535,765


1,288,611


Total Property and Equipment, Net


35,897,030


30,677,019


Unrealized Gain on Derivative Instruments - Long Term


51,660


194,018


Sinking Fund


5,450,000


4,810,000


Utility and Other Deposits


449,811


1,290,594


TOTAL ASSETS

$

66,242,382


$

50,089,651


LIABILITIES AND STOCKHOLDERS' EQUITY
Current Liabilities:
Accounts Payable

$

4,226,799


$

4,329,535


Accrued Expenses


7,325,010


5,844,184


Current Portion of Lease Liability


251,117


180,105


Current Portion of Long-Term Notes Payable


1,258,804


1,700,663


Total Current Liabilities


13,061,730


12,054,487


Long-Term Notes Payable


5,174,783


6,117,091


Long-Term Note Payable - PIE


1,399,030


797,010


Long Term Lease Liability


613,899


646,311


Asset Retirement Obligations


21,722,407


20,640,599


Total Liabilities


41,971,849


40,255,498


Stockholders' Equity:
Series A Preferred Stock - $.001 Par Value, 10,000,000 Shares Authorized, 6 and 0 Shares Issued and Outstanding, Respectively


-


-


Common Stock - $.001 Par Value 190,000,000 Shares Authorized, 21,443,293 and 19,840,648 Shares Issued and Outstanding, Respectively


81,550


79,362


Additional Paid-in Capital


74,048,678


68,988,134


Accumulated Deficit


(49,859,695

)


(59,233,343

)

Total Stockholders' Equity


24,270,533


9,834,153


TOTAL LIABILITIES AND STOCKHOLDERS' EQUITY

$

66,242,382


$

50,089,651


EMPIRE PETROLEUM CORPORATION
Condensed Consolidated Statements of Cash Flows
(Unaudited)
 
Three Months Ended Nine Months Ended
September 30, June 30, September 30, September 30,


2022


2022


2021


2022


2021


Cash Flows From Operating Activities:
Net Income (Loss)

$

215,941


$

5,534,280


$

(3,726,225

)

$

9,373,648


$

(9,995,367

)

 
Adjustments to Reconcile Net Income (Loss) to Net Cash
Provided By Operating Activities:
Stock Compensation and Issuances


809,641


486,903


-


1,672,823


406,250


Amortization of Right of Use Assets


44,627


50,901


47,935


135,234


54,363


Depreciation, Depletion and Amortization


539,543


455,799


1,279,534


1,429,788


2,025,407


Accretion of Asset Retirement Obligation


342,619


336,488


327,018


1,009,107


881,638


Settlement of Asset Retirement Obligations


-


(342,344

)


-


(342,344

)


-


Loss on Settlement of Asset Retirement Obligations


-


181,386


-


181,386


-


Loss on XTO Final Settlement


1,448,363


-


-


1,448,363


-


PIE-Related Expense


1,399,030


-


-


1,399,030


-


Amortization of Loan Issue Costs


-


-


-


-


14,587


Right to Buy Issuance Costs


-


-


-


-


989,115


Unrealized Gain on Embedded Conversion Option


-


-


(689,215

)


-


(92,931

)

Amortization of Discount on Convertible Notes


-


-


4,090,214


-


6,670,129


Convertible Debt Modification Inducement Expense


-


-


2,276,813


-


2,276,813


Stock Issued for Interest Expense Payment


-


-


241,054


-


241,054


Forgiveness of Payroll Protection Plan Loan


-


-


-


-


(160,700

)

Change in Operating Assets and Liabilities:
Accounts Receivable


1,417,093


(355,618

)


(3,217,479

)


304,009


(5,566,084

)

Unrealized Gain on Derivatives


(126,400

)


(53,726

)


(295,668

)


(151,065

)


(113,943

)

Inventory, Oil in Tanks


(412,768

)


(216,911

)


159,611


(567,477

)


(681,208

)

Prepaids, Current


(184,958

)


2,586


25,614


(45,362

)


115,670


Other Assets


39,033


4,735


200,100


43,773


(6,807

)

Accounts Payable


(1,459,997

)


649,861


1,901,185


(2,464,573

)


2,326,752


Accrued Expenses


(208,689

)


1,249,044


521,251


1,480,826


1,245,653


Net Cash Provided By Operating Activities


3,863,078


7,983,384


3,141,742


14,907,166


630,391


Cash Flows from Investing Activities:
Acquisition of Oil and Natural Gas Properties


-


(2,205,000

)


-


(2,205,000

)


(17,869,779

)

Additions to Oil and Natural Gas Properties


(276,024

)


(802,225

)


-


(1,502,900

)


-


Purchase of Other Fixed Assets


(189,179

)


(109,578

)


(424,760

)


(307,787

)


(508,571

)

Cash Paid for Right of Use Assets


(44,009

)


(48,402

)


-


(135,244

)


-


Sinking Fund Deposit


-


(160,000

)


(480,000

)


(640,000

)


(4,330,000

)

Investment in Related Party


-


-


1,250,000


-


-


Net Cash Used In Investing Activities


(509,212

)


(3,325,205

)


345,240


(4,790,931

)


(22,708,350

)

 
Cash Flows from Financing Activities:
Proceeds from Debt Issued


-


-


-


-


19,599,850


Principal Payments of Debt


(461,779

)


(462,436

)


(1,899,452

)


(1,384,167

)


(5,546,738

)

Proceeds from Stock and Warrant Issuance


-


-


583,102


-


11,054,661


Proceeds from Option and Warrant Exercise


405,220


2,887,183


-


3,389,903


-


Net Cash Provided By (Used In) Financing Activities


(56,559

)


2,424,747


(1,316,350

)


2,005,736


25,107,773


Net Change in Cash


3,297,307


7,082,926


2,170,632


12,121,971


3,029,814


Cash - Beginning of Period


12,436,535


5,353,609


1,016,877


3,611,871


157,695


Cash - End of Period

$

15,733,842


$

12,436,535


$

3,187,509


$

15,733,842


$

3,187,509


Empire Petroleum Corporation
Non-GAAP Information

Certain financial information included in Empire’s financial results are not measures of financial performance recognized by accounting principles generally accepted in the United States, or GAAP. These non-GAAP financial measures include “Adjusted Net Income”, “EBITDA” and “Adjusted EBITDA”. These disclosures may not be viewed as a substitute for results determined in accordance with GAAP and are not necessarily comparable to non-GAAP performance measures which may be reported by other companies.

Adjusted Net Income is presented because the timing and amount of these items cannot be reasonably estimated and affect the comparability of operating results from period to period, and current periods to prior periods.

ADJUSTED NET INCOME
 
 
Three Months Ended Nine Months Ended
September 30, June 30, September 30, September 30,


2022


2022


2021


2022


2021


Net Income (Loss)

$

215,941


$

5,534,280


$

(3,726,225

)

$

9,373,648


$

(9,995,367

)

 
Adjusted for:
Warrants and options granted in G&A


809,641


486,903


-


1,672,823


-


Unrealized (gain) loss on derivatives


(126,400

)


(53,726

)


(295,668

)


(151,065

)


(113,943

)

Write off of JDA note receivable


1,399,030


-


-


1,399,030


-


XTO final settlement - noncash settlement


1,448,363


-


-


1,448,363


-


Convertible debt modification inducement expense


-


-


2,276,813


-


2,276,813


Loss (gain) on conversion option


-


-


(689,215

)


-


(92,931

)

Right to buy issuance costs


-


-


-


-


989,115


Stock compensation expense


-


-


-


-


406,250


Forgiveness of PPP loan


-


-


-


-


(160,700

)

 
Adjusted Net Income

$

3,746,575


$

5,967,457


$

(2,434,295

)

$

13,742,799


$

(6,690,763

)

 
Diluted Weighted Average Shares Outstanding


24,065,485


23,294,723


16,560,705


22,778,836


13,278,341


Adjusted Net Income (Loss) Per Share

$

0.16


$

0.26


$

(0.15

)

$

0.60


$

(0.50

)

The Company defines Adjusted EBITDA as net income (loss) plus net interest expense, depreciation, depletion and amortization (“DD&A”), accretion, amortization of loan issuance costs, ROU assets and discount on convertible notes, income tax (benefit) expense, and other non-cash items.

Company management believes this presentation is relevant and useful because it helps investors understand Empire’s operating performance and makes it easier to compare its results with those of other companies that have different financing, capital and tax structures. Adjusted EBITDA should not be considered in isolation from or as a substitute for net income, as an indication of operating performance or cash flows from operating activities or as a measure of liquidity. In addition, Adjusted EBITDA does not represent funds available for discretionary use.

EBITDA & ADJUSTED EBITDA
 
 
Three Months Ended Nine Months Ended
September 30, June 30, September 30, September 30,


2022


2022


2021


2022


2021


Net Income (Loss)

$

215,941


$

5,534,280


$

(3,726,225

)

$

9,373,648


$

(9,995,367

)

 
Add Back:
Interest Expense


125,330


111,785


4,467,679


347,763


7,373,113


DD&A


539,543


455,799


1,279,534


1,429,788


2,025,407


Accretion


342,619


336,488


327,018


1,009,107


881,638


Amortization of loan issuance costs


-


-


-


-


14,587


Amortization of ROU assets


44,627


50,901


47,935


135,234


54,363


Amortization of disc. on convertible notes


-


-


4,090,214


-


6,670,129


EBITDA

$

1,268,060


$

6,489,253


$

6,486,155


$

12,295,540


$

7,023,870


Consideration of noncash items:
Warrants and options granted in G&A


809,641


486,903


-


1,672,823


-


Unrealized (gain) loss on derivatives


(126,400

)


(53,726

)


(295,668

)


(151,065

)


(113,943

)

Write off of JDA note receivable


1,399,030


-


-


1,399,030


-


XTO final settlement - noncash settlement


1,448,363


-


-


1,448,363


-


Convertible debt modification inducement expense


-


-


2,276,813


-


2,276,813


Loss (gain) on conversion option


-


-


(689,215

)


-


(92,931

)

Right to buy issuance costs


-


-


-


-


989,115


Stock compensation expense


-


-


-


-


406,250


Forgiveness of PPP loan


-


-


-


-


(160,700

)

 
Adjusted EBITDA

$

4,798,694


$

6,922,430


$

7,778,085


$

16,664,691


$

10,328,474


Contacts

Empire Petroleum Corporation:
Tommy Pritchard, CEO
Mike Morrisett, President
539-444-8002
This email address is being protected from spambots. You need JavaScript enabled to view it.

Investor Relations:
Al Petrie Advisors
Wes Harris, Partner
713-300-6321
This email address is being protected from spambots. You need JavaScript enabled to view it.


Read full story here

IRVING, Texas & SHANGHAI, China--(BUSINESS WIRE)--Fluor Corporation (NYSE: FLR) announced today that it has achieved substantial engineering completion for Albemarle’s Lithium Conversion project in China.


Fluor is providing engineering, procurement and construction management services for the facility. Lithium is an essential precursor material for high performance lithium-ion batteries for electric vehicles. When complete, the facility will produce 50,000 tons of lithium hydroxide per year.

“We are off to a great start on this project as the team has achieved more than 3 million safe hours,” said Jim Breuer, group president, Energy Solutions, Fluor Corporation. “We are excited to work on this important project that will expand Albermarle’s position as an industry leader in lithium and lithium derivatives, one of the highest growth markets in the specialty chemicals sector.”

The project site is located in Meishan City in the Sichuan Province of China. Fluor’s Shanghai, China, operations center is leading the project.

Fluor Corporation

Fluor Corporation (NYSE: FLR) is building a better future by applying world-class expertise to solve its clients’ greatest challenges. Fluor’s 41,000 employees provide professional and technical solutions that deliver safe, well-executed, capital-efficient projects to clients around the world. Fluor had revenue of $12.4 billion in 2021 and is ranked 259 among the Fortune 500 companies. With headquarters in Irving, Texas, Fluor has provided engineering, procurement and construction services for more than 110 years. For more information, please visit www.fluor.com or follow Fluor on Twitter, LinkedIn, Facebook and YouTube.

#ec


Contacts

Brian Mershon
Media Relations
469.398.7621

Jason Landkamer
Investor Relations
469.398.7222

Hospitality veteran Hussein Tawalbeh to lead sales and operations in the region from Dubai UAE

ALPHARETTA, Ga.--(BUSINESS WIRE)--Agilysys, Inc. (Nasdaq: AGYS), a leading global provider of hospitality software solutions that deliver High Return Hospitality, today announced it is bringing its Agilysys Hospitality Cloud solutions to the Middle East. While Agilysys previously has cultivated customers in the region through its Europe, Middle East and Africa (EMEA) operations in the United Kingdom, the company now has hired Hussein Tawalbeh, an executive whose hospitality expertise comes through a 20-year career in the region, to lead Agilysys’ Middle East and North Africa (MENA) operations from Dubai UAE.

Dubai is on track to becoming the world’s most visited destination welcoming 7.1 million international overnight visitors as of June 2022, a 183% year-over-year increase. The hospitality sector across the Middle East is undergoing a dramatic transformation – particularly in the luxury, upper upscale and upscale sectors – that is expected to fuel growth over the next several years.

A recent trend report by Lodging Econometrics notes that the construction pipeline for the Middle East at the end of the second quarter 2022 includes 545 projects comprising 140,055 rooms, with 72% of these projects in the top three chain scales – luxury, upper upscale, and upscale. Forecast data shows 114 hotel openings totaling 28,450 rooms expected in 2023 and 125 hotel openings accounting for 30,408 rooms expected in 2024.

“Dubai has taken a strategic approach to the hospitality industry, establishing a top-notch infrastructure and hosting world-renowned events to draw visitors from all over the world,” said Hussein Tawalbeh, Regional Director, Middle East and North Africa (MENA) for Agilysys. “Deepening Agilysys’ focus in the Middle East is a natural move as this region develops meaningful growth and exceptional hospitality experiences,” he added.

Mr. Tawalbeh’s hospitality experience in the Middle East includes leadership and management positions at global hospitality solution providers; and at in-region properties and management companies, including Radisson Blu; Kempenski Hotels and Autograph Collection.

Agilysys debuted its marketing presence in the Middle East as a sponsor of The Hospitality Network’s The 2022 Stakeholder Conference (thehospitalitynetwork.com) held 18-21 October 2022.

Don DeMarinis, Agilysys Senior Vice President, noted, “We were impressed by the hospitality leaders and decision-makers with whom we met at the 2022 Stakeholders Conference. Those conversations have informed our approach to bringing our market-leading hospitality solutions to the Middle East. In addition, we are excited to add Hussein Tawalbeh’s meaningful hospitality knowledge and experience in the Middle East to our team as we help leading properties in the region to achieve High Return Hospitality,” he concluded.

About Agilysys

Agilysys is well known for its long heritage of hospitality-focused technology innovation. The Company delivers modular and integrated software solutions and expertise to businesses seeking to maximize Return on Experience (ROE) through hospitality encounters that are both personal and profitable. Over time, customers achieve High Return Hospitality by consistently delighting guests, retaining staff and growing margins. Customers around the world include: branded and independent hotels; multi-amenity resort properties; casinos; property, hotel and resort management companies; cruise lines; corporate dining providers; higher education campus dining providers; food service management companies; hospitals; lifestyle communities; senior living facilities; stadiums; and theme parks. The Agilysys Hospitality Cloud combines core operational systems for property management (PMS), point-of-sale (POS) and Inventory and Procurement (I&P) with Experience Enhancers that meaningfully improve interactions for guests and for employees across dimensions such as digital access, mobile convenience, self-service control, personal choice, payment options, service coverage and real-time insights to improve decisions. Core solutions and Experience Enhancers are selectively combined in Hospitality Solution Studios™ tailored to specific hospitality settings and business needs. www.Agilysys.com


Contacts

Media:
Jen Reeves, Agilysys, Inc., 770-810-6007,This email address is being protected from spambots. You need JavaScript enabled to view it.
Kaylee Sims, Arketi Group (for Agilysys), 404-697-0137, This email address is being protected from spambots. You need JavaScript enabled to view it.

Investors:
Jessica Hennessy, Agilysys, Inc., 770-810-6116, This email address is being protected from spambots. You need JavaScript enabled to view it.

Offshore Source Logo

Offshore Source keeps you updated with relevant information concerning the Offshore Energy Sector.

Any views or opinions represented on this website belong solely to the author and do not represent those of the people, institutions or organizations that Offshore Source or collaborators may or may not have been associated with in a professional or personal capacity, unless explicitly stated.

Corporate Offices

Technology Systems Corporation
8502 SW Kansas Ave
Stuart, FL 34997

info@tscpublishing.com