Business Wire News

THE WOODLANDS, Texas--(BUSINESS WIRE)--Excelerate Energy, Inc. (NYSE: EE) (the “Company” or “Excelerate”) will release its fourth quarter and full year 2022 results on Monday, March 27, 2023, following the close of U.S. financial markets. The earnings release and presentation for the fourth quarter 2022 results will be available on the investor page of the Company’s website at www.excelerateenergy.com.


On Tuesday, March 28, 2023, the Company’s management team will host a conference call for analysts and investors at 8:30 a.m. Eastern Time (7:30 a.m. Central Time). The call will also be webcast live at www.excelerateenergy.com. An archived replay of the call and a copy of the presentation will be on the website following the call.

ABOUT EXCELERATE ENERGY

Excelerate Energy, Inc. is a U.S.-based LNG company located in The Woodlands, Texas. Excelerate is changing the way the world accesses cleaner forms of energy by providing integrated services along the LNG value chain with an objective of delivering rapid-to-market and reliable LNG solutions to customers. The Company offers a full range of flexible regasification services from FSRUs to infrastructure development to LNG supply. Excelerate has offices in Abu Dhabi, Antwerp, Boston, Buenos Aires, Chattogram, Dhaka, Doha, Dubai, Helsinki, Ho Chi Minh City, Manila, Rio de Janeiro, Singapore, and Washington, DC. For more information, please visit www.excelerateenergy.com.


Contacts

Investors
Craig Hicks
Excelerate Energy
This email address is being protected from spambots. You need JavaScript enabled to view it.

Media
Stephen Pettibone / Frances Jeter
FGS Global
This email address is being protected from spambots. You need JavaScript enabled to view it.
or
This email address is being protected from spambots. You need JavaScript enabled to view it.

Orders and Revenue Support Robust Outlook for 2023

Fourth Quarter 2022 Highlights

(All comparisons against the fourth quarter of 2021 unless otherwise noted)


Strong performance driven by its competitive differentiator - Ingersoll Rand Execution Excellence (IRX):

  • Reported fourth quarter orders of $1,484 million, down 1%, or up 2% organic
  • Reported fourth quarter revenues of $1,624 million, up 14%, or 19% organic1
  • Reported net income attributable to Ingersoll Rand Inc. of $217 million, or earnings of $0.53 per share
    • Adjusted net income from continuing operations, net of tax1 of $295 million, or $0.72 per share
  • Adjusted EBITDA1 of $420 million, up 23%, with a margin of 25.9%, up 180 basis points year over year, and incremental margin of 38%
  • Reported operating cash flow from continuing operations of $355 million and free cash flow from continuing operations1 of $321 million
  • Liquidity of $2.7 billion as of December 31, 2022, including $1.6 billion of cash on hand and undrawn capacity of $1.1 billion under available credit facilities

Full Year 2022 Highlights

(All comparisons against 2021 unless otherwise noted)

  • Reported orders of $6,368 million, up 10%, or 11% organic
  • Reported revenues of $5,916 million, up 15%, or 16% organic1
  • Reported net income attributable to Ingersoll Rand Inc. of $605 million, or earnings of $1.47 per share
    • Adjusted net income from continuing operations, net of tax1 of $972 million, or $2.36 per share
  • Adjusted EBITDA1 of $1,435 million, up 20%, with a margin of 24.3%, up 120 basis points year over year, and incremental margin of 32%
  • Reported operating cash flow from continuing operations of $865 million and free cash flow from continuing operations1 of $771 million
  • Returned $294M of value to shareholders through share repurchase and dividends

2023 Guidance

  • Full-year 2023 revenue growth expected to be 7% to 9% and Adjusted EBITDA1 of $1,570 to $1,630 million, up 9% to 14% over prior year
  • 2023 Adjusted EPS1 expected to be in a range of $2.48 to $2.58, up 5% to 9% over prior year

DAVIDSON, N.C.--(BUSINESS WIRE)--Ingersoll Rand Inc. (NYSE: IR), a global provider of mission-critical flow creation and industrial solutions, reported a strong finish in the fourth quarter of 2022.

“We finished the year on a high note, with strong fourth quarter and full year 2022 results amidst ongoing inflation, rising interest rates, and geopolitical uncertainty,” said Vicente Reynal, Chairman and CEO. “These robust results again demonstrate the resilience of our business across economic cycles. Driven by our operational excellence model, IRX, we continue to deliver on the commitments we made at our Investor Day, keeping us on track to meet those 2025 targets.”

____________________________

1 Non-GAAP measure (definitions and/or reconciliations in appendix).

Reynal added, “We made tremendous progress in 2022 against our sustainability goals by executing on our strategic imperative to Lead Sustainably. Our industry-leading sustainability program continues to earn recognition, and I am very proud that Ingersoll Rand was named to the 2022 Dow Jones Sustainability World Index and Dow Jones Sustainability North America Index. I am grateful for the whole Ingersoll Rand team, whose high level of engagement and ownership mindset enabled us to deliver another successful quarter and will help us to carry our momentum forward into 2023.”

Fourth Quarter 2022 Segment Review

(All comparisons against the fourth quarter of 2021 unless otherwise noted.)

Industrial Technologies and Services Segment: broad range of compressor, vacuum and blower solutions as well as fluid transfer equipment, loading systems, power tools and lifting equipment

  • Reported Orders of $1,192 million, down 1%, or up 4% organic
  • Reported Revenues of $1,315 million, up 17%, or 22% organic2
  • Reported Segment Adjusted EBITDA of $361 million, up 24% with an incremental margin of 38%
  • Reported Segment Adjusted EBITDA Margin of 27.4%, up 170 basis points, fueled by the use of IRX to drive strong operational execution
  • Core industrial end markets saw continued strong organic demand with orders up 4%, including strong positive momentum across Europe and Asia. Excluding FX, orders for total compressor offerings, which represent approximately 65% of the total segment, were up low single digits, while orders in Industrial Vacuum & Blowers grew in the low 20’s. Orders in Power Tools and Lifting were also up mid-single-digits.

Precision and Science Technologies Segment: highly specialized fluid management solutions including precision liquid and gas pumps and niche compression technologies

  • Reported Orders of $293 million, down 4%, or 2% organic
  • Reported Revenues of $308 million, up 6%, or 9% organic2
  • Reported Segment Adjusted EBITDA of $93 million, up 19% with an incremental margin of 82%
  • Reported Segment Adjusted EBITDA Margin of 30.1%, up 330 basis points, driven primarily by improvement in pricing vs cost as well as synergy delivery in recently completed M&A
  • Organic orders were down slightly vs. prior year largely due to a large non-repeating Hydrogen order in 2021.

Balance Sheet and Cash Flow

Ingersoll Rand remains in a strong financial position with ample liquidity of $2.7 billion. On a reported basis, the Company generated $355 million of cash flow from operating activities from continuing operations and invested $34 million in capital expenditures, resulting in free cash flow from continuing operations2 of $321 million, compared to cash flow from operating activities from continuing operations of $247 million and free cash flow from continuing operations2 of $224 million in the prior year period. Prior year cash flow from operating activities from continuing operations and free cash flow from continuing operations both included an inflow of $3 million for cash taxes related to divestitures. Net debt to Adjusted EBITDA2 leverage was 0.8x for the fourth quarter, which was an improvement of 0.3x as compared to the prior year. Consistent with our comprehensive capital allocation strategy led by M&A, Ingersoll Rand deployed $184 million to M&A, $3 million to share repurchases and $8 million to its dividend payment during the fourth quarter. In addition, Ingersoll Rand announced the acquisition of Paragon Tank Truck, a leading provider of solutions used for loading and unloading dry bulk and liquid tanks in demanding industrial environments which closed on February 1. 2023. Also, on January 3, 2023 Ingersoll Rand closed on the SPX Flow Air Treatment acquisition.

___________________________

2 Non-GAAP measure (definitions and/or reconciliations in appendix).

2023 Guidance3,4

Ingersoll Rand is establishing full-year 2023 guidance based on expected continued strong demand trends and operational execution in 2023:


Key Metrics

Phasing

Revenue - Total Ingersoll Rand

7-9%

H1 Growth: 9-11%
H2 Growth: 4-6%

Ingersoll Rand (Organic)

3-5%


Industrial Technologies &
Services (Organic)

3-5%


Precision & Science
Technologies (Organic)

4-6%


FX Impact

(~1%)

H1 Growth: (2-4%)
H2 Growth: +1-3%

M&A3

~$270M


Corporate Costs

(~$140M)

Evenly by Quarter

Adjusted EBITDA4

$1,570M - $1,630M


Adjusted EPS4

$2.48 - $2.58


Reconciliations of non-GAAP measures related to full-year 2023 guidance have not been provided due to the unreasonable efforts it would take to provide such reconciliations due to the high variability, complexity and uncertainty with respect to forecasting and quantifying certain amounts that are necessary for such reconciliations, including net income (loss) and adjustments that could be made for acquisitions-related expenses, restructuring and other business transformation costs, gains or losses on foreign currency exchange and the timing and magnitude of other amounts in the reconciliation of historic numbers. For the same reasons, we are unable to address the probable significance of the unavailable information, which could have a potentially unpredictable, and potentially significant, impact on our future GAAP financial results.

Conference Call

Ingersoll Rand will host a live earnings conference call to discuss the fourth quarter and full year results on Tuesday, February 21, 2023 at 8:00 a.m. (Eastern Time). To participate in the call, please dial 1-844-200-6205, domestically, or 1-929-526-1599, internationally, and use conference ID, 562071, or ask to be joined into the Ingersoll Rand call. A real-time audio webcast of the presentation can be accessed via the Events and Presentations section of the Ingersoll Rand Investor Relations website (https://investors.irco.com), where related materials will be posted prior to the conference call. A replay of the webcast will be available after conclusion of the conference and can be accessed on the Ingersoll Rand Investor Relations website.

______________________________

3 Reflects all completed and closed M&A in 2022 as well as the acquisitions of SPX Flow Air Treatment and Paragon Tank Truck.

4 Non-GAAP measure (definitions and/or reconciliations in appendix).

Forward-Looking Statements

This news release contains “forward-looking statements” within the meaning of the Private Securities Litigation Reform Act of 1995, including statements related to Ingersoll Rand Inc.’s (the “Company” or “Ingersoll Rand”) expectations regarding the performance of its business, its financial results, its liquidity and capital resources and other non-historical statements. These forward-looking statements generally are identified by the words “believe,” “project,” “expect,” “anticipate,” “estimate,” “forecast,” “outlook,” “target,” “endeavor,” “seek,” “predict,” “intend,” “strategy,” “plan,” “may,” “could,” “should,” “will,” “would,” “will be,” “on track to” “will continue,” “will likely result,” “guidance” or the negative thereof or variations thereon or similar terminology generally intended to identify forward-looking statements. All statements other than historical facts are forward-looking statements.

These forward-looking statements are based on Ingersoll Rand’s current expectations and are subject to risks and uncertainties, which may cause actual results to differ materially from these current expectations. Should one or more of these risks or uncertainties materialize, or should underlying assumptions prove incorrect, actual results may vary materially from those indicated or anticipated by such forward-looking statements. The inclusion of such statements should not be regarded as a representation that such plans, estimates or expectations will be achieved. Important factors that could cause actual results to differ materially from such plans, estimates or expectations include, among others, (1) the impact on the Company’s business, suppliers and customers and global economic conditions of the COVID-19 pandemic, including business disruptions caused by government restrictions; (2) unexpected costs, charges or expenses resulting from completed and proposed business combinations; (3) uncertainty of the expected financial performance of the Company; (4) failure to realize the anticipated benefits of completed and proposed business combinations; (5) the ability of the Company to implement its business strategy; (6) difficulties and delays in achieving revenue and cost synergies; (7) inability of the Company to retain and hire key personnel; (8) evolving legal, regulatory and tax regimes; (9) changes in general economic and/or industry specific conditions; (10) actions by third parties, including government agencies; (11) adverse impact on our operations and financial performance due to natural disaster, catastrophe, pandemic, geopolitical tensions or other events outside of our control; (12) the timing, manner and volume of repurchases of common stock pursuant to our share repurchase program; and (13) other risk factors detailed in Ingersoll Rand’s most recent Annual Report on Form 10-K filed with the Securities and Exchange Commission (the “SEC”), as such factors may be updated from time to time in its periodic filings with the SEC, which are available on the SEC’s website at http://www.sec.gov. The foregoing list of important factors is not exclusive.

Any forward-looking statements speak only as of the date of this release. Ingersoll Rand undertakes no obligation to update any forward-looking statements, whether as a result of new information or developments, future events or otherwise, except as required by law. Readers are cautioned not to place undue reliance on any of these forward-looking statements.

About Ingersoll Rand Inc.

Ingersoll Rand Inc. (NYSE:IR), driven by an entrepreneurial spirit and ownership mindset, is dedicated to helping make life better for our employees, customers and communities. Customers lean on us for our technology-driven excellence in mission-critical flow creation and industrial solutions across 40+ respected brands where our products and services excel in the most complex and harsh conditions. Our employees develop customers for life through their daily commitment to expertise, productivity and efficiency. For more information, visit www.IRCO.com.

Non-U.S. GAAP Measures of Financial Performance

In addition to consolidated GAAP financial measures, Ingersoll Rand reviews various non-GAAP financial measures, including “Organic Revenue Growth,” “Adjusted EBITDA,” “Adjusted Net Income,” “Adjusted Diluted EPS” and “Free Cash Flow.”

Ingersoll Rand believes Adjusted EBITDA, Adjusted Net Income, and Adjusted Diluted EPS are helpful supplemental measures to assist management and investors in evaluating the Company’s operating results as they exclude certain items that are unusual in nature or whose fluctuation from period to period do not necessarily correspond to changes in the operations of Ingersoll Rand’s business. Ingersoll Rand believes Organic Revenue Growth is a helpful supplemental measure to assist management and investors in evaluating the Company’s operating results as it excludes the impact of foreign currency and acquisitions on revenue growth. Adjusted EBITDA represents net income before interest, taxes, depreciation, amortization and certain non-cash, non-recurring and other adjustment items. Adjusted Net Income is defined as net income including interest, depreciation and amortization of non-acquisition related intangible assets and excluding other items used to calculate Adjusted EBITDA and further adjusted for the tax effect of these exclusions. Organic Revenue Growth is defined as As Reported Revenue growth less the impacts of Foreign Currency and Acquisitions. Ingersoll Rand believes that the adjustments applied in presenting Adjusted EBITDA and Adjusted Net Income are appropriate to provide additional information to investors about certain material non-cash items and about non-recurring items that the Company does not expect to continue at the same level in the future. Adjusted Diluted EPS is defined as Adjusted Net Income divided by Adjusted Diluted Average Shares Outstanding. Incrementals/Decrementals are defined as the change in Adjusted EBITDA versus the prior year period divided by the change in revenue versus the prior year period.

Ingersoll Rand uses Free Cash Flow to review the liquidity of its operations. Ingersoll Rand measures Free Cash Flow as cash flows from operating activities less capital expenditures. Ingersoll Rand believes Free Cash Flow is a useful supplemental financial measures for management and investors in assessing the Company’s ability to pursue business opportunities and investments and to service its debt. Free Cash Flow is not a measure of our liquidity under GAAP and should not be considered as an alternative to cash flows from operating activities.

Management and Ingersoll Rand’s board of directors regularly use these measures as tools in evaluating the Company’s operating and financial performance and in establishing discretionary annual compensation. Such measures are provided in addition to, and should not be considered to be a substitute for, or superior to, the comparable measures under GAAP. In addition, Ingersoll Rand believes that Organic Revenue Growth, Adjusted EBITDA, Adjusted Net Income, Adjusted Diluted EPS, Incrementals/Decrementals and Free Cash Flow are frequently used by investors and other interested parties in the evaluation of issuers, many of which also present Adjusted EBITDA, Adjusted Net Income, Adjusted Diluted EPS, and Free Cash Flow when reporting their results in an effort to facilitate an understanding of their operating and financial results and liquidity.

Organic Revenue Growth, Adjusted EBITDA, Adjusted Net Income, Adjusted Diluted EPS and Free Cash Flow should not be considered as alternatives to revenue growth, net income, diluted earnings per share or any other performance measure derived in accordance with GAAP, or as alternatives to cash flow from operating activities as a measure of our liquidity. Organic Revenue Growth, Adjusted EBITDA, Adjusted Net Income, Adjusted Diluted EPS and Free Cash Flow have limitations as analytical tools, and you should not consider such measures either in isolation or as substitutes for analyzing Ingersoll Rand’s results as reported under GAAP.

Reconciliations of Organic Revenue Growth, Adjusted EBITDA, Adjusted Net Income, Adjusted Diluted EPS and Free Cash Flow to their most comparable U.S. GAAP financial metrics for historical periods are presented in the tables below.

Reconciliations of non-GAAP measures related to full year 2023 guidance have not been provided due to the unreasonable efforts it would take to provide such reconciliations due to the high variability, complexity and uncertainty with respect to forecasting and quantifying certain amounts that are necessary for such reconciliations, including net income (loss) and adjustments that could be made for acquisitions-related expenses, restructuring and other business transformation costs, gains or losses on foreign currency exchange and the timing and magnitude of other amounts in the reconciliation of historic numbers. For the same reasons, we are unable to address the probable significance of the unavailable information, which could have a potentially unpredictable, and potentially significant, impact on our future GAAP financial results.

INGERSOLL RAND INC. AND SUBSIDIARIES

CONSOLIDATED STATEMENTS OF OPERATIONS

(Unaudited; in millions, except per share amounts)


For the Three Month Period
Ended December 31,


For the Twelve Month
Period Ended December 31,


2022


2021


2022


2021

Revenues

$

1,623.7


$

1,418.8


$

5,916.3


$

5,152.4


Cost of sales


969.3


909.4


3,590.7


3,163.9


Gross Profit


654.4


509.4


2,325.6


1,988.5


Selling and administrative expenses


276.0


255.9


1,095.8


1,028.0


Amortization of intangible assets


84.0


88.1


347.6


332.9


Other operating expense, net


21.5


25.0


64.9


61.9


Operating Income


272.9


140.4


817.3


565.7


Interest expense


34.4


19.4


103.2


87.7


Loss on extinguishment of debt


1.1


9.0


Other income, net


(7.4

)


(3.9

)


(29.2

)


(44.0

)

Income from Continuing Operations Before Income Taxes


245.9


124.9


742.2


513.0


Provision (benefit) for income taxes


45.0


(47.6

)


149.6


(21.8

)

Income (loss) on equity method investments


3.2


(8.5

)


0.7


(11.4

)

Income from Continuing Operations


204.1


164.0


593.3


523.4


Income from discontinued operations, net of tax


14.6


129.7


15.2


41.6


Net Income


218.7


293.7


608.5


565.0


Less: Net income attributable to noncontrolling interests


1.3


0.7


3.8


2.5


Net Income Attributable to Ingersoll Rand Inc.

$

217.4


$

293.0


$

604.7


$

562.5


Amounts attributable to Ingersoll Rand Inc. common stockholders:


Income from continuing operations, net of tax

$

202.8


$

163.3


$

589.5


$

520.9


Income from discontinued operations, net of tax


14.6


129.7


15.2


41.6


Net income attributable to Ingersoll Rand Inc.

$

217.4


$

293.0


$

604.7


$

562.5


Basic earnings per share of common stock:


Earnings from continuing operations

$

0.50


$

0.40


$

1.45


$

1.26


Earnings from discontinued operations


0.04


0.32


0.04


0.10


Net earnings


0.54


0.72


1.49


1.36


Diluted earnings per share of common stock:


Earnings from continuing operations

$

0.50


$

0.40


$

1.44


$

1.24


Earnings from discontinued operations


0.04


0.31


0.04


0.10


Net earnings


0.53


0.71


1.47


1.34


INGERSOLL RAND INC. AND SUBSIDIARIES

CONSOLIDATED BALANCE SHEETS

(Unaudited; in millions, except share amounts)


December 31,
2022


December 31,
2021

Assets


Current assets:


Cash and cash equivalents

$

1,613.0


$

2,109.6


Accounts receivable, net of allowance for credit losses of $47.2 and $42.3, respectively


1,122.0


948.6


Inventories


1,025.4


854.2


Other current assets


206.9


186.9


Assets of discontinued operations - current


15.6


Total current assets


3,967.3


4,114.9


Property, plant and equipment, net of accumulated depreciation of $417.4 and $357.7, respectively


624.4


648.6


Goodwill


6,064.2


5,981.6


Other intangible assets, net


3,578.6


3,912.7


Deferred tax assets


22.3


28.0


Other assets


509.1


468.7


Total assets

$

14,765.9


$

15,154.5


Liabilities and Stockholders' Equity


Current liabilities:


Short-term borrowings and current maturities of long-term debt

$

36.5


$

38.8


Accounts payable


778.7


670.5


Accrued liabilities


858.8


741.3


Liabilities of discontinued operations - current


17.1


Total current liabilities


1,674.0


1,467.7


Long-term debt, less current maturities


2,716.1


3,401.8


Pensions and other postretirement benefits


147.2


195.1


Deferred income taxes


610.6


708.6


Other liabilities


360.8


310.1


Total liabilities

$

5,508.7


$

6,083.3


Stockholders' equity:


Common stock, $0.01 par value; 1,000,000,000 shares authorized; 426,327,805 and 423,785,571 shares issued as of December 31, 2022 and 2021, respectively


4.3


4.3


Capital in excess of par value


9,476.8


9,408.6


Retained earnings


950.9


378.6


Accumulated other comprehensive loss


(251.7

)


(41.6

)

Treasury stock at cost; 21,210,095 and 16,000,364 shares as of December 31, 2022 and 2021, respectively


(984.5

)


(748.4

)

Total Ingersoll Rand stockholders' equity

$

9,195.8


$

9,001.5


Noncontrolling interests


61.4


69.7


Total equity

$

9,257.2


$

9,071.2


Total liabilities and equity

$

14,765.9


$

15,154.5


INGERSOLL RAND INC. AND SUBSIDIARIES

CONSOLIDATED STATEMENTS OF CASH FLOWS

(Unaudited; in millions)


Twelve Month Period Ended December 31,


2022


2021

Cash Flows From Operating Activities From Continuing Operations:


Net income

$

608.5


$

565.0


Income from discontinued operations, net of tax


15.2


41.6


Income from continuing operations


593.3


523.4


Adjustments to reconcile net income from continuing operations to net cash provided by operating activities from continuing operations:


Amortization of intangible assets


347.6


332.9


Depreciation


85.2


89.2


Non-cash restructuring charges


6.0


1.1


Stock-based compensation expense


78.9


87.2


Loss (income) on equity method investments


(0.7

)


11.4


Foreign currency transaction gains, net


(5.9

)


(12.0

)

Loss on extinguishment of debt


1.1


9.0


Non-cash adjustments to carrying value of LIFO inventories


36.1


33.2


Deferred income taxes


(85.8

)


(103.6

)

Other non-cash adjustments


7.0


(0.2

)

Changes in assets and liabilities:


Receivables


(195.2

)


(62.5

)

Inventories


(225.6

)


(134.4

)

Accounts payable


120.4


118.2


Accrued liabilities


101.2


(220.0

)

Other assets and liabilities, net


1.8


(45.1

)

Net cash provided by operating activities from continuing operations


865.4


627.8


Cash Flows From Investing Activities From Continuing Operations:


Capital expenditures


(94.6

)


(64.1

)

Net cash paid in acquisitions


(246.8

)


(974.8

)

Disposals of property, plant and equipment


9.5


Other investing


4.1


Net cash used in investing activities from continuing operations


(337.3

)


(1,029.4

)

Cash Flows From Financing Activities From Continuing Operations:


Principal payments on long-term debt


(655.6

)


(435.7

)

Purchases of treasury stock


(261.1

)


(736.8

)

Cash dividends on common stock


(32.4

)


(8.2

)

Proceeds from stock option exercises


19.3


23.7


Payments of interest rate cap premiums


(13.4

)


Payments of deferred and contingent acquisition consideration


(4.6

)


Other financing


(6.2

)


Net cash used in financing activities from continuing operations


(954.0

)


(1,157.0

)

Cash Flows From Discontinued Operations:


Net cash used in operating activities


(5.1

)


(12.3

)

Net cash provided by investing activities


4.4


1,943.7


Net cash provided by (used in) discontinued operations


(0.7

)


1,931.4


Effect of exchange rate changes on cash and cash equivalents


(70.0

)


(14.1

)

Net increase (decrease) in cash and cash equivalents


(496.6

)


358.7


Cash and cash equivalents, beginning of year


2,109.6


1,750.9


Cash and cash equivalents, end of year

$

1,613.0


$

2,109.6


Contacts

Investor Relations:
Matthew Fort
This email address is being protected from spambots. You need JavaScript enabled to view it.


Read full story here

COLUMBUS, Ind.--(BUSINESS WIRE)--Cummins Inc. (NYSE: CMI) today announced that its Filtration business, Atmus Filtration Technologies, has filed a registration statement on Form S-1 with the U.S. Securities and Exchange Commission (the "SEC") for a proposed underwritten initial public offering (IPO) of newly issued common stock.

Atmus Filtration Technologies intends to apply to have its common stock listed on the New York Stock Exchange (NYSE) under the symbol ATMU. The number of shares to be offered and the price range for the offering have not yet been determined. The IPO is expected to commence after the completion of the SEC review process, subject to market and other conditions.

Steph Disher will continue to lead Atmus Filtration Technologies as CEO alongside an experienced and capable leadership team. Atmus Filtration Technologies, which was founded by Cummins in 1958, is one of the global leaders of filtration products for on-highway commercial vehicles and off-highway agriculture, construction, mining and power generation vehicles and equipment. The company’s name is derived from “atmosphere” and reflects its purpose of creating a better future by protecting what is important.

A registration statement on Form S-1 relating to these securities has been filed with the SEC but has not yet become effective. These securities may not be sold, nor may offers to buy be accepted, prior to the time the registration statement becomes effective. This press release does not constitute an offer to sell or the solicitation of an offer to buy any securities, and shall not constitute an offer, solicitation or sale in any jurisdiction in which such offer, solicitation or sale would be unlawful prior to registration or qualification under the securities laws of that jurisdiction. Any offers, solicitations or offers to buy, or any sales of securities will be made in accordance with the registration requirements of the Securities Act of 1933, as amended (the "Securities Act"). This announcement is being issued in accordance with Rule 135 under the Securities Act.

Goldman Sachs & Co. LLC and J.P. Morgan Securities LLC will act as joint lead book-running managers and as representatives of the underwriters for the proposed offering. Baird, BofA Securities, and Wells Fargo Securities will also act as joint book running managers. The proposed offering will be made only by means of a prospectus. When available, copies of the preliminary prospectus relating to the proposed offering may be obtained for free from (i) Goldman Sachs & Co. LLC, Attention: Prospectus Department, 200 West Street, New York, New York 10282, via telephone: 1-866-471-2526, or via email: This email address is being protected from spambots. You need JavaScript enabled to view it.; (ii) J.P. Morgan Securities LLC, c/o Broadridge Financial Solutions, 1155 Long Island Avenue, Edgewood, NY 11717, via telephone at (866) 803-9204, or via e-mail at This email address is being protected from spambots. You need JavaScript enabled to view it..

About Cummins Inc.

Cummins Inc., a global power leader, is a corporation of complementary business segments that design, manufacture, distribute and service a broad portfolio of power solutions. The company’s products range from diesel, natural gas, electric and hybrid powertrains and powertrain-related components including filtration, aftertreatment, turbochargers, fuel systems, controls systems, air handling systems, automated transmissions, axles, drivelines, brakes, suspension systems, electric power generation systems, batteries, electrified power systems, electric powertrains, hydrogen production and fuel cell products. Headquartered in Columbus, Indiana (U.S.), since its founding in 1919, Cummins employs approximately 73,600 people committed to powering a more prosperous world through three global corporate responsibility priorities critical to healthy communities: education, environment and equality of opportunity. Cummins serves its customers online, through a network of company-owned and independent distributor locations, and through thousands of dealer locations worldwide and earned about $2.2 billion on sales of $28.1 billion in 2022. See how Cummins is powering a world that's always on by accessing news releases and more information at https://www.cummins.com/always-on.

Forward-looking disclosure statement

Information provided in this release that is not purely historical are forward-looking statements within the meaning of the Private Securities Litigation Reform Act of 1995, including statements regarding our forecasts, guidance, preliminary results, expectations, hopes, beliefs and intentions on strategies regarding the future. These forward-looking statements include, without limitation, statements relating to our plans and expectations for our revenues and EBITDA. Our actual future results could differ materially from those projected in such forward-looking statements because of a number of factors, including, but not limited to: any adverse results of our internal review into our emissions certification process and compliance with emission standards; increased scrutiny from regulatory agencies, as well as unpredictability in the adoption, implementation and enforcement of emission standards around the world; changes in international, national and regional trade laws, regulations and policies; changes in taxation; global legal and ethical compliance costs and risks; evolving environmental and climate change legislation and regulatory initiatives; future bans or limitations on the use of diesel-powered products; failure to successfully integrate and / or failure to fully realize all of the anticipated benefits of the acquisition of Meritor, Inc.; raw material, transportation and labor price fluctuations and supply shortages; any adverse effects of the conflict between Russia and Ukraine and the global response (including government bans or restrictions on doing business in Russia); aligning our capacity and production with our demand; the actions of, and income from, joint ventures and other investees that we do not directly control; large truck manufacturers' and original equipment manufacturers' customers discontinuing outsourcing their engine supply needs or experiencing financial distress, or change in control; product recalls; variability in material and commodity costs; the development of new technologies that reduce demand for our current products and services; lower than expected acceptance of new or existing products or services; product liability claims; our sales mix of products; failure to complete, adverse results from or failure to realize the expected benefits of the separation of our filtration business; our plan to reposition our portfolio of product offerings through exploration of strategic acquisitions and divestitures and related uncertainties of entering such transactions; increasing interest rates; challenging markets for talent and ability to attract, develop and retain key personnel; climate change, global warming, more stringent climate change regulations, accords, mitigation efforts, greenhouse gas (GHG) regulations or other legislation designed to address climate change; exposure to potential security breaches or other disruptions to our information technology environment and data security; political, economic and other risks from operations in numerous countries including political, economic and social uncertainty and the evolving globalization of our business; competitor activity; increasing competition, including increased global competition among our customers in emerging markets; failure to meet environmental, social and governance (ESG) expectations or standards, or achieve our ESG goals; labor relations or work stoppages; foreign currency exchange rate changes; the performance of our pension plan assets and volatility of discount rates; the price and availability of energy; continued availability of financing, financial instruments and financial resources in the amounts, at the times and on the terms required to support our future business; and other risks detailed from time to time in our SEC filings, including particularly in the Risk Factors section of our 2022 Annual Report on Form 10-K and Quarterly Reports on Form 10-Q. Shareholders, potential investors and other readers are urged to consider these factors carefully in evaluating the forward-looking statements and are cautioned not to place undue reliance on such forward-looking statements. The forward-looking statements made herein are made only as of the date of this press release and we undertake no obligation to publicly update any forward-looking statements, whether as a result of new information, future events or otherwise. More detailed information about factors that may affect our performance may be found in our filings with the SEC, which are available at http://www.sec.gov or at http://www.cummins.com in the Investor Relations section of our website.


Contacts

Jon Mills
Cummins Inc.
Director, External Communications
317-658-4540
This email address is being protected from spambots. You need JavaScript enabled to view it.

WESTMINSTER, Colo.--(BUSINESS WIRE)--Maxar Technologies (NYSE:MAXR) (TSX:MAXR), provider of comprehensive space solutions and secure, precise, geospatial intelligence, today announced that the Guyana Ministry of Natural Resources (MNR) has entered into a three-year contractual agreement with Maxar to provide the nation with environmental monitoring services for both offshore and terrestrial applications.


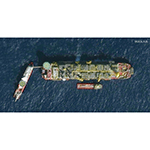
Guyana’s Environmental Protection Agency (EPA) will utilize Maxar’s Crow’s Nest Maritime Monitoring and Security products to support offshore petroleum monitoring. The EPA will use the Crow’s Nest Maritime Tipping and Cueing Service, which leverages Maxar’s very-high resolution optical satellites, to monitor drilling vessels for regulatory compliance and safety. It will also use the Crow’s Nest Multi-Sensor Oil Detection Service to identify potential spills.

The agreement with Guyana marks Maxar’s first Crow’s Nest contract in Latin America and the Caribbean and is an important milestone in the application of Crow’s Nest to the environmentally critical use case of monitoring offshore petroleum activity.

Guyana’s economy has grown significantly as a result of the influx of capital from newly discovered offshore oil and gas resources, and Maxar's monitoring capabilities will help Guyana’s EPA ensure the resource is sustainably managed, environmentally safe and able to be extracted for years to come.

Also included in the agreement, the Guyana Forestry Commission will combine several Maxar capabilities to track illegal deforestation, protect mangroves and safeguard the country’s biodiversity. Products that will support this work include:

  • SecureWatch: This cloud-based platform provides on-demand access to Maxar's high-accuracy, high-resolution satellite imagery and analytics.
  • Persistent Change Monitoring (PCM): PCM highlights human changes in an area and displays persistent change accessibly as a color-coded geospatial data layer.
  • Imagery tasking capabilities.

Maxar’s geospatial data and analytics will help MNR protect the environment for future generations while also sustainably developing the extraction of Guyana’s natural resources for long-term economic gains,” said Hon. Vickram Bharrat, M.P, Guyana’s Minister of Natural Resources.

Maxar is the only company that can offer these diverse environmental monitoring technologies under a single contract,” said Tony Frazier, Maxar’s Executive Vice President and General Manager of Public Sector Earth Intelligence. “We applaud Guyana’s Ministry of Natural Resources for applying our industry-leading technology to help meet its environmental goals.”

About Maxar

Maxar Technologies (NYSE:MAXR) (TSX:MAXR) is a provider of comprehensive space solutions and secure, precise, geospatial intelligence. We deliver disruptive value to government and commercial customers to help them monitor, understand and navigate our changing planet; deliver global broadband communications; and explore and advance the use of space. Our unique approach combines decades of deep mission understanding and a proven commercial and defense foundation to deploy solutions and deliver insights with unrivaled speed, scale and cost effectiveness. Maxar’s 4,400 team members in over 20 global locations are inspired to harness the potential of space to help our customers create a better world. Maxar trades on the New York Stock Exchange and Toronto Stock Exchange as MAXR. For more information, visit www.maxar.com.

About the Guyana Ministry of Natural Resources (MNR)

MNR’s mission is to develop, implement and oversee policies for the responsible exploration, development and utilization of natural resources whilst ensuring the protection and conservation of the environment and advancement of the green economy.

Forward-Looking Statements

This press release may contain forward-looking statements that reflect management's current expectations, assumptions and estimates of future performance and economic conditions. Any such forward-looking statements are made in reliance upon the safe harbor provisions of Section 27A of the Securities Act of 1933 and Section 21E of the Securities Exchange Act of 1934. The Company cautions investors that any forward-looking statements are subject to risks and uncertainties that may cause actual results and future trends to differ materially from those matters expressed in or implied by such forward-looking statements, including those included in the Company’s filings with U.S. securities and Canadian regulatory authorities. The Company disclaims any intention or obligation to update or revise any forward-looking statements, whether as a result of new information, future events, or otherwise, other than as may be required under applicable securities law.


Contacts

Investor Relations Contact:
Jonny Bell
Maxar Investor Relations
1-303-684-5543
This email address is being protected from spambots. You need JavaScript enabled to view it.

Media Contact:
Brian Wagner
Maxar Public Sector Communications
1-202-302-8754
This email address is being protected from spambots. You need JavaScript enabled to view it.

HOUSTON--(BUSINESS WIRE)--$PSX--Mark Lashier, President and CEO of Phillips 66 (NYSE: PSX), and Jeff Dietert, Vice President of Investor Relations, will speak at the 51st Annual Scotia Howard Weil Energy Conference on Tuesday, March 7, 2023, at 9:30 a.m. ET.


The Phillips 66 leaders will discuss the company’s plans to continue delivering shareholder value and advancing strategic initiatives, as well as its ongoing commitment to disciplined capital allocation.

To access the webcast, go to the Events and Presentations section of the Phillips 66 Investors site, phillips66.com/investors. A replay will be archived on the Events and Presentations page the day after the event, and a transcript will be available at a later date.

About Phillips 66

Phillips 66 (NYSE: PSX) manufactures, transports and markets products that drive the global economy. The diversified energy company’s portfolio includes Midstream, Chemicals, Refining, and Marketing and Specialties businesses. Headquartered in Houston, Phillips 66 has employees around the globe who are committed to safely and reliably providing energy and improving lives while pursuing a lower-carbon future. For more information, visit phillips66.com or follow @Phillips66Co on LinkedIn or Twitter.


Contacts

Jeff Dietert (investors)
832-765-2297
This email address is being protected from spambots. You need JavaScript enabled to view it.

Owen Simpson (investors)
832-765-2297
This email address is being protected from spambots. You need JavaScript enabled to view it.

Thaddeus Herrick (media)
855-841-2368
This email address is being protected from spambots. You need JavaScript enabled to view it.

DALLAS--(BUSINESS WIRE)--Granite Ridge Resources, Inc. (“Granite Ridge” or the “Company”) (NYSE: GRNT) today announced a quarterly cash dividend of $0.11 per share of common stock and further announced that it will host a webcast and conference call on Tuesday, March 28, 2023 at 10:00 a.m. Central time to discuss its fourth quarter and full-year 2022 earnings, along with initial 2023 guidance.


Quarterly Dividend

The Company’s Board of Directors declared a cash dividend of $0.11 per share of the Company’s common stock payable on March 15, 2023 to stockholders of record on March 1, 2023.

Fourth Quarter and Full-Year 2022 Earnings Conference Call

The Company will host a webcast and conference call on Tuesday, March 28, 2023 at 10:00 a.m. Central time to discuss its fourth quarter and full-year 2022 earnings. Instructions on how to access the webcast and conference call are shown below.


Webcast:

We encourage participants to pre-register for the webcast using the following link https://events.q4inc.com/attendee/137394472. Alternatively, a link to the webcast can be found on the Company’s investor relations website.


Telephone:

Toll-free dial in number (888) 660-6093
Conference ID 4127559


An audio replay will be available through April 11, 2023. To access the audio replay dial (800) 770-2030 and enter conference ID 4127559.


About Granite Ridge

Granite Ridge is a scaled, non-operated oil & gas exploration and production company. We invest in a diversified portfolio of production and top-tier acreage across the Permian and four other prolific US basins in partnership with proven operators. We create value by generating sustainable full-cycle risk adjusted returns for investors, offering a rewarding experience for our team, and delivering reliable energy solutions to all – safely and responsibly. For more information, visit Granite Ridge’s website at www.graniteridge.com.


Contacts

Investor and Media Contact:
This email address is being protected from spambots. You need JavaScript enabled to view it. – (214) 396-2850

Privately owned company expands footprint for a total of 14 offices in six states

TULSA, Okla.--(BUSINESS WIRE)--President of American Piping Inspection David Alcorn recently announced their company’s expansion with the opening of three new offices, Perryton, Texas; Corpus Christi, Texas; and Orange, Texas, bringing the total to 14 locations throughout the country, employing 410 people. All three locations were opened within the past six months.


Founded in 2006, American Piping Inspection is a full-service inspection company offering inspection services, quality control and auditing, mechanical integrity services, pipeline integrity services, pipeline data collection and heat-treating and radiography services.

American Piping Inspection is one of the few privately owned pipe inspection companies left in the country, allowing them the ability to continue their growth, foster the best talent and focus on customer service.

“We are known in the industry for our personalized service,” said Alcorn. “We pride ourselves on offering customized solutions for our customers, and we are constantly adapting as we stay on top of the cutting edge of technological innovation. Our team is qualified and certified to meet and exceed our industry’s requirements.”

Headquartered in Tulsa, Oklahoma, American Piping Inspection has offices in Oklahoma, New Mexico, North Dakota, Ohio, Louisiana, and Texas. They provide services for several industries including aerospace, petrochemical, hydroelectric, oil and gas, refining, pipeline, power, pulp and paper, fabrication, manufacturing and more.

“We look forward to continuing our growth trajectory in our industry,” said Alcorn. “We are already looking at new sites to expand our services in the near future.”

For more information visit www.americanpipinginspection.com


Contacts

Marnie Fernandez
(c) 918-381-4505
(e) This email address is being protected from spambots. You need JavaScript enabled to view it.

HOUSTON--(BUSINESS WIRE)--Westlake Corporation (NYSE: WLK) (the "Company" or "Westlake") today announced fourth quarter and record full-year 2022 results.


SUMMARY FINANCIAL HIGHLIGHTS ($ in millions except per share data)


Three Months Ended December 31,


Twelve Months Ended December 31,


2022


2021


2022


2021


Westlake Corporation


Net sales


$

3,299


$

3,507


$

15,794


$

11,778


Income from operations


$

327


$

873


$

3,050


$

2,800


Net income attributable to Westlake Corporation


$

232


$

644


$

2,247


$

2,015


Diluted earnings per common share


$

1.79


$

4.98


$

17.34


$

15.58


EBITDA


$

619


$

1,131


$

4,179


$

3,693


EBITDA margin


19%


32%


26%


31%


Performance and Essential Materials ("PEM") Segment


Net sales


$

2,361


$

2,460


$

11,008


$

8,670


Income from operations


$

219


$

821


$

2,416


$

2,549


EBITDA


$

443


$

997


$

3,237


$

3,247


EBITDA margin


19%


41%


29%


37%


Housing and Infrastructure Products ("HIP") Segment


Net sales


$

938


$

1,047


$

4,786


$

3,108


Income from operations


$

68


$

86


$

675


$

356


EBITDA


$

133


$

162


$

955


$

534


EBITDA margin


14%


15%


20%


17%

BUSINESS HIGHLIGHTS

For the full year of 2022, Westlake reported record net sales of $15.8 billion, record net income of $2.2 billion and record EBITDA (earnings before interest expense, income taxes, depreciation and amortization) of $4.2 billion. These results were driven by a strong macroeconomic environment in the first half of 2022 before economic conditions deteriorated beginning mid-year leading to a reduction in demand from a downturn in global industrial and North American housing activity, which continued throughout the fourth quarter of 2022.

In the fourth quarter of 2022, Westlake achieved net sales of $3.3 billion, net income of $232 million and EBITDA of $619 million. Earnings per share were $1.79 compared to $4.98 in the prior-year period, and $3.10 in the prior quarter, reflecting generally lower sales prices, unfavorable sales mix changes, elevated energy costs, and lower volumes in certain product categories. While global feedstock and energy costs receded from their recent peaks, they remained elevated and continued to pressure margins. Meanwhile, on a positive note, global markets for caustic soda remained tight with higher sales prices supporting earnings in the United States and improving profitability in Europe.

Performance and Essential Materials average sales price decreased 9% from the third quarter of 2022 while Housing and Infrastructure Products average sales prices were flat quarter-over-quarter. Overall sales prices for the Company decreased 7% sequentially from the previous quarter.

Sales volumes for Performance and Essential Materials decreased 4% from the third quarter of 2022 while Housing and Infrastructure Products sales volumes decreased 24% quarter-over-quarter. Overall sales volumes for the Company decreased 10% sequentially from the previous quarter.

EXECUTIVE COMMENTARY

“2022 was a monumental year for Westlake as we posted record full-year sales and net income and added Westlake Epoxy to our Performance Materials portfolio while further integrating the businesses acquired in the second half of 2021 into our Housing and Infrastructure Products segment. Our full-year results reflect the strong start to the year, characterized by tight supply-demand conditions and improving profitability across our businesses, which gave way to softer market conditions in the second half of the year as higher global energy costs and increasing interest rates negatively impacted buyer sentiment and demand for our products,” said Albert Chao, President and Chief Executive Officer.

“The fourth quarter of 2022 was challenged by weaker demand in most geographies and product categories. Our Performance and Essential Materials segment was supported by continued supply-demand tightening for caustic soda, which led to higher global sales prices. Our low-cost position in North America allowed us to shift sales of polyethylene and PVC resin into the export markets; however, realized pricing and margins were lower in this channel. Meanwhile, in our Housing and Infrastructure Products segment, volume declines reflected seasonality inherent in this business along with customer destocking and the continuing impact on housing affordability from the recent run up of mortgage rates in the United States; however, product pricing and repair and remodel demand have remained relatively resilient,” continued Mr. Chao.

“Looking forward into 2023, global macroeconomic uncertainty remains high and while we are not immune to weaker global demand, we remain confident in the fundamentals of our business. We expect Performance and Essential Materials to run profitably at higher operating rates, supported by our North American footprint that benefits from a structural global cost advantage in feedstocks, fuel and power. Stabilizing power and fuel costs in Europe and the potential for improving economic growth in China may further benefit Performance and Essential Materials. In Housing and Infrastructure Products, the slowing of residential construction is expected to continue in response to historically low home affordability; however, we expect modest growth in repair and remodeling activity, consistent with JCHS’s Leading Indicator of Remodeling Activity (LIRA) forecast. While the challenging environment may continue in the near-term, we believe we are well-positioned across our product portfolio to benefit from structural trends in our markets and deliver greater value to our customers and investors as economic conditions improve,” concluded Mr. Chao.

RESULTS

Consolidated Results

For the three months ended December 31, 2022, the Company reported quarterly net income of $232 million, or $1.79 per share, on net sales of $3,299 million. The year-over-year decrease in net income of $412 million from the fourth quarter of 2021 was primarily due to lower sales prices and negative sales mix changes in Performance Materials; lower production and sales volumes, especially in Housing and Infrastructure Products; and higher manufacturing costs. These impacts were partially offset by higher sales prices for caustic soda and chlorine; lower restructuring, transaction and integration-related costs; and a lower effective tax rate.

Fourth quarter 2022 net income of $232 million decreased by $169 million sequentially as compared to the third quarter of 2022. The sequential decrease in net income compared to the prior quarter was primarily due to lower sales prices in Performance Materials, inclusive of negative mix shifts towards export markets; and lower Housing and Infrastructure Products volumes due to both seasonal trends and continued slowing demand. These impacts were partially offset by higher sales prices for caustic soda.

For the full year of 2022, net income of $2,247 million increased by $232 million from the full year of 2021 net income of $2,015 million. Income from operations of $3,050 million for the full year of 2022 increased by $250 million as compared to income from operations of $2,800 million for the full year of 2021. The increases in net income and income from operations were primarily due to higher sales prices for caustic soda, chlorine and many of our housing and infrastructure products; and earnings contributions from acquisitions completed in the second half of 2021 and first half of 2022.

EBITDA of $619 million for the fourth quarter of 2022 decreased by $512 million compared to fourth quarter 2021 EBITDA of $1.1 billion. Fourth quarter 2022 EBITDA decreased by $185 million compared to third quarter 2022 EBITDA of $804 million.

Cash and Debt

Net cash provided by operating activities was $835 million for the fourth quarter of 2022 and $3,395 million for the full year of 2022. Capital expenditures for the fourth quarter and full year of 2022 were $297 million and $1,108 million, respectively. For the fourth quarter of 2022, free cash flow (net cash provided by operating activities less capital expenditures) was $538 million, an increase of $25 million as compared to the fourth quarter of 2021 due to favorable working capital changes. For the full year of 2022, free cash flow was $2,287 million, an increase of $551 million as compared to the full year of 2021 due to the higher net income. As of December 31, 2022, cash and cash equivalents were $2,228 million and total debt was $4,879 million.

A reconciliation of EBITDA to net income, income from operations and net cash provided by operating activities as well as a reconciliation of free cash flow to net cash flow provided by operating activities can be found in the financial schedules at the end of this press release.

Performance and Essential Materials Segment

Performance and Essential Materials income from operations of $219 million for the fourth quarter of 2022 decreased by $602 million as compared to the fourth quarter of 2021. This year-over-year decrease was due to lower sales prices for most of our major products; lower sales volumes (excluding the recently acquired epoxy business); negative sales mix (with increased exports for polyethylene and PVC resin); and higher fuel, power and overall manufacturing costs. These negative impacts were partially offset by higher sales prices for caustic soda and chlorine.

Sequentially, Performance and Essential Materials income from operations decreased by $134 million as compared to the third quarter of 2022. This decrease in income from operations versus the prior quarter was primarily due to lower sales prices and negative sales mix (particularly for PVC resin); and lower operating rates and sales volume for Performance Materials. These negative factors were partially offset by higher sales prices for caustic soda and chlorine; and lower feedstock, fuel and power costs.

For the full year of 2022, Performance Materials net sales of $6,964 million increased by $967 million as compared to 2021 primarily due to the epoxy acquisition that we completed in early 2022. Essential Materials net sales of $4,044 million increased by $1,371 million from 2021 primarily due to significantly higher global prices for caustic soda. Performance and Essential Materials income from operations of $2,416 million decreased by $133 million as compared to income from operations of $2,549 million for the full year of 2021. This decrease in income from operations versus the prior-year was primarily due to lower sales prices and integrated margins for polyethylene; lower PVC resin sales volume; higher global fuel and power prices; and a $70 million pre-tax charge related to pending litigation recorded in the third quarter of 2022.

Housing and Infrastructure Products Segment

For the fourth quarter of 2022, Housing and Infrastructure Products income from operations of $68 million decreased by $18 million as compared to the fourth quarter of 2021. The year-over-year decrease was the result of lower operating rates and sales volumes, partially offset by higher sales prices across most product categories.

Sequentially, Housing and Infrastructure Products income from operations decreased by $118 million as compared to the third quarter of 2022. This decrease in income from operations versus the prior quarter was the result of lower operating rates and lower sales volumes across all product categories.

For the full year of 2022, Housing Products net sales of $3,864 million increased by $1,530 million as compared to 2021 primarily due to higher sales prices for all products as well as a full year of earnings contribution from the acquisitions completed in the second half of 2021. Infrastructure Products net sales of $922 million increased by $148 million as compared to 2021 primarily due to significantly higher sales prices. Housing and Infrastructure Products income from operations of $675 million increased by $319 million as compared to income from operations of $356 million for the full year of 2021. This increase in income from operations was primarily due to higher sales prices and sales volume for Housing Products; full-year earnings contributions from the acquisitions completed in the second half of 2021; and higher sales prices for Infrastructure Products.

Forward-Looking Statements

The statements in this release and the related teleconference relating to matters that are not historical facts, including statements regarding our outlook for the performance of our business segments, our belief that our Performance and Essential Materials segment will run profitably at higher operating rates, our belief that we benefit from having high integration and a structural global cost advantage in feedstock, power and fuel, our expectations regarding economic growth in China, our expectations regarding repair and remodeling activity, new construction activity, destocking activity and infrastructure spending, our ability to weather economic volatility, higher energy prices, our market position, our ability to scale operations, the contribution of recent acquisitions and global demand for our products, and our ability to deliver greater value to customers and investors as general economic conditions improve are forward-looking statements. These forward-looking statements are subject to significant risks and uncertainties. Actual results could differ materially, based on factors including, but not limited to: the COVID-19 pandemic and the response thereto; general economic and business conditions; the cyclical nature of the industry; availability, cost and volatility of raw materials and utilities, including natural gas and natural gas liquids from shale production; the price of crude oil; uncertainties associated with the United States and worldwide economies, including those due to global economic and financial conditions; governmental regulatory actions, including environmental regulation and changes in trade policies; political unrest; industry production capacity and operating rates; the supply/demand balance for Westlake's products; competitive products and pricing pressures; access to capital markets; technological developments; the effect and results of litigation and settlements of litigation; operating interruptions; the ability to integrate recent acquisitions; the diversion of management time on transaction-related issues; and other risk factors. For more detailed information about the factors that could cause actual results to differ materially, please refer to Westlake's Annual Report on Form 10-K for the year ended December 31, 2021, which was filed with the SEC in February 2022, and Quarterly Report on Form 10-Q for the quarter ended September 30, 2022, which was filed with the SEC in November 2022.

Use of Non-GAAP Financial Measures

This release makes reference to certain "non-GAAP" financial measures, such as EBITDA and free cash flow, as defined in Regulation G of the U.S. Securities Exchange Act of 1934, as amended. For this purpose, a non-GAAP financial measure is generally defined by the Securities and Exchange Commission ("SEC") as a numerical measure of a registrant's historical or future financial performance, financial position or cash flows that (1) excludes amounts, or is subject to adjustments that have the effect of excluding amounts, that are included in the most directly comparable measure calculated and presented in accordance with GAAP in the statement of income, balance sheet or statement of cash flows (or equivalent statements) of the registrant; or (2) includes amounts, or is subject to adjustments that have the effect of including amounts, that are excluded from the most directly comparable measure so calculated and presented. We report our financial results in accordance with U.S. generally accepted accounting principles ("U.S. GAAP"), but believe that certain non-GAAP financial measures, such as EBITDA and free cash flow, provide useful supplemental information to investors regarding the underlying business trends and performance of the Company's ongoing operations and are useful for period-over-period comparisons of such operations. These non-GAAP financial measures should be considered as a supplement to, and not as a substitute for, or superior to, the financial measures prepared in accordance with U.S. GAAP. A reconciliation of (i) EBITDA to net income, income from operations and net cash provided by operating activities and (ii) free cash flow to net cash provided by operating activities can be found in the financial schedules at the end of this press release.

About Westlake

Westlake is a global manufacturer and supplier of materials and innovative products that enhance life every day. Headquartered in Houston, with operations in Asia, Europe and North America, we provide the building blocks for vital solutions — from housing and construction, to packaging and healthcare, to automotive and consumer. For more information, visit the Company's web site at www.westlake.com.

Westlake Corporation Conference Call Information:

A conference call to discuss Westlake Corporation's fourth quarter 2022 results will be held Tuesday, February 21, 2023 at 11:00 AM Eastern Time (10:00 AM Central Time). To access the conference call, it is necessary to pre-register at https://register.vevent.com/register/BI653627905a3741a89e224aa220a66fbc. Once registered, you will receive a phone number and unique PIN number.

A replay of the conference call will be available beginning two hours after its conclusion. The conference call and replay will be available via webcast at https://edge.media-server.com/mmc/p/r2a7ck67.

WESTLAKE CORPORATION

CONSOLIDATED STATEMENTS OF OPERATIONS

(Unaudited)


Three Months Ended December 31,


Twelve Months Ended December 31,


2022


2021


2022


2021


(In millions of dollars, except per share data and share amounts)

Net sales


$

3,299


$

3,507


$

15,794


$

11,778


Cost of sales


2,732


2,411


11,721


8,283


Gross profit


567


1,096


4,073


3,495


Selling, general and administrative expenses


200


168


835


551


Amortization of intangibles


31


40


155


123


Restructuring, transaction and integration-related costs


9


15


33


21


Income from operations


327


873


3,050


2,800


Interest expense


(43

)


(46

)


(177

)


(176

)

Other income, net


21


18


73


53


Income before income taxes


305


845


2,946


2,677


Provision for income taxes


57


184


649


607


Net income


248


661


2,297


2,070


Net income attributable to noncontrolling interests


16


17


50


55


Net income attributable to Westlake Corporation


$

232


$

644


$

2,247


$

2,015


Earnings per common share attributable to Westlake Corporation:


Basic


$

1.80


$

5.01


$

17.46


$

15.66


Diluted


$

1.79


$

4.98


$

17.34


$

15.58


Weighted average common shares outstanding:


Basic


127,532,119


127,853,277


127,970,445


128,002,911


Diluted


128,376,159


128,674,359


128,845,562


128,697,982


WESTLAKE CORPORATION

CONDENSED CONSOLIDATED BALANCE SHEETS

(Unaudited)


December 31,


2022


2021


(In millions of dollars)

ASSETS


Current assets


Cash and cash equivalents


$

2,228


$

1,908

Accounts receivable, net


1,801


1,868

Inventories


1,866


1,407

Prepaid expenses and other current assets


78


80

Total current assets


5,973


5,263

Property, plant and equipment, net


8,525


7,606

Other assets, net


6,052


5,590

Total assets


$

20,550


$

18,459


LIABILITIES AND EQUITY


Current liabilities (accounts payable and accrued and other liabilities)


$

2,298


$

2,075

Current portion of long-term debt, net


269

Long-term debt, net


4,879


4,911

Other liabilities


2,908


2,676

Total liabilities


10,085


9,931

Total Westlake Corporation stockholders' equity


9,931


7,955

Noncontrolling interests


534


573

Total equity


10,465


8,528

Total liabilities and equity


$

20,550


$

18,459

WESTLAKE CORPORATION

CONDENSED CONSOLIDATED STATEMENTS OF CASH FLOWS

(Unaudited)


Twelve Months Ended December 31,


2022


2021


(In millions of dollars)

Cash flows from operating activities


Net income


$

2,297


$

2,070


Adjustments to reconcile net income to net cash provided by operating activities:


Depreciation and amortization


1,056


840


Deferred income taxes


(21

)


23


Net loss on disposition and others


87


75


Other balance sheet changes


(24

)


(614

)

Net cash provided by operating activities


3,395


2,394


Cash flows from investing activities


Acquisition of business, net of cash acquired


(1,203

)


(2,554

)

Additions to investments in unconsolidated subsidiaries


(180

)


(24

)

Additions to property, plant and equipment


(1,108

)


(658

)

Other, net


12


23


Net cash used for investing activities


(2,479

)


(3,213

)

Cash flows from financing activities


Debt issuance costs


(18

)

Distributions to noncontrolling interests


(60

)


(48

)

Dividends paid


(169

)


(145

)

Proceeds from debt issuance


1,671


Repayment of senior notes


(250

)


Repurchase of common stock for treasury


(101

)


(30

)

Other, net


(7

)


7


Net cash provided by (used for) financing activities


(587

)


1,437


Effect of exchange rate changes on cash, cash equivalents and restricted cash


(24

)


(14

)

Net increase in cash, cash equivalents and restricted cash


305


604


Cash, cash equivalents and restricted cash at beginning of period


1,941


1,337


Cash, cash equivalents and restricted cash at end of period


$

2,246


$

1,941


WESTLAKE CORPORATION

SEGMENT INFORMATION

(Unaudited)


Three Months Ended December 31,


Twelve Months Ended December 31,


2022


2021


2022


2021


(In millions of dollars)

Net external sales


Performance and Essential Materials


Performance Materials


$

1,286


$

1,664


$

6,964


$

5,997


Essential Materials


1,075


796


4,044


2,673


Total Performance and Essential Materials


2,361


2,460


11,008


8,670


Housing and Infrastructure Products


Housing Products


758


843


3,864


2,334


Infrastructure Products


180


204


922


774


Total Housing and Infrastructure Products


938


1,047


4,786


3,108


$

3,299


$

3,507


$

15,794


$

11,778


Income (loss) from operations


Performance and Essential Materials


$

219


$

821


$

2,416


$

2,549


Housing and Infrastructure Products


68


86


675


356


Corporate and other


40


(34

)


(41

)


(105

)


$

327


$

873


$

3,050


$

2,800


Depreciation and amortization


Performance and Essential Materials


$

212


$

168


$

784


$

665


Housing and Infrastructure Products


57


70


263


168


Corporate and other


2


2


9


7


$

271


$

240


$

1,056


$

840


Other income, net


Performance and Essential Materials


$

12


$

8


$

37


$

33


Housing and Infrastructure Products


8


6


17


10


Corporate and other


1


4


19


10


$

21


$

18


$

73


$

53


WESTLAKE CORPORATION

RECONCILIATION OF EBITDA TO NET INCOME, INCOME FROM OPERATIONS AND

NET CASH PROVIDED BY OPERATING ACTIVITIES

(Unaudited)


Three Months

Ended

September 30,


Three Months Ended December 31,


Twelve Months Ended December 31,


2022


2022


2021


2022


2021


(In millions of dollars, except percentages)

Net cash provided by operating activities


$

947


$

835


$

757


$

3,395


$

2,394


Changes in operating assets and liabilities and other


(572

)


(652

)


(123

)


(1,119

)


(301

)

Deferred income taxes


37


65


27


21


(23

)

Net income


412


248


661


2,297


2,070


Less:


Other income, net


24


21


18


73


53


Interest expense


(44

)


(43

)


(46

)


(177

)


(176

)

Provision for income taxes


(84

)


(57

)


(184

)


(649

)


(607

)

Income from operations


516


327


873


3,050


2,800


Add:


Depreciation and amortization


264


271


240


1,056


840


Other income, net


24


21


18


73


53


EBITDA


$

804


$

619


$

1,131


$

4,179


$

3,693


Net external sales


$

3,956


$

3,299


$

3,507


$

15,794


$

11,778


EBITDA Margin


20%


19%


32%


26%


31%


Contacts

Contact—(713) 960-9111
Investors—Steve Bender
Media—L. Benjamin Ederington


Read full story here

HOUSTON--(BUSINESS WIRE)--Black Stone Minerals, L.P. (NYSE: BSM) (“Black Stone Minerals,” “Black Stone,” or “the Company”) today announces its financial and operating results for the fourth quarter and full year of 2022 and provides guidance for 2023.


Fourth Quarter 2022 Highlights

  • Mineral and royalty production for the fourth quarter of 2022 equaled 40.0 MBoe/d, an increase of 7% over the prior quarter and the highest mineral and royalty production ever reported by the Company; total production, including working interest volumes, was 42.1 MBoe/d for the quarter
  • Net income for the quarter was $183.2 million. Adjusted EBITDA for the quarter totaled a record $131.7 million
  • Distributable cash flow was $125.3 million for the fourth quarter, which represents an 8% increase relative to the third quarter of 2022, and also a record amount for Black Stone as a public company
  • Announced a distribution of $0.475 per unit with respect to the fourth quarter of 2022, which represents a 6% increase from the distribution paid with respect to the third quarter of 2022. Distribution coverage for all units was 1.26x
  • Our quarterly results represent new high-water marks in mineral and royalty production, net income, Adjusted EBITDA, Distributable cash flow and distributions since going public
  • Total debt at the end of the quarter was $10 million; total debt to trailing twelve-month Adjusted EBITDA was 0.02x at year-end

Full Year Financial and Operational Highlights

  • Mineral and royalty volumes in 2022 increased 4% over the prior year to average 34.3 MBoe/d; full year 2022 production was 37.1 MBoe/d
  • Reported 2022 net income and Adjusted EBITDA of $476.5 million and $466.4 million, respectively
  • Increased cash distributions by 85% from $0.945 per unit attributable to the full year 2021 to $1.745 per unit attributable to the full year 2022
  • Reduced total outstanding debt by $79 million during 2022

Management Commentary

Thomas L. Carter, Jr., Black Stone Minerals’ Chief Executive Officer and Chairman, commented, “Our record fourth quarter results capped a very successful year for Black Stone Minerals. Without issuing additional equity, we reduced our total debt and increased royalty production through our organic growth efforts to attract additional operator capital to our existing acreage positions. The development programs on our Haynesville and Bossier Shelby Trough acreage continues to ramp up with Aethon as our operating partner. In addition, new drilling activity is continuing to increase across numerous operators on our East Texas Austin Chalk acreage. We enter 2023 well positioned to drive further royalty production growth while maintaining our very healthy balance sheet.”

Quarterly Financial and Operating Results

Production

Black Stone Minerals reported mineral and royalty volumes of 40.0 MBoe/d (74% natural gas) for the fourth quarter of 2022, compared to 37.3 MBoe/d for the third quarter of 2022. Mineral and royalty production was 35.2 MBoe/d for the fourth quarter of 2021. Mineral and royalty production in the fourth quarter of 2022 benefited from a large number of initial payments received on wells in the Midland and Delaware basins, as well as a one-time adjustment to reflect the impact of higher overrides on farmed-out Shelby Trough wells that had achieved payout.

Working interest production for the fourth quarter of 2022 was 2.1 MBoe/d, and represents a decrease of 19% from the 2.6 MBoe/d for the quarter ended September 30, 2022 and a decrease of 46% from the 3.9 MBoe/d for the quarter ended December 31, 2021. The continued decline in working interest production is consistent with the Company's decision to farm out its working-interest participation to third-party capital providers.

Total reported production averaged 42.1 MBoe/d (95% mineral and royalty, 74% natural gas) for the fourth quarter of 2022. Total production was 40.0 MBoe/d and 39.1 MBoe/d for the quarters ended September 30, 2022 and December 31, 2021, respectively.

Realized Prices, Revenues, and Net Income

The Company’s average realized price per Boe, excluding the effect of derivative settlements, was $50.67 for the quarter ended December 31, 2022. This is a decrease of 15% from $59.30 per Boe for the third quarter of 2022 and a 15% increase compared to $44.12 for the fourth quarter of 2021.

Black Stone reported oil and gas revenue of $196.2 million (44% oil and condensate) for the fourth quarter of 2022, a decrease of 10% from $218.0 million in the third quarter of 2022. Oil and gas revenue in the fourth quarter of 2021 was $158.9 million.

The Company reported a gain on commodity derivative instruments of $31.4 million for the fourth quarter of 2022, composed of a $40.6 million loss from realized settlements and a non-cash $72.0 million unrealized gain due to the change in value of Black Stone’s derivative positions during the quarter. Black Stone reported a loss on commodity derivative instruments of $4.7 million and a gain of $18.4 million for the quarters ended September 30, 2022 and December 31, 2021, respectively.

Lease bonus and other income was $2.8 million for the fourth quarter of 2022, primarily related to leasing activity in Austin Chalk, the Bakken Three Forks and Haynesville plays. Lease bonus and other income for the quarters ended September 30, 2022 and December 31, 2021 was $3.2 million and $2.1 million, respectively.

There was no impairment for the quarters ended December 31, 2022, September 30, 2022, and December 31, 2021.

The Company reported net income of $183.2 million for the quarter ended December 31, 2022, compared to net income of $168.5 million in the preceding quarter. For the quarter ended December 31, 2021, net income was $134.2 million.

Adjusted EBITDA and Distributable Cash Flow

Adjusted EBITDA for the fourth quarter of 2022 was $131.7 million, which compares to $123.1 million in the third quarter of 2022 and $77.6 million in the fourth quarter of 2021. Distributable cash flow for the quarter ended December 31, 2022 was $125.3 million. For the quarters ended September 30, 2022 and December 31, 2021, Distributable cash flow was $116.5 million and $71.3 million, respectively. The reported Adjusted EBITDA and Distributable cash flow are both record levels for Black Stone as a public company.

2022 Proved Reserves

Estimated proved oil and natural gas reserves at year-end 2022 were 64.1 MMBoe, an increase of 7% from 59.8 MMBoe at year-end 2021, and were approximately 70% natural gas and 91% proved developed producing. The standardized measure of discounted future net cash flows was $1,665.0 million at the end of 2022, as compared to $972.1 million at year-end 2021.

Netherland, Sewell and Associates, Inc., an independent, third-party petroleum engineering firm, evaluated Black Stone Minerals’ estimate of its proved reserves and PV-10 at December 31, 2022. These estimates were prepared using reference prices of $94.14 per barrel of oil and $6.36 per MMBTU of natural gas in accordance with the applicable rules of the Securities and Exchange Commission (as compared to prompt month prices of $77.10 per barrel of oil and $2.275 per MMBTU of natural gas as of February 17, 2023). These prices were adjusted for quality and market differentials, transportation fees, and, in the case of natural gas, the value of natural gas liquids. A reconciliation of proved reserves is presented in the summary financial tables following this press release.

Financial Position and Activities

As of December 31, 2022, Black Stone Minerals had $4.3 million in cash and $10.0 million outstanding under its credit facility. The Company paid down $50 million of debt during the fourth quarter of 2022 and $79 million of debt during the full year. The ratio of total debt at year-end to 2022 Adjusted EBITDA was 0.02x. The Company’s borrowing base at December 31, 2022 was $550 million, and total commitments under the credit facility were $375 million. The Company's next regularly scheduled borrowing base redetermination is set for April 2023. Black Stone is in compliance with all financial covenants associated with its credit facility.

As of February 17, 2023, no debt was outstanding under the credit facility and the Company had $57.3 million in cash.

During the fourth quarter of 2022, the Company made no repurchases of units under the Board-approved $75 million unit repurchase program.

Fourth Quarter 2022 Distributions

As previously announced, the Board approved a cash distribution of $0.475 for each common unit attributable to the fourth quarter of 2022. The quarterly distribution coverage ratio attributable to the fourth quarter of 2022 was approximately 1.26x. These distributions will be paid on February 23, 2023 to unitholders of record as of the close of business on February 16, 2023.

Activity Update

Rig Activity

As of December 31, 2022, Black Stone had 108 rigs operating across its acreage position, a 17% increase to rig activity on the Company's acreage as of September 30, 2022 and 14% higher as compared to the 95 rigs operating on the Company's acreage as of December 31, 2021 driven by increased rig activity in the Midland and Delaware basins.

Shelby Trough Development Update

In Angelina County, Texas, ten wells are currently producing under Black Stone’s development agreement with Aethon, and another ten wells are being drilled or completed. Under a separate development agreement with Aethon in San Augustine Texas, four wells are currently producing and another six wells are either drilling or awaiting completion operations.

Austin Chalk Update

The Company owns a large mineral position in the Brookeland Austin Chalk play in East Texas. To date, eighteen new generation, multi-stage completion wells have turned to sales across the Polk, Jasper, Newton area. Production results have proven that new completion technology can improve well performance in play. Black Stone expects additional drilling by multiple operators over this area in the future.

Summary 2023 Guidance

Following are the key assumptions in Black Stone Minerals’ 2023 guidance, as well as comparable results for 2022:


FY 2022 Actual


FY 2023 Est.

Mineral and royalty production (MBoe/d)

34.3


35 - 37

Working interest production (MBoe/d)

2.8


2 - 3

Total production (MBoe/d)

37.1


37 - 39

Percentage natural gas

74%


72%

Percentage royalty interest

92%


94%


Lease bonus and other income ($MM)

$13.1


$10 - $12


Lease operating expense ($MM)

$12.4


$12 - $13

Production costs and ad valorem taxes (as % of total pre-derivative O&G revenue)

9%


9% - 11%


G&A - cash ($MM)

$36.3


$42 - $44

G&A - non-cash ($MM)

$17.4


$12 - $14

G&A - TOTAL ($MM)

$53.7


$54 - $58


DD&A ($/Boe)

$3.53


$3.50 - $3.75

Black Stone expects royalty production to increase by approximately 5% in 2023 relative to full year 2022 levels, primarily due to increasing development pace in the Shelby Trough by Aethon in the area and continued development in the Austin Chalk.

Working interest production is expected to decline in 2023 as a result of Black Stone's decision in 2017 to farm-out participation in its working interest opportunities.

The Partnership expects general and administrative expenses to be slightly higher in 2023 as a result of inflationary costs and selective hires made to support Black Stone’s ability to evaluate, market and manage its undeveloped acreage positions to potential operators.

Hedge Position

Black Stone has commodity derivative contracts in place covering portions of its anticipated production for 2023 and 2024, including derivative contracts put in place after the end of the year. The Company's hedge position as of February 17, 2023, is summarized in the following tables:

Oil Swap Contracts


Volume


MBbl

$/Bbl

4Q22

220,000

$66.47

1Q23

630,000

$79.44

2Q23

540,000

$80.80

3Q23

540,000

$80.80

4Q23

540,000

$80.80


Natural Gas Swap Contracts


Volume


MMcf

$/Mcf

1Q23

9,000,000

$5.07

2Q23

8,190,000

$5.15

3Q23

8,280,000

$5.15

4Q23

8,280,000

$5.15

1Q24

3,640,000

$3.67

2Q24

3,640,000

$3.67

3Q24

3,680,000

$3.67

4Q24

3,680,000

$3.67

More detailed information about the Company's existing hedging program can be found in the Annual Report on Form 10-K, which is expected to be filed on or around February 22, 2023.

Conference Call

Black Stone Minerals will host a conference call and webcast for investors and analysts to discuss its results for the fourth quarter and full year of 2022 on Wednesday, February 22, 2023 at 9:00 a.m. Central Time. Black Stone recommends participants who do not anticipate asking questions to listen to the call via the live broadcast available at http://investor.blackstoneminerals.com. Analysts and investors who wish to ask questions should dial (800) 343-5172 for domestic participants and (203) 518-9856 for international participants. The conference ID for the call is BSMQ422. A recording of the conference call will be available on Black Stone's website.

About Black Stone Minerals, L.P.

Black Stone Minerals is one of the largest owners of oil and natural gas mineral interests in the United States. The Company owns mineral interests and royalty interests in 41 states in the continental United States. Black Stone believes its large, diversified asset base and long-lived, non-cost-bearing mineral and royalty interests provide for stable to growing production and reserves over time, allowing the majority of generated cash flow to be distributed to unitholders.

Forward-Looking Statements

This news release includes forward-looking statements. All statements, other than statements of historical facts, included in this news release that address activities, events or developments that the Company expects, believes or anticipates will or may occur in the future are forward-looking statements. Terminology such as “will,” “may,” “should,” “expect,” “anticipate,” “plan,” “project,” “intend,” “estimate,” “believe,” “target,” “continue,” “potential,” the negative of such terms, or other comparable terminology often identify forward-looking statements. Except as required by law, Black Stone Minerals undertakes no obligation and does not intend to update these forward-looking statements to reflect events or circumstances occurring after this news release. You are cautioned not to place undue reliance on these forward-looking statements, which speak only as of the date of this news release. All forward-looking statements are qualified in their entirety by these cautionary statements. These forward-looking statements involve risks and uncertainties, many of which are beyond the control of Black Stone Minerals, which may cause the Company’s actual results to differ materially from those implied or expressed by the forward-looking statements. Important factors that could cause actual results to differ materially from those in the forward-looking statements include, but are not limited to, those summarized below, as wells as the Risk Factors section in our most recent annual report on Form 10-K:

  • the Company’s ability to execute its business strategies;
  • the conflict in Ukraine and actions taken, and that may in the future be taken, against Russia or otherwise as a result;
  • the availability of U.S. liquefied natural gas ("LNG") export capacity and the level of demand for LNG exports;
  • the volatility of realized oil and natural gas prices;
  • the level of production on the Company’s properties;
  • overall supply and demand for oil and natural gas, as well as regional supply and demand factors, delays, or interruptions of production;
  • conservation measures, technological advances, and general concern about the environmental impact of the production and use of fossil fuels;
  • the Company’s ability to replace its oil and natural gas reserves;
  • the Company’s ability to identify, complete, and integrate acquisitions;
  • general economic, business, or industry conditions;
  • cybersecurity incidents, including data security breaches or computer viruses;
  • competition in the oil and natural gas industry;
  • the unavailability, high cost, or shortages of rigs, equipment, raw materials, supplies, or personnel to develop and operate our properties; and
  • the level of drilling activity by the Company's operators, particularly in areas such as the Shelby Trough where the Company has concentrated acreage positions.

BLACK STONE MINERALS, L.P.

CONSOLIDATED STATEMENTS OF OPERATIONS

(Unaudited)

(In thousands, except per unit amounts)


Three Months Ended December 31,


Year Ended December 31,


2022


2021


2022


2021

REVENUE


Oil and condensate sales


$

85,920


$

75,743


$

336,287


$

235,771


Natural gas and natural gas liquids sales


110,254


83,134


434,945


255,671


Lease bonus and other income


2,790


2,097


13,052


14,292


Revenue from contracts with customers


198,964


160,974


784,284


505,734


Gain (loss) on commodity derivative instruments


31,415


18,449


(120,680

)


(146,474

)

TOTAL REVENUE


230,379


179,423


663,604


359,260


OPERATING (INCOME) EXPENSE


Lease operating expense


3,124


3,252


12,380


13,056


Production costs and ad valorem taxes


14,924


14,340


66,233


49,809


Exploration expense


1


2


193


1,082


Depreciation, depletion, and amortization


12,786


14,666


47,804


61,019


General and administrative


14,326


11,387


53,652


48,746


Accretion of asset retirement obligations


245


210


861


1,073


(Gain) loss on sale of assets, net


(17

)


(2,850

)

TOTAL OPERATING EXPENSE


45,406


43,857


181,106


171,935


INCOME (LOSS) FROM OPERATIONS


184,973


135,566


482,498


187,325


OTHER INCOME (EXPENSE)


Interest and investment income


31


1


53


1


Interest expense


(2,022

)


(1,441

)


(6,286

)


(5,638

)

Other income (expense)


237


68


215


299


TOTAL OTHER EXPENSE


(1,754

)


(1,372

)


(6,018

)


(5,338

)

NET INCOME (LOSS)


183,219


134,194


476,480


181,987


Distributions on Series B cumulative convertible preferred units


(5,250

)


(5,250

)


(21,000

)


(21,000

)

NET INCOME (LOSS) ATTRIBUTABLE TO THE GENERAL PARTNER AND COMMON UNITS


$

177,969


$

128,944


$

455,480


$

160,987


ALLOCATION OF NET INCOME (LOSS):


General partner interest


$


$


$


$


Common units


177,969


128,944


455,480


160,987


$

177,969


$

128,944


$

455,480


$

160,987


NET INCOME (LOSS) ATTRIBUTABLE TO LIMITED PARTNERS PER COMMON UNIT:


Per common unit (basic)


$

0.85


$

0.62


$

2.18


$

0.77


Per common unit (diluted)


$

0.82


$

0.60


$

2.12


$

0.77


WEIGHTED AVERAGE COMMON UNITS OUTSTANDING:


Weighted average common units outstanding (basic)


209,406


208,665


209,382


208,181


Weighted average common units outstanding (diluted)


224,756


224,069


224,446


208,290


The following table shows the Company’s production, revenues, realized prices, and expenses for the periods presented.


Three Months Ended December 31,


Year Ended December 31,


2022


2021


2022


2021


(Unaudited)

(Dollars in thousands, except for realized prices)

Production:


Oil and condensate (MBbls)


1,017


1,036


3,591


3,646


Natural gas (MMcf)1


17,130


15,392


59,778


61,445


Equivalents (MBoe)


3,872


3,601


13,554


13,887


Equivalents/day (MBoe)


42.1


39.1


37.1


38.0


Realized prices, without derivatives:


Oil and condensate ($/Bbl)


$

84.48


$

73.11


$

93.65


$

64.67


Natural gas ($/Mcf)1


6.44


5.40


7.28


4.16


Equivalents ($/Boe)


$

50.66


$

44.12


$

56.90


$

35.39


Revenue:


Oil and condensate sales


$

85,920


$

75,743


$

336,287


$

235,771


Natural gas and natural gas liquids sales1


110,254


83,134


434,945


255,671


Lease bonus and other income


2,790


2,097


13,052


14,292


Revenue from contracts with customers


198,964


160,974


784,284


505,734


Gain (loss) on commodity derivative instruments


31,415


18,449


(120,680

)


(146,474

)

Total revenue


$

230,379


$

179,423


$

663,604


$

359,260


Operating expenses:


Lease operating expense


$

3,124


$

3,252


$

12,380


$

13,056


Production costs and ad valorem taxes


14,924


14,340


66,233


49,809


Exploration expense


1


2


193


1,082


Depreciation, depletion, and amortization


12,786


14,666


47,804


61,019


General and administrative


14,326


11,387


53,652


48,746


Other expense:


Interest expense


2,022


1,441


6,286


5,638


Per Boe:


Lease operating expense (per working interest Boe)


$

16.02


$

8.96


$

12.13


$

7.00


Production costs and ad valorem taxes


3.85


3.98


4.89


3.59


Depreciation, depletion, and amortization


3.30


4.07


3.53


4.39


General and administrative


3.70


3.16


3.96


3.51


1 As a mineral-and-royalty-interest owner, Black Stone Minerals is often provided insufficient and inconsistent data on natural gas liquid ("NGL") volumes by its operators. As a result, the Company is unable to reliably determine the total volumes of NGLs associated with the production of natural gas on its acreage. Accordingly, no NGL volumes are included in our reported production; however, revenue attributable to NGLs is included in natural gas revenue and the calculation of realized prices for natural gas.

Non-GAAP Financial Measures

Adjusted EBITDA and Distributable cash flow are supplemental non-GAAP financial measures used by Black Stone's management and external users of the Company's financial statements such as investors, research analysts, and others, to assess the financial performance of its assets and its ability to sustain distributions over the long term without regard to financing methods, capital structure, or historical cost basis.

The Company defines Adjusted EBITDA as net income (loss) before interest expense, income taxes, and depreciation, depletion, and amortization adjusted for impairment of oil and natural gas properties, if any, accretion of asset retirement obligations, unrealized gains and losses on commodity derivative instruments, non-cash equity-based compensation, and gains and losses on sales of assets, if any. Black Stone defines Distributable cash flow as Adjusted EBITDA plus or minus amounts for certain non-cash operating activities, cash interest expense, and restructuring charges, if any.

Adjusted EBITDA and Distributable cash flow should not be considered an alternative to, or more meaningful than, net income (loss), income (loss) from operations, cash flows from operating activities, or any other measure of financial performance presented in accordance with generally accepted accounting principles ("GAAP") in the United States as measures of the Company's financial performance.

Adjusted EBITDA and Distributable cash flow have important limitations as analytical tools because they exclude some but not all items that affect net income (loss), the most directly comparable U.S. GAAP financial measure. The Company's computation of Adjusted EBITDA and Distributable cash flow may differ from computations of similarly titled measures of other companies.


Three Months Ended


Year Ended

December 31,

December 31,


2022


2021


2022


2021


(Unaudited)

(In thousands, except per unit amounts)

Net income (loss)


$

183,219


$

134,194


$

476,480


$

181,987


Adjustments to reconcile to Adjusted EBITDA:


Depreciation, depletion, and amortization


12,786


14,666


47,804


61,019


Interest expense


2,022


1,441


6,286


5,638


Income tax expense (benefit)


(171

)


(4

)


58


(135

)

Accretion of asset retirement obligations


245


210


861


1,073


Equity-based compensation


5,579


2,513


17,388


12,218


Unrealized (gain) loss on commodity derivative instruments


(72,014

)


(75,387

)


(82,486

)


33,528


(Gain) loss on sale of assets, net


(17

)


(2,850

)

Adjusted EBITDA


131,666


77,633


466,374


292,478


Adjustments to reconcile to Distributable cash flow:


Change in deferred revenue


(7

)


(2

)


(30

)


(18

)

Cash interest expense


(1,059

)


(1,094

)


(4,282

)


(4,059

)

Preferred unit distributions


(5,250

)


(5,250

)


(21,000

)


(21,000

)

Distributable cash flow


$

125,350


$

71,287


$

441,062


$

267,401


Total units outstanding1


209,684


209,118


Distributable cash flow per unit


0.598


0.341


Contacts

Black Stone Minerals, L.P. Contacts
Evan Kiefer
Vice President, Finance and Investor Relations
Telephone: (713) 445-3200
This email address is being protected from spambots. You need JavaScript enabled to view it.


Read full story here

  • Declared quarterly distribution of $0.4714 per unit; 34th consecutive quarterly distribution

HOUSTON--(BUSINESS WIRE)--Westlake Chemical Partners LP (NYSE: WLKP) (the "Partnership") today reported net income attributable to the Partnership in the fourth quarter of 2022 of $16.8 million, or $0.48 per limited partner unit, a decrease of $12.7 million compared to fourth quarter 2021 net income of $29.5 million. Net income in the fourth quarter of 2021 benefitted from a $32 million buyer deficiency fee resulting from an unplanned outage related to the Petro 2 turnaround at Westlake Chemical OpCo, LP ("OpCo"). The decrease in net income in the fourth quarter of 2022 when compared to the prior-year period was a result of a lower buyer deficiency fee of $10 million recorded in the period as well as higher interest expense, partially offset by higher production at OpCo. Cash flows from operating activities in the fourth quarter of 2022 were $122.6 million, an increase of $100.7 million compared to fourth quarter 2021 cash flows from operating activities of $21.9 million, due to higher production at OpCo as well as cash flows from operations in the fourth quarter of 2021 being impacted by expenditures related to OpCo's Petro 2 turnaround. For the three months ended December 31, 2022, MLP distributable cash flow was $20.3 million, an increase of $5.0 million compared to fourth quarter 2021 MLP distributable cash flow of $15.3 million. The increase in MLP distributable cash flow and associated trailing twelve-month coverage ratio was primarily attributable to higher production and lower maintenance capital spending.


Fourth quarter 2022 net income attributable to the Partnership of $16.8 million increased by $2.0 million compared to third quarter 2022 net income of $14.8 million, primarily due to higher production volume, partially offset by higher interest expense. Fourth quarter 2022 cash flows from operating activities of $122.6 million increased by $7.1 million compared to third quarter 2022 cash flows from operating activities of $115.5 million due to higher production. Fourth quarter 2022 MLP distributable cash flow of $20.3 million increased by $3.6 million compared to third quarter 2022 MLP distributable cash flow of $16.7 million, primarily due to lower maintenance capital expenditures.

For the full year 2022, net income attributable to the Partnership of $64.2 million, or $1.82 per limited partner unit, decreased by $18.3 million compared to full year of 2021 net income attributable to the Partnership of $82.5 million. The decrease in net income attributable to the Partnership was primarily due to lower third-party sales margins, higher interest expense, and a lower buyer deficiency fee than in the prior-year period. Cash flows from operating activities for the full year of 2022 were $463.7 million, an increase of $55.3 million compared to the full year of 2021 cash flows from operating activities of $408.4 million. This increase in cash flows from operating activities was primarily due to higher production at OpCo, significantly lower turnaround expenditures, and the receipt of a prior-year receivable from Westlake. For the year ended December 31, 2022, MLP distributable cash flow was $75.9 million, an increase of $5.8 million compared to MLP distributable cash flow of $70.1 million for the year ended December 31, 2021.

"2022 presented its share of challenges including decades-high inflation, tighter monetary policy, and the highest feedstock and energy costs for U.S. ethylene producers since 2011. While each year brings new challenges, the Partnership's financial performance in 2022, supported by our sales agreement with Westlake, once again demonstrated the resiliency and consistency of its earnings and cash flows. This consistent cash flow enabled us to declare our 34th consecutive quarterly distribution payment and improve our twelve-month coverage ratio to 1.14x in 2022," said Albert Chao, President and Chief Executive Officer. "2023 will likely bring new challenges, such as the current low third-party ethylene sales margins and relatively high interest rates; however, despite these headwinds, the insulative attributes of the agreement with Westlake give us confidence in another year of solid performance and cash flows."

On January 23, 2023, the Partnership announced that the Board of Directors of Westlake Chemical Partners GP LLC had approved a quarterly distribution for the fourth quarter of 2022 of $0.4714 per unit to be payable on February 16, 2023 to unitholders of record as of February 2, 2023, representing the 34th consecutive quarterly distribution to our unitholders. MLP distributable cash flow provided trailing twelve-month coverage of 1.14x the declared distributions for the fourth quarter of 2022, which was an increase from the trailing twelve-month coverage ratio of 1.07x at the end of the third quarter of 2022.

OpCo's Ethylene Sales Agreement with Westlake is designed to provide for stable and predictable cash flows. The agreement provides that 95% of OpCo's ethylene production is sold to Westlake for a cash margin of $0.10 per pound, net of operating costs, maintenance capital expenditures and reserves for future turnaround expenditures.

The statements in this release and the related teleconference relating to matters that are not historical facts, such as those with respect to the ability to deliver value, returns, predictable cash flows and distributions to unitholders, the expectation that strong distributions will continue, and the nature of the sales agreement with Westlake, are forward-looking statements. These forward-looking statements are subject to significant risks and uncertainties. Actual results could differ materially, based on factors including, but not limited to, the COVID-19 pandemic and the response thereto; operating difficulties; the volume of ethylene that we are able to sell; the price at which we are able to sell ethylene; changes in the price and availability of feedstocks; changes in prevailing economic conditions; actions and commitments of Westlake Corporation; actions of third parties; inclement or hazardous weather conditions, including flooding, and the physical impacts of climate change; environmental hazards; changes in laws and regulations (or the interpretation thereof); inability to acquire or maintain necessary permits; inability to obtain necessary production equipment or replacement parts; technical difficulties or failures; labor disputes; difficulty collecting receivables; inability of our customers to take delivery; fires, explosions or other industrial accidents; our ability to borrow funds and access capital markets; and other risk factors. For more detailed information about the factors that could cause actual results to differ materially, please refer to the Partnership's Annual Report on Form 10-K for the year ended December 31, 2021, which was filed with the SEC in March 2022, and Quarterly Report on Form 10-Q for the quarter ended September 30, 2022, which was filed with the SEC in November 2022.

This release is intended to be a qualified notice under Treasury Regulation Section 1.1446-4(b). Brokers and nominees should treat one hundred percent (100.0%) of the Partnership's distributions to non-U.S. investors as being attributable to income that is effectively connected with a United States trade or business. Accordingly, the Partnership's distributions to non-U.S. investors are subject to federal income tax withholding at the highest applicable effective tax rate.

Use of Non-GAAP Financial Measures

This release makes reference to certain "non-GAAP" financial measures, such as MLP distributable cash flow and EBITDA. For this purpose, a non-GAAP financial measure is generally defined by the Securities and Exchange Commission ("SEC") as a numerical measure of a registrant's historical or future financial performance, financial position or cash flows that (1) excludes amounts, or is subject to adjustments that have the effect of excluding amounts, that are included in the most directly comparable measure calculated and presented in accordance with U.S. generally accepted accounting principles ("U.S. GAAP") in the statement of income, balance sheet or statement of cash flows (or equivalent statements) of the registrant; or (2) includes amounts, or is subject to adjustments that have the effect of including amounts, that are excluded from the most directly comparable measure so calculated and presented. We report our financial results in accordance with U.S. GAAP, but believe that certain non-GAAP financial measures, such as MLP distributable cash flow and EBITDA, provide useful supplemental information to investors regarding the underlying business trends and performance of our ongoing operations and are useful for period-over-period comparisons of such operations. These non-GAAP financial measures should be considered as a supplement to, and not as a substitute for, or superior to, the financial measures prepared in accordance with U.S. GAAP. We define MLP distributable cash flow as distributable cash flow less distributable cash flow attributable to Westlake Corporation's noncontrolling interest in OpCo and distributions attributable to the incentive distribution rights holder. MLP distributable cash flow does not reflect changes in working capital balances. We define EBITDA as net income before interest expense, income taxes, depreciation and amortization. MLP distributable cash flow and EBITDA are non-GAAP supplemental financial measures that management and external users of our consolidated financial statements, such as industry analysts, investors, lenders and rating agencies, may use to assess our operating performance as compared to other publicly traded partnerships, our ability to incur and service debt and fund capital expenditures and the viability of acquisitions and other capital expenditure projects and the returns on investment of various investment opportunities. Reconciliations of MLP distributable cash flow to net income and to net cash provided by operating activities and of EBITDA to net income, income from operations and net cash provided by operating activities can be found in the financial schedules at the end of this press release.

Westlake Chemical Partners LP

Westlake Chemical Partners is a limited partnership formed by Westlake Corporation to operate, acquire and develop ethylene production facilities and other qualified assets. Headquartered in Houston, the Partnership owns a 22.8% interest in Westlake Chemical OpCo LP. Westlake Chemical OpCo LP's assets consist of three ethylene production facilities in Calvert City, Kentucky, and Lake Charles, Louisiana and an ethylene pipeline. For more information about Westlake Chemical Partners LP, please visit http://www.wlkpartners.com.

Westlake Chemical Partners LP Conference Call Information:

A conference call to discuss Westlake Chemical Partners' fourth quarter 2022 results will be held Tuesday, February 21, 2023 at 1:00 PM Eastern Time (12:00 PM Central Time). To access the conference call, please register at: https://register.vevent.com/register/BI9783ef61b8b547ef9b507fc63dc0f073. A dial-in will be provided upon registration.

The conference call will also be available via webcast at: https://edge.media-server.com/mmc/p/n8a3yw3a and the earnings release can be obtained via the Partnership web page at: https://investors.wlkpartners.com/corporate-profile/default.aspx.

WESTLAKE CHEMICAL PARTNERS LP ("WESTLAKE PARTNERS") 

CONSOLIDATED STATEMENTS OF OPERATIONS

(Unaudited)


Three Months Ended December 31,


Twelve Months Ended December 31,


2022


2021


2022


2021


(In thousands of dollars, except per unit data)

Revenue


Net sales—Westlake Corporation ("Westlake")


$

322,868


$

317,940


$

1,342,910


$

1,026,586


Net co-products, ethylene and other sales—third parties


43,971


12,516


250,237


188,272


Total net sales


366,839


330,456


1,593,147


1,214,858


Cost of sales


268,709


183,406


1,215,782


773,152


Gross profit


98,130


147,050


377,365


441,706


Selling, general and administrative expenses


2,854


6,284


29,678


31,018


Income from operations


95,276


140,766


347,687


410,688


Other income (expense)


Interest expense—Westlake


(4,704

)


(2,166

)


(13,407

)


(8,816

)

Other income, net


883


10


1,566


62


Income before income taxes


91,455


138,610


335,846


401,934


Provision for income taxes


195


216


1,017


549


Net income


91,260


138,394


334,829


401,385


Less: Net income attributable to noncontrolling interests in Westlake Chemical OpCo LP ("OpCo")


74,476


108,882


270,656


318,838


Net income attributable to Westlake Partners


$

16,784


$

29,512


$

64,173


$

82,547


Net income per limited partner unit attributable to Westlake Partners (basic and diluted)


Common units


$

0.48


$

0.84


$

1.82


$

2.34


Distributions declared per unit


$

0.4714


$

0.4714


$

1.8856


$

1.8856


MLP distributable cash flow


$

20,261


$

15,297


$

75,870


$

70,057


Distributions declared


Limited partner units—publicly and privately held


$

9,947


$

9,943


$

39,775


$

39,760


Limited partner units—Westlake


6,657


6,657


26,628


26,628


Total distributions declared


$

16,604


$

16,600


$

66,403


$

66,388


EBITDA


$

125,551


$

166,760


$

470,327


$

519,564


WESTLAKE CHEMICAL PARTNERS LP 

CONDENSED CONSOLIDATED BALANCE SHEETS

(Unaudited)


December 31,


2022


2021


(In thousands of dollars)

ASSETS


Current assets


Cash and cash equivalents


$

64,782


$

17,057


Receivable under the Investment Management Agreement—Westlake


64,996


106,243


Accounts receivable, net—Westlake


90,965


142,791


Accounts receivable, net—third parties


20,030


5,825


Inventories


4,715


8,898


Prepaid expenses and other current assets


305


396


Total current assets


245,793


281,210


Property, plant and equipment, net


990,213


1,043,539


Other assets, net


135,973


155,949


Total assets


$

1,371,979


$

1,480,698


LIABILITIES AND EQUITY


Current liabilities (accounts payable and accrued and other liabilities)


$

66,941


$

106,796


Long-term debt payable to Westlake


399,674


399,674


Other liabilities


1,656


1,530


Total liabilities


468,271


508,000


Common unitholders—publicly and privately held


480,643


481,796


Common unitholder—Westlake


53,859


54,754


General partner—Westlake


(242,572

)


(242,572

)

Total Westlake Partners partners' capital


291,930


293,978


Noncontrolling interest in OpCo


611,778


678,720


Total equity


903,708


972,698


Total liabilities and equity


$

1,371,979


$

1,480,698


WESTLAKE CHEMICAL PARTNERS LP 

CONDENSED CONSOLIDATED STATEMENTS OF CASH FLOWS

(Unaudited)


Twelve Months Ended December 31,


2022


2021


(In thousands of dollars)

Cash flows from operating activities


Net income


$

334,829


$

401,385


Adjustments to reconcile net income to net cash provided by operating activities:


Depreciation and amortization


121,074


108,814


Net loss on disposition and other


5,063


3,922


Other balance sheet changes


2,770


(105,682

)

Net cash provided by operating activities


463,736


408,439


Cash flows from investing activities


Additions to property, plant and equipment


(54,118

)


(81,171

)

Investments with Westlake under the Investment Management Agreement


(319,884

)


(276,000

)

Maturities of investments with Westlake under the Investment Management Agreement


362,000


293,000


Other


(130

)

Net cash used for investing activities


(12,002

)


(64,301

)

Cash flows from financing activities


Proceeds from debt payable to Westlake


32,000


Repayment of debt payable to Westlake


(32,000

)


Quarterly distributions to noncontrolling interest retained in OpCo by Westlake


(337,598

)


(277,856

)

Quarterly distributions to unitholders


(66,411

)


(66,379

)

Net cash used for financing activities


(404,009

)


(344,235

)

Net increase (decrease) in cash and cash equivalents


47,725


(97

)

Cash and cash equivalents at beginning of the year


17,057


17,154


Cash and cash equivalents at end of the year


$

64,782


$

17,057


WESTLAKE CHEMICAL PARTNERS LP 

RECONCILIATION OF MLP DISTRIBUTABLE CASH FLOW TO NET INCOME

AND NET CASH PROVIDED BY OPERATING ACTIVITIES

(Unaudited)


Three Months
Ended
September 30,


Three Months Ended December 31,


Twelve Months Ended December 31,


2022


2022


2021


2022


2021


(In thousands of dollars)

Net cash provided by operating activities


$

115,495


$

122,574


$

21,862


$

463,736


$

408,439


Changes in operating assets and liabilities and other


(37,190

)


(31,314

)


116,532


(128,907

)


(7,054

)

Net income


78,305


91,260


138,394


334,829


401,385


Add:


Depreciation, amortization and disposition of property, plant and equipment


30,349


29,711


28,442


125,781


113,032


Less:


Contribution to turnaround reserves


(7,323

)


(7,364

)


(44,500

)


(29,175

)


(80,090

)

Maintenance capital expenditures


(14,348

)


(7,077

)


(46,350

)


(45,249

)


(87,783

)

Distributable cash flow attributable to noncontrolling interest in OpCo


(70,249

)


(86,269

)


(60,689

)


(310,316

)


(276,487

)

MLP distributable cash flow


$

16,734


$

20,261


$

15,297


$

75,870


$

70,057


WESTLAKE CHEMICAL PARTNERS LP 

RECONCILIATION OF EBITDA TO NET INCOME AND NET CASH

PROVIDED BY OPERATING ACTIVITIES

(Unaudited)


Three Months
Ended
September 30,


Three Months Ended December 31,


Twelve Months Ended December 31,


2022


2022


2021


2022


2021


(In thousands of dollars)

Net cash provided by operating activities


$

115,495


$

122,574


$

21,862


$

463,736


$

408,439


Changes in operating assets and liabilities and other


(37,190

)


(31,314

)


116,532


(128,907

)


(7,054

)

Net income


78,305


91,260


138,394


334,829


401,385


Less:


Other income, net


618


883


10


1,566


62


Interest expense—Westlake


(3,645

)


(4,704

)


(2,166

)


(13,407

)


(8,816

)

Provision for income taxes


(484

)


(195

)


(216

)


(1,017

)


(549

)

Income from operations


81,816


95,276


140,766


347,687


410,688


Add:


Depreciation and amortization


29,391


29,392


25,984


121,074


108,814


Other income, net


618


883


10


1,566


62


EBITDA


$

111,825


$

125,551


$

166,760


$

470,327


$

519,564


Contacts

Contact—(713) 585-2900
Investors—Steve Bender
Media—L. Benjamin Ederington

Public communications following Patent Office ruling show SunSpec inducing members to infringe on Tigo Energy intellectual property.

CAMPBELL, Calif.--(BUSINESS WIRE)--Tigo Energy, Inc., (“Tigo” or the “Company”), a leading provider of intelligent solar and energy storage solutions, today announced that it has filed a lawsuit against SunSpec Alliance. The complaint was filed in the United States District Court for the Northern District of California. In the wake of a ruling in which the U.S. Patent and Trademark Office (USPTO) overwhelmingly upheld Tigo claims relevant to the SunSpec Alliance Rapid Shutdown Specification, SunSpec and its representatives continued their long-standing campaign to encourage its members to infringe on Tigo intellectual property (“IP”),​ by importing or selling infringing rapid shutdown devices in the U.S.


Starting with a formal notification sent to SunSpec Alliance in October 2017, Tigo has repeatedly informed SunSpec Alliance that Tigo patents are necessary for the SunSpec Rapid Shutdown Specification. Tigo asked SunSpec to notify its members that they should acquire a license from Tigo to manufacture, use, import, sell, or offer to sell rapid shutdown devices that practice the SunSpec Rapid Shutdown Specification, and that Tigo would offer a license on reasonable and non-discriminatory terms. SunSpec refused and instead filed two IPR (inter pares review) petitions with the USPTO in July 2021. SunSpec’s IPRs identified five member companies that stood to benefit from that legal intervention. In January 2023, the USPTO rejected one of SunSpec’s IPRs in its entirety and ruled in favor of Tigo on three of five claims in SunSpec’s other IPR. Social media posts and email list communications made by SunSpec after it received this ruling from the USPTO show that SunSpec has not only failed to notify its members that they should acquire a license from Tigo but is actively encouraging infringement of Tigo IP.

“The patents in our IP portfolio are core assets to Tigo, the USPTO has affirmed our claims, and we do not understand what would motivate anyone to encourage the violation of the same,” said Zvi Alon, chairman and CEO at Tigo Energy, Inc. “The goal of Tigo is to offer high-quality rapid shutdown solutions to our installer base by investing in the research and development necessary to innovate. I reiterate that Tigo will offer reasonable and non-discriminatory licensing terms to SunSpec Alliance members.”

Rapid shutdown is a safety function for photovoltaic systems on buildings, designed to reduce the risk of electrical shock to emergency responders, and is mandated by building codes and regulatory bodies in the U.S. and in a rapidly growing number of countries around the world. Tigo is a leader in rapid shutdown technology and MLPE, with more than one hundred patents granted. Tigo has prevailed in a previous patent infringement litigation and presently has a pending lawsuit that includes six patent infringement claims against SMA Solar Technology America LLC. Tigo has also licensed its patented technology to other solar equipment manufacturers. Millions of Tigo products are installed around the world, where they provide optimized, monitored, and safe solar to protect critical solar energy infrastructure and deliver consistent ROI for the lifetime of renewable energy systems.

For more information about the portfolio of Tigo Flex MLPE solutions, please visit https://www.tigoenergy.com/ts4, and keep up with the latest information by signing up for the Tigo newsletter here: https://www.tigoenergy.com/newsletter.

About Tigo Energy

Founded in 2007, Tigo is a worldwide leader in the development and manufacture of smart hardware and software solutions that enhance safety, increase energy yield, and lower operating costs of residential, commercial, and utility-scale solar systems. Tigo combines its Flex MLPE (Module Level Power Electronics) and solar optimizer technology with intelligent, cloud-based software capabilities for advanced energy monitoring and control. Tigo MLPE products maximize performance, enable real-time energy monitoring, and provide code-required rapid shutdown at the module level. The company also develops and manufactures products such as inverters and battery storage systems for the residential solar-plus-storage market. For more information, please visit www.tigoenergy.com.


Contacts

Mike Gazzano
North America Marketing Manager at Tigo Energy
(408) 806-9626 Ext. 9783
This email address is being protected from spambots. You need JavaScript enabled to view it.

CANONSBURG, Pa.--(BUSINESS WIRE)--Equitrans Midstream Corporation (NYSE: ETRN), today, announced financial and operational results for the full-year and fourth quarter 2022. Included in the "Non-GAAP Disclosures" section of this news release are important disclosures regarding the use of non-GAAP supplemental financial measures, including information regarding their most comparable GAAP financial measure.


2022 Highlights:

  • Generated $846 million of net cash from operating activities and $380 million of free cash flow
  • Recorded 71% of total operating revenue from firm reservation fees
  • Initiated a mixed-use water system build out and commenced operations of first above ground water storage facility
  • Secured a new booster compression expansion project
  • Published our annual Corporate Sustainability Report in accordance with GRI and SASB
  • Completed senior notes offering with proceeds used to repay nearest-term maturities

We continue to pursue multiple paths in order to complete the MVP project. Although federal energy infrastructure permitting reform legislation was not enacted in 2022, we believe there continues to be significant bipartisan support for permitting reform in the new congress," said Thomas F. Karam, Equitrans chairman and chief executive officer. "On the regular way permitting path, we are engaged with the necessary federal agencies and appreciate the tremendous efforts of the staff who have put immense time into their reviews and analyses, especially considering some permits are being reviewed for a second and third time. We believe that the agencies are working to issue authorizations over the next several months, which we believe would position us to safely complete construction of MVP in 2023. However, we must acknowledge that the ultimate hurdle remains legal challenges of the permits before the U.S. Fourth Circuit Court of Appeals. As we've said before, we believe that projects, like MVP, that follow every required process and receive every required permit should prevail."

"In 2022, we remained committed to operating safely and delivering strong results for our stakeholders as we continue to find ways to drive capital efficiency, optimize systems, and control costs," said Diana M. Charletta, Equitrans president and chief operating officer. "During the year we made progress on several in-basin organic projects, including receiving the Final Environmental Impact Statement for our OVCX project and securing an approximately $70 million booster compression project from a producer customer, both of which are targeted for a 2024 in-service. In addition, we made many advancements in our sustainability program during the year, including the voluntary submission of our first CDP Water Security questionnaire, for which we received a score of 'B.' We also completed our TCFD readiness assessment; instituted a new Environmental Justice Policy; and converted high-bleed pneumatics to low-bleed or full-air pneumatics at ten compressor sites in support of our Climate Policy and emission reduction targets. As a follow-on to these efforts, in January 2023, we announced Equitrans’ status as a founding member of the Appalachian Methane Initiative, which is committed to further enhancing methane monitoring throughout the Appalachian Basin and facilitating additional methane emissions reduction in the region."

2022 YEAR-END AND FOURTH QUARTER SUMMARY RESULTS


Three Months
Ended December 31,


Twelve Months
Ended December 31,

$ millions (except per share metrics)

2022


2022

Net income (loss) attributable to ETRN common shareholders

$

66.0


$

(327.9

)

Adjusted net income attributable to ETRN common shareholders

$

57.6


$

200.2


Earnings (loss) per diluted share attributable to ETRN common shareholders

$

0.15


$

(0.76

)

Adjusted earnings per diluted share attributable to ETRN common shareholders

$

0.13


$

0.46


Net income (loss)

$

82.2


$

(257.1

)

Adjusted EBITDA

$

271.3


$

1,071.4


Deferred revenue

$

84.2


$

345.1


Net cash provided by operating activities

$

99.2


$

845.8


Free cash flow

$

136.0


$

379.9


Retained free cash flow

$

71.1


$

120.2


Net income attributable to ETRN common shareholders for the fourth quarter 2022 was impacted by several items, including a $5.1 million unrealized gain on derivative instruments and $8.1 million of operating expense related to the November 2022 Rager Mountain natural gas storage field incident (discussed below). The unrealized gain is reported within other income (expense), net, and relates to the contractual agreement with EQT Corporation (EQT) in which ETRN will receive cash from EQT conditioned on the quarterly average of certain Henry Hub natural gas prices exceeding certain thresholds beginning with the quarter in which the Mountain Valley Pipeline (MVP) is placed in-service through the fourth quarter of 2024. The contract is accounted for as a derivative with the fair value marked-to-market at each quarter-end.

For the full-year 2022, net loss attributable to ETRN common shareholders was impacted by several items, including a $583.1 million impairment of equity method investment related to Mountain Valley Pipeline, LLC (MVP JV) and an associated $69.9 million reduction in income tax benefit primarily due to a valuation allowance placed on the deferred tax assets; a $24.9 million loss on extinguishment of debt primarily related to the purchase in tender offers of approximately $1.0 billion in aggregate principal amount of several tranches of senior notes of EQM Midstream Partners, LP (EQM), a wholly owned subsidiary of ETRN; a $9.6 million unrealized gain on derivative instruments related to the previously described contractual agreement with EQT; a $3.7 million gain on sale of non-core gathering assets; and $8.1 million of operating expense related to the Rager Mountain natural gas storage field incident.

As a result of the gathering agreement entered into with EQT in February 2020, revenue from the contracted minimum volume commitment (MVC) is recognized utilizing an average gathering rate applied over the remaining contract life. The difference between the cash received from the MVC and the revenue recognized results in the deferral of revenue into future periods. Deferred revenue for the fourth quarter 2022 was $84.2 million and for the full-year 2022 was $345.1 million.

Operating revenue for the fourth quarter increased by $108.6 million compared to the same quarter last year, primarily due to approximately $106.1 million of deferred revenue in the fourth quarter of 2021 related to the cumulative impact of a transmission services contract amendment, increased transmission services revenue, higher water services revenue, and partially offset by lower gathered volumes. Operating expenses increased by $18.0 million compared to the fourth quarter 2021, primarily from $8.1 million of expenses, including a regulatory reserve, related to the Rager Mountain natural gas storage field incident and increased operating and maintenance, selling, general and administrative, and depreciation expenses.

Operating revenue for the full year increased by $40.7 million compared to 2021, primarily from the impact of deferred revenue, increased water services revenue, and partially offset by lower gathered volumes. Operating expenses decreased by $61.5 million compared to 2021, primarily driven by a $56.2 million impairment of long-lived assets in 2021 and lower selling, general, and administrative expenses.

QUARTERLY DIVIDEND

For the fourth quarter 2022, ETRN paid a quarterly cash dividend of $0.15 per common share on February 14, 2023, to ETRN common shareholders of record at the close of business on February 6, 2023.

TOTAL CAPITAL EXPENDITURES AND CAPITAL CONTRIBUTIONS


Three Months
Ended December 31,


Twelve Months
Ended December 31,

$ millions

2022


2022

MVP

$41


$199

Gathering(1)

$67


$246

Transmission(2)

$13


$37

Water(3)

$17


$67

Total

$138


$549

(1)

Excludes $2.7 million and $20.3 million of capital expenditures related to the noncontrolling interest in Eureka Midstream Holdings, LLC (Eureka) for the three and twelve months ended December 31, 2022, respectively.

(2)

Includes capital contributions to MVP JV for the MVP Southgate project.

(3)

Full-year 2022 includes approximately $10 million to replace certain previously installed water lines that ETRN believes do not meet their prescribed quality standards. ETRN has instituted actions in pursuit of recoupment of such replacement and related costs.

2023 GUIDANCE

Due to the uncertainty around the ultimate MVP path to completion and timing of forward construction and in-service, ETRN has provided full-year 2023 guidance assuming an MVP in-service during the second half of 2023 and provided full-year 2023 guidance assuming the absence of forward MVP construction and completion in 2023. The MVP project in-service timing impacts revenue recognition under certain related gathering and transportation agreements with EQT, including deferred revenue and the Henry Hub cash bonus payment provision. Therefore, ETRN is unable to provide full-year 2023 guidance for net income, adjusted EBITDA, and deferred revenue for the potential outcome in which there is no forward construction and completion of MVP in 2023 since the basis for any potential delay beyond 2023 is not known or reasonably able to be estimated.

Full-Year 2023 Financial Outlook(1)

$ millions

With MVP(2)


Without MVP(3)

Net income

$325 - $405


-

Adjusted EBITDA

$1,060 - $1,140


-

Deferred Revenue

$285


-

Free cash flow

$(220) - $(140)


$270 - $350

Retained free cash flow

$(480) - $(400)


$10 - $90

(1)

Full-year 2023 includes an estimate of $8 - $10 million of operating expenses related to the Rager Mountain natural gas storage field incident based on current information. The full-year 2023 guidance does not include estimates of all potential costs and expenses from the incident as some items are not able to be estimated at this time. ETRN is continuing to gather and evaluate information about the incident, including related financial impacts, and will provide further updates as necessary.

(2)

Assumes a second half of 2023 MVP in-service. Does not include any of the potential $60 million Henry Hub bonus in 2023, which is dependent on MVP in-service and natural gas prices exceeding certain thresholds. The deferred revenue amounts are subject to the ultimate in-service date of MVP.

(3)

Assumes no MVP forward construction and completion in 2023.

Q1 2023 Financial Outlook(1)(2)

$ millions


Net income

$60 - $80

Adjusted EBITDA

$270 - $290

Deferred Revenue

$80

(1)

Q1 2023 includes an estimate of $5 million of operating expenses related to the Rager Mountain natural gas storage field incident based on current information. The Q1 2023 guidance does not include estimates of all potential costs and expenses from the incident as some items are not able to be estimated at this time. ETRN is continuing to gather and evaluate information about the incident, including related financial impacts, and will provide further updates as necessary.

(2)

Assumes a second half of 2023 MVP in-service. The deferred revenue amounts are subject to the ultimate in-service date of MVP.

Full-Year 2023 Capital Expenditures and Capital Contribution Outlook

$ millions


With MVP(1)


Without MVP(2)

MVP


$610 - $660


$150 - $200

Gathering(3)


$235 - $285


$235 - $285

Transmission(4)


$90 - $100


$90 - $100

Water


$35 - $45


$35 - $45

Total


$970 - $1,090


$510 - $630

(1)

Assumes a second half of 2023 MVP in-service.

(2)

Assumes no MVP forward construction and completion in 2023.

(3)

Excludes approximately $15 million of capital expenditures related to the noncontrolling interest in Eureka.

(4)

Full-year 2023 includes an estimate of $5 million of capital expenditures related to the Rager Mountain natural gas storage field incident based on current information. The full-year 2023 guidance does not include estimates of all potential capital expenditures from the incident as some items are not able to be estimated at this time. ETRN is continuing to gather and evaluate information about the incident, including related financial impacts, and will provide further updates as necessary.

BUSINESS AND PROJECT UPDATES

Outstanding Debt and Liquidity

As of December 31, 2022, ETRN reported $6.4 billion of consolidated debt; $240 million of borrowings and $234.9 million of letters of credit outstanding under EQM's revolving credit facility; $295.0 million of borrowings under Eureka's revolving credit facility; and $67.9 million of cash.

Rager Mountain Natural Gas Storage Field Incident

On November 6, 2022, ETRN responded to an incident regarding the venting of natural gas from a storage well at its Rager Mountain natural gas storage field, located in a remote area of Cambria County, Pennsylvania. ETRN engaged a leading specialty well control services company and, in coordination with the Pennsylvania Department of Environmental Protection (PADEP) and Federal Pipeline and Hazardous Materials Safety Administration (PHMSA), successfully halted the venting of gas on November 19, 2022. ETRN has retained a leading firm involved in analyzing storage field incidents to conduct an independent investigation of the incident’s root cause, which is ongoing. Based on the results of testing to estimate the total change in natural gas inventory at the Rager Mountain storage reservoir, ETRN estimates that the Rager Mountain storage inventory was reduced by approximately 1.29 Bcf. However, as part of ongoing post-incident response activities, ETRN continues to evaluate whether and to what extent the inventory was reduced because of venting or whether some was due to potential migration.

Further, ETRN initiated a comprehensive review of all of its storage wells, including wells at the Rager Mountain facility, and this review of storage field asset integrity is ongoing. The PADEP and the PHMSA are investigating the incident and ETRN continues to cooperate in such investigations. In the fourth quarter, ETRN incurred expenses of $8.1 million, which includes a regulatory reserve for potential penalties, and continues to incur costs in 2023 in relation to post-incident response activities. For further information, refer to ETRN’s Annual Report on Form 10-K for the year ended December 31, 2022, to be filed with the SEC.

Exercise of Cash Option

Pursuant to the 2020 gathering agreement with EQT, on July 8, 2022, EQT elected to forgo aggregate potential gathering rate relief of up to approximately $235 million in the 24 months following MVP's in-service in exchange for a cash payment of approximately $196 million. The cash payment represented final consideration for approximately 20.5 million ETRN common shares that were purchased from EQT and retired in the first quarter of 2020. ETRN made the $196 million cash payment to EQT on October 4, 2022.

Ohio Valley Connector Expansion Project

On January 20, 2023, the Federal Energy Regulatory Commission (FERC) issued the Final Environmental Impact Statement for the Ohio Valley Connector Expansion Project (OVCX). OVCX will increase deliverability on ETRN's Ohio Valley Connector pipeline by approximately 350 MMcf per day and is designed to meet growing demand in key markets in the mid-continent and Gulf Coast through existing interconnects with long-haul pipelines in Clarington, OH. ETRN expects to receive all necessary approvals in the first half of 2023 and accordingly ETRN is targeting the incremental capacity to be in-service during the first half of 2024. ETRN expects to invest approximately $160 million in the project, which is primarily supported by a long-term firm capacity commitment of 330 MMcf per day.

Mountain Valley Pipeline

MVP JV remains engaged in the permitting process with the relevant federal agencies regarding the outstanding permits required to complete the project. ETRN believes that the agencies are working to issue such authorizations over the next several months and to produce authorizations, for the third time in certain cases, that address points raised by the U.S. Fourth Circuit Court of Appeals and exceed legal and regulatory standards. Based on the expected permitting timeline, ETRN believes the remaining construction activity could be completed to achieve a second half of 2023 in-service at a total project cost of approximately $6.6 billion, however, there remains significant uncertainty around current and potential litigation at the Fourth Circuit. In addition to pursuing the regular way permitting path, ETRN continues to support potential enactment of federal energy infrastructure permitting reform legislation that specifically requires the completion of the MVP project. ETRN believes that there remains bipartisan support and prospects for such legislation. ETRN believes that the MVP JV will complete the four to five months of remaining construction activity as promptly as practicable once authorized and fully mobilized and that the total project cost would be approximately $6.6 billion if MVP's completion is achieved in 2023. Through December 31, 2022, ETRN has funded approximately $2.7 billion and, if the MVP project were to be completed in 2023 at a total project cost of $6.6 billion, ETRN expects to fund a total of approximately $3.4 billion and to have an approximate 48.1% ownership interest in MVP. ETRN will operate the pipeline.

MVP Southgate

The MVP JV continues to evaluate the MVP Southgate project and is focused on its ongoing discussions and negotiations with the shipper and other prospective customers regarding refining the project's design, scope and/or timing in lieu of pursuing the project as originally contemplated. ETRN has a 47.2% ownership interest in MVP Southgate and is expected to operate the pipeline.

Water Services

During 2022, ETRN began the buildout of its mixed-use water system and, in August 2022, ETRN placed into service its initial above ground water storage facility, which has a capacity of approximately 150,000 barrels. ETRN expects to place the second above ground water storage facility, which will have a capacity of approximately 200,000 barrels, into service in the first half of 2023. The mixed-use water system is expected to be substantially completed in 2023.

In the fourth quarter, water operating income was $11.1 million and water EBITDA was $16.6 million. For the full year 2022, water operating income was $14.6 million and water EBITDA was $34.6 million. For 2023, ETRN expects water EBITDA of approximately $40 - $45 million.

2022 Year-End Earnings Conference Call Information

ETRN will host a conference call with security analysts today, February 21, 2023, at 10:30 a.m. (ET) to discuss year-end 2022 financial results, operating results, and other business matters.

Call Access: An audio live stream of the call will be available on the internet, and participants are encouraged to pre-register online, in advance of the call. A link to the audio live stream will be available on the Investors page of ETRN’s website the day of the call.

Security Analysts :: Dial-In Participation
To participate in the Q&A session, security analysts may access the call in the U.S. toll free at (888) 330-3573; and internationally at (646) 960-0677. The ETRN conference ID is 6625542.

All Other Participants :: Webcast Registration
Please Note: For optimal audio quality, the webcast is best supported through Google Chrome and Mozilla Firefox browsers.

Call Replay: For 14 days following the call, an audio replay will be available at (800) 770-2030 or (647) 362-9199. The ETRN conference ID: 6625542.

ETRN management speaks to investors from time-to-time and the presentation for these discussions, which is updated periodically, is available via www.equitransmidstream.com.

NON-GAAP DISCLOSURES

Adjusted Net Income (Loss) Attributable to ETRN Common Shareholders and Adjusted Earnings (Loss) per Diluted Share Attributable to ETRN Common Shareholders

Adjusted net income (loss) attributable to ETRN common shareholders and adjusted earnings (loss) per diluted share attributable to ETRN common shareholders are non-GAAP supplemental financial measures that management and external users of ETRN’s consolidated financial statements, such as investors, may use to make period-to-period comparisons of earnings trends. Management believes that adjusted net income (loss) attributable to ETRN common shareholders and adjusted earnings (loss) per diluted share attributable to ETRN common shareholders as presented provide useful information for investors for evaluating period-over-period earnings. Adjusted net income (loss) attributable to ETRN common shareholders and adjusted earnings (loss) per diluted share attributable to ETRN common shareholders should not be considered as alternatives to net income (loss) attributable to ETRN common shareholders, earnings (loss) per diluted share attributable to ETRN common shareholders or any other measure of financial performance presented in accordance with GAAP. Adjusted net income (loss) attributable to ETRN common shareholders and adjusted earnings (loss) per diluted share attributable to ETRN common shareholders as presented have important limitations as analytical tools because they exclude some, but not all, items that affect net income (loss) attributable to ETRN common shareholders and earnings (loss) per diluted share attributable to ETRN common shareholders, including, as applicable, impairments of long-lived assets and equity method investments, unrealized gain (loss) on derivative instruments, loss on extinguishment of debt, gain on the sale of gathering assets, expenses for the Rager Mountain natural gas storage field incident (Rager Mountain incident), and the related tax impacts of these items, which items affect the comparability of results period to period. Additionally, because these non-GAAP metrics may be defined differently by other companies in ETRN’s industry, ETRN’s definitions of adjusted net income (loss) attributable to ETRN common shareholders and adjusted earnings (loss) per diluted share attributable to ETRN common shareholders may not be comparable to similarly titled measures of other companies, thereby diminishing the utility of the measures. Adjusted net income (loss) attributable to ETRN common shareholders and adjusted earnings (loss) per diluted share attributable to ETRN common shareholders should not be viewed as indicative of the actual amount of net income (loss) attributable to ETRN common shareholders or actual earnings (loss) of ETRN in any given period.

The table below reconciles adjusted net income attributable to ETRN common shareholders and adjusted earnings per diluted share attributable to ETRN common shareholders with net income (loss) attributable to ETRN common shareholders and earnings (loss) per diluted share attributable to ETRN common shareholders as derived from the statements of consolidated comprehensive income to be included in ETRN’s Annual Report on Form 10-K for the year ended December 31, 2022. Diluted weighted average common shares outstanding assumes dilution for each applicable period.

Reconciliation of Adjusted Net Income Attributable to ETRN Common Shareholders and Adjusted Earnings per Diluted Share Attributable to ETRN Common Shareholders


Three Months
Ended December 31,


Twelve Months
Ended December 31,

(Thousands, except per share information)

2022


2022

Net income (loss) attributable to ETRN common shareholders

$

65,986


$

(327,854

)

Add back (deduct):


Impairment of equity method investment


583,057


Unrealized gain on derivative instruments


(5,102

)


(9,593

)

Loss on extinguishment of debt


24,937


Gain on sale of gathering assets


(3,719

)

Rager Mountain incident


8,055


8,055


Tax impact of non-GAAP items(1)


(11,323

)


(74,717

)

Adjusted net income attributable to ETRN common shareholders

$

57,616


$

200,166


Diluted weighted average common shares outstanding, assuming dilution


434,347


434,111


Adjusted earnings per diluted share attributable to ETRN common shareholders

$

0.13


$

0.46


Contacts

Analyst inquiries:
Nate Tetlow – Vice President, Corporate Development and Investor Relations
412-553-5834
This email address is being protected from spambots. You need JavaScript enabled to view it.

Media inquiries:
Natalie Cox – Communications and Corporate Affairs
This email address is being protected from spambots. You need JavaScript enabled to view it.


Read full story here

HOUSTON--(BUSINESS WIRE)--Ranger Energy Services, Inc. (NYSE:RNGR) (the “Company”) will report fourth quarter and full year 2022 financial and operating results before the market opens for trading on March 7, 2023. Following the announcement, the Company’s management will host a fourth quarter 2022 earnings conference call in the morning of March 7, 2023 at 10:00 a.m. Eastern time (9:00 a.m. Central time).


Interested parties are invited to participate on the call by dialing 1-833-255-2829, or 1-412-902-6710 for international calls, (request to join the Ranger Energy Services call) or via the Company’s website at www.rangerenergy.com. A replay of the conference call will be available following the call and can be accessed from www.rangerenergy.com.

About Ranger Energy Services, Inc.

Ranger is one of the largest providers of high specification mobile rig well services, cased hole wireline services, and ancillary services in the U.S. oil and gas industry. Our services facilitate operations throughout the lifecycle of a well, including the completion, production, maintenance, intervention, workover and abandonment phases.


Contacts

Ranger Energy Services, Inc.
Melissa Cougle, (713) 935-8900
Chief Financial Officer
This email address is being protected from spambots. You need JavaScript enabled to view it.

AUSTIN, Texas--(BUSINESS WIRE)--USA Compression Partners, LP (NYSE: USAC) (“USA Compression”) today announced that its 2022 tax packages, including the Schedule K-1, are now available online and may be accessed at taxpackagesupport.com/usac. USA Compression has begun the process of mailing the 2022 tax packages to unitholders. Unitholders may also call Tax Package Support at 1-855-521-8151 or visit USA Compression’s website at usacompression.com in the Investor Relations section under K-1 Information.


About USA Compression Partners, LP

USA Compression Partners, LP is a growth-oriented Delaware limited partnership that is one of the nation’s largest independent providers of natural gas compression services in terms of total compression fleet horsepower. USA Compression partners with a broad customer base composed of producers, processors, gatherers, and transporters of natural gas and crude oil. USA Compression focuses on providing natural gas compression services to infrastructure applications primarily in high-volume gathering systems, processing facilities, and transportation applications. More information is available at usacompression.com.


Contacts

USA Compression Partners, LP
Nelson Larkin, Tax Director
(512) 369-1604
This email address is being protected from spambots. You need JavaScript enabled to view it.

ORLANDO, Fla.--(BUSINESS WIRE)--ecoSPEARS announced today that it has secured an investment from Florida-based impact investors venVelo and Stirling Operations to scale its sustainable remediation technologies to eliminate “forever chemicals” from the environment. The investment was made by venVelo, a Florida-based early-stage venture fund, and Stirling Operations, a group of independent sponsors.


ecoSPEARS designs and develops green and sustainable remediation technologies to extract and destroy PFAS, PCBs, dioxins 1,4-dioxane, and other chemical contaminants from soil, sediment, and water without transporting hazardous waste to landfills and incinerators which exposes local communities to toxic waste.

This investment will accelerate ecoSPEARS’ initiative to scale their green remediation technologies to serve more communities impacted by environmental contamination across the globe. In addition, ecoSPEARS will continue to expand its technologies to address additional legacy and emerging contaminants, such as PFAS, PFOA, and other contaminants known as “forever chemicals”.

“We’re excited to work with investors like venVelo and sponsors like Stirling Operations. Their foresight and willingness to share our mission will help to make a generational impact, especially for underserved communities that are impacted the most,” said Sergie Albino, Co-Founder and CEO of ecoSPEARS. “We’ve all witnessed, first-hand, the devastation to both the community and the environment when hazardous substances aren’t handled properly. The risks are just too great. We have to stop this. And with ecoSPEARS, we can.”

“I have been part of the Central Florida entrepreneurial ecosystem for the last 25 years. In that time, we have seen the number and depth of entrepreneurial talent increase significantly. We are fortunate to locally have the financial resources and talent to build some extremely valuable companies,” said Richard Licursi, managing partner at venVelo.

Gerry Angeli notes, “Our research of ecoSPEARS shows they have the technology, experience, and entrepreneurial energy to produce environmentally important results for the nation, and the world, by removing pollutants. Their solutions are effective and scalable. This is exactly the kind of venture we look to support with investment and our own operational experience.”

About ecoSPEARS: ecoSPEARS is a cleantech company on a mission to usher in the net-zero future of environmental remediation by developing green, sustainable technologies to remediate soil and waterways that have been contaminated with per- and polyfluoroalkyl substances (PFAS), polychlorinated biphenyls (PCBs), dioxins, and other persistent toxins that threaten human health and the environment. ecoSPEARS offers sustainable, cost-effective technologies that extract and eliminate persistent toxins from contaminated sediment, soil, and water, giving polluted land and waterways a second chance at life. (www.ecospears.com)

About venVelo: venVelo is an active early-stage venture fund in Florida for innovative companies seeking capital and mentoring. Launched in 2012, venVelo identifies growth companies and increases their successes through the venVelo approach – mentoring, coaching, engaging with the community, leveraging connections, and acting quickly. (www.venvelo.com)

About Stirling Operations: Stirling Operations is a firm of independent sponsors who take an active role in managing the companies they acquire, and use technology transfer as a core lever to achieve enterprise growth. Stirling Operations focuses on people, community, shareholders, and other stakeholders to grow overall profitability and sustainability of the business. (www.stirlingangeli.com)


Contacts

Email: This email address is being protected from spambots. You need JavaScript enabled to view it.
Phone: (407) 792-3400

TULSA, Okla.--(BUSINESS WIRE)--Williams (NYSE: WMB) today announced it has joined the United Nations Environment Programme’s (UNEP) Oil and Gas Methane Partnership 2.0 (OGMP 2.0), the global initiative designed to improve the energy industry’s methane emissions reporting and to encourage progress in reducing those emissions. Joining OGMP 2.0 supports Williams’ next generation natural gas strategy to drive transparency and decarbonization of the natural gas value chain through technology investments, providing path-specific methane intensity certifications to utilities, LNG export facilities and other clean energy users.


OGMP 2.0 is UNEP’s flagship oil and gas reporting and mitigation program. It is the only comprehensive, measurement-based international reporting framework for the sector. In the past two years, nearly 100 companies with operations in more than 60 countries have joined the initiative. They represent more than 35 per cent of global oil and gas production. OGMP 2.0 member companies strive to report methane emissions in accordance with what are widely recognized as the highest established standards while setting industry-leading methane reduction targets.

“Williams is committed to achieving the most stringent methane performance standards as prescribed by OGMP 2.0, thus setting the pace for the midstream sector in the United States,” said Alan Armstrong, Williams President and CEO. “We handle one third of U.S. natural gas, giving us unique visibility to how gas molecules are produced, processed, transported and used. By leveraging new technology across our nationwide infrastructure footprint, we are confident we can enhance the trust and transparency needed to grow a differentiated low-emissions gas market and provide clean, reliable gas supplies to domestic and international buyers focused on a low-carbon future.”

“We are glad to welcome Williams as part of our global initiative, which incentivizes member companies to reduce methane emissions and allocate capital efficiently,” said Giulia Ferrini, OGMP 2.0 Project Manager, UNEP. “We look forward to Williams’ contribution as OGMP 2.0 is more than a rigorous reporting framework: it is a unique platform for collective action and peer learning among our members, who jointly develop new industry norms on methane management.”

Williams’ NextGen Gas program provides verified emissions profiles and captures the progress from greenhouse gas (GHG) reductions across the natural gas value chain – from customers and its own operations – using monitoring and measurement technologies including satellites, flyovers and multiple sensing devices, as well as real-time internal operational data that is designed to meet the OGMP 2.0 protocols. As part of this program, Williams recently invested in Orbital Sidekick, a satellite-based emissions monitoring company and LongPath Technologies, a provider of laser-based continuous emissions monitoring and quantification technology. Data from these technologies will be aggregated with other forms of measurement data and synthesized by Context Labs’ Decarbonization as a Service (DasS) platform to provide verified emissions profiles and capture the progress from reductions across the natural gas value chain for Williams and its customers.

Today’s announced membership in OGMP 2.0 complements other methane performance initiatives in which Williams is engaged, including ONE Future, a group of natural gas companies working to voluntarily reduce methane emissions to less than 1% across the natural gas value chain. Williams also belongs to the Energy Emissions Modelling and Data Lab (EEMDL), a collaborative initiative involving the University of Texas at Austin, Colorado State University and the Colorado School of Mines to provide science-based greenhouse gas emissions assessments of global oil and gas supply chains.

In 2022, Williams was once again recognized across several key rankings – including CDP Climate Change Questionnaire, S&P Global ESG Score, Dow Jones Sustainability Index (DJSI) and MSCI – for the company’s commitment to transparency and governance around climate change and other ESG topics. Williams was named for the third consecutive year to the DJSI North America index and for the second consecutive year to the DJSI World index.

About Williams

As the world demands reliable, low-cost, low-carbon energy, Williams (NYSE: WMB) will be there with the best transport, storage and delivery solutions to reliably fuel the clean energy economy. Headquartered in Tulsa, Oklahoma, Williams is an industry-leading, investment grade C-Corp with operations across the natural gas value chain including gathering, processing, interstate transportation, storage, wholesale marketing and trading of natural gas and natural gas liquids. With major positions in top U.S. supply basins, Williams connects the best supplies with the growing demand for clean energy. Williams owns and operates more than 32,000 miles of pipelines system wide – including Transco, the nation’s largest volume and fastest growing pipeline – and handles approximately one third of the natural gas in the United States that is used every day for clean-power generation, heating and industrial use. Learn how the company is leveraging its nationwide footprint to incorporate clean hydrogen, NextGen Gas and other innovations at www.williams.com.

About OGMP 2.0

The Oil and Gas Methane Partnership 2.0 (OGMP 2.0) is a multi-stakeholder initiative, fostering better emissions data for methane mitigation in the oil and gas sector. OGMP, initially launched in 2014 by the Climate and Clean Air Coalition, was ratcheted up in scope and ambition in November 2020 to become OGMP 2.0. Itis the only comprehensive, measurement-based reporting framework for the oil and gas industry that improves the accuracy and transparency of methane emissions reporting. Already over 90 companies with assets on five continents representing over 35% of the world’s oil and gas production, as well as over 20% of global natural gas transmission and distribution pipelines, over 10% of global storage capacity and over 70% of global LNG flows have joined the partnership. For more, visit www.ogmpartnership.com.

Portions of this document may constitute “forward-looking statements” as defined by federal law. Although the company believes any such statements are based on reasonable assumptions, there is no assurance that actual outcomes will not be materially different. Any such statements are made in reliance on the “safe harbor” protections provided under the Private Securities Reform Act of 1995. Additional information about issues that could lead to material changes in performance is contained in the company’s annual and quarterly reports filed with the Securities and Exchange Commission.


Contacts

MEDIA:
This email address is being protected from spambots. You need JavaScript enabled to view it.
(800) 945-8723

INVESTOR CONTACTS:
Danilo Juvane
(918) 573-5075

Grace Scott
(918) 573-1092

For communications-related issues on OGMP 2.0 and UNEP:
Kamilia Lahrichi, Communications Lead, International Methane Emissions Observatory (IMEO):
This email address is being protected from spambots. You need JavaScript enabled to view it.

FORT WORTH, Texas--(BUSINESS WIRE)--Bell Textron Inc., a Textron Inc. (NYSE: TXT) company, announced today the Bell 505 completed its first flight fueled solely by 100% Sustainable Aviation Fuel (SAF), marking the first-ever single engine helicopter to fly with 100% SAF. Bell collaborated with Safran Helicopter Engines, Neste, GKN Aerospace and Virent Inc. to make this Bell 505 flight possible.


“This flight is a monumental achievement for sustainability and decarbonization in the rotorcraft industry,” said Michael Thacker, executive vice president, Commercial Business, Bell. “Showcasing a single engine aircraft’s flight capabilities with 100% SAF signals Bell’s commitment to alternative fuel usage and builds on its sustainability practices in its flight operations.”

Valentin Safir, executive vice-president, Programs, Safran Helicopter Engines said: “SAF is one of the key pillars in our strategy to decarbonize the helicopter industry. Our engines are certified to operate on up to 50% SAF and our objective is to certify in the coming years the use of 100% SAF, which can potentially result in carbon lifecycle emissions reductions by up to 80%.”

To achieve this flight, Bell collaborated with Safran Helicopter Engines, manufacturer of the Arrius 2R engine on the Bell 505; GKN Aerospace, the fuel system component supplier; Neste, the SAF supplier; and Virent, Inc., a Marathon Petroleum Corp. subsidiary that manufactures renewable fuels and chemicals. Safran Helicopter Engines and GKN Aerospace conducted thorough testing on the engine and fuel system components.

Neste and Virent collaborated to blend, test, and deliver the SAF for this project as a 100% drop-in fuel. SAF, made from used cooking oil or other bio-based feedstocks, typically must be blended with petroleum products because it doesn’t include a component called “aromatics,” which is required to meet today’s aviation fuel specifications. Virent manufactures an aromatics component made from renewable plant sugars, which was added to Neste’s neat SAF, eliminating the need to blend SAF with petroleum fuel. The SAF supplied for this test flight by Neste and Virent is therefore a “100% drop-in” replacement for petroleum-based aviation fuel, requiring no engine modifications.

Bell’s own training fleet and demonstration aircraft currently use SAF in their operations. The team continues to guide customer conversations around its implementation and monitors SAF testing in a dedicated Bell 505 with Safran Helicopter Engines. This flight supports Textron’s Achieve 2025 Sustainable Footprint goal for 20% reduction in greenhouse gas emissions across the enterprise, among other sustainability initiatives.

The Bell 505 is a five-seat aircraft designed for safety and efficiency while using the most advanced technology to date. The platform uses a fully integrated Garmin G1000H NXi avionics suite and Safran Arrius 2R engine with a dual-channel FADEC.

Follow Us:
Facebook
Twitter
LinkedIn
Instagram
YouTube

ABOUT BELL

Thinking above and beyond is what we do. For more than 85 years, we’ve been reimagining the experience of flight – and where it can take us. We are pioneers. We were the first to break the sound barrier and to certify a commercial helicopter. We were a part of NASA’s first lunar mission and brought advanced tiltrotor systems to market. Today, we’re defining the future of advanced air mobility. Headquartered in Fort Worth, Texas – as a wholly-owned subsidiary of Textron Inc., – we have strategic locations around the globe. And with nearly one quarter of our workforce having served, helping our military achieve their missions is a passion of ours. Above all, our breakthrough innovations deliver exceptional experiences to our customers. Efficiently. Reliably. And always, with safety at the forefront.

ABOUT TEXTRON INC.

Textron Inc. is a multi-industry company that leverages its global network of aircraft, defense, industrial and finance businesses to provide customers with innovative solutions and services. Textron is known around the world for its powerful brands such as Bell, Cessna, Beechcraft, Hawker, Jacobsen, Kautex, Lycoming, E-Z-GO, Arctic Cat, Textron Systems, and TRU Simulation + Training. For more information, visit: www.textron.com.

Certain statements in this press release are forward-looking statements which may project revenues or describe strategies, goals, outlook or other non-historical matters; these statements speak only as of the date on which they are made, and we undertake no obligation to update or revise any forward-looking statements. These statements are subject to known and unknown risks, uncertainties, and other factors that may cause our actual results to differ materially from those expressed or implied by such forward-looking statements.


Contacts

Press:
Alexis Baird
+1 817‐487-1020
This email address is being protected from spambots. You need JavaScript enabled to view it.
Bell Newsroom

PITTSBURGH--(BUSINESS WIRE)--Wabtec Corporation (NYSE: WAB) released today its 2022 Sustainability Report highlighting the company’s progress on key environmental, social, and governance (ESG) commitments. The company is focused on creating a sustainable future through innovative technologies, responsible operations, and empowering people and communities.


“At Wabtec, we remain committed to be part of the solution and to slow the speed of global climate change by taking action within our own operations and bringing products to market that drive sustainable value for our customers,” said Rafael Santana, President and CEO of Wabtec.

The company is committed to expanding its ESG goals to ensure they serve employees, customers, communities, and shareholders in more sustainable ways. Wabtec strives to develop new, more sustainable products and services across its portfolio to reduce the impact on the environment. Demonstrating Wabtec’s focus on continuous improvement, the sustainability report detailed key commitments related to its climate action plan such as:

  • Setting a new near-term absolute greenhouse gas (GHG) reduction goal to reduce its Scope 1 and 2 GHG emissions by 50% by 2030, from a baseline of 2019
  • Committing to disclose Wabtec’s Scope 3 GHG emissions across its full value chain this year
  • Committing to set near-term targets next year for categories of Scope 3 GHG emissions material to Wabtec

Wabtec took several actions to advance its ESG strategy and goals, including:

  • Joining the United Nations (UN) Global Compact, demonstrating the company’s existing and ongoing commitment to the universal sustainability principles promoted by the organization
  • Partnering with industry to accelerate the development, validation, and adoption of lower carbon fuels and alternative clean energy technologies for the freight rail industry
  • Joining Europe’s Rail Joint Undertaking (ERJU) as a founding member; A follow-up to the Shift2Rail initiative, ERJU is a partnership between Europe’s major railway stakeholders that aims to create a more modern and sustainable European railway system
  • Reducing the greenhouse gas emissions intensity by 20% across the company’s global operations

“Our greatest strength at Wabtec has always been our ability to continuously transform our company to deliver game-changing, sustainable innovations and solutions to our customers and the world,” said Santana. “While the journey to a fully decarbonized transportation future will take time, I am confident in the strength of Wabtec’s innovation, global scale, and, most importantly, our people. I know that we will lead our industry forward, not by waiting for the future, but creating it.”

To download and read the full report, visit www.wabteccorp.com/sustainability

About Wabtec Corporation

Wabtec Corporation is focused on creating transportation solutions that move and improve the world. The company is a leading global provider of equipment, systems, digital solutions and value-added services for the freight and transit rail industries, as well as the mining, marine and industrial markets. Wabtec has been a leader in the rail industry for over 150 years and has a vision to achieve a zero-emission rail system in the U.S. and worldwide.


Contacts

Wabtec Media Contact
Tim Bader / This email address is being protected from spambots. You need JavaScript enabled to view it. / 682-319-7925

Wabtec Investor Contact
Kristine Kubacki, CFA / This email address is being protected from spambots. You need JavaScript enabled to view it. / 412-450-2033

DUBLIN--(BUSINESS WIRE)--The "Biomass Electricity Global Market Report 2023" report has been added to ResearchAndMarkets.com's offering.


The global biomass electricity market will grow from $41.44 billion in 2022 to $45.17 billion in 2023 at a compound annual growth rate (CAGR) of 9.0%. The biomass electricity market is expected to grow to $61.32 billion in 2027 at a CAGR of 7.9%.

Western Europe was the largest region in the biomass electricity market in 2022. Asia Pacific was the second-largest region in the biomass market. The regions covered in the biomass electricity market report are Asia-Pacific, Western Europe, Eastern Europe, North America, South America, Middle East, and Africa.

The increasing government support through various government subsidies and policies is driving the growth of the biomass electricity market. Due to the growing concerns about climate change and the rising levels of greenhouse gases in the atmosphere resulting from the burning of fossil fuels such as coal and oil, new government policies are being framed to encourage sustainable power generation.

For instance, in India, the Ministry of new and renewable energy under its National Biogas and Manure Management Programme (NBMMP) provides subsidies for setting up family-type biogas plants mainly for rural and semi-urban households. The program is implemented by the State Nodal Departments/State Nodal Agencies and Khadi and Village Industries Commission (KVIC), Biogas Development and Training Centers (BDTCs) and involves subsidies of up to Rs. 17,000 ($230) for setting up biogas plants.

The growing competition from alternative energy sources such as solar, wind, and geothermal is expected to limit the biomass electricity market. Unlike wind power plants, biogas plants are affected by cold climates. The digesters in a biogas plant require heat energy to maintain a constant biogas supply. The optimal temperature for bacteria to digest the waste product is around 37C. At temperatures below 37C, the digesters require additional heat energy to maintain a constant biogas supply.

Solar and wind energy plants use raw resources which are available in abundance, whereas biogas production is only possible in rural areas where raw materials such as agricultural waste, manure, green waste, or food waste are in constant supply. Thus, the popularity and ease of maintaining alternative energy sources such as solar, wind, and geothermal restraints the growth of the biomass electricity market.

Companies in the biomass electricity market are developing new methods to produce electric power through new hybrid biogas plants by combining biogas with other forms of renewable energy sources such as solar energy. The combination of solar energy with biogas reduces the operating cost and effort required to deal with the waste products from the farms. Following suit, in 2020, Green Genius, a renewable energy company, launched a new biogas power plant in Belarus. In addition to producing green electricity, new biogas power plants will also eliminate the smell from pig farms and transform organic waste into liquid odorless fertilizer. Lithuania, Poland, Ukraine, Belarus, Spain, and Italy are the six European markets where Green Genius is creating sustainable energy (solar and biogas) projects.

In 2021, ReGenerate Energy Holdings, LLC, a US-based company focusing on environmental sustainability in renewable energy, acquired Albany Green Energy. Through the acquisition, ReGenerate Energy Holdings, LLC would continue building and expanding a bioenergy business. Albany Green Energy is a US-based biomass heat-and-power facility that uses woody biomass from mill residue, forestry waste, recycling, and agricultural waste sources to provide 50 megawatts of electricity to Georgia Power.

Reasons to Purchase

  • Gain a truly global perspective with the most comprehensive report available on this market covering 50+ geographies.
  • Understand how the market has been affected by the coronavirus and how it is responding as the impact of the virus abates.
  • Assess the Russia - Ukraine war's impact on agriculture, energy and mineral commodity supply and its direct and indirect impact on the market.
  • Measure the impact of high global inflation on market growth.
  • Create regional and country strategies on the basis of local data and analysis.
  • Identify growth segments for investment.
  • Outperform competitors using forecast data and the drivers and trends shaping the market.
  • Understand customers based on the latest market shares.
  • Benchmark performance against key competitors.
  • Suitable for supporting your internal and external presentations with reliable high quality data and analysis

Scope

Markets Covered:

1) By Feedstock: Solid Biomass; Biogas; Municipal Solid Waste; Liquid Biomass

2) By End-User: Households; Industrial Sector; Government Sector; Others

3) By Technology: Anaerobic Digestion; Combustion; Co-Firing; Gasification; Landfill Gas

A selection of companies mentioned in this report includes

  • Enviva
  • Pinnacle Renewable Energy Group
  • Pacific BioEnergy Corporation
  • Acciona Sa
  • Dong Energy A/S
  • Acciona Sa
  • Ameresco Inc.
  • E.On Se
  • Graanul Invest Group
  • RWE Innogy
  • Lignetics
  • Orsted A/S
  • Oulun Energia Oy
  • NTPC
  • Skive Fiernvarme
  • Babcock & Wilcox Enterprises Inc. 

For more information about this report visit https://www.researchandmarkets.com/r/tgjv1u

About ResearchAndMarkets.com

ResearchAndMarkets.com is the world's leading source for international market research reports and market data. We provide you with the latest data on international and regional markets, key industries, the top companies, new products and the latest trends.


Contacts

ResearchAndMarkets.com
Laura Wood, Senior Press Manager
This email address is being protected from spambots. You need JavaScript enabled to view it.
For E.S.T Office Hours Call 1-917-300-0470
For U.S./ CAN Toll Free Call 1-800-526-8630
For GMT Office Hours Call +353-1-416-8900

Delivered full-year 2022 net income of $72.5 million and Adjusted EBITDA1 of $762.1 million, a 27% increase year-over-year, driven by expanded operations in the Williston and Delaware Basins from the Oasis Midstream, Sendero Midstream, and CPJV acquisitions offset by the Barnett and Marcellus divestitures; efficient integration of acquired assets led to cost savings and commercial synergies offset by extreme weather events and producer development delays in fourth quarter 2022

Divestiture of Tres Palacios for $335 million; Crestwood’s 50% interest yields $167.5 million of cash proceeds which will be used for debt paydown and to accelerate leverage reduction; non-core asset sale at a significant premium to current market multiples largely completes Crestwood’s midstream portfolio realignment with a focus on core G&P areas

Expect 2023 Adjusted EBITDA of $780 million to $860 million and growth capital investment of $135 million to $155 million, driving positive free cash flow after distributions of approximately $50 million at the midpoint

2023 capital projects to include gathering system expansions and new supply connections from recent acquisitions; free cash flow allocation priorities focus on debt paydown and enhancing balance sheet strength in 2023

HOUSTON--(BUSINESS WIRE)--Crestwood Equity Partners LP (NYSE: CEQP) (“Crestwood”) reported today its financial and operating results for the three months ended December 31, 2022.


Fourth Quarter and Full-Year 2022 Financial Highlights1

  • Fourth quarter 2022 net income of $53.9 million, compared to net income of $78.6 million in fourth quarter 2021; full-year 2022 net income of $72.5 million, compared to a net loss of $37.4 million in 2021
  • Fourth quarter 2022 Adjusted EBITDA of $200.3 million, compared to $149.1 million in the fourth quarter 2021, an increase of 34% year-over-year; full-year Adjusted EBITDA of $762.1 million, compared to $600.1 million in 2021, an increase of 27%
  • Fourth quarter 2022 distributable cash flow (“DCF”) to common unitholders of $110.8 million, compared to $91.1 million in the fourth quarter 2021, an increase of 22% year-over-year, resulting in a coverage ratio of 1.6x
  • Ended the quarter with approximately $3.4 billion of total debt, including $1.1 billion drawn on the revolving credit facilities, resulting in a consolidated leverage ratio of 4.2x (4.0x pro forma for the sale of Tres Palacios)
  • Announced fourth quarter 2022 cash distribution of $0.655 per common unit, or $2.62 per common unit on an annualized basis, an approximate 5% increase year-over-year, payable on February 14, 2023, to unitholders of record as of February 7, 2023

Recent Developments

  • On January 17, 2023, Crestwood Midstream Partners LP (“CMLP”), a wholly owned subsidiary of Crestwood, issued $600 million of 7.375% senior unsecured notes due 2031. Crestwood used the proceeds of the issuance to repay borrowings on the corporate revolving credit facility and to repay and terminate the Crestwood Permian Basin Holdings LLC (“CPJV”) revolving credit facility. Pro forma for the senior notes issuance, Crestwood has approximately $525 million drawn on its $1.75 billion corporate revolving credit facility.
  • On February 20, 2023, Crestwood and Brookfield Infrastructure (“Brookfield”) entered into an agreement to sell Tres Palacios Gas Storage (“Tres Palacios”) for $335 million. Crestwood will receive approximately $168 million for its 50% interest in the storage facility and plans to use all sale proceeds to reduce borrowings on its revolving credit facility. The transaction is expected to close in the second quarter 2023 subject to customary regulatory approvals.

Management Commentary

“2022 was another transformational year for Crestwood as we continued to realign our midstream portfolio by expanding in the Williston, Delaware, and Powder River Basins, which are highly economic, oil-weighted resource plays, while divesting our Barnett and Marcellus assets which were non-core, gas-weighted, and low-growth. We have continued that strategy with the recent sale of our Tres Palacios natural gas storage facility to reduce debt and improve our balance sheet,” commented Robert G. Phillips, Founder, Chairman, and Chief Executive Officer of Crestwood.

Mr. Phillips added, "While we are disappointed in last year’s operating and financial results due to the impact of severe weather events, upstream consolidation, and oilfield services and labor constraints on producer drilling and development activity, we are excited about current 2023 rig activity and planned customer developments on our G&P assets. Moreover, this year we will be focused on realizing additional merger synergies and further commercialization of our systems, as we continue to integrate and expand the Oasis Midstream and Sendero Midstream assets with a measured capital program to capture the significant supply potential based on years of drilling inventory, which was a key component of the acquisitions last year.”

Mr. Phillips continued, “In 2023, our Adjusted EBITDA guidance range of $780 million to $860 million is pro forma for the sale of Tres Palacios and represents 8% year-over-year growth at the midpoint. Our 2023 growth capital program is estimated to be $135 million to $155 million, a reduction of more than 20% from last year, with approximately 90% focused on our Williston and Delaware Basin operations. Based on current producer plans, we expect to connect approximately 260 wells in 2023, an increase of approximately 15% year-over-year. Overall, our financial strategy in 2023 remains focused on operational execution, investments in high returning system expansions, increasing volumes, growing free cash flow, and reducing our outstanding debt.”

Mr. Phillips concluded, “The divestiture of Tres Palacios represents Crestwood’s fourth non-core divestiture over the last two years and largely completes our strategic realignment around oil-weighted resource plays. I would like to thank the Tres Palacios employees for their hard work and dedication over the past thirteen years who have done an exceptional job managing this strategic storage asset through various commodity and weather cycles. These divestitures, at highly compelling valuations, have enabled the company to maintain a solid balance sheet while transitioning the portfolio and helping to finance growth in the Williston, Delaware, and Powder River Basins. As a result, Crestwood is a stronger and more resilient company than it was a few years ago, with an impressive producer customer portfolio and a significant inventory of highly economic acreage dedications under long-term contracts, which we think will drive a top-tier yield investment opportunity for our unitholders.”

Fourth Quarter 2022 Results and 2023 Outlook

Gathering and Processing North

Gathering and Processing North segment EBITDA totaled $140.8 million in the fourth quarter 2022, compared to $116.5 million in the fourth quarter 2021, an increase of 21% year-over-year. Segment EBITDA increased year-over-year as a result of the contribution from the Oasis Midstream LP (“Oasis Midstream”) assets acquired in the Williston Basin and the impact of higher commodity prices on the Arrow system’s percent-of-proceeds (POP) contracts.

Williston Basin

During the fourth quarter 2022, crude oil gathering volumes averaged 76 MBbls/d, natural gas gathering volumes averaged 243 MMcf/d, natural gas processing volumes averaged 275 MMcf/d, and produced water gathering volumes averaged 152 MBbls/d. Natural gas gathering, natural gas processing, and produced water gathering volumes increased year-over-year by 72%, 108%, and 67%, respectively, due to expanded operations as a result of the Oasis Midstream acquisition. Producers connected 21 wells across Crestwood’s footprint during the fourth quarter, resulting in a full-year total of 86 wells, and have subsequently connected 23 wells in January 2023. Crestwood invested $26 million in the fourth quarter, approximately 90% of which was related to the continued build-out of the western portion of the Rough Rider system to service Chord Energy Inc. (NASDAQ: CHRD) (“Chord”) dedicated acreage.

In 2023, Crestwood expects to connect 115 to 125 wells across the Arrow and Rough Rider systems based on current producer drilling and completion schedules. Crestwood’s capital investments in the Williston Basin, approximately 50% of the company’s 2023 capital program, will include the continued buildout of a three-product gathering system for Chord’s Painted Woods and City of Williston acreage as well as smaller system expansions and compression projects to support new volumes across the Arrow and Rough Rider assets. Crestwood anticipates an average of four to five rigs operating on its dedicated acreage during 2023, driving approximately 5% to 10% volumetric growth year-over-year.

Powder River Basin

During the fourth quarter 2022, gathering volumes averaged 106 MMcf/d and natural gas processing volumes averaged 104 MMcf/d. Natural gas gathering and processing volumes increased year-over-year by 3% and 4%, respectively, driven by 12 new wells connected to the Jackalope system during 2022. In 2023, Crestwood expects producers to connect between 10 to 20 wells as Continental Resources, its largest customer in the basin, continues to delineate its acreage position targeting multiple formations. Crestwood’s capital investments in the Powder River Basin are expected to be minimal and include well connects and minor system expansions. Crestwood anticipates an average of one to two rigs operating on its dedicated acreage during 2023.

Gathering & Processing South

Gathering and Processing South segment EBITDA totaled $45.1 million in the fourth quarter 2022, compared to $29.5 million in the fourth quarter 2021, an increase of 53% year-over-year. Both periods exclude losses on long-lived assets. Segment EBITDA increased year-over-year driven primarily by the contribution of the Sendero Midstream Partners LP (“Sendero Midstream”) and the CPJV assets acquired in July 2022 and continued producer development in the Delaware Basin, offset by the divestitures of the Barnett and Marcellus assets in 2022.

Delaware Basin

During the fourth quarter 2022, natural gas gathering volumes averaged 504 MMcf/d, natural gas processing volumes averaged 408 MMcf/d, produced water gathering volumes averaged 153 MBbls/d, and crude oil gathering volumes averaged 21 MBbls/d. Natural gas gathering and natural gas processing volumes increased year-over-year by 101% and 265%, respectively, due to the contribution of the Sendero Midstream assets and significant volume growth on the Willow Lake system in New Mexico. Produced water gathering volumes increased year-over-year by more than eight times due to the integration of Oasis Midstream’s Panther assets as well as volume growth on the Desert Hills system. Producers connected 35 wells across Crestwood’s footprint during the fourth quarter, resulting in a full-year total of 128 wells. Crestwood invested $36 million in the fourth quarter, the majority of which was related to the expansion of the Panther crude oil and produced water gathering and disposal system as well as compression expansions on the Sendero system.

In 2023, Crestwood expects to connect 120 to 130 wells across its gathering systems in the Delaware Basin based on current producer drilling and completion schedules. Crestwood’s capital investments in the Delaware Basin, approximately 40% of the company’s 2023 capital program, will include compression expansions in New Mexico and well connects across Crestwood’s gathering assets. Crestwood anticipates an average of seven to eight rigs operating on its dedicated acreage during 2023, driving 10% to 15% volume growth year-over-year.

Storage & Logistics

Storage & Logistics segment EBITDA totaled $25.9 million in the fourth quarter 2022, compared to $13.9 million in the fourth quarter 2021. Both periods exclude the non-cash change in fair value of commodity inventory-related derivative contracts. Fourth quarter segment EBITDA was impacted by realized losses on commodity price hedges entered into to partially mitigate commodity price exposure from Crestwood’s gathering and processing segments’ contracts that have POP structures. In 2023, Crestwood expects S&L segment earnings to return to normalized levels with adjusted EBITDA of $100 million to $110 million, as the NGL Logistics business should benefit from incremental margin opportunities due to contango in the forward NGL pricing curves.

2023 Financial Guidance

Crestwood's 2023 guidance reflects the general business updates noted above and the most recent development plans from customers. In addition, the guidance range assumes the divestiture of Tres Palacios closes in April 2023. These projections are subject to risks and uncertainties in the "Forward-Looking Statements" section at the end of this release.

  • Net income of $310 million to $390 million
  • Adjusted EBITDA of $780 million to $860 million
  • Contribution by operating segment is set forth below:

$US millions


Adj. EBITDA Range

Operating Segment


Low


High

Gathering & Processing North


$570

-

$620

Gathering & Processing South


170

-

190

Storage & Logistics


100

-

110

Less: Corporate G&A


(60)


(60)

FY 2023 Totals


$780

-

$860

  • Distributable cash flow available to common unitholders of $430 million to $510 million
  • Free cash flow after distributions of $10 million to $90 million
  • Full-year coverage ratio of 1.6x to 1.8x based on annual distribution of $2.62 per common unit
  • Year-end 2023 leverage ratio between 3.7x and 4.1x
  • Growth capital spending in the range of $135 million to $155 million
  • Maintenance capital spending in the range of $25 million to $30 million

Strategic Update and Capital Allocation Priorities

In 2023, Crestwood has shifted its focus from regional consolidation to maximizing throughput on available capacity across its expanded gathering and processing systems while reducing costs and capital requirements. Crestwood expects positive free cash flow after distributions of approximately $50 million at the guidance midpoint in 2023, which will be allocated to debt paydown, with a long-term leverage ratio target of less than 3.5x. Crestwood plans to keep the distribution flat at $2.62 per common unit in 2023 and will consider additional distribution increases and common or preferred unit buybacks dependent on leverage reduction targets.

Capitalization and Liquidity Update

Crestwood invested approximately $66 million in the fourth quarter 2022 and $188 million during full-year 2022 in growth capital projects (excluding litigation related capital pertaining to the Bear Den II processing plant), approximately $10 million below the low end of the 2022 growth capital guidance range. As of December 31, 2022, Crestwood had approximately $3.4 billion of debt outstanding, comprised of $2.25 billion of fixed-rate senior notes and $1.1 billion outstanding under its two revolving credit facilities, resulting in a consolidated leverage ratio of 4.2x.

On January 17, 2023, Crestwood issued $600 million of 7.375% senior unsecured notes and used the proceeds to repay borrowings on its corporate revolving credit facility and to repay and terminate the CPJV credit facility. Pro forma for the issuance of new senior notes and the expected closing of Tres Palacios in second quarter 2023, Crestwood will have $3.2 billion of long-term debt outstanding, including $2.85 billion of fixed-rate senior notes and approximately $360 million outstanding under its $1.75 billion revolving credit facility, and a consolidated leverage ratio of 4.0x.

Crestwood currently has 71.3 million preferred units outstanding (par value of $9.13 per unit) that pay a fixed-rate annual cash distribution of 9.25%, payable quarterly. The preferred units are listed on the New York Stock Exchange and trade under the ticker symbol CEQP-P.

Sustainability Program Update

In January 2023, Crestwood was one of three midstream companies included in the 2023 Bloomberg Gender-Equality Index (GEI). This marks the third consecutive year being included in the GEI and validates the company’s commitment to advancing diversity, equity and inclusion within the organization. Crestwood continues to advance its carbon management plan across its portfolio, including at its newly acquired assets, and remains on track to publish its fifth annual sustainability report in June 2023. For more information on Crestwood’s approach to sustainability, please visit https://esg.crestwoodlp.com.

Upcoming Conference Participation

Crestwood’s management will participate in the following upcoming investor conferences. Prior to the start of each conference, new presentation materials may be posted to the Investors section of Crestwood’s website at www.crestwoodlp.com.

  • J.P. Morgan Global High Yield & Leveraged Finance Conference, Miami, FL, March 6 - 8, 2023
  • 51st Annual Scotia Howard Weil Energy Conference, Miami, FL, March 6 - 8, 2023

2022 K-1 Tax Packages

Crestwood’s K-1 tax packages are expected to be made available online and mailed by mid-March 2023. Once available, K-1s can be found online at www.taxpackagesupport.com/CEQP for the common units, www.taxpackagesupport.com/CEQP_Preferred for the preferred units, and www.taxpackagesupport.com/oasis for Oasis Midstream for January 1 - 31, 2022.

2022 Annual Report Form 10-K

Crestwood plans to file its annual report on Form 10-K with the Securities and Exchange Commission for the year ended December 31, 2022, by February 27, 2023. The 10-K report will be available to view, print or download on the Investors page of Crestwood’s website at www.crestwoodlp.com. Crestwood will also provide a printed copy of the annual report on Form 10-K, free of charge upon request. Such requests should be directed in writing via email to This email address is being protected from spambots. You need JavaScript enabled to view it. or via mail to Investor Relations, 811 Main St., Suite 3400, Houston, TX 77002.

Earnings Conference Call Schedule

Management will host a conference call for investors and analysts of Crestwood today at 9:00 a.m. Eastern Time (8:00 a.m. Central Time) which will be broadcast live over the Internet. Investors will be able to connect to the webcast via the “Investors” page of Crestwood’s website at www.crestwoodlp.com. Please log in at least ten minutes in advance to register and download any necessary software. A replay will be available shortly after the call for 90 days.

Non-GAAP Financial Measures

Adjusted EBITDA, distributable cash flow and free cash flow are non-GAAP financial measures. The accompanying schedules of this news release provide reconciliations of these non-GAAP financial measures to their most directly comparable financial measures calculated and presented in accordance with GAAP. Our non-GAAP financial measures should not be considered as alternatives to GAAP measures such as net income or operating income or any other GAAP measure of liquidity or financial performance.

Forward-Looking Statements

This news release contains forward-looking statements within the meaning of the U.S. Private Securities Litigation Reform Act of 1995 and Section 21E of the Securities and Exchange Act of 1934. The words “expects,” “believes,” “anticipates,” “plans,” “will,” “shall,” “estimates,” and similar expressions identify forward-looking statements, which are generally not historical in nature. Forward-looking statements are subject to risks and uncertainties and are based on the beliefs and assumptions of management, based on information currently available to them. Although Crestwood believes that these forward-looking statements are based on reasonable assumptions, it can give no assurance that any such forward-looking statements will materialize. Important factors that could cause actual results to differ materially from those expressed in or implied from these forward-looking statements include the risks and uncertainties described in Crestwood’s reports filed with the Securities and Exchange Commission, including its Annual Report on Form 10-K and its subsequent reports, which are available through the SEC’s EDGAR system at www.sec.gov and on our website. Readers are cautioned not to place undue reliance on forward-looking statements, which reflect management’s view only as of the date made, and Crestwood assumes no obligation to update these forward-looking statements.

About Crestwood Equity Partners LP

Houston, Texas, based Crestwood Equity Partners LP (NYSE: CEQP) is a master limited partnership that owns and operates midstream businesses in multiple shale resource plays across the United States. Crestwood Equity is engaged in the gathering, processing, treating, compression, storage and transportation of natural gas; storage, transportation, terminalling and marketing of NGLs; gathering, storage, terminalling and marketing of crude oil; and gathering and disposal of produced water. To learn more about Crestwood Equity Partners LP, visit www.crestwoodlp.com; and to learn more about Crestwood’s sustainability efforts, please visit https://esg.crestwoodlp.com.

1 Please see non-GAAP reconciliation tables included at the end of the press release.

CRESTWOOD EQUITY PARTNERS LP

Consolidated Statements of Operations

(in millions, except per unit data)

(unaudited)


Three Months Ended
December 31,


Year Ended
December 31,


2022


2021


2022


2021


Revenues

$

1,402.9


$

1,380.4


$

6,000.7


$

4,569.0


Costs of products/services sold


1,132.7


1,133.6


4,997.1


3,843.9


Operating expenses and other:


Operations and maintenance


52.1


30.8


196.1


121.0


General and administrative


26.6


30.2


130.4


97.6


Depreciation, amortization and accretion


86.6


61.6


328.9


244.2


Loss on long-lived assets, net


0.8


20.0


187.7


39.6


Gain on acquisition


(75.3

)


166.1


142.6


767.8


502.4


Operating income


104.1


104.2


235.8


222.7


Earnings (loss) from unconsolidated affiliates, net


3.5


5.5


15.7


(120.4

)

Interest and debt expense, net


(53.6

)


(30.1

)


(177.4

)


(132.1

)

Loss on modification/extinguishment of debt


(0.8

)


(7.5

)

Other income (expense), net


0.1


(0.1

)


0.3


0.1


Income (loss) before income taxes


54.1


78.7


74.4


(37.2

)

Provision for income taxes


(0.2

)


(0.1

)


(1.9

)


(0.2

)

Net income (loss)


53.9


78.6


72.5


(37.4

)

Net income attributable to non-controlling partner


10.4


10.4


41.2


41.1


Net income (loss) attributable to Crestwood Equity Partners LP


43.5


68.2


31.3


(78.5

)

Net income attributable to preferred units


15.1


15.1


60.1


60.1


Net income (loss) attributable to partners

$

28.4


$

53.1


$

(28.8

)


$

(138.6

)


Net income (loss) per limited partner unit:


Basic

$

0.27


$

0.84


$

(0.29

)


$

(2.11

)

Diluted

$

0.26


$

0.79


$

(0.29

)


$

(2.11

)

CRESTWOOD EQUITY PARTNERS LP

Selected Balance Sheet Data

(in millions)

(unaudited)


December 31,


2022


2021

Cash

$

7.5


$

13.3


Outstanding debt:


Revolving Credit Facilities

$

1,129.1


$

282.0

Senior Notes


2,250.0


1,800.0

Other


26.7


0.2

Subtotal


3,405.8


2,082.2

Less: deferred financing costs, net


27.5


29.9

Total debt

$

3,378.3


$

2,052.3


Partners' capital


Total partners' capital

$

1,907.2


$

1,099.6

Common units outstanding


104.6


63.0

CRESTWOOD EQUITY PARTNERS LP

Reconciliation of Non-GAAP Financial Measures

(in millions)

(unaudited)


Three Months Ended
December 31,


Year Ended
December 31,


2022


2021


2022


2021


Net Income (Loss) to Adjusted EBITDA


Net income (loss)

$

53.9


$

78.6


$

72.5


$

(37.4

)

Interest and debt expense, net


53.6


30.1


177.4


132.1


Loss on modification/extinguishment of debt


0.8


7.5


Provision for income taxes


0.2


0.1


1.9


0.2


Depreciation, amortization and accretion


86.6


61.6


328.9


244.2


EBITDA(a)

$

194.3


$

171.2


$

580.7


$

346.6


Significant items impacting EBITDA:


Unit-based compensation charges


10.4


12.1


37.2


34.9


Loss on long-lived assets, net


0.8


20.0


187.7


39.6


Gain on acquisition


(75.3

)


(Earnings) loss from unconsolidated affiliates, net


(3.5

)


(5.5

)


(15.7

)


120.4


Adjusted EBITDA from unconsolidated affiliates, net


5.8


10.5


30.0


67.0


Change in fair value of commodity inventory-related derivative contracts


(9.8

)


(62.4

)


(14.4

)


(13.5

)

Significant transaction and environmental related costs and other items


2.3


3.2


31.9


5.1


Adjusted EBITDA(a)

$

200.3


$

149.1


$

762.1


$

600.1


Distributable Cash Flow(b)


Adjusted EBITDA(a)

$

200.3


$

149.1


$

762.1


$

600.1


Cash interest expense(c)


(54.2

)


(28.6

)


(178.2

)


(125.9

)

Maintenance capital expenditures(d)


(13.5

)


(6.2

)


(28.7

)


(19.3

)

Adjusted EBITDA from unconsolidated affiliates, net


(5.8

)


(10.5

)


(30.0

)


(67.0

)

Distributable cash flow from unconsolidated affiliates


5.6


9.3


28.0


62.6


PRB cash received in excess of recognized revenues(e)


4.1


3.5


16.8


22.1


Provision for income taxes


(0.2

)


(0.1

)


(1.9

)


(0.2

)

Distributable cash flow attributable to CEQP


136.3


116.5


568.1


472.4


Distributions to preferred


(15.1

)


(15.1

)


(60.1

)


(60.1

)

Distributions to Niobrara preferred


(10.4

)


(10.3

)


(41.4

)


(41.2

)

Distributable cash flow attributable to CEQP common

$

110.8


$

91.1


$

466.6


$

371.1


Contacts

Crestwood Equity Partners LP
Investor Contacts
Andrew Thorington, 713-381-3028
This email address is being protected from spambots. You need JavaScript enabled to view it.
Vice President, Finance & Investor Relations

Rhianna Disch, 713-380-3006
This email address is being protected from spambots. You need JavaScript enabled to view it.
Director, Investor Relations

Sustainability and Media Contact
Joanne Howard, 832-519-2211
This email address is being protected from spambots. You need JavaScript enabled to view it.
Senior Vice President, Sustainability and Corporate Communications


Read full story here
Offshore Source Logo

Offshore Source keeps you updated with relevant information concerning the Offshore Energy Sector.

Any views or opinions represented on this website belong solely to the author and do not represent those of the people, institutions or organizations that Offshore Source or collaborators may or may not have been associated with in a professional or personal capacity, unless explicitly stated.

Corporate Offices

Technology Systems Corporation
8502 SW Kansas Ave
Stuart, FL 34997

info@tscpublishing.com