Business Wire News

FOSHAN, China--(BUSINESS WIRE)--$SZ #GlobalFortune500--Earlier this year, Forbes released its "2022 Forbes China Top 50 Sustainable Development Industrial Enterprises" list. Midea Group was included on the list for its outstanding performance in green manufacturing, carbon neutrality, sustainable development and ESG construction.


The assessment focused on the specific indicators of five dimensions, i.e., "management system, technological innovation, comprehensive benefits, resource allocation, and demonstration & promotion". The selected companies this year are all industrial enterprises that have been established for at least 10 years, and have an annual revenue of more than RMB 100 billion, along with a year-on-year increase in R&D investment of about 50%. They also demonstrate key advantages over their global counterparts and possess state-of-the-art technologies that are among the best in the world.

Over the course of 25 years, Midea has honed and perfected its sustainable development management system, which integrates the concept of sustainable development into virtually every step of production and operation, as part of its efforts to fulfill its commitment to creating shared value with stakeholders.

Midea Shunde Industrial Park utilizes distributed PV systems, energy storage equipment, high-efficiency HVAC equipment (including MDV8 multi-connected units), LINVOL digital intelligent elevators, energy recovery modules, and automated production lines to realize both a green office and low-cost carbon production. Its efforts have led to LEED & WELL certifications. Relying on its iBUILDING digital platform, Midea Shunde Industrial Park's carbon management system and power grid system are fully integrated, and carbon neutrality has been achieved in the office area as well.

The Midea Chongqing Factory currently leverages over 15 green and energy-saving technologies, 8 digital scene applications, 3 green certifications and consultations, and also boasts access to over 10 information systems. It has significantly increased the proportion of clean energy and green electricity by installing roof PV panels, photovoltaic curtain walls, and solar street lights. Midea Chongqing Factory has also obtained the PAS2060 carbon neutral certificate, becoming one of Midea's first zero-carbon pilot plants.

Guided by the most advanced carbon consulting, Midea Jingzhou Factory has made a zero-carbon pathway that includes four stages: planning & design, construction, operation, and transformation. It has also adopted key zero-carbon solutions to obtain both its green and zero-carbon certifications. Through its energy optimization and management, operation and maintenance costs will be reduced by 30%, and the plant's power consumption will be diminished by 5-20%. These are its carbon reduction efforts as such.


Contacts

Lori Luo   This email address is being protected from spambots. You need JavaScript enabled to view it.

AUSTIN, Texas--(BUSINESS WIRE)--USA Compression Partners, LP (NYSE: USAC) (“USA Compression” or the “Partnership”) announced today its financial and operating results for fourth-quarter 2022.


Fourth-Quarter 2022 Highlights

  • Record total revenues of $190.1 million for fourth-quarter 2022, compared to $159.9 million for fourth-quarter 2021.
  • Net income was $8.4 million for fourth-quarter 2022, compared to $3.1 million for fourth-quarter 2021.
  • Net cash provided by operating activities was $82.1 million for fourth-quarter 2022, compared to $81.1 million for fourth-quarter 2021.
  • Adjusted EBITDA of $113.0 million for fourth-quarter 2022, compared to $99.2 million for fourth-quarter 2021.
  • Distributable Cash Flow of $60.6 million for fourth-quarter 2022, compared to $52.0 million for fourth-quarter 2021.
  • Paid cash distribution of $0.525 per common unit for fourth-quarter 2022, consistent with fourth-quarter 2021.
  • Distributable Cash Flow Coverage was 1.18x for fourth-quarter 2022, compared to 1.02x for fourth-quarter 2021.

“Our fourth-quarter results were indicative of the vital importance of natural gas compression within the midstream and broader energy-market value chain. We again experienced sequential-quarter increases in revenues, Adjusted EBITDA, and revenue-generating horsepower, along with continued improvements to pricing,” commented Eric D. Long, USA Compression’s President and Chief Executive Officer. “Additionally, our fourth-quarter results featured a quarterly record for revenue. This record quarterly result was made possible by sequential-quarter improvements to our fleet utilization, which surpassed a 91-percent exit rate for the fourth quarter, and by continued improvements to our quarter-over-quarter average price per horsepower per month. Our fourth-quarter performance further reduced our leverage ratio while generating distribution coverage of 1.18 times, representing a more than 10% improvement over third-quarter 2022.”

Expansion capital expenditures were $46.1 million, maintenance capital expenditures were $3.7 million, and cash interest expense, net was $36.2 million for the fourth-quarter 2022.

On January 12, 2023, the Partnership announced a fourth-quarter cash distribution of $0.525 per common unit, which corresponds to an annualized distribution rate of $2.10 per common unit. The distribution was paid on February 3, 2023, to common unitholders of record as of the close of business on January 23, 2023.

Operational and Financial Data


Three Months Ended


Year Ended


December 31,
2022


September 30,
2022


December 31,
2021


December 31,
2022


December 31,
2021

Operational data:


Fleet horsepower (at period end) (1)


3,716,854


3,711,205


3,689,018


3,716,854


3,689,018


Revenue-generating horsepower (at period end) (2)


3,199,548


3,128,845


2,964,206


3,199,548


2,964,206


Average revenue-generating horsepower (3)


3,171,899


3,090,910


2,950,623


3,067,279


2,951,013


Revenue-generating compression units (at period end)


4,116


4,034


3,942


4,116


3,942


Horsepower utilization (at period end) (4)


91.8

%


90.9

%


82.7

%


91.8

%


82.7

%

Average horsepower utilization (for the period) (4)


91.3

%


90.3

%


82.9

%


88.6

%


82.7

%


Financial data ($ in thousands, except per horsepower data):


Total revenues

$

190,112


$

179,613


$

159,943


$

704,598


$

632,645


Average revenue per revenue-generating horsepower per month (5)

$

17.81


$

17.53


$

16.62


$

17.35


$

16.60


Net income

$

8,366


$

9,612


$

3,105


$

30,318


$

10,279


Operating income

$

46,693


$

45,103


$

36,336


$

169,293


$

140,872


Net cash provided by operating activities

$

82,099


$

49,209


$

81,057


$

260,590


$

265,425


Gross margin

$

64,237


$

61,388


$

49,698


$

233,585


$

199,487


Adjusted gross margin (6)

$

124,119


$

120,160


$

108,945


$

470,262


$

438,256


Adjusted gross margin percentage (7)


65.3

%


66.9

%


68.1

%


66.7

%


69.3

%

Adjusted EBITDA (6)

$

112,991


$

109,156


$

99,205


$

425,978


$

398,380


Adjusted EBITDA percentage (7)


59.4

%


60.8

%


62.0

%


60.5

%


63.0

%

Distributable Cash Flow (6)

$

60,596


$

55,181


$

52,039


$

221,499


$

209,128


____________________________________

(1)

Fleet horsepower is horsepower for compression units that have been delivered to the Partnership (and excludes units on order). As of December 31, 2022, the Partnership had 165,000 large horsepower on order for delivery during 2023.

(2)

Revenue-generating horsepower is horsepower under contract for which the Partnership is billing a customer.

(3)

Calculated as the average of the month-end revenue-generating horsepower for each of the months in the period.

(4)

Horsepower utilization is calculated as (i) the sum of (a) revenue-generating horsepower; (b) horsepower in the Partnership’s fleet that is under contract but is not yet generating revenue; and (c) horsepower not yet in the Partnership’s fleet that is under contract but not yet generating revenue and that is subject to a purchase order, divided by (ii) total available horsepower less idle horsepower that is under repair.


Horsepower utilization based on revenue-generating horsepower and fleet horsepower was 86.1%, 84.3%, and 80.4% at December 31, 2022, September 30, 2022, and December 31, 2021, respectively.


Average horsepower utilization based on revenue-generating horsepower and fleet horsepower was 85.4%, 83.4%, and 80.0% for the three months ended December 31, 2022, September 30, 2022, and December 31, 2021, respectively. Average horsepower utilization based on revenue-generating horsepower and fleet horsepower was 82.9% and 79.8% for the years ended December 31, 2022 and 2021, respectively.

(5)

Calculated as the average of the result of dividing the contractual monthly rate, excluding standby or other temporary rates, for all units at the end of each month in the period by the sum of the revenue-generating horsepower at the end of each month in the period.

(6)

Adjusted gross margin, Adjusted EBITDA, and Distributable Cash Flow are all non-U.S. generally accepted accounting principles (“Non-GAAP”) financial measures. For the definition of each measure, as well as reconciliations of each measure to its most directly comparable financial measures calculated and presented in accordance with GAAP, see “Non-GAAP Financial Measures” below.

(7)

Adjusted gross margin percentage and Adjusted EBITDA percentage are calculated as a percentage of revenue.

Liquidity and Long-Term Debt

As of December 31, 2022, the Partnership was in compliance with all covenants under its $1.6 billion revolving credit facility. As of December 31, 2022, the Partnership had outstanding borrowings under the revolving credit facility of $646.0 million, $954.0 million of availability and, subject to compliance with the applicable financial covenants, available borrowing capacity of $333.1 million. As of December 31, 2022, the outstanding aggregate principal amount of the Partnership’s 6.875% senior notes due 2026 and 6.875% senior notes due 2027 was $725.0 million and $750.0 million, respectively.

Full-Year 2023 Outlook

USA Compression is providing its full-year 2023 guidance as follows:

  • Net income range of $75.0 million to $95.0 million;
  • A forward-looking estimate of net cash provided by operating activities is not provided because the items necessary to estimate net cash provided by operating activities, in particular the change in operating assets and liabilities, are not accessible or estimable at this time. The Partnership does not anticipate changes in operating assets and liabilities to be material, but changes in accounts receivable, accounts payable, accrued liabilities, and deferred revenue could be significant, such that the amount of net cash provided by operating activities would vary substantially from the amount of projected Adjusted EBITDA and Distributable Cash Flow;
  • Adjusted EBITDA range of $490.0 million to $510.0 million; and
  • Distributable Cash Flow range of $260.0 million to $280.0 million.

Conference Call

The Partnership will host a conference call today beginning at 11:00 a.m. Eastern Time (10:00 a.m. Central Time) to discuss fourth-quarter 2022 performance. The call will be broadcast live over the internet. Investors may participate by audio webcast, or if located in the U.S. or Canada, by phone. A replay will be available shortly after the call via the “Events” page of USA Compression’s Investor Relations website.

By Webcast:


Connect to the webcast via the “Events” page of USA Compression’s Investor Relations website at https://investors.usacompression.com. Please log in at least 10 minutes in advance to register and download any necessary software.


By Phone:


Dial (888) 440-5655 at least 10 minutes before the call and ask for the USA Compression Partners Earnings Call.

About USA Compression Partners, LP

USA Compression Partners, LP is a growth-oriented Delaware limited partnership that is one of the nation’s largest independent providers of natural gas compression services in terms of total compression fleet horsepower. USA Compression partners with a broad customer base composed of producers, processors, gatherers, and transporters of natural gas and crude oil. USA Compression focuses on providing natural gas compression services to infrastructure applications primarily in high-volume gathering systems, processing facilities, and transportation applications. More information is available at usacompression.com.

Non-GAAP Financial Measures

This news release includes the Non-GAAP financial measures of Adjusted gross margin, Adjusted EBITDA, Distributable Cash Flow, and Distributable Cash Flow Coverage Ratio.

Adjusted gross margin is defined as revenue less cost of operations, exclusive of depreciation and amortization expense. Management believes Adjusted gross margin is useful to investors as a supplemental measure of the Partnership’s operating profitability. Adjusted gross margin is primarily impacted by the pricing trends for service operations and cost of operations, including labor rates for service technicians, volume, and per-unit costs for lubricant oils, quantity and pricing of routine preventative maintenance on compression units, and property tax rates on compression units. Adjusted gross margin should not be considered an alternative to, or more meaningful than, gross margin or any other measure presented in accordance with GAAP. Moreover, the Partnership’s Adjusted gross margin, as presented, may not be comparable to similarly titled measures of other companies. Because the Partnership capitalizes assets, depreciation and amortization of equipment is a necessary element of its cost structure. To compensate for the limitations of Adjusted gross margin as a measure of the Partnership’s performance, management believes it important to consider gross margin determined under GAAP, as well as Adjusted gross margin, to evaluate the Partnership’s operating profitability.

Management views Adjusted EBITDA as one of its primary tools for evaluating the Partnership’s results of operations, and the Partnership tracks this item on a monthly basis as an absolute amount and as a percentage of revenue compared to the prior month, year-to-date, prior year, and budget. The Partnership defines EBITDA as net income (loss) before net interest expense, depreciation and amortization expense, and income tax expense (benefit). The Partnership defines Adjusted EBITDA as EBITDA plus impairment of compression equipment, impairment of goodwill, interest income on capital leases, unit-based compensation expense (benefit), severance charges, certain transaction expenses, loss (gain) on disposition of assets, and other. Adjusted EBITDA is used as a supplemental financial measure by management and external users of the Partnership’s financial statements, such as investors and commercial banks, to assess:

  • the financial performance of the Partnership’s assets without regard to the impact of financing methods, capital structure, or the historical cost basis of the Partnership’s assets;
  • the viability of capital expenditure projects and the overall rates of return on alternative investment opportunities;
  • the ability of the Partnership’s assets to generate cash sufficient to make debt payments and pay distributions; and
  • the Partnership’s operating performance as compared to those of other companies in its industry without regard to the impact of financing methods and capital structure.

Management believes Adjusted EBITDA provides useful information to investors because, when viewed in conjunction with the Partnership’s GAAP results and the accompanying reconciliations, it may provide a more complete assessment of the Partnership’s performance as compared to considering solely GAAP results. Management also believes that external users of the Partnership’s financial statements benefit from having access to the same financial measures that management uses to evaluate the results of the Partnership’s business.

Adjusted EBITDA should not be considered an alternative to, or more meaningful than, net income (loss), operating income (loss), cash flows from operating activities, or any other measure presented in accordance with GAAP. Moreover, the Partnership’s Adjusted EBITDA, as presented, may not be comparable to similarly titled measures of other companies.

Distributable Cash Flow is defined as net income (loss) plus non-cash interest expense, non-cash income tax expense (benefit), depreciation and amortization expense, unit-based compensation expense (benefit), impairment of compression equipment, impairment of goodwill, certain transaction expenses, severance charges, loss (gain) on disposition of assets, proceeds from insurance recovery, and other, less distributions on the Partnership’s Series A Preferred Units (“Preferred Units”) and maintenance capital expenditures.

Distributable Cash Flow should not be considered an alternative to, or more meaningful than, net income (loss), operating income (loss), cash flows from operating activities, or any other measure presented in accordance with GAAP. Moreover, the Partnership’s Distributable Cash Flow, as presented, may not be comparable to similarly titled measures of other companies.​

Management believes Distributable Cash Flow is an important measure of operating performance because it allows management, investors, and others to compare the cash flows that the Partnership generates (after distributions on the Partnership’s Preferred Units but prior to any retained cash reserves established by the Partnership’s general partner and the effect of the Distribution Reinvestment Plan) to the cash distributions that the Partnership expects to pay its common unitholders.

Distributable Cash Flow Coverage Ratio is defined as the period’s Distributable Cash Flow divided by distributions declared to common unitholders in respect of such period. Management believes Distributable Cash Flow Coverage Ratio is an important measure of operating performance because it permits management, investors, and others to assess the Partnership’s ability to pay distributions to common unitholders out of the cash flows the Partnership generates. The Partnership’s Distributable Cash Flow Coverage Ratio, as presented, may not be comparable to similarly titled measures of other companies.

This news release also contains a forward-looking estimate of Adjusted EBITDA and Distributable Cash Flow projected to be generated by the Partnership for its 2023 fiscal year. A forward-looking estimate of net cash provided by operating activities and reconciliations of the forward-looking estimates of Adjusted EBITDA and Distributable Cash Flow to net cash provided by operating activities are not provided because the items necessary to estimate net cash provided by operating activities, in particular the change in operating assets and liabilities, are not accessible or estimable at this time. The Partnership does not anticipate changes in operating assets and liabilities to be material, but changes in accounts receivable, accounts payable, accrued liabilities, and deferred revenue could be significant, such that the amount of net cash provided by operating activities would vary substantially from the amount of projected Adjusted EBITDA and Distributable Cash Flow.

See “Reconciliation of Non-GAAP Financial Measures” for Adjusted gross margin reconciled to gross margin, Adjusted EBITDA reconciled to net income and net cash provided by operating activities, and net income and net cash provided by operating activities reconciled to Distributable Cash Flow and Distributable Cash Flow Coverage Ratio.

Forward-Looking Statements

Some of the information in this news release may contain forward-looking statements. These statements can be identified by the use of forward-looking terminology including “may,” “believe,” “expect,” “intend,” “anticipate,” “estimate,” “continue,” “if,” “project,” “outlook,” “will,” “could,” “should,” or other similar words or the negatives thereof, and include the Partnership’s expectation of future performance contained herein, including as described under “Full-Year 2023 Outlook.” These statements discuss future expectations, contain projections of results of operations or of financial condition, or state other “forward-looking” information. You are cautioned not to place undue reliance on any forward-looking statements, which can be affected by assumptions used or by known risks or uncertainties. Consequently, no forward-looking statements can be guaranteed. When considering these forward-looking statements, you should keep in mind the risk factors noted below and other cautionary statements in this news release. The risk factors and other factors noted throughout this news release could cause actual results to differ materially from those contained in any forward-looking statement. Known material factors that could cause the Partnership’s actual results to differ materially from the results contemplated by such forward-looking statements include:

  • changes in general economic conditions, including inflation or supply chain disruptions and changes in economic conditions of the crude oil and natural gas industries, including any impact from the ongoing military conflict involving Russia and Ukraine;
  • changes in the long-term supply of and demand for crude oil and natural gas, including as a result of the severity and duration of world health events, including the COVID-19 pandemic, related economic repercussions, actions taken by governmental authorities and other third parties in response to such events, and the resulting disruption in the oil and gas industry and impact on demand for oil and gas;
  • competitive conditions in the Partnership’s industry, including competition for employees in a tight labor market;
  • changes in the availability and cost of capital, including changes to interest rates;
  • renegotiation of material terms of customer contracts;
  • actions taken by the Partnership’s customers, competitors, and third-party operators;
  • operating hazards, natural disasters, epidemics, pandemics (such as COVID-19), weather-related impacts, casualty losses, and other matters beyond the Partnership’s control;
  • operational challenges relating to COVID-19 and efforts to mitigate the spread of the virus, including logistical challenges, protecting the health and well-being of the Partnership’s employees, remote work arrangements, performance of contracts, and supply chain disruptions;
  • the deterioration of the financial condition of the Partnership’s customers, which may result in the initiation of bankruptcy proceedings with respect to certain customers;
  • the restrictions on the Partnership’s business that are imposed under the Partnership’s long-term debt agreements;
  • information technology risks, including the risk from cyberattacks;
  • the effects of existing and future laws and governmental regulations;
  • the effects of future litigation;
  • the Partnership’s ability to realize the anticipated benefits of acquisitions; and
  • other factors discussed in the Partnership’s filings with the SEC.

All forward-looking statements speak only as of the date of this news release and are expressly qualified in their entirety by the foregoing cautionary statements. Unless legally required, the Partnership undertakes no obligation to update publicly any forward-looking statements, whether as a result of new information, future events, or otherwise. Unpredictable or unknown factors not discussed herein also could have material adverse effects on forward-looking statements.


USA COMPRESSION PARTNERS, LP

CONDENSED CONSOLIDATED STATEMENTS OF OPERATIONS

(In thousands, except for per unit amounts Unaudited)


Three Months Ended


Year Ended


December 31,
2022


September 30,
2022


December 31,
2021


December 31,
2022


December 31,
2021

Revenues:


Contract operations

$

180,558


$

171,019


$

153,503


$

673,214


$

609,450


Parts and service


5,297


4,901


3,250


15,729


11,228


Related party


4,257


3,693


3,190


15,655


11,967


Total revenues


190,112


179,613


159,943


704,598


632,645


Costs and expenses:


Cost of operations, exclusive of depreciation and amortization


65,993


59,453


50,998


234,336


194,389


Depreciation and amortization


59,882


58,772


59,247


236,677


238,769


Selling, general, and administrative


17,436


14,663


13,470


61,278


56,082


Loss (gain) on disposition of assets


(443

)


1,118


(276

)


1,527


(2,588

)

Impairment of compression equipment


551


504


168


1,487


5,121


Total costs and expenses


143,419


134,510


123,607


535,305


491,773


Operating income


46,693


45,103


36,336


169,293


140,872


Other income (expense):


Interest expense, net


(37,991

)


(35,142

)


(32,966

)


(138,050

)


(129,826

)

Other


23


27


19


91


107


Total other expense


(37,968

)


(35,115

)


(32,947

)


(137,959

)


(129,719

)

Net income before income tax expense


8,725


9,988


3,389


31,334


11,153


Income tax expense


359


376


284


1,016


874


Net income


8,366


9,612


3,105


30,318


10,279


Less: distributions on Preferred Units


(12,187

)


(12,188

)


(12,187

)


(48,750

)


(48,750

)

Net loss attributable to common unitholders’ interests

$

(3,821

)


$

(2,576

)


$

(9,082

)


$

(18,432

)


$

(38,471

)


Weighted average common units outstanding – basic and diluted


98,051


97,968


97,151


97,780


97,068


Basic and diluted net loss per common unit

$

(0.04

)


$

(0.03

)


$

(0.09

)


$

(0.19

)


$

(0.40

)


Distributions declared per common unit for respective periods

$

0.525


$

0.525


$

0.525


$

2.10


$

2.10


USA COMPRESSION PARTNERS, LP

SELECTED BALANCE SHEET DATA

(In thousands, except unit amounts Unaudited)


December 31, 2022

Selected Balance Sheet data:


Total assets

$

2,665,724


Long-term debt, net

$

2,106,649


Total partners’ deficit

$

(116,299

)


Common units outstanding


98,227,656


USA COMPRESSION PARTNERS, LP

CONDENSED CONSOLIDATED STATEMENTS OF CASH FLOWS

(In thousands — Unaudited)


Three Months Ended


Year Ended


December 31,
2022


September 30,
2022


December 31,
2021


December 31,
2022


December 31,
2021

Net cash provided by operating activities

$

82,099


$

49,209


$

81,057


$

260,590


$

265,425


Net cash used in investing activities


(43,530

)


(43,545

)


(15,522

)


(129,945

)


(39,188

)

Net cash used in financing activities


(38,540

)


(5,658

)


(65,785

)


(130,610

)


(226,239

)


Contacts

Investor Contacts:

USA Compression Partners, LP

Mike Pearl
Chief Financial Officer
(832) 823-7306
This email address is being protected from spambots. You need JavaScript enabled to view it.

Julie McEwen
Controller
(512) 369-1389
This email address is being protected from spambots. You need JavaScript enabled to view it.


Read full story here

DAKAR, Senegal--(BUSINESS WIRE)--The newest Mercy Ship, the Global Mercy® arrived in Dakar, Senegal on February 14, 2023. While the ship hosted surgical training in Senegal in 2022, this year marks the first time that specialized surgeries will take place on this newly built hospital ship. This field service will include partnership with ministries of health in both Senegal and The Gambia, serving both countries through the port of Dakar.


Designed with purpose, the Global Mercy hospital ship is 174 meters long, 28.6 meters wide and has space for 200 patients, six operating rooms, a laboratory, general outpatient clinics, dental, and eye clinics and training facilities.

The hospital decks cover a total area of 7,000 square meters and contain the latest training facilities. The ship can accommodate up to 950 people when docked, including crew members and volunteers from all over the world and will serve collaboratively in the future with the Africa Mercy® which has been in operation since 2007 and is currently undergoing refit to return to service in the fall of this year.

It is expected that more than 150,000 lives will be transformed through surgery alone, during the next 50 years of the Global Mercy’s lifespan, with each transformation representing a person with a name, a face, a story, a family and a purpose. In addition, thousands of African medical professionals will receive training and mentoring with the goal of multiplied impact within their own communities.

The Global Mercy’s arrival in Dakar this week is particularly meaningful to our team, as this year, we will be serving the people of both Senegal and The Gambia thanks to partnerships with their ministries of health,” explains Gert van de Weerdhof, Mercy Ships CEO. “We anticipate that over the next five months more than 800 maxillo-facial, pediatric orthopedic, pediatric general, general and eye surgeries will be carried out on board with up to 25% coming from The Gambia.”

In 2022, when the Global Mercy visited Senegal, more than 260 Senegalese healthcare professionals received training on board through a variety of courses addressing topics impacting delivery of safe surgical care, including Surgical Skills, SAFE Anesthesia, and Nursing Skills. In 2023, Mercy Ships anticipates providing training for more than 600 medical professionals.

This ceremony marks a new stage in the partnership between the government of Senegal and the NGO Mercy Ships. It is a dynamic and very beneficial collaboration because the intervention of Mercy Ships represents an essential contribution to strengthening the supply of surgical care and improving the supply of our surgical and social action systems. Indeed, through its many actions, Mercy Ships relieves thousands of individuals, and participates in reducing inequalities of access to health and quality services,” stated Dr. Marie Khemesse Ngom N’diaye, Minster of Health and Social Action, Senegal.

In May 2022, The Global Mercy was inaugurated in Dakar by H.E. President of Senegal, an ardent advocate in the strategic efforts to improve access to safer surgery, not just in his home country, but across all Africa, as evidenced by his championing of the Dakar Declaration which he takes forward to the rest of the African Union.

ABOUT MERCY SHIPS:

Mercy Ships is an international faith-based organization that operates hospital ships to deliver free, world-class healthcare services, medical capacity building, and health system strengthening to those with little access to safe surgical care. Since 1978, Mercy Ships has worked in more than 55 countries, with the last three decades focused entirely on partnering with African nations.

Each year, volunteer professionals from over 60 countries serve on board the world’s two largest non-governmental hospital ships, the Africa Mercy ® and the Global Mercy®. Professionals such as surgeons, dentists, nurses, health trainers, cooks, and engineers dedicate their time and skills to the cause. Mercy Ships has offices in 16 countries and an Africa Bureau. For more information, visit mercyships.org and follow us @MercyShips on social media.


Contacts

Laura Rebouché
U.S. National Media Relations Director
Mercy Ships
This email address is being protected from spambots. You need JavaScript enabled to view it.
www.mercyships.org/press

Global supply/demand dynamics in refined products markets are being driven by two critically important factors. The first is the reluctance of refiners to expand capacity in the face of climate policy and ESG headwinds. The second is a growing gap between policymakers’ aggressive energy-transition goals and the global pivot to a renewed focus on energy security. These developments have far-reaching implications, not only for refinery owners but also for E&Ps, midstreamers, exporters, policymakers, and energy-industry investors.   


HOUSTON--(BUSINESS WIRE)--#Crudeoil--RBN Energy and its Refined Fuels Analytics (“RFA”) practice today announced the release of “Future of Fuels,” a comprehensive report on the key factors influencing petroleum market dynamics — prices and price relationships, petroleum supply and demand, alternative fuels, and refining capacity and utilization.

The report’s analysis, forecasts and accompanying datasets address the short- and long-term outlook for the refining industry and a wide range of specific topics, such as the advantages U.S. refineries have over many of their international counterparts; the growing significance of export markets; the ongoing impacts of the Russia-Ukraine war on Russian refineries and exports; the Chinese government’s strategy regarding the buildout of refining capacity and exports; the decline in heavy oil production in the Western Hemisphere and the resulting narrowing in heavy-vs.-light differentials; and the unique set of challenges that refiners in each regional market face.

Future of Fuels provides a detailed look at U.S. and global refining capacity, including a detailed discussion of refinery project start-ups, restarts and shutdowns; the types of crude (heavy, medium, light) that capacity additions are designed to process; and changes in regional product make capacity.

The report also does a deep dive into global and regional demand trends for gasoline, diesel, jet, biodiesel, renewable diesel (RD) and sustainable aviation fuels (SAF) — including an assessment of the special dynamics driving the incentives-dependent biodiesel, RD and SAF markets; the margins for producing RD; and the availability of biofuel feedstocks. Finally, it includes a remarkably comprehensive set of supporting production, pricing and other data, all in downloadable Excel files.

For more information about the new Future of Fuels report and RBN’s Refined Fuels Analytics unit, click here.

About RBN Energy

RBN Energy is a leading energy market consultancy and analytics company based in Houston, Texas. The company provides a broad range of consulting services and information products concerning crude oil, refined products, natural gas, natural gas liquids and renewable energy sources. Our mission is to make sense out of the complex and sometimes quite opaque energy markets to create a deep understanding for our clients. To learn more about RBN Energy, please visit www.rbnenergy.com.


Contacts

TJ Braziel
This email address is being protected from spambots. You need JavaScript enabled to view it.
(888) 613-8874

DUBLIN--(BUSINESS WIRE)--The "Global Oil Country Tubular Good Market: Analysis By Process, By Grade, By Application, By Product, By Demand, By Production, By Region, Size and Trends with Impact of COVID-19 and Forecast up to 2028" report has been added to ResearchAndMarkets.com's offering.


The global oil country tubular good (OCTG) market was valued at US$22.95 billion in 2022 and is expected to be worth US$33.96 billion in 2028.

Oil country tubular goods (OCTG) are a type of solid rolled products that consist of casing, drill pipe, and tubing which are subjected to varying loading requirements based on the use.

The massive use of hydrocarbons across the verticals of power generation, production, process, transportation, etc. has led to a significant increase in exploration and production operations, which are augmenting the demand for OCTG products.

The OCTG market has experienced significant growth in recent years, driven by a number of factors. One of the main drivers of growth has been the increasing demand for oil and gas as a source of energy. This has led to a rise in drilling and extraction activities, resulting in higher demand for OCTG.

Additionally, advances in drilling technology have led to the development of more complex and challenging drilling operations, requiring more specialized and durable OCTG. The market is expected to grow at a CAGR of 6.75% over the projected period of 2023-2028.

In 2022, the global OCTG production was recorded at 12.76 million tons at a utilization capacity rate at 38.97%. High oil and gas prices have fueled an increase in both domestic and international rig counts. As the international recovery in project activity accelerates, particularly in the Middle East across both short and long-cycle developments, global OCTG net capacity and capacity utilization are expected to rise.

Market Dynamics

Growth Drivers

  • Growing Oil Demand
  • Rising Energy Consumption
  • Growth in Hydraulic Fracturing Activities
  • Accelerating Economic Growth
  • Technological Innovation in Drilling Techniques
  • Growth in Footage of Wells Drilled

Challenges

  • Increasing OCTG Prices in the US
  • Environmental Issues

Market Trends

  • Escalating Investment in Offshore Drilling Activities
  • Increasing R&D Spending in Energy Sector
  • Rise in Horizontal Directional Drilling for Oil & Gas Excavation
  • Easing Trade Restrictions in North America

Companies Mentioned

  • Tenaris S.A.
  • ArcelorMittal S.A.
  • EVRAZ PLC
  • JFE Holdings Inc.
  • MRC Global Inc.
  • NOV Inc.
  • Nippon Steel Corp
  • PAO TMK
  • United States Steel Corporation
  • Vallourec S.A.
  • ILJIN Steel Co., Ltd.
  • J-Hobbs Machine Corp.
  • Canam Pipe & Supply

Market Segmentation Analysis:

  • By Process: The report identifies two segments on the basis of process: Seamless and Welded. The seamless segment dominated the OCTG market. The increased use of seamless tube in the oil and gas industry is mostly due to the fact that it is extruded and drawn from a billet. A seamless tube has a short length and normally does not show signs of corrosion unless it is exposed to a severely corrosive environment.
  • By Grade: The report identifies two segments on the basis of grade: Premium and API. The premium grade segment dominates the global market for oil country tubular goods. Oil and gas reserves are being developed and explored offshore, and this has resulted in a demand for high-grade transportation tubes that can withstand corrosion and provide leak-proof operation and sealing integrity of the connections even when loaded, bent, and subjected to high internal pressure.
  • By Application: The report identifies two segments on the basis of application: Onshore and Offshore. Onshore OCTG is expected to be the fastest growing segment in the forecasted period. Onshore OCTG is mainly used in drilling and production operations that are closer to the shore.
  • By Product: The report identifies four segments on the basis of product: Well Casing, Production Tubing, Drill Pipe & Others. Well Casing is expected to be the fastest growing segment in the forecasted period. Well casing is a large diameter pipe that is inserted into a borehole's drilled section. This casing is typically held in place by cement or other materials placed between the casings and the wellbore. It is regarded as an important part of the well completion process. The rise in demand for well casing in this market is primari Latin America. North America accounted for the maximum share of the global market in 2022. The US is one of the largest oil and gas producer. The use of horizontal and directional drilling activities has increased in the US shale drilling regions over the last decade. ly due to the fact that it aids in the drilling process in a variety of ways, including providing a strong foundation to allow the use of high density drilling fluid to continue drilling deeper and providing a smooth internal bore for installing production equipment, all of which are expected to provide ample opportunities for the growth of the well casing product in the oil country tubular goods market.
  • By Region: In the report, the global oil country tubular good (OCTG) market is divided into five regions: North America, Asia Pacific, Europe, Middle East & Africa and

For more information about this report visit https://www.researchandmarkets.com/r/cdiuo7-oil?w=4

About ResearchAndMarkets.com

ResearchAndMarkets.com is the world's leading source for international market research reports and market data. We provide you with the latest data on international and regional markets, key industries, the top companies, new products and the latest trends.


Contacts

ResearchAndMarkets.com
Laura Wood, Senior Press Manager
This email address is being protected from spambots. You need JavaScript enabled to view it.
For E.S.T Office Hours Call 1-917-300-0470
For U.S./ CAN Toll Free Call 1-800-526-8630
For GMT Office Hours Call +353-1-416-8900

DEER PARK, Texas--(BUSINESS WIRE)--Taurus Industrial Group (“Taurus”), a portfolio company of SCF Partners (“SCF”), is pleased to announce its acquisition of Bolttech Mannings, Inc. (“BMI”), a leading provider of technical bolting, heat treating, leak sealing, and non-destructive testing services to the North American power generation, downstream, and industrial markets. BMI’s service offerings, geographic footprint, and customer relationships are highly synergistic with those of Taurus and help increase its presence in key industry sectors.


“We’re excited to add Bolttech to the Taurus Industrial Group family,” says Hari Gopu, CEO of Taurus. “With BMI’s strong capabilities and complimentary offerings, we’ll now be able to offer our core customers additional, and complimentary, capabilities across technical bolting and torquing, heat treating, leak sealing, and hot tapping services as well as expand our offerings to new blue-chip customers in the power, energy and industrial markets.”

“BMI is a key addition to the leading industrial services platform the Taurus team has built,” says Garrett Jackson, Director at SCF Partners and Taurus board member. “We look forward to supporting management‘s efforts to capitalize on the significant cross-selling opportunities and continue building out a broader service offering that meets the evolving needs of our customers.”

About Bolttech Mannings

Bolttech Mannings, with its subsidiaries Red Flame Industries, AM Inspection, and Global Tooling Services, has been a leader in specialty industrial bolting and torquing, hot tapping, and thermal technologies for a variety of industries for nearly 35 years. BMI’s dedicated technicians have experience in the power generation, steel, natural gas transmission, and petrochemical industries. The company has differentiated itself by providing the world’s most efficient full line of OEM industrial bolting tools, induction, combustion and resistance products. Learn more at www.bolttechmannings.com.

About Taurus Industrial Group

Taurus Industrial Group brings together familiar and highly regarded service providers with an outstanding combination of people and know-how, safely delivering high-performance solutions to operators in the ever-growing industrial and energy landscape. From engineering to implementation, the Taurus companies provide services for electrical and power systems, automation and control instrumentation, civil and mechanical projects, rotating and reciprocating equipment maintenance, piping and structural steel fabrication, refractory, scaffolding, insulation, paint and coatings. With principal offices in Houston, Texas, and localized service facilities in Corpus Christi, Port Lavaca, Freeport, Deer Park, Orange, Baton Rouge and Decatur (IL), the Taurus companies cover the US Gulf Coast and Midwest with capability, reliability and strength. Learn more at www.taurusig.com.


Contacts

Daniel Frayne
This email address is being protected from spambots. You need JavaScript enabled to view it.

  • Zeitview to aerially monitor construction of the 6,000 acre Gemini site located 33 miles northeast of Las Vegas, one of the largest solar and storage installations in the U.S. to date
  • Primergy Solar to access aerial intelligence data to streamline construction and minimize rework, maintain construction schedules

SANTA MONICA, Calif.--(BUSINESS WIRE)--With the construction of one of the country’s largest utility-scale solar and energy storage power plants underway to deliver 400,000 Las Vegas homes with renewable energy, Zeitview, formerly known as DroneBase, announced its continued partnership with the site’s developer Primergy Solar. Zeitview’s advanced inspection and data insights services are part of Primergy’s commitment to using state-of-the-art construction practices that reduce project footprint and preserve the local habitat. Zeitview is actively inspecting and analyzing the construction of the Gemini solar power plant to streamline construction, minimize costly corrections, evaluate challenges in real-time and improve project oversight.


“Gemini is an opportunity to lead the replacement of traditional coal-fueled power plants and pave the way for a more sustainable future. With over 1.8 million bifacial solar modules, the size, scale and integration of a 1.5GWh DC coupled battery, NV Energy has enabled one of the most complex clean energy power plants ever,” says Adam Larner, chief operating officer of Primergy Solar. “Aerial monitoring is critical in supporting the construction and operation of any solar asset, and with something at the scale of Gemini, it is even more crucial to maximizing the development and long-term investment in renewable energy power plants."

Zeitview’s exclusive aerial monitoring and Solar Insights software platform support developers, asset owners and investors to keep track of project construction, from equipment and staging locations to installation progress. Flying the site once a week, Zeitview planes and drones observe the construction of Gemini and deliver the captured imagery and data intelligence that cannot be collected from the ground alone so that Primergy can make informed, actionable decisions to ensure efficient development of the site. Zeitview’s construction monitoring platform incorporates artificial intelligence to analyze data from photographic documentation of the project site and associated components. Zeitview’s constantly improving AI algorithms allow them to ingest and analyze vast amounts of visual data with high accuracy.

“Aerial data intelligence is crucial for the efficient site management of solar plants like Gemini,” said Mark Culpepper, general manager of global solar solutions at Zeitview. “Beyond minimizing rework to delivering projects within time and budget constraints, a weekly bird’s eye view of construction provides the intelligence you can’t see from the ground. It makes inspectors more productive and frankly more accurate, compared to manual inspections, and saves the time and carbon emissions required to drive a site.”

Gemini will support over 1,000 jobs in the community during construction and add up to $463 million in economic development value to Nevada’s economy. Once the 690 MW of solar and 380 MW of energy storage of the Gemini power plant are interconnected to the local utility grid, it is predicted to provide a consistent, dispatchable clean energy resource for Nevada’s peak energy demands.

For more information on how Zeitview is supporting Gemini and other renewable projects, please visit www.zeitview.com.

ABOUT ZEITVIEW
For global customers in energy and infrastructure, Zeitview builds advanced inspection software that delivers fast, accurate insights, lowers costs, and improves asset performance and longevity. We are second to none at partnering with our customers to achieve flexible, long-term solutions across their multiple asset classes. Trusted by the largest enterprises in the world, Zeitview is active in over 70 countries. Learn more at www.zeitview.com.

ABOUT PRIMERGY SOLAR
Primergy Solar, LLC (https://www.primergysolar.com) is a developer, owner and operator focused on both distributed and utility-scale solar PV and battery storage projects across the US. Primergy features a diverse and talented team with decades of experience in renewables project development, financing, construction and operations. Primergy Solar is a portfolio company of Quinbrook Infrastructure Partners and is Quinbrook’s primary investment platform for Quinbrook Infrastructure Partners' solar and solar plus energy storage activities in North America.


Contacts

Technica Communications
Cait Caviness
This email address is being protected from spambots. You need JavaScript enabled to view it.

NEW BRAUNFELS, Texas--(BUSINESS WIRE)--TaskUs (Nasdaq: TASK), a provider of outsourced digital services and next-generation customer experience to fast-growing technology companies, has made a long-term commitment to support a partnership between Watershed, an enterprise climate platform, and renewables marketplace Ever.green to launch the first fixed-price virtual power purchase agreement (VPPA). Through the VPPA, TaskUs and other customers are contributing to the financing of a new solar plant in Laredo, Texas that will add clean energy to a grid that largely relies on coal and gas.


Supporting the fixed-price VPPA allows TaskUs to lock in long-term costs, as well as make significant progress towards its ambitious environmental goals. The Texas power grid experiences high emissions intensity owing to a reliance on coal and gas and the new solar plant will allow TaskUs and other companies to realize significant carbon reduction impact with their investments. The solar energy produced by this plant is expected to lead to over 13,000 tons of CO2 avoided every year—equivalent to taking nearly 3,000 gas-powered cars off the road annually. This partnership is a blueprint for many more projects of its kind funded collectively by Watershed customers.

"At TaskUs we take our sustainability efforts seriously with the understanding that every action we take as a company will have an impact on the environment, our society, and collective future,” said Jon Wouters, TaskUs' Division Vice President of Global Facilities, Growth, and Sustainability. “Working with Watershed helps us more quickly realize long-term environmental goals, which are a critical piece of our overall ESG commitments. We are excited to see the positive impact of this collaboration.”

"The fixed-price VPPA lets Watershed customers lock in years of renewable energy production that would not exist without their commitments," said Watershed co-founder Taylor Francis. "What's more, as corporate offsetting comes under intensified regulatory and media scrutiny, VPPA customers will have the assurance that they're funding only the highest-quality projects."

The VPPA participation is illustrative of TaskUs' ESG goals, which continue to be a key consideration for company operations. As a fully cloud-based organization, TaskUs is able to take an asset-light approach to working with customers. The company also focuses on achieving maximized efficiency in its facilities by managing improved seat utilization across its global footprint. TaskUs' sites in 14 countries have various local initiatives to encourage recycling, efficient energy usage, water conservation, and efforts to limit the presence and use of single-use plastics, among others.

To learn more about TaskUs, visit https://www.taskus.com or the following social media accounts:

About TaskUs

TaskUs is a provider of outsourced digital services and next-generation customer experience to fast-growing technology companies, helping its clients represent, protect and grow their brands. Leveraging a cloud-based infrastructure, TaskUs serves clients in the fastest-growing sectors, including social media, e-commerce, gaming, streaming media, food delivery and ridesharing, HiTech, FinTech and HealthTech. As of September 30, 2022, TaskUs had approximately 48,700 employees across twenty-eight locations in 14 countries, including the United States, the Philippines, and India.


Contacts

Media Contact
This email address is being protected from spambots. You need JavaScript enabled to view it.

Investor Contact
Alan Katz, Investor Relations
This email address is being protected from spambots. You need JavaScript enabled to view it.

PORTLAND, Ore.--(BUSINESS WIRE)--NW Natural Water Company, LLC (NW Natural Water), a wholly-owned subsidiary of Northwest Natural Holding Company (NYSE:NWN), recently signed agreements to acquire water and wastewater utilities serving more than 2,800 customers across four states with key additions to its newly acquired Arizona territory and rapidly-growing Texas utilities.


Notably, NW Natural Water plans to expand its footprint in Arizona with the acquisition of the Truxton Canyon Water and Cerbat Water utilities, which serve approximately 1,350 water customers near Kingman. The Texas footprint also is expected to grow by approximately 1,000 customers as NW Natural Water signed an agreement to acquire Everett Square in Conroe and has agreed to support Venterra Realty Management as it builds out the water and wastewater infrastructure for a new multi-family development on the west side of Houston. After Venterra completes the development, NW Natural Water plans to own and operate the water and wastewater infrastructure. Additional agreements were signed to acquire the Pedersen water utility system in Washington and the Idaho Club water and wastewater utilities in Idaho.

“I’m pleased with the growth and development of our water and wastewater utility platform to date, the opportunities in the regions we’re currently in, and our ability to continue growing through acquisitions in areas adjacent to our existing territories,” said Justin Palfreyman, NW Natural Water’s president. “We’re continuing to execute on our strategy to build a water and wastewater utility business focused on safety, reliability and superior customer service.”

The acquisitions are subject to customary closing conditions, including approval by the state utility commissions in Arizona, Texas, Washington and Idaho, respectively, and are expected to close in 2023. Upon closing of all pending acquisitions, NW Natural Water will serve over 160,000 people through approximately 65,000 connections across five states.

About NW Natural Holdings

Northwest Natural Holding Company (NYSE: NWN) is headquartered in Portland, Oregon and has been doing business for over 160 years. It owns NW Natural Gas Company (NW Natural), NW Natural Water Company (NW Natural Water), NW Natural Renewables Holdings and other business interests. We have a longstanding commitment to safety, environmental stewardship and the energy transition, and taking care of our employees and communities. Learn more in our latest ESG Report.

NW Natural is a local distribution company that currently provides natural gas service to approximately 2.5 million people through more than 790,000 meters with one of the most modern pipeline systems in the nation and consistently leads the industry with high J.D. Power & Associates customer satisfaction scores.

NW Natural Water currently provides water distribution and wastewater services to communities throughout the Pacific Northwest, Texas and Arizona. Learn more about our water business at nwnaturalwater.com.

Additional information is available at nwnaturalholdings.com.

Forward Looking Statements

This report, and other presentations made by NW Natural Holdings from time to time, may contain forward-looking statements within the meaning of the U.S. Private Securities Litigation Reform Act of 1995. Forward-looking statements can be identified by words such as "anticipates," "intends," "plans," "seeks," "believes," "estimates," "expects," “will,” and similar references to future periods. Examples of forward-looking statements include, but are not limited to, statements regarding the following: plans, objectives, goals, strategies, assumptions, estimates, expectations, expenses, future events, investments, growth and development, financial strength, resources, expertise, the water utility strategy and the related pending water acquisitions, the likelihood, timing, and success associated with any transaction or conditions related thereto, financial results, strategic fit, revenues and earnings, performance, water service and delivery, safety, environmental stewardship, the energy transition, and other statements that are other than statements of historical facts.

Forward-looking statements are based on our current expectations and assumptions regarding NW Natural Holdings’ business, the economy and other future conditions. Because forward-looking statements relate to the future, they are subject to inherent uncertainties, risks and changes in circumstances that are difficult to predict. NW Natural Holdings’ actual results may differ materially from those contemplated by the forward-looking statements. We caution you therefore against relying on any of these forward-looking statements. They are neither statements of historical fact nor guarantees or assurances of future performance. Important factors that could cause actual results to differ materially from those in the forward-looking statements are discussed by reference to the factors described in Part I, Item 1A "Risk Factors," and Part II, Item 7 and Item 7A "Management's Discussion and Analysis of Financial Condition and Results of Operations" and "Quantitative and Qualitative Disclosure about Market Risk" in NW Natural Holdings’ most recent Annual Report on Form 10-K, as updated by subsequent filed reports, and in Part I, Items 2 and 3 "Management's Discussion and Analysis of Financial Condition and Results of Operations" and "Quantitative and Qualitative Disclosures About Market Risk," and Part II, Item 1A, "Risk Factors," in NW Natural Holdings’ quarterly reports filed thereafter.

All forward-looking statements made in this report and all subsequent forward-looking statements, whether written or oral and whether made by or on behalf of NW Natural Holdings, are expressly qualified by these cautionary statements. Any forward-looking statement speaks only as of the date on which such statement is made, and NW Natural Holdings undertakes no obligation to publicly update any forward-looking statement, whether as a result of new information, future developments or otherwise, except as may be required by law.

New factors emerge from time to time and it is not possible for NW Natural Holdings to predict all such factors, nor can it assess the impact of each such factor or the extent to which any factor, or combination of factors, may cause results to differ materially from those contained in any forward-looking statements.


Contacts

Business Development Contact: Nicholas Whitley, 832-714-1732, This email address is being protected from spambots. You need JavaScript enabled to view it.
Investor Contact: Nikki Sparley, 503-721-2530, This email address is being protected from spambots. You need JavaScript enabled to view it.
Media Contact: David Roy, 503-610-7157, This email address is being protected from spambots. You need JavaScript enabled to view it.

WAKEFIELD, Mass.--(BUSINESS WIRE)--TÜV SÜD, a leading global technical service provider, is pleased to announce the appointment of Dr. Fabian Schober as the new CEO of TÜV SÜD in Americas, effective immediately.


Dr. Schober brings a wealth of experience and expertise to this role, having held several senior leadership positions within TÜV SÜD since 2008. After starting in Corporate M&A, he served as the CFO of TÜV SÜD Rail and then the CFO of the Real Estate & Infrastructure division. In January 2017, Dr. Schober assumed the role of CFO of the Americas region, where he has been highly successful. Dr. Schober has a PhD from the University of St. Gallen and completed the General Management Program at the Harvard School of Business.

TÜV SÜD is confident that Dr. Schober's leadership and expertise will be instrumental in driving the company's growth and success in the Americas. He will be based in the company's regional headquarters in Wakefield, MA.

"We are thrilled to welcome Dr. Schober to this new role at TÜV SÜD," said Ishan Palit, Global COO and Member of the Board of Management at TÜV SÜD. "His proven track record in the region and deep experience in the industry make him the ideal leader to drive our growth and success in this important market."

Founded in 1866 as a steam boiler inspection association, the TÜV SÜD Group has evolved into a global enterprise. More than 25,000 employees work at over 1,000 locations in about 50 countries to continually improve technology, systems and expertise. They contribute significantly to making technical innovations such as Industry 4.0, autonomous driving and renewable energy safety and reliability. http://www.tuvsud.com/en-us


Contacts

Media Relations:
Jim Regan
TÜV SÜD America Inc.
401 Edgewater Drive, Suite 500
Wakefield, MA 01880
Phone: +1 339 235-6844
Email: This email address is being protected from spambots. You need JavaScript enabled to view it.
Website: https://www.tuvsud.com/en-us

Fourth quarter results:


  • Record net sales of $5.6 billion, up 15% YOY
    • Organic sales growth of 14% YOY and up 4% sequentially
  • Operating profit of $382 million; operating margin of 6.9%
    • Adjusted EBITDA of $451 million, up 41% YOY; adjusted EBITDA margin of 8.1%, up 150 basis points YOY
    • Gross margin of 21.9%, up 110 basis points YOY
  • Earnings per diluted share of $3.90
    • Adjusted earnings per diluted share of $4.13, up 30% YOY
  • Record operating cash flow of $422 million
    • Record free cash flow of $399 million; 173% of adjusted net income
  • Rahi Systems acquisition closed on November 1, 2022

Full year results:

  • Record net sales of $21.4 billion, up 18% YOY
    • Organic sales growth of 18% YOY
  • Record operating profit of $1.4 billion; operating margin of 6.7%
    • Record adjusted EBITDA of $1.7 billion, up 47% YOY; record adjusted EBITDA margin of 8.1%, up 160 basis points YOY
    • Record gross margin of 21.8%, up 100 basis points YOY
  • Record earnings per diluted share of $15.33
    • Record adjusted earnings per diluted share of $16.42, up 65% YOY
  • Leverage of 2.9x; improvement of 1.0x versus prior year-end and 2.8x since the Anixter merger

PITTSBURGH--(BUSINESS WIRE)--Wesco International (NYSE: WCC), a leading provider of business-to-business distribution, logistics services and supply chain solutions, announces its results for the fourth quarter and full year 2022.

Wesco delivered a stellar encore performance for the full year 2022 including exceptional fourth quarter results, clearly demonstrating our ability to drive sustained growth and market outperformance. The success of our business model and integration efforts over the past two and a half years since our transformational combination with Anixter resulted in record full year sales of $21.4 billion, an increase of 18% over last year. We again set new company records for margin and profitability, and reduced leverage to below 3.0x for the first time since 2019. With this trajectory, we have taken a significant step forward in the achievement of our long-term target of 10%+ EBITDA margin. I am confident 2023 will be another transformational year with additional advances in our digital capabilities, strong topline growth, continued margin expansion and record free cash generation to support our capital allocation priorities,” said John Engel, Chairman, President and CEO.

Mr. Engel continued, “Strong seasonal fourth-quarter growth was driven by secular demand trends, continued share gains and the start of supply chain pressures easing. We meaningfully reduced net working capital while delivering stronger than anticipated topline growth in the fourth quarter, and generated record quarterly free cash flow of approximately $400 million.”

Mr. Engel added, “Each of our strategic business units again delivered strong double-digit organic sales and profit growth underscoring the success of our enterprise-wide cross selling and margin improvement programs. The fourth-quarter performance of our latest acquisition, Rahi Systems, builds on our data center solutions strategy and better positions us to capture value from this important secular-growth market. Our profitable execution across all three business units supports our investment in Wesco’s digital transformation positioning us to deliver an even higher level of performance, operating efficiency and customer loyalty.”

Mr. Engel concluded, “We are building on our strong positive momentum and 2023 is off to an excellent start. Our three-year post-merger integration plan is coming to a close. Our digital transformation plan is accelerating, and we are on-track to deliver advanced digital capabilities that will create superior value for our customers and supplier partners. We are confident in our ability to drive mid- to high-single digit sales growth this year, along with continued EBITDA margin expansion and approximately $600 to $800 million in free cash flow generation that supports our growth initiatives and capital allocation priorities. Most importantly, our dedicated team of colleagues continues to provide resilient and critical supply chain solutions for our customers around the world, capturing the benefits of our exposure to sustainable secular trends that are deep and drive our future sales and profitability. We look forward with greater confidence than ever to a future of sustained growth and market outperformance.”

The following are results for the three months ended December 31, 2022 compared to the three months ended December 31, 2021:

  • Net sales were $5.6 billion for the fourth quarter of 2022 compared to $4.9 billion for the fourth quarter of 2021, an increase of 14.6%, reflecting price inflation and volume growth, secular demand trends, execution of our cross-sell program, and moderate easing of supply chain constraints. Organic sales for the fourth quarter of 2022 grew 14.4% as the acquisition of Rahi Systems on November 1, 2022 positively impacted reported net sales by 2.3%, while fluctuations in foreign exchange rates negatively impacted reported net sales by 2.1%. Sequentially, net sales grew 2.1% while organic sales increased 3.7%. The acquisition of Rahi Systems positively impacted reported net sales by 2.1%, while the number of workdays and fluctuations in foreign exchange rate changes negatively impacted reported net sales by 3.1% and 0.6%, respectively. Backlog at the end of the fourth quarter of 2022 increased by more than 40% compared to the end of 2021. Sequentially, backlog declined slightly by approximately 1% following seven consecutive quarters of strong growth.
  • Cost of goods sold for the fourth quarter of 2022 was $4.3 billion compared to $3.8 billion for the fourth quarter of 2021, and gross profit was $1.2 billion and $1.0 billion, respectively. As a percentage of net sales, gross profit was 21.9% and 20.8% for the fourth quarter of 2022 and 2021, respectively. Gross profit as a percentage of net sales for the fourth quarter of 2022 reflects our focus on value-driven pricing and pass-through of inflationary costs, along with the continued momentum of our gross margin improvement program and higher supplier volume rebates as a percentage of net sales. Cost of goods sold for the fourth quarter of 2021 included a write-down to the carrying value of certain personal protective equipment inventories that unfavorably impacted gross profit as a percentage of net sales by approximately 12 basis points.
  • Selling, general and administrative (“SG&A”) expenses were $793.1 million, or 14.3% of net sales, for the fourth quarter of 2022 compared to $733.7 million, or 15.1% of net sales, for the fourth quarter of 2021. SG&A expenses for the fourth quarter of 2022 and 2021 include merger-related and integration costs of $15.2 million and $38.7 million, respectively. Adjusted for these amounts, SG&A expenses were $777.9 million, or 14.0% of net sales, for the fourth quarter of 2022 and $695.0 million, or 14.3% of net sales, for the fourth quarter of 2021. Adjusted SG&A expenses for the fourth quarter of 2022 reflect higher salaries due to wage inflation and increased headcount, an increase in commissions and volume-related costs driven by significant sales growth, as well as the impact of the Rahi Systems acquisition. In addition, digital transformation initiatives contributed to higher expenses in the fourth quarter of 2022, including those related to professional and consulting fees. These increases were partially offset by the realization of integration cost synergies and a reduction to incentive compensation expense.
  • Depreciation and amortization for the fourth quarter of 2022 was $43.4 million compared to $53.9 million for the fourth quarter of 2021, a decrease of $10.5 million. In connection with an integration initiative to review the Company's brand strategy, certain legacy trademarks are migrating to a master brand architecture, which resulted in $0.4 million and $11.8 million of accelerated amortization expense for the fourth quarter of 2022 and 2021, respectively.
  • Operating profit was $381.8 million for the fourth quarter of 2022 compared to $220.3 million for the fourth quarter of 2021, an increase of $161.5 million, or 73.3%. Operating profit as a percentage of net sales was 6.9% for the current quarter, compared to 4.5% for the fourth quarter of the prior year. Adjusted for the merger-related and integration costs, and accelerated trademark amortization described above, operating profit was $397.4 million, or 7.1% of net sales, for the fourth quarter of 2022 and $270.8 million, or 5.6% of net sales, for the fourth quarter of 2021. Adjusted operating margin was up 150 basis points compared to the prior year.
  • Net interest expense for the fourth quarter of 2022 was $87.3 million compared to $60.4 million for the fourth quarter of 2021. The increase reflects higher borrowings and an increase in variable interest rates.
  • The effective tax rate for the fourth quarter of 2022 was 24.6% compared to 15.7% for the fourth quarter of 2021. The effective tax rate for the fourth quarter of the prior year was favorably impacted by a reduction in the valuation allowance recorded against certain foreign tax credit carryforwards, as well as higher tax benefits related to intercompany financing and certain foreign derived intangible income.
  • Net income attributable to common stockholders was $204.6 million for the fourth quarter of 2022 compared to $153.1 million for the fourth quarter of 2021. Adjusted for merger-related and integration costs, accelerated trademark amortization expense, and the related income tax effects, net income attributable to common stockholders was $216.3 million for the fourth quarter of 2022. Adjusted for merger-related and integration costs, accelerated trademark amortization expense, a $36.6 million curtailment gain resulting from the remeasurement of the Company's pension obligations in the U.S. and Canada due to amending certain terms of such defined benefit plans, and the related income tax effects, net income attributable to common stockholders was $165.7 million for the fourth quarter of 2021. Adjusted net income attributable to common stockholders increased 30.5% year-over-year.
  • Earnings per diluted share for the fourth quarter of 2022 was $3.90, based on 52.4 million diluted shares, compared to $2.93 for the fourth quarter of 2021, based on 52.3 million diluted shares. Adjusted for merger-related and integration costs, accelerated trademark amortization expense, and the related income tax effects, earnings per diluted share for the fourth quarter of 2022 was $4.13. Adjusted for merger-related and integration costs, accelerated trademark amortization expense, curtailment gain, and the related income tax effects, earnings per diluted share for the fourth quarter of 2021 was $3.17. Adjusted earnings per diluted share increased 30.3% year-over-year, including a positive impact from the Rahi acquisition completed during the quarter.
  • Operating cash flow for the fourth quarter of 2022 was an inflow of $421.7 million compared to an outflow of $105.5 million for the fourth quarter of 2021. Free cash flow for the fourth quarter of 2022 was $398.7 million, or 172.7% of adjusted net income, reflecting a significant reduction in working capital including a decrease in inventories of $69.3 million from the end of the third quarter of 2022. An increase in accounts payable of $73.3 million and a decrease in trade accounts receivable of $47.1 million also contributed to the strong free cash flow performance for the fourth quarter of 2022. Additionally, the Company repurchased $11.1 million of its common stock shares during the fourth quarter of 2022.

The following are results for the year ended December 31, 2022 compared to the year ended December 31, 2021:

  • Net sales were $21.4 billion for 2022 compared to $18.2 billion for 2021, an increase of 17.6% reflecting price inflation and volume growth, secular demand trends, and execution of our cross-sell program. Organic sales for 2022 grew 18.2% as the acquisition of Rahi Systems in the fourth quarter of 2022, offset by the divestiture of Wesco's legacy utility and data communications businesses in Canada in the first quarter of 2021, positively impacted reported net sales by 0.5%. Additionally, the number of workdays positively impacted reported net sales by 0.4%, while fluctuations in foreign exchange rates negatively impacted reported net sales by 1.5%.
  • Cost of goods sold for 2022 was $16.8 billion compared to $14.4 billion for 2021, and gross profit was $4.7 billion and $3.8 billion, respectively. As a percentage of net sales, gross profit was 21.8% and 20.8% for 2022 and 2021, respectively. Gross profit as a percentage of net sales for 2022 reflects our focus on value-driven pricing and pass-through of inflationary costs, along with the continued momentum of our gross margin improvement program and higher supplier volume rebates as a percentage of net sales. Cost of goods sold for 2021 included a write-down to the carrying value of certain personal protective equipment inventories that unfavorably impacted gross profit as a percentage of net sales by approximately 14 basis points.
  • SG&A expenses for 2022 were $3.0 billion, or 14.2% of net sales, compared to $2.8 billion for 2021, or 15.3% of net sales. SG&A expenses for 2022 include merger-related and integration costs of $67.4 million. Adjusted for this amount, SG&A expenses for 2022 were 13.9% of net sales and reflect higher salaries due to wage inflation and increased headcount, as well as an increase in commissions and volume-related costs driven by significant sales growth. In addition, digital transformation initiatives contributed to higher expenses in 2022, including those related to professional and consulting fees. These increases were partially offset by the realization of integration cost synergies and a reduction to incentive compensation expense. SG&A expenses for 2021 include merger-related and integration costs of $158.5 million, as well as a net gain of $8.9 million resulting from the Canadian divestitures described above. Adjusted for these amounts, SG&A expenses were 14.5% of net sales for 2021.
  • Depreciation and amortization for 2022 was $179.0 million compared to $198.6 million for 2021, a decrease of $19.6 million. In connection with an integration initiative to review the Company's brand strategy, certain legacy trademarks are migrating to a master brand architecture, which resulted in $9.8 million and $32.0 million of accelerated amortization expense for 2022 and 2021, respectively.
  • Operating profit was $1.4 billion for 2022 compared to $0.8 billion for 2021, an increase of $636.2 million, or 79.3%. Operating profit as a percentage of net sales was 6.7% for the current year, compared to 4.4% for the prior year. Operating profit for 2022 includes the merger-related and integration costs, and accelerated trademark amortization expense described above. Adjusted for these amounts, operating profit was 7.1% of net sales. For 2021, operating profit was 5.4% as adjusted for merger-related and integration costs of $158.5 million, accelerated trademark amortization expense of $32.0 million, and the net gain on the Canadian divestitures of $8.9 million. Adjusted operating margin was up 170 basis points compared to the prior year.
  • Net interest expense for 2022 was $294.4 million compared to $268.1 million for 2021. The increase reflects higher borrowings and an increase in variable interest rates.
  • The effective tax rate for 2022 was 24.2% compared to 19.9% for 2021. The effective tax rates for both the current year and the prior year were favorably impacted by the tax benefits related to intercompany financing and reductions in the valuation allowance recorded against certain foreign tax credit carryforwards. The higher effective tax rate in the current year is primarily due to lower tax benefits from intercompany financing arrangements resulting from changes in Canadian tax law and certain foreign derived intangible income.
  • Net income attributable to common stockholders was $803.1 million for 2022 compared to $408.0 million for 2021. Adjusted for merger-related and integration costs, accelerated trademark amortization expense, and the related income tax effects, net income attributable to common stockholders was $860.1 million for 2022. Adjusted for merger-related and integration costs, accelerated trademark amortization expense, net gain on Canadian divestitures, a $36.6 million curtailment gain, and the related income tax effects, net income attributable to common stockholders was $519.3 million for 2021. Adjusted net income attributable to common stockholders increased 65.6% year-over-year.
  • Earnings per diluted share for 2022 was $15.33, based on 52.4 million diluted shares, compared to $7.84 for 2021, based on 52.0 million diluted shares. Adjusted for merger-related and integration costs, accelerated trademark amortization expense, and the related income tax effects, earnings per diluted share for 2022 was $16.42. Adjusted for merger-related and integration costs, accelerated trademark amortization expense, net gain on divestitures, curtailment gain, and the related income tax effects, earnings per diluted share for 2021 was $9.98. Adjusted earnings per diluted share increased 64.5% year-over-year.
  • Operating cash flow for 2022 was $11.0 million compared to $67.1 million for 2021. Operating cash flow for the current year was lower than the prior year primarily due to changes in working capital, including an increase in inventories of $817.0 million and an increase in trade accounts receivable of $690.6 million. The increase in inventories resulted from investments to address supply chain challenges and to support growth in our sales backlog, including project-based business. The increase in trade accounts receivable was due to significant sales growth. These outflows were partially offset by an increase in accounts payable of $552.9 million.

Segment Results

The Company has operating segments comprising three strategic business units consisting of Electrical & Electronic Solutions ("EES"), Communications & Security Solutions ("CSS") and Utility & Broadband Solutions ("UBS").

The Company incurs corporate costs primarily related to treasury, tax, information technology, legal and other centralized functions. Segment results include depreciation expense or other allocations related to various corporate assets. Interest expense and other non-operating items are either not allocated to the segments or reviewed on a segment basis. Corporate expenses not directly identifiable with our reportable segments are reported in the tables below to reconcile the reportable segments to the consolidated financial statements.

The following are results by segment for the three months ended December 31, 2022 compared to the three months ended December 31, 2021:

  • EES reported net sales of $2.2 billion for the fourth quarter of 2022 compared to $2.0 billion for the fourth quarter of 2021, an increase of 8.7%. Organic sales for the fourth quarter of 2022 grew 11.3% as fluctuations in foreign exchange rates negatively impacted reported net sales by 2.6%. Sequentially, reported net sales declined 3.0%. Adjusted for the negative effect of fluctuations in foreign exchange rates and the number of workdays, organic sales increased 1.0%. The increase in organic sales compared to the prior year quarter reflects price inflation and growth in our construction, industrial and original equipment manufacturer businesses. EBITDA, adjusted for other non-operating expense and non-cash stock-based compensation expense, was $197.6 million for the fourth quarter of 2022, or 9.1% of net sales, compared to $150.6 million for the fourth quarter of 2021, or 7.5% of net sales. Adjusted EBITDA increased $47.0 million, or 31.3% year-over-year. The increase primarily reflects the factors impacting the overall business, as described above.
  • CSS reported net sales of $1.8 billion for the fourth quarter of 2022 compared to $1.5 billion for the fourth quarter of 2021, an increase of 16.4%. Organic sales for the fourth quarter of 2022 grew 11.7% as the acquisition of Rahi Systems on November 1, 2022 positively impacted reported net sales by 7.4%, while fluctuations in foreign exchange rates negatively impacted reported net sales by 2.7%. Sequentially, reported net sales grew 10.0% and organic sales increased 6.7%. The increase in organic sales compared to the prior year quarter reflects price inflation, growth in our security solutions and network infrastructure businesses, as well as the benefits of cross selling and some improvements in supply chain constraints. EBITDA, adjusted for other non-operating income and non-cash stock-based compensation expense, was $169.5 million for the fourth quarter of 2022, or 9.6% of net sales, compared to $125.3 million for the fourth quarter of 2021, or 8.3% of net sales. Adjusted EBITDA increased $44.2 million, or 35.3% year-over-year. The increase primarily reflects the factors impacting the overall business, as described above. Adjusted EBITDA as a percentage of net sales for the fourth quarter of 2021 was negatively impacted by 28 basis points from the inventory write-down described in the Company's overall results above.
  • UBS reported net sales of $1.6 billion for the fourth quarter of 2022 compared to $1.3 billion for the fourth quarter of 2021, an increase of 21.2%. Organic sales for the fourth quarter of 2022 grew 22.2% as fluctuations in foreign exchange rates negatively impacted reported net sales by 1.0%. Sequentially, reported net sales grew 1.2% and organic sales increased 4.6%. The increase in organic sales compared to the prior year quarter reflects price inflation, broad-based growth driven by investments in electrification, green energy, utility grid modernization and hardening, rural broadband development, as well as the benefits of cross selling and expansion in our integrated supply business. EBITDA, adjusted for other non-operating income and non-cash stock-based compensation expense, was $185.6 million for the fourth quarter of 2022, or 11.4% of net sales, compared to $129.3 million for the fourth quarter of 2021, or 9.6% of net sales. Adjusted EBITDA increased $56.3 million, or 43.5% year-over-year. The increase primarily reflects the factors impacting the overall business, as described above.

The following are results by segment for the year ended December 31, 2022 compared to the year ended December 31, 2021:

  • EES reported net sales of $8.8 billion for 2022 compared to $7.6 billion for 2021, an increase of 15.8%. Organic sales for 2022 grew 17.3% as the number of workdays positively impacted reported net sales by 0.4%, while fluctuations in foreign exchange rates and the Canadian divestitures described in the Company's overall results above negatively impacted reported net sales by 1.8% and 0.1%, respectively. The year-over-year increase in organic sales reflects price inflation, growth in our industrial, construction, and original equipment manufacturer businesses, as well as the benefits of cross selling and secular growth trends. Additionally, supply chain constraints have had a negative impact on sales in both 2022 and 2021, however, these pressures have begun to moderate. EBITDA, adjusted for other non-operating income and non-cash stock-based compensation expense, was $851.3 million for 2022, or 9.

Contacts

Investor Relations
Will Ruthrauff
Director, Investor Relations
484-885-5648

Corporate Communications
Jennifer Sniderman
Senior Director, Corporate Communications
717-579-6603


Read full story here

LUGANO, Switzerland & WESTLAKE VILLAGE, Calif.--(BUSINESS WIRE)--Energy Vault Holdings, Inc. (NYSE: NRGV) (“Energy Vault” or the “Company”), a leader in sustainable grid-scale energy storage solutions, announced today that the Company will release its earnings results for the fourth quarter and full year ended December 31, 2022 on Tuesday, March 7, 2023 followed by a conference call at 4:30 PM ET.

Participants may access the call at 1-877-704-4453, international callers may use 1-201-389-0920, and request to join the Energy Vault Holdings earnings call. A live webcast will also be available at https://investors.energyvault.com/events-and-presentations/events.

A telephonic replay of the call will be available shortly after the conclusion of the call and until March 21, 2023. Participants may access the replay at 1-844-512-2921, international callers may use 1-412-317-6671 and enter access code 13735828. An archived replay of the call will also be available on the investors portion of the Energy Vault website at https://investors.energyvault.com/.

About Energy Vault

Energy Vault® develops and deploys utility-scale energy storage solutions designed to transform the world's approach to sustainable energy storage. The company's comprehensive offerings include proprietary gravity-based storage, battery storage, and green hydrogen energy storage technologies. Each storage solution is supported by the Company’s hardware technology-agnostic energy management system software and integration platform. Unique to the industry, Energy Vault’s innovative technology portfolio delivers customized short and long duration energy storage solutions to help utilities, independent power producers, and large industrial energy users significantly reduce levelized energy costs while maintaining power reliability. Utilizing eco-friendly materials with the ability to integrate waste materials for beneficial reuse, Energy Vault’s EVx™ gravity-based energy storage technology is facilitating the shift to a circular economy while accelerating the global clean energy transition for its customers. Please visit www.energyvault.com for more information.


Contacts

Investors:
This email address is being protected from spambots. You need JavaScript enabled to view it.

Media:
This email address is being protected from spambots. You need JavaScript enabled to view it.

HAMILTON, Bermuda--(BUSINESS WIRE)--February 14, 2023 – Triton International Limited (NYSE: TRTN) ("Triton")


Highlights:

  • Net income attributable to common shareholders for the fourth quarter of 2022 was $152.2 million or $2.61 per diluted share, a decrease of 2.2% from the fourth quarter of 2021 and a decrease of 9.4% from the third quarter of 2022.
  • Adjusted net income for the fourth quarter of 2022 was $160.7 million or $2.76 per diluted share, an increase of 3.4% from the fourth quarter of 2021 and a decrease of 4.2% from the third quarter of 2022.
  • Net income attributable to common shareholders was $694.8 million for the full year of 2022, or $11.19 per diluted share, an increase of 55.0% from 2021.
  • Adjusted net income was $702.8 million for the full year of 2022, or $11.32 per diluted share, an increase of 23.6% from 2021. Adjusted return on equity was 28.4% in 2022.
  • Utilization averaged 98.4% in the fourth quarter of 2022 and was 97.6% as of February 8, 2023.
  • Triton repurchased 2.8 million common shares during the fourth quarter and 9.1 million common shares during 2022. An additional 0.6 million common shares were repurchased through February 8, 2023.

Financial Results

The following table summarizes Triton’s selected key financial information for the three and twelve months ended December 31, 2022 and December 31, 2021 and the three months ended September 30, 2022.


(in millions, except per share data)


Three Months Ended,


Twelve Months Ended,


December 31,
2022


September 30,
2022


December 31,
2021


December 31,
2022


December 31,
2021

Total leasing revenues

$416.3


$424.7


$417.2


$1,679.7


$1,533.9


GAAP


Net income attributable to common shareholders

$152.2


$176.8


$177.4


$694.8


$484.5

Net income per share - Diluted

$2.61


$2.88


$2.67


$11.19


$7.22


Non-GAAP (1)


Adjusted net income

$160.7


$176.5


$177.5


$702.8


$614.2

Adjusted net income per share - Diluted

$2.76


$2.88


$2.67


$11.32


$9.16


Adjusted return on equity (2)

25.4 %


27.5 %


30.7 %


28.4 %


28.1 %

(1)

Refer to the "Use of Non-GAAP Financial Items" and "Non-GAAP Reconciliations of Adjusted Net Income" set forth below.

(2)

Refer to the “Calculation of Adjusted Return on Equity” set forth below.

Operating Performance

"Triton's results in the fourth quarter of 2022 provided a strong finish to an outstanding year," commented Brian Sondey, Chief Executive Officer of Triton. "In the fourth quarter, Triton generated $2.76 of Adjusted net income per share and achieved an annualized Adjusted return on equity over 25%. Triton's results in the fourth quarter included $4.8 million of gains from lease buyout transactions and a $3.0 million benefit from previously taken credit provisions. In total, these items added $0.13 to our Adjusted net income per share. For the full year of 2022, Triton generated $11.32 of Adjusted net income per share and achieved an Adjusted return on equity of 28.4%."

"Triton's outstanding performance reflects durable enhancements we have made to our business. In 2020 and 2021, Triton capitalized on very strong market conditions to drive rapid growth in our container fleet and to significantly extend the average duration of our lease portfolio. We were also able to take advantage of very low interest rates as well as our upgrade to an investment grade debt rating to refinance most of our debt portfolio, locking in low-cost long-term financing."

"Global trade volumes decreased in 2022 due to a variety of global economic and geopolitical challenges and as consumers shifted spending back to services. Logistical bottlenecks also eased in 2022, leading to improved container turn times. As a result, most of our customers shifted from aggressive container fleet expansion to fleet reductions. While Triton's operating metrics faced pressure in 2022, our performance remained strong. Our utilization averaged 99.1% in 2022, and currently stands at 97.6%."

"Triton continued to generate strong cash flow in 2022, reflecting the power and stability of our business model. We also demonstrated our ability to use our cash flow to drive shareholder value across a wide range of market environments as we shifted our investment focus from rapid fleet growth to aggressive share repurchases. We repurchased 9.1 million shares in 2022 for prices that we believe are compelling, leading to a 13.8% reduction in our outstanding shares while also decreasing leverage."

Outlook

Mr. Sondey continued, "We expect our utilization will continue to gradually trend down as long as market conditions remain challenging, but we expect our operating and financial performance will remain strong. The first quarter is typically the slow season for dry containers and has the fewest number of days. In addition, we expect used container sale prices and our disposal gains will begin to decrease more quickly. Our financial results will also not have the benefit of the transactions that added $0.13 to our Adjusted net income per share in the fourth quarter. As a result, we expect our Adjusted net income per share will decrease from the fourth quarter of 2022 to the first quarter of 2023."

"The trajectory of our performance after the first quarter will depend on how market conditions evolve. The outlook for global economic conditions is uncertain, but our fleet remains well protected by our lease portfolio, and container supply and demand usually rebalance quickly due to the short order cycle for containers and the steady disposal of older assets. We also expect to continue to use our strong cash flow to reduce our share count further, and we have historically been successful in putting equipment back on hire quickly when market conditions improve. As a result, we expect to maintain a high level of operating and financial performance throughout 2023, and expect our EPS trajectory will turn positive when market conditions stabilize and recover."

Common and Preferred Share Dividends

Triton’s Board of Directors has declared a quarterly cash dividend of $0.70 per common share, payable on March 24, 2023 to shareholders of record at the close of business on March 10, 2023.

The Company's Board of Directors also declared a cash dividend payable on March 15, 2023 to holders of record at the close of business on March 8, 2023 on Triton's issued and outstanding preferred shares as follows:

Preferred Share Series


Dividend Rate


Dividend Per Share

Series A Preferred Shares (NYSE:TRTNPRA)


8.500%


$0.5312500

Series B Preferred Shares (NYSE:TRTNPRB)


8.000%


$0.5000000

Series C Preferred Shares (NYSE:TRTNPRC)


7.375%


$0.4609375

Series D Preferred Shares (NYSE:TRTNPRD)


6.875%


$0.4296875

Series E Preferred Shares (NYSE:TRTNPRE)


5.750%


$0.3593750

Fourth Quarter 2022 Investor Webcast

Triton will hold a Webcast at 8:30 a.m. (New York time) on Tuesday, February 14, 2023 to discuss its fourth quarter results. To listen by phone, please dial 1-877-418-5277 (domestic) or 1-412-717-9592 (international) approximately 15 minutes prior to the start time and reference the Triton International Limited conference call. To access the live Webcast please visit Triton's website at http://www.trtn.com. An archive of the Webcast will be available one hour after the live call.

About Triton International Limited

Triton International Limited is the world’s largest lessor of intermodal freight containers. With a container fleet of over 7 million twenty-foot equivalent units ("TEU"), Triton’s global operations include acquisition, leasing, re-leasing and subsequent sale of multiple types of intermodal containers and chassis.

Utilization, Fleet, and Leasing Revenue Information

The following table summarizes the equipment fleet utilization for the periods indicated:


Quarter Ended


December 31, 2022


September 30, 2022


June 30, 2022


March 31, 2022

Average Utilization (1)

98.4 %


99.1 %


99.4 %


99.6 %

Ending Utilization (1)

98.1 %


98.8 %


99.3 %


99.5 %

(1)

Utilization is computed by dividing total units on lease (in CEU) by the total units in our fleet (in CEU), excluding new units not yet leased and off-hire units designated for sale.

The following table summarizes the equipment fleet as of December 31, 2022, September 30, 2022, and December 31, 2021 (in units, TEUs and CEUs):


Equipment Fleet in Units


Equipment Fleet in TEU


December 31, 2022


September 30, 2022


December 31, 2021


December 31, 2022


September 30, 2022


December 31, 2021

Dry

3,784,386


3,833,065


3,843,719


6,458,705


6,540,720


6,531,816

Refrigerated

227,628


229,839


235,338


442,489


446,678


457,172

Special

92,379


91,949


92,411


169,290


168,441


169,004

Tank

12,000


11,911


11,692


12,000


11,911


11,692

Chassis

27,937


25,823


24,139


52,744


48,615


44,554

Equipment leasing fleet

4,144,330


4,192,587


4,207,299


7,135,228


7,216,365


7,214,238

Equipment trading fleet

48,328


47,696


53,204


79,102


77,755


83,692

Total

4,192,658


4,240,283


4,260,503


7,214,330


7,294,120


7,297,930


Equipment in CEU(1)


December 31, 2022


September 30, 2022


December 31, 2021

Operating leases

7,147,332


7,210,150


7,291,769

Finance leases

662,822


676,310


623,136

Equipment trading fleet

75,697


73,529


81,136

Total

7,885,851


7,959,989


7,996,041

(1)

In the equipment fleet tables above, we have included total fleet count information based on CEU. CEU is a ratio used to convert the actual number of containers in our fleet to a figure based on the relative purchase prices of our various equipment types to that of a 20-foot dry container. For example, the CEU ratio for a 40-foot high cube dry container is 1.70, and a 40-foot high cube refrigerated container is 7.50. These factors may differ slightly from CEU ratios used by others in the industry.

The following table provides a summary of our equipment lease portfolio by lease type, based on CEU and net book value, as of December 31, 2022:

Lease Portfolio


By CEU


By Net Book Value

Long-term leases


72.4 %


72.8 %

Finance leases


9.0


15.4

Subtotal


81.4


88.2

Service leases


6.7


4.2

Expired long-term leases, non-sale age (units on hire)


6.8


5.0

Expired long-term leases, sale-age (units on hire)


5.1


2.6

Total


100.0 %


100.0 %

The following table summarizes our leasing revenue for the periods indicated (in thousands):


Three Months Ended,


December 31, 2022


September 30, 2022


December 31, 2021

Operating leases


Per diem revenues

$ 369,837


$ 379,623


$ 383,529

Fee and ancillary revenues

18,213


15,777


11,092

Total operating lease revenues

388,050


395,400


394,621

Finance leases

28,257


29,283


22,541

Total leasing revenues

$ 416,307


$ 424,683


$ 417,162

Share Repurchase Information

The following table provides information with respect to our purchases of the Company's common shares for the periods indicated:


Total Number of Shares Purchased


Average Price Paid per Share

July 1, 2021 through September 30, 2021


378,765


$ 51.19

October 1, 2021 through December 31, 2021


1,149,408


$ 57.52

2021 Total


1,528,173


$ 55.95


January 1, 2022 through March 31, 2022


1,257,374


$ 63.74

April 1, 2022 through June 30, 2022


1,832,240


$ 60.04

July 1, 2022 through September 30, 2022


3,200,340


$ 59.21

October 1, 2022 through December 31, 2022


2,775,332


$ 63.19

2022 Total


9,065,286


$ 61.22


January 1, 2023 through February 8, 2023


583,343


$ 70.74


Total


11,176,802


$ 61.00

Important Cautionary Information Regarding Forward-Looking Statements

Certain statements in this release, other than purely historical information, are "forward-looking statements" within the meaning of the Private Securities Litigation Reform Act of 1995, Section 27A of the Securities Act of 1933, as amended, and Section 21E of the Securities Exchange Act of 1934, as amended. These forward-looking statements include, among others, statements relating to Triton's future financial and operating performance and key drivers thereof; anticipated trends in the market and industry; future capital expenditures, including anticipated payments of dividends and amount, manner and timing of share repurchases under the share repurchase authorization; and other statements regarding prospects and business strategies. Statements that include the words "expect," "intend," "plan," "seek," "believe," "project," "predict," "anticipate," "potential," "will," "may," "would" and similar statements of a future or forward-looking nature may be used to identify forward-looking statements. All forward-looking statements address matters that involve risks and uncertainties, many of which are beyond Triton's control. Accordingly, there are or will be important factors that could cause actual results to differ materially from those indicated in such statements and, therefore, you should not place undue reliance on any such statements.

These factors include, without limitation, economic, business, competitive, market and regulatory conditions and the following: decreases in the demand for leased containers; decreases in market leasing rates for containers; difficulties in re-leasing containers after their initial fixed-term leases; our customers' decisions to buy rather than lease containers; increases in the cost of repairing and storing our off-hire containers; our dependence on a limited number of customers and suppliers; customer defaults; decreases in the selling prices of used containers; the impact of COVID-19 or future global pandemics on our business and financial results; risks resulting from the political and economic policies of the United States and other countries, particularly China, including but not limited to, the impact of trade wars, duties, tariffs or geo-political conflict; risks stemming from the international nature of our business, including global and regional economic conditions, including inflation and attempts to control inflation, and geopolitical risks such as the ongoing war in Ukraine; extensive competition in the container leasing industry; decreases in demand for international trade; disruption to our operations from failures of, or attacks on, our information technology systems; disruption to our operations as a result of natural disasters; compliance with laws and regulations related to economic and trade sanctions, security, anti-terrorism, environmental protection and anti-corruption; the availability and cost of capital; restrictions imposed by the terms of our debt agreements; changes in tax laws in Bermuda, the United States and other countries; and other risks and uncertainties, including those risk factors set forth in the section entitled "Risk Factors" in our Form 10-K filed with the Securities and Exchange Commission ("SEC") on February 15, 2022, and in any subsequent documents filed or to be filed with the SEC by Triton from time to time, including our Form 10-K for the year ended December 31, 2022, which we expect to file with the SEC on or about February 14, 2023.

The foregoing list of important factors should not be construed as exhaustive and should be read in conjunction with the other cautionary statements that are included herein and elsewhere. Any forward-looking statements made herein are qualified in their entirety by these cautionary statements. Except to the extent required by applicable law, we undertake no obligation to update publicly or revise any forward-looking statement, whether as a result of new information, future developments or otherwise.

-Financial Tables Follow-

TRITON INTERNATIONAL LIMITED

Consolidated Balance Sheets

(In thousands, except share data)


December 31, 2022


December 31, 2021

ASSETS:


Leasing equipment, net of accumulated depreciation of $4,289,259 and $3,919,181

$

9,530,396


$

10,201,113


Net investment in finance leases


1,639,831


1,558,290


Equipment held for sale


138,506


48,746


Revenue earning assets


11,308,733


11,808,149


Cash and cash equivalents


83,227


106,168


Restricted cash


103,082


124,370


Accounts receivable, net of allowances of $2,075 and $1,178


226,554


294,792


Goodwill


236,665


236,665


Lease intangibles, net of accumulated amortization of $291,837 and $281,340


6,620


17,117


Other assets


28,383


50,346


Fair value of derivative instruments


115,994


6,231


Total assets

$

12,109,258


$

12,643,838


LIABILITIES AND SHAREHOLDERS' EQUITY:


Equipment purchases payable

$

11,817


$

429,568


Fair value of derivative instruments


2,117


48,277


Deferred revenue


333,260


92,198


Accounts payable and other accrued expenses


71,253


70,557


Net deferred income tax liability


411,628


376,009


Debt, net of unamortized costs of $55,863 and $63,794


8,074,820


8,562,517


Total liabilities


8,904,895


9,579,126


Shareholders' equity:


Preferred shares, $0.01 par value, at liquidation preference


730,000


730,000


Common shares, $0.01 par value, 270,000,000 shares authorized, 81,383,024 and 81,295,366 shares issued, respectively


814


813


Undesignated shares, $0.01 par value, 800,000 shares authorized, no shares issued and outstanding


Treasury shares, at cost, 24,494,785 and 15,429,499 shares, respectively


(1,077,559

)


(522,360

)

Additional paid-in capital


909,911


904,224


Accumulated earnings


2,531,928


2,000,854


Accumulated other comprehensive income (loss)


109,269


(48,819

)

Total shareholders' equity


3,204,363


3,064,712


Total liabilities and shareholders' equity

$

12,109,258


$

12,643,838


TRITON INTERNATIONAL LIMITED

Consolidated Statements of Operations

(In thousands, except per share amounts)


Three Months Ended
December 31,


Twelve Months Ended
December 31,


2022


2021


2022


2021


Leasing revenues:


Operating leases

$

388,050


$

394,621


$

1,564,486


$

1,480,495


Finance leases


28,257


22,541


115,200


53,385


Total leasing revenues


416,307


417,162


1,679,686


1,533,880


Equipment trading revenues


20,860


39,423


147,874


142,969


Equipment trading expenses


(19,079

)


(33,354

)


(131,870

)


(108,870

)

Trading margin


1,781


6,069


16,004


34,099


Net gain on sale of leasing equipment


25,156


28,096


115,665


107,060


Operating expenses:


Depreciation and amortization


154,661


165,384


634,837


626,240


Direct operating expenses


18,238


5,614


42,381


26,860


Administrative expenses


23,996


23,993


93,011


89,319


Provision (reversal) for doubtful accounts


(2,998

)


(8

)


(3,102

)


(2,475

)

Total operating expenses


193,897


194,983


767,127


739,944


Operating income (loss)


249,347


256,344


1,044,228


935,095


Other expenses:


Interest and debt expense


59,798


52,669


226,091


222,024


Unrealized (gain) loss on derivative instruments, net


(23

)


(343

)


Debt termination expense


80


1,330


1,933


133,853


Other (income) expense, net


(41

)


(184

)


(1,182

)


(1,379

)

Total other expenses


59,814


53,815


226,499


354,498


Income (loss) before income taxes


189,533


202,529


817,729


580,597


Income tax expense (benefit)


24,325


12,076


70,807


50,357


Net income (loss)

$

165,208


$

190,453


$

746,922


$

530,240


Less: dividend on preferred shares


13,028


13,027


52,112


45,740


Net income (loss) attributable to common shareholders

$

152,180


$

177,426


$

694,810


$

484,500


Net income per common share—Basic

$

2.63


$

2.68


$

11.25


$

7.26


Net income per common share—Diluted

$

2.61


$

2.67


$

11.19


$

7.22


Cash dividends paid per common share

$

0.70


$

0.65


$

2.65


$

2.36


Weighted average number of common shares outstanding—Basic


57,820


66,113


61,778


66,728


Dilutive restricted shares


405


428


322


340


Weighted average number of common shares outstanding—Diluted


58,225


66,541


62,100


67,068


TRITON INTERNATIONAL LIMITED

Consolidated Statements of Cash Flows

(In thousands)


Twelve Months Ended December 31,


2022


2021


Cash flows from operating activities:


Net income (loss)

$

746,922


$

530,240


Adjustments to reconcile net income (loss) to net cash provided by operating activities:


Depreciation and amortization


634,837


626,240


Amortization of deferred debt cost and other debt related amortization


11,112


11,603


Lease related amortization


11,285


17,654


Share-based compensation expense


12,512


9,365


Net (gain) loss on sale of leasing equipment


(115,665

)


(107,060

)

Unrealized (gain) loss on derivative instruments


(343

)


Debt termination expense


1,933


133,853


Deferred income taxes


26,018


43,077


Changes in operating assets and liabilities:


Accounts receivable


44,119


(50,336

)

Deferred revenue


287,328


83,600


Accounts payable and other accrued expenses


4,620


(6,860

)

Net equipment sold (purchased) for resale activity


(93

)


7,606


Cash received (paid) for settlement of interest rate swaps


19,026


5,497


Cash collections on finance lease receivables, net of income earned


180,075


74,117


Other assets


21,182


26,568


Net cash provided by (used in) operating activities


1,884,868


1,405,164


Cash flows from investing activities:


Purchases of leasing equipment and investments in finance leases


(943,062

)


(3,434,394

)

Proceeds from sale of equipment, net of selling costs


296,737


217,078


Other


(638

)


(70

)

Net cash provided by (used in) investing activities


(646,963

)


(3,217,386

)

Cash flows from financing activities:


Issuance of preferred shares, net of underwriting discount


169,488


Purchases of treasury shares


(554,095

)


(82,528

)

Debt issuance costs


(10,162

)


(42,631

)

Borrowings under debt facilities


1,952,600


8,690,006


Payments under debt facilities and finance lease obligations


(2,449,367

)


(6,635,987

)

Dividends paid on preferred shares


(52,112

)


(45,321

)

Dividends paid on common shares


(162,174

)


(157,312

)

Other


(6,824

)


(4,951

)

Net cash provided by (used in) financing activities


(1,282,134

)


1,890,764


Net increase (decrease) in cash, cash equivalents and restricted cash

$

(44,229

)


$

78,542


Cash, cash equivalents and restricted cash, beginning of period


230,538


151,996


Cash, cash equivalents and restricted cash, end of period

$

186,309


$

230,538


Supplemental disclosures:


Interest paid

$

208,714


$

211,412


Income taxes paid (refunded)

$

47,010


$

7,933


Right-of-use asset for leased property

$

907


$

2,517


Supplemental non-cash investing activities:


Equipment purchases payable

$

11,817


$

429,568


Use of Non-GAAP Financial Items

We use the terms "Adjusted net income" and "Adjusted return on equity" throughout this press release.

Adjusted net income and Adjusted return on equity are not items presented in accordance with U.S. GAAP and should not be considered as alternatives to, or more meaningful than, amounts determined in accordance with U.S. GAAP, including net income.

Adjusted net income is adjusted for certain items management believes are not representative of our operating performance. Adjusted net income is defined as net income attributable to common shareholders excluding debt termination expenses net of tax, unrealized gains and losses on derivative instruments net of tax, and foreign and other income tax adjustments.

We believe that Adjusted net income is useful to an investor in evaluating our operating performance because this item:

  • is widely used by

Contacts

Andrew Kohl
Vice President
Corporate Strategy & Investor Relations
914-697-2900


Read full story here

HATBORO, Pa.--(BUSINESS WIRE)--Fluitron, a leading manufacturer of integrated hydrogen gas compression, storage, and dispensing systems, today announced the appointment of Charles (Chuck) Smith, as Plant Manager of its Hatboro, Pa. facility. Fluitron is a portfolio company of Ara Partners, a decarbonization-focused private equity firm.


Smith brings more than 30 years of plant operations and engineering experience to Fluitron, having previously held senior plant and product management roles at SP Industries, FAIST Light Metals, Mueller Water Products, Kaiser Aluminum and Emerson Process Management. He is a graduate of the U.S. Navy Nuclear Power School and holds both a B.S. in Workforce Education and Development from Southern Illinois University, Carbondale and an M.B.A. from Western Governor’s University.

"I'm extremely enthusiastic about the opportunities that lie ahead for Fluitron as it takes a leadership position in global decarbonization and continues working to strengthen the Hydrogen supply chain," said Smith. "Fluitron has a rich history and an enthusiastic workforce that is well-poised to accelerate productivity in this highly-dynamic stage of development of the global hydrogen industry."

Today’s announcement builds on the announcements of a number of recent innovations at Fluitron, including the introduction of a commercialized one (1) ton-per-day hydrogen gas processing system at 520 bar and the manufacturing, testing, installation and PESO (Petroleum and Explosives Safety Organization) approval for the first domestically-built hydrogen dispenser in India.

“We are delighted to have someone of Chuck’s caliber join the team at Fluitron,” said Fluitron President and CEO Linh Austin. “He is a recognized leader in the manufacturing space and will take our new state of the art manufacturing facility to new heights.”

About Fluitron
Fluitron is a global leader in precision technology for clean energy. With over 45 years of experience, Fluitron has grown to become a trusted partner for industrial gas compression technologies. Setting the bar in creating equipment that safely handles hydrogen and other specialized gases, Fluitron has the expertise to deliver the technology critical to your mission. For more information, www.fluitron.com.


Contacts

Media Contact:

Wilson Craig
Mindshare PR
+1 408-516-6182
This email address is being protected from spambots. You need JavaScript enabled to view it.

HOLLISTER, Calif.--(BUSINESS WIRE)--Yield Resource Management Group (Yield RMG) (formerly dba. LB Technologies), a privately held developer and manager of sustainable agriculture, water and energy projects, has announced a strategic investment by Galway Sustainable Capital (Galway). Galway’s investment facilitates Yield RMG’s acquisition of Central Coast Compost in Hollister, CA, its conversion to a state-of-the-art vermicompost facility and its significant planned expansion. The vermicomposting facility, called Central Coast Worm Farm (CCWF), is currently producing and selling agriculture-grade compost and premium worm castings. Following in Central Coast Compost’s footsteps of focusing on product quality and customer service, CCWF will continue to help businesses and municipalities in the Hollister region divert organic waste from landfills and convert that waste into organic soil amendment products with its novel finishing process using worms.


Worm castings are used in sustainable, regenerative and organic agriculture to address the intertwined challenges of climate change, land and water pollution, and sustainable and healthy agricultural practices. When applied to arable land, the castings replenish and enhance the microbiology of the soil, improving nutrient uptake efficiency, increasing water retention and sequestering carbon. By utilizing organic waste inputs to create natural soil amendments, CCWF diverts waste from landfills and displaces synthetic chemicals that pollute land, water and air. When the expansion of CCWF is complete, it will be one of the largest vermicomposting operations on the West Coast and will supply castings to commercial farm operators, agriculture products distributors, and home and garden centers across the US.

Galway has also provided a strategic investment in Yield RMG to support its development of other vermicomposting, novel water treatment, bio-energy and sustainable agriculture projects in the future.

Chief Executive Officer of Yield RMG, Caleb Adams, stated: “We value our partnership with Galway, a unique investor that is truly committed to sustainability and aligned in our objectives to grow innovative businesses like CCWF which aim to enhance farm outputs while solving interrelated environmental and social issues. In addition to being a strong financial partner, Galway’s team brings deep experience and a creative approach to supporting our vision and expansion plan.”

Galway’s Director of Investments, Rich Baltimore, added: “CCWF and the pipeline of other projects being developed by Yield RMG are focused squarely on addressing some of the most urgent challenges in California’s food, water and waste management economy. Yield RMG’s founders are innovative and driven with long-term, sustainable solutions and the know-how to implement them at scale. Galway is proud to partner with them and support the deployment of those solutions in California and beyond as we advance our shared goal of ensuring a more sustainable future for all.”

ABOUT YIELD RMG

Headquartered in Hollister, CA, Yield RMG was founded by Caleb Adams and Angus Mills. Caleb and Angus have over 28 years of combined experience in the agriculture and waste management sector and have successfully launched several agribusinesses over the years. Their shared interest in technology and markets in the areas of sustainable agriculture and energy infrastructure drives their innovative approach to project and product development. Yield RMG has an impressive track record in building and operating businesses and projects with a unique focus on the production and distribution of sustainable nutrients, biological inputs, the sustainable management and treatment of organic waste, and the development of bio-energy projects.

ABOUT GALWAY SUSTAINABLE CAPITAL

Galway Sustainable Capital is a specialty finance company investing in businesses that hold the promise of a better future for all. We invest in companies, projects and assets that promote environmental and social resilience through locally based solutions, ultimately building platforms that use resources more efficiently. Our investments save energy, reduce greenhouse gas emissions, increase resilience and expand opportunity.


Contacts

Caleb Adams
Yield RMG
Email: This email address is being protected from spambots. You need JavaScript enabled to view it.
Phone: 831-704-6509

Vera Feinhaus
Galway Sustainable Capital
Email: This email address is being protected from spambots. You need JavaScript enabled to view it.
Phone: 771-333-5852

 The Project is named after Dorothy Vaughan, one of NASA’s “Human Computers”

ALBANY, N.Y.--(BUSINESS WIRE)--$SLNH #SLNH--Soluna Holdings, Inc. (“SHI” or the “Company”), (NASDAQ: SLNH), the parent company of Soluna Computing, Inc. (“SCI”), a developer of green data centers for Bitcoin mining and other intensive computing has announced Project Dorothy, its 50 MW flagship green data center co-located at a wind farm in Texas, has been featured in a Black History Month segment from KLBK News in Lubbock, Texas. The segment can be found here. The news clip from KLBK features a quick video tour of the data center and wind farm which clearly capture the essence of innovation embodied in the project.


All of Soluna’s renewable computing data centers are named after influential women in science. This project is named after Dorothy Vaughan, an African American mathematician and “human computer” who worked for the National Advisory Committee for Aeronautics and NASA in 1939. Dorothy Vaughan led a team of women human computers that would go on to change our understanding of space forever. Their work helped send America’s first satellites–the SCOUT vehicle rockets–into space.

“Dorothy Vaughan was a tenacious leader and humbly triumphant. Her legacy inspires us as we work to catalyze a clean energy future.” said Michael Toporek, CEO of Soluna Holdings, Inc.

Learn more about the logistics of this facility here.

About Soluna Holdings, Inc (SLNH)

Soluna Holdings, Inc. is the leading developer of green data centers that convert excess renewable energy into global computing resources. Soluna builds modular, scalable data centers for computing intensive, batchable applications such as Bitcoin mining, AI and machine learning. Soluna provides a cost-effective alternative to battery storage or transmission lines. Soluna uses technology and intentional design to solve complex, real-world challenges. Up to 30% of the power of renewable energy projects can go to waste. Soluna’s data centers enable clean electricity asset owners to ‘Sell. Every. Megawatt.’

For more information about Soluna, please visit www.solunacomputing.com or follow us on LinkedIn at linkedin.com/solunaholdings and Twitter @SolunaHoldings.


Contacts

Michael Toporek
CEO
Soluna Holdings, Inc.
This email address is being protected from spambots. You need JavaScript enabled to view it.

  • Vast Solar Pty Ltd. (“Vast” or the “Company”) has entered into a Business Combination Agreement with Nabors Energy Transition Corp. (“NETC”). The combined entity will be named Vast and is expected to be listed on the New York Stock Exchange (NYSE) under the ticker symbol “VSTE”, while remaining headquartered in Australia.
  • Vast has developed a proprietary next-generation CSP system that provides clean, dispatchable renewable energy for utility-scale power, industrial heat and clean fuel production applications.
  • Vast’s technology is designed to overcome the manufacturability and reliability issues that slowed the adoption of conventional CSP technology and deliver a levelized cost of energy that is competitive with, or superior to, solar PV plus storage.
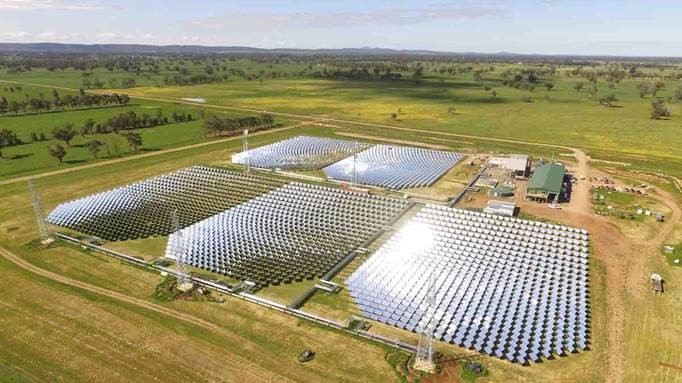
  • The Company’s CSP system uses a distributed modular tower design and a sodium heat transfer loop to gather energy from the sun, which is then stored in molten salt for later dispatch as either power or heat. Sodium is a superior thermal conductor which is key to enabling Vast’s modular tower design, and the modular design delivers improved performance, lower cost and reduced risk relative to previous generations of CSP technology.
  • To validate its technology, Vast constructed and operated from 2018 to 2020 a grid-connected 1.1 MW demonstration facility in Forbes, Australia.
  • Vast’s business model is to develop CSP projects using the Company’s technology, supply the equipment required to construct those projects, and provide EPC and O&M services to those projects during and after construction.
  • The Company is currently developing 230MW of projects, including a 30 MW grid-connected facility in Port Augusta, Australia that is expected to become operational in 2025, and a 20 ton per day solar methanol facility that will be co-located with and partially powered by the 30MW plant. Vast also has a multi-GW global pipeline of potential CSP projects.
  • The IEA forecasts deployments of up to 430 GW of new CSP capacity globally by 2050 for on-grid applications alone. Furthermore, CSP deployment for other applications could reach more than a terawatt by 20501.
  • NETC is an affiliate of Nabors Industries Ltd. (“Nabors”) (NYSE: NBR), and this transaction underscores Nabors’ commitment to the energy transition, extending its existing work on internal technology development and venture investments in clean, baseload and scalable energy technologies.
  • The transaction is expected to provide gross proceeds of up to USD $351 million to Vast, comprised of up to USD $286 million from NETC’s trust account (before giving effect to potential redemptions), USD $15 million from each of Nabors and Vast’s existing owner (“AgCentral Energy”) to be funded in a combination of a pre-closing convertible note financing and a private placement of ordinary shares of Vast at closing, and a targeted minimum of USD $35 million of capital from third-party investors.
  • Vast intends to use the proceeds from the transaction to fund project development activities in target markets, equity investments in CSP projects, deployment of manufacturing facilities, continued investment in research and development, pay fees and expenses related to the transaction, and for general corporate purposes.
  • AgCentral Energy and the Company’s management will roll 100% of their interests in Vast into the combined company.
  • The implied equity value of the combined company will be between approximately USD $305 million and USD $586 million depending on the level of redemptions. The transaction is expected to be completed during the second or third quarters of 2023.

HOUSTON & SYDNEY--(BUSINESS WIRE)--Vast Solar Pty Ltd, a renewable energy company specializing in concentrated solar power (CSP) energy systems that generate zero-carbon, utility-scale electricity and industrial heat, and Nabors Energy Transition Corp. (NYSE: NETCU, NETC, NETCW) today announced a definitive agreement for a business combination (the “Transaction” or the “Business Combination”) that would result in Vast becoming a publicly-listed company on the NYSE under the ticker symbol “VSTE”.


World-Leading Innovator in Concentrated Solar Power

Founded in Australia in 2009, Vast’s proprietary CSP system uses a modular tower design and a unique sodium loop for heat transfer to efficiently capture and store solar heat for conversion into clean and renewable electricity and heat. The Company’s system is designed to deliver greater efficiency, simplified permitting, faster construction and more reliable operations when compared to conventional central tower CSP plants.

“Vast’s CSP technology collects and stores the sun’s energy during the day for delivery at any time, making around-the-clock, clean power a reality,” said Craig Wood, Chief Executive Officer of Vast. “While the cost of wind and PV solar have declined significantly, their intermittency remains a key challenge that can only be addressed with storage. By providing clean, renewable energy with low-cost, long-duration storage, our CSP system can be incorporated as dispatchable generation in a way that is not possible using PV solar or wind with batteries. We are excited to partner with NETC to accelerate the deployment of our technology globally.”

“Vast has the potential to deliver low-cost, clean, renewable and dispatchable power and heat, a combination that no other technology has yet been able to achieve,” said Anthony Petrello, President and CEO of NETC and Chairman, President and CEO of Nabors. “With our global footprint, technology and operations expertise, Nabors looks forward to supporting Vast and helping to extend the leadership role Vast has established in the CSP space. We believe the transaction will accelerate the deployment of Vast’s technology, while furthering Nabors’ commitment to 'Energy Without Compromise' and support of companies on the cutting edge of advanced energy technology.”

Concentrated Solar Power Market

As the world transitions towards clean energy solutions, the total addressable market for CSP is poised to grow rapidly, with the International Energy Agency projecting new CSP deployments of up to 430 gigawatts by 2050 for on-grid applications alone1. Further CSP deployment for off-grid baseload-seeking projects, process heat applications, and as the energy input for green fuel production could reach more than a terawatt by 20502. Vast is uniquely positioned to seize opportunities that are in the market right now, as well as those that will develop as the market for CSP grows over the coming decades.

Vast Next-Generation CSP Technology

Vast’s proprietary CSP technology reflects and concentrates the sun’s rays onto solar receivers that capture the sun’s energy as heat in sodium, then transfer the heat to molten salt for high density storage. The stored heat can then be used to generate dispatchable clean power at night by generating steam for a turbine, produce heat directly for industrial purposes, or to deliver a mix of power and heat for the efficient production of green fuels such as green hydrogen, green methanol, sustainable aviation fuels, among others.

Vast’s CSP technology offers several advantages over conventional CSP technologies, including:

  • Sodium Loop for Heat Transfer – use of sodium as the heat transfer fluid unlocks Vast’s modular tower design, enables superior thermal process control, and avoids the need to empty out and restart the solar receivers on a daily basis due to the risk of the molten salt freezing, as is the case with central tower technology. When compared to parabolic trough systems, sodium’s higher operating temperature relative to mineral oil delivers more efficient power cycles, and hence cheaper energy.
  • Modularity – modular systems make better use of the heliostats (mirrors), achieving a 10-20% efficiency gain versus central tower designs, and they remove the single-point-of-failure risk inherent in central tower technology. Additionally, each module’s towers are smaller and less complex making them easier to permit, build, operate and maintain.

Vast’s technology was field validated and proven at the Company’s Forbes, Australia demonstration plant. The 1.1 MW facility successfully synchronized with the grid in 2018 and operated for nearly three years.

Commercial Project Pipeline

The Business Combination will provide Vast with capital to progress its multi-GW pipeline of projects, including four projects in various stages of development:

  • VS1 Port Augusta – Funded by up to AUD $110 million in concessional financing from the Australian Government, and up to AUD $65 million non-dilutive grant from the Australian Renewable Energy Agency (ARENA), Vast is developing a 30 MW/288MWh CSP reference plant in Port Augusta, Australia. Utilizing CSP v3.0 technology, the facility will produce dispatchable renewable electricity on demand for 8 hours overnight.
  • SM1 Port Augusta – The SM1 plant, a world-first green methanol commercial demonstration plant that is designed to produce 20 tons per day of solar methanol, will be fueled in part by the heat and electricity produced by the co-located VS1 Port Augusta reference plant. SM1 is being funded in part by the German-Australian Hydrogen Innovation and Technology Incubator, or HyGATE, via an approximately AUD $40 million non-dilutive grant.
  • VS2 Mount Isa – The 50 MW North West Queensland Hybrid Power Project will combine a solar PV system for daytime power generation, CSP storage for night-time supply, and large-scale batteries and gas turbines for grid firming.
  • VS3 Port Augusta – Permitting is already in place for an expected 150MW CSP plant that will be built on the same site as VS1 and SM1 following successful completion of those projects.

Alignment with Nabors’ Energy Transition Commitment

The Business Combination with Vast demonstrates the commitment that Nabors has made over the past several years to utilize its resources to support the energy transition and reduce carbon footprints globally. Since making this commitment to “Energy Without Compromise”, Nabors has utilized a three-pronged approach, pursuing internal technology development to decarbonize its operations and those of its customers, creating an ecosystem of venture investments in early stage advanced technology companies, and now lending support to Vast’s clean energy mission through the Business Combination with Nabors Energy Transition Corp.

“This transaction lies at the center of what we have been carefully creating and curating at Nabors over the past few years through investing in clean, baseload, scalable energy technologies” said Guillermo Sierra, VP of Energy Transition for NETC and VP of Strategic Initiatives for Nabors. “This transaction should allow Vast’s proprietary CSP technology to be scaled and accelerated by leveraging our global energy technology and operational platform. We believe that Vast will play a key role in solving the storage and dispatch challenges faced by renewable energy and in facilitating the transition to green fuels by providing clean process heat.”

Transaction Overview

Subject to certain conditions, affiliates of Nabors and AgCentral Energy each committed up to $15 million of capital in a combination of a pre-closing convertible note financing and a private placement of ordinary shares of Vast at closing. The Company is targeting a minimum of USD 35 million of additional capital from other third-party investors.

At closing, the balance of NETC’s trust account, net of any redemptions and payment of transaction expenses, will be released to Vast. AgCentral Energy and management will roll 100% of their interests in Vast into the combined company, which the Company believes reflects their support for the combination, as well as confidence in the go-forward prospects for the combined company.

The implied pro forma equity value of Vast is expected to be between USD $305 million and USD $586 million depending on the level of redemptions. Vast’s existing management team will continue to lead the Company following the completion of the transaction.

Vast is expected to remain headquartered in Sydney, Australia.

The Transaction was unanimously approved by the Boards of Directors of NETC and Vast. Completion of the proposed Transaction is subject to customary closing conditions and is anticipated to occur in the second or third quarters of 2023.

Additional information about the proposed Transaction, including a copy of the business combination agreement and the investor presentation, will be provided in a Current Report on Form 8-K to be filed by NETC with the U.S. Securities and Exchange Commission (the “SEC”) and available at www.sec.gov.

Extension

Under NETC’s amended and restated certificate of incorporation, Nabors Energy Transition Sponsor LLC (the “NETC Sponsor”), may deposit into the NETC’s trust account $2,760,000 to extend the date NETC has to consummate its initial business combination by an additional three months, up to two times. Affiliates of NETC Sponsor expect to deposit $2,760,000 into NETC’s trust account prior to February 18, 2023 to extend the date by which NETC has to consummate its initial business combination from February 18, 2023 to May 18, 2023.

Advisors

Guggenheim Securities, LLC acted as exclusive financial advisor to NETC. Vinson & Elkins L.L.P. and King & Wood Mallesons acted as legal advisors to NETC. Milbank LLP acted as legal advisor to Nabors. White & Case LLP and Gilbert + Tobin acted as legal advisors to Vast.

Investor Conference Call Information

Vast and NETC will host a joint investor conference call to discuss the proposed Transaction today, February 14, 2023 at 8:30AM ET.

To listen to the prepared remarks via telephone from the U.S., dial 1-877-407-3982 and an operator will assist you. The call may also be accessed through the following link:
https://callme.viavid.com/viavid/?callme=true&passcode=13735972&h=true&info=company&r=true&B=6

A telephone replay will be available by dialing 1-844-512-2921 if in the U.S, and by dialing 1-412-317-6671 from outside the U.S. The PIN for access to the replay is 13736336. The replay will be available through March 14, 2023.

About Vast

Vast is a world-leading renewable energy company that has developed concentrated solar power (CSP) systems to generate, store and dispatch carbon free, utility-scale electricity, industrial heat, and to enable the production of green fuels. Vast’s unique approach to CSP utilizes a proprietary, modular sodium loop to efficiently capture and convert solar heat into these end products. Vast’s “CSP v3.0” system is easier to permit, build and maintain than larger central tower CSP systems, and it is more efficient.

About Nabors Energy Transition Corp.

Nabors Energy Transition Corp. (NYSE: NETCU, NETC, NETCW) is a blank check company formed for the purpose of effecting a merger, capital stock exchange, asset acquisition, stock purchase, reorganization or similar business combination with one or more businesses or entities. NETC was formed to identify solutions, opportunities, companies or technologies that focus on advancing the energy transition; specifically, ones that facilitate, improve or complement the reduction of carbon or greenhouse gas emissions while satisfying growing energy consumption across markets globally.

NETC is an affiliate of Nabors Industries, Ltd., a leading provider of advanced technology for the energy industry. By leveraging its core competencies, particularly in drilling, engineering, automation, data science and manufacturing, Nabors, which owns the global industry’s largest fleet of land drilling rigs and equipment, is committed to innovate the future of energy and enable the transition to a lower-carbon world

Important Information about the Business Combination and Where to Find It

This communication does not constitute an offer to sell or the solicitation of an offer to buy any securities or constitute a solicitation of any vote or approval.

In connection with the proposed Business Combination, Vast will file with the SEC a registration statement on Form F-4 (the “Registration Statement”), which will include (i) a preliminary prospectus of Vast relating to the offer of securities to be issued in connection with the proposed Business Combination and (ii) a preliminary proxy statement of NETC to be distributed to holders of NETC’s capital stock in connection with NETC’s solicitation of proxies for vote by NETC’s stockholders with respect to the proposed Business Combination and other matters described in the Registration Statement. NETC and Vast also plan to file other documents with the SEC regarding the proposed Business Combination. After the Registration Statement has been declared effective by the SEC, a definitive proxy statement/prospectus will be mailed to the stockholders of NETC. INVESTORS AND SECURITY HOLDERS OF NETC AND VAST ARE URGED TO READ THE REGISTRATION STATEMENT, THE PROXY STATEMENT/PROSPECTUS CONTAINED THEREIN (INCLUDING ALL AMENDMENTS AND SUPPLEMENTS THERETO) AND ALL OTHER DOCUMENTS RELATING TO THE PROPOSED BUSINESS COMBINATION THAT WILL BE FILED WITH THE SEC CAREFULLY AND IN THEIR ENTIRETY WHEN THEY BECOME AVAILABLE BECAUSE THEY WILL CONTAIN IMPORTANT INFORMATION ABOUT THE PROPOSED BUSINESS COMBINATION.

Investors and security holders will be able to obtain free copies of the proxy statement/prospectus and other documents containing important information about NETC and Vast once such documents are filed with the SEC, through the website maintained by the SEC at http://www.sec.gov. In addition, the documents filed by NETC may be obtained free of charge from NETC’s website at www.nabors-etcorp.com or by written request to NETC at 515 West Greens Road, Suite 1200, Houston, TX 77067.

Participants in the Solicitation

NETC, Nabors Industries, Ltd. (“Nabors”), Vast and their respective directors and executive officers may be deemed to be participants in the solicitation of proxies from the stockholders of NETC in connection with the proposed Business Combination. Information about the directors and executive officers of NETC is set forth in NETC’s Annual Report on Form 10-K for the year ended December 31, 2021, filed with the SEC on March 28, 2022. To the extent that holdings of NETC’s securities have changed since the amounts printed in NETC’s Annual Report on Form 10-K for the year ended December 31, 2021, such changes have been or will be reflected on Statements of Change in Ownership on Form 4 filed with the SEC. Other information regarding the participants in the proxy solicitation and a description of their direct and indirect interests, by security holdings or otherwise, will be contained in the proxy statement/prospectus and other relevant materials to be filed with the SEC when they become available. You may obtain free copies of these documents as described in the preceding paragraph.

Forward Looking Statements

The information included herein and in any oral statements made in connection herewith include “forward-looking statements” within the meaning of Section 27A of the Securities Act of 1933, as amended, and Section 21E of the Securities Exchange Act of 1934, as amended. All statements, other than statements of present or historical fact included herein, regarding the proposed Business Combination, NETC’s and Vast’s ability to consummate the proposed Business Combination, the benefits of the proposed Business Combination and NETC’s and Vast’s future financial performance following the proposed Business Combination, as well as NETC’s and Vast’s strategy, future operations, financial position, estimated revenues and losses, projected costs, prospects, plans and objectives of management are forward-looking statements. When used herein, including any oral statements made in connection herewith, the words “could,” “should,” “will,” “may,” “believe,” “anticipate,” “intend,” “estimate,” “expect,” “project,” the negative of such terms and other similar expressions are intended to identify forward-looking statements, although not all forward-looking statements contain such identifying words. These forward-looking statements are based on NETC and Vast management’s current expectations and assumptions about future events and are based on currently available information as to the outcome and timing of future events. Except as otherwise required by applicable law, NETC and Vast disclaim any duty to update any forward-looking statements, all of which are expressly qualified by the statements in this section, to reflect events or circumstances after the date hereof. NETC and Vast caution you that these forward-looking statements are subject to risks and uncertainties, most of which are difficult to predict and many of which are beyond the control of NETC and Vast. These risks include, but are not limited to, general economic, financial, legal, political and business conditions and changes in domestic and foreign markets; the inability to complete the Business Combination or the convertible debt and equity financings contemplated in connection with the proposed Business Combination (the “Financing”) in a timely manner or at all (including due to the failure to receive required stockholder or shareholder, as applicable, approvals, or the failure of other closing conditions such as the satisfaction of the minimum trust account amount following redemptions by NETC’s public stockholders and the receipt of certain governmental and regulatory approvals), which may adversely affect the price of NETC’s securities; the inability of the Business Combination to be completed by NETC’s business combination deadline and the potential failure to obtain an extension of the business combination deadline if sought by NETC; the occurrence of any event, change or other circumstance that could give rise to the termination of the Business Combination or the Financing; the inability to recognize the anticipated benefits of the proposed Business Combination; the inability to obtain or maintain the listing of Vast’s shares on a national exchange following the consummation of the proposed Business Combination; costs related to the proposed Business Combination; the risk that the proposed Business Combination disrupts current plans and operations of Vast, business relationships of Vast or Vast’s business generally as a result of the announcement and consummation of the proposed Business Combination; Vast’s ability to manage growth; Vast’s ability to execute its business plan, including the completion of the Port Augusta project, at all or in a timely manner and meet its projections; potential disruption in Vast’s employee retention as a result of the proposed Business Combination; potential litigation, governmental or regulatory proceedings, investigations or inquiries involving Vast or NETC, including in relation to the proposed Business Combination; changes in applicable laws or regulations and general economic and market conditions impacting demand for Vast’s products and services.


Contacts

Vast

For Investors:
Caldwell Bailey
ICR, Inc.
This email address is being protected from spambots. You need JavaScript enabled to view it.

For Media:
Matt Dallas
ICR, Inc.
This email address is being protected from spambots. You need JavaScript enabled to view it.

Nabors Energy Transition Corp. Contacts

For Investors:
William C. Conroy, CFA
Vice President – Corporate Development & Investor Relations
This email address is being protected from spambots. You need JavaScript enabled to view it.

For Media:
Brian Brooks
Senior Director, Corporate Communications
This email address is being protected from spambots. You need JavaScript enabled to view it.


Read full story here

TORONTO--(BUSINESS WIRE)--Electra Battery Materials Corporation (NASDAQ: ELBM; TSX-V: ELBM) (“Electra”, or the “Company”) announced that it has closed its previously announced private placement offering (the “Note Offering”) of US$51 million principal amount of 8.99% senior secured convertible notes due February 2028 (the “Notes”).


As part of the transaction, the Company purchased and cancelled all of the outstanding approximately US$36 million principal amount of the Company’s existing 6.95% senior secured notes due 2026 (the “2026 Notes”) at par, plus accrued and unpaid interest through the date of the closing. The net proceeds of the Note Offering of approximately US$14 million will be used for capital expenditures associated with the expansion and recommissioning of the Company’s hydrometallurgical cobalt refinery, including buildings, equipment, infrastructure, and other direct costs, as well as engineering and project management costs.

The initial conversion rate of the Notes is 403.2140 common shares of the Company (“Common Shares”) per US$1,000, equivalent to an initial conversion price of approximately US$2.48 per Common Share, subject to certain adjustments set forth in the indenture governing the Notes (the “Note Indenture”), reflecting a premium of approximately 17.5% to the 30-day volume weighted average price of the Common Shares prior to the date the Note Offering was announced.

The Notes bear interest at 8.99% per annum, subject to adjustment in certain circumstances described in the Note Indenture, payable in cash semi-annually in arrears in February and August of each year, provided that during the first 12 months of the term of the Notes, the Company may pay interest through the issuance of Common Shares at an increased annual interest rate of 11.125%.

Cantor Fitzgerald & Co. (“CF&Co”) acted as sole placement agent for the Note Offering and received a cash fee equal to 4% of the difference between the principal amount of Notes and the outstanding principal amount of 2026 Notes, a portion of which was satisfied by the issuance of 27,500 Common Shares at a price of US$2.18, as well as a fee of 50,000 Common Shares.

The Notes, the Warrants, the underlying Common Shares and the Common Shares have not been registered under the United States Securities Act of 1933, as amended (the “U.S. Securities Act”), or any applicable U.S. state securities laws, and may not be offered or sold in the United States absent registration or an available exemption from the registration requirement of the U.S. Securities Act and applicable U.S. state securities laws.

The Noteholders received an aggregate of 10,796,054 warrants to purchase Common Shares (“Warrants”) exercisable for five years at US$2.48 in connection with the Note Offering. The initial Noteholders also received a royalty of an aggregate of 0.6% of revenues for five years from the commencement of commercial production, subject to certain allowable deductions in the first year of the term.

Upon any early conversion of Notes, the Company will make an interest make-whole payment equal to the lesser of the two years of interest payments or interest payable to maturity, which may be made in cash or shares at the Company’s election. There are also payments required in the event of a fundamental change, such as a change of control. In accordance with the policies of the TSX Venture Exchange (“TSXV”), for as long as the Company is listed on the TSXV, aggregate consideration that is deemed “interest” under the Note Offering is capped at 24% per year absent TSXV approval. In addition, provided the Company is not listed on TSXV, certain price-based adjustment mechanisms will apply to the Notes and the Warrants. Should such adjustments be required or should the Noteholders become entitled to aggregate deemed interest in conflict with TSXV policies, the Company has agreed to seek to obtain approval from the TSXV to make such adjustments or allow such payments to be made, or in the alternative, take other measures up to and including seeking an alternative Canadian listing venue.

Additional information with respect to the attributes of the Notes, the Warrants and royalty can be found in the Company’s news release dated February 8, 2023, the Note Indenture, the indenture governing the Warrants, and a material change report to be filed in connection with the Note Offering, each of which will be made publicly available on SEDAR and EDGAR.

This press release shall not constitute an offer to sell or the solicitation of an offer to buy, nor shall there be any sale of the securities in any jurisdiction in which such offer, solicitation or sale would be unlawful.

About Electra Battery Materials

Electra is a processor of low-carbon, ethically-sourced battery materials.

Neither the TSX Venture Exchange nor its Regulation Services Provider (as that term is defined in policies of the TSX Venture Exchange) accepts responsibility for the adequacy or accuracy of this release.

Cautionary Note Regarding Forward-Looking Statements

This news release may contain forward-looking statements and forward-looking information (together, “forward-looking statements”) within the meaning of applicable securities laws and the United States Private Securities Litigation Reform Act of 1995. All statements, other than statements of historical facts, are forward-looking statements. Generally, forward-looking statements can be identified by the use of terminology such as “plans”, “expects', “estimates”, “intends”, “anticipates”, “believes” or variations of such words, or statements that certain actions, events or results “may”, “could”, “would”, “might”, “occur” or “be achieved”. Such forward-looking statements include, without limitation, statements regarding the attributes and terms of the Notes and related agreements and the expected use of proceeds of the Offering. Forward-looking statements involve risks, uncertainties and other factors that could cause actual results, performance, and opportunities to differ materially from those implied by such forward-looking statements. Factors that could cause actual results to differ materially from these forward-looking statements are set forth in the management discussion and analysis and other disclosures of risk factors for Electra Battery Materials Corporation, filed on SEDAR at www.sedar.com and with on EDGAR at www.sec.gov. Although Electra Battery Materials Corporation believes that the information and assumptions used in preparing the forward-looking statements are reasonable, undue reliance should not be placed on these statements, which only apply as of the date of this news release, and no assurance can be given that such events will occur in the disclosed times frames or at all. Except where required by applicable law, Electra Battery Materials Corporation disclaims any intention or obligation to update or revise any forward-looking statement, whether as a result of new information, future events or otherwise.


Contacts

Joe Racanelli Vice President, Investor Relations
This email address is being protected from spambots. You need JavaScript enabled to view it. 1.416.900.3891

Earnings Release Highlights


  • GAAP Net Income and Adjusted (non-GAAP) Operating Earnings of $0.43 per share for the fourth quarter of 2022
  • Introducing 2023 Adjusted (non-GAAP) Operating Earnings guidance range of $2.30-$2.42 per share, reflecting continued growth in the utilities
  • Declaring quarterly dividend of $0.36 per share for the first quarter of 2023, representing 6.7% growth over 2022 fourth quarter dividend of $0.3375 per share
  • Projecting to invest $31.3 billion of capital expenditures over the next four years to meet customer needs, resulting in expected rate base growth of 7.9% and a fully regulated operating EPS* compounded annual growth of 6-8% from 2022 to 2026 off the midpoint of 2022 guidance
  • ComEd, PECO, and PHI ended the year with their best-on-record performances in SAIFI, and all gas utilities sustained top decile performance in gas odor response for the fourth straight quarter
  • Delmarva Power filed an electric distribution rate case with the Delaware Public Service Commission (DEPSC) in December, seeking an increase in base rates to support significant infrastructure investments to maintain safety, reliability, and service for customers
  • A settlement was approved in December by the Maryland Public Service Commission (MDPSC) in Delmarva Power Maryland’s first electric distribution Multi-Year Plan case
  • ComEd filed a Multi-Year Integrated Grid Plan and a Multi-Year Rate Plan with the Illinois Commerce Commission (ICC) in January, seeking an increase in base rates over the period of 2024 to 2027 to support the decarbonization goals under the state’s Climate and Equitable Jobs Act (CEJA) and to ensure the transition to cleaner energy is reliable and equitable for all 9 million customers

CHICAGO--(BUSINESS WIRE)--$EXC--Exelon Corporation (Nasdaq: EXC) today reported its financial results for the fourth quarter and full year 2022.

In 2022, Exelon showcased our ability as a pure transmission and distribution company to deliver on our financial and operational commitments. Because of the partnership with our customers and communities, Exelon is ready to lead the energy transition to a cleaner and brighter future,” said Calvin Butler, Exelon president and CEO. “Our teams are focused on the things that matter to our customers: safety, reliability, sustainability and affordability, while ensuring our actions are grounded in taking an equitable and inclusive approach to the communities we serve. It’s a strong foundation for 2023 and beyond.”

We delivered strong financial results in our first year as a new company,” said Jeanne Jones, executive vice president and CFO. “For the full year 2022, we earned $2.08 per share on a GAAP basis and $2.27 on a non-GAAP basis, results that are in the upper half of our guidance range. Over the next four years, Exelon will invest $31 billion to support our jurisdictions’ energy transitions, growing the rate base by 7.9%, and results in our expectations for 6% to 8% annualized growth in operating earnings per share through 2026, off the midpoint of our 2022 guidance. We expect adjusted (non-GAAP) earnings for 2023 of $2.30 - $2.42 per share, in line with the direction provided in our third-quarter earnings call.”

Fourth Quarter 2022

Exelon's GAAP Net Income from Continuing Operations for the fourth quarter of 2022 increased to $0.43 per share from $0.31 GAAP Net Income from Continuing Operations per share in the fourth quarter of 2021. Adjusted (non-GAAP) Operating Earnings for the fourth quarter of 2022 increased to $0.43 per share from $0.39 per share in the fourth quarter of 2021. For the reconciliations of GAAP Net Income from Continuing Operations to Adjusted (non-GAAP) Operating Earnings, refer to the tables beginning on page 5.

Adjusted (non-GAAP) Operating Earnings in the fourth quarter of 2022 primarily reflect:

  • Higher utility earnings primarily due to higher electric distribution earnings at ComEd from higher allowed electric distribution ROE due to an increase in treasury rates and higher rate base, and rate increases at PECO, BGE, and PHI. This was partially offset by higher interest expense at PECO, and higher depreciation expense and credit loss expense at PECO and PHI.
  • Lower earnings at Exelon Corporate primarily due to higher interest expense.

Full Year 2022

Exelon's GAAP Net Income from Continuing Operations for 2022 increased to $2.08 per share from $1.65 GAAP Net Income from Continuing Operations per share in 2021. Adjusted (non-GAAP) Operating Earnings for 2022 increased to $2.27 per share from $1.83 per share in 2021.

Adjusted (non-GAAP) Operating Earnings for the full year 2022 primarily reflect:

  • Higher utility earnings primarily due to higher electric distribution and transmission earnings at ComEd from higher allowed electric distribution ROE due to an increase in treasury rates and higher rate base, rate increases at PECO, BGE, and PHI, and decreased storm costs at PECO and BGE. This was partially offset by higher depreciation expense, credit loss expense, and interest expense at PECO, BGE, and PHI, and higher storm costs at PHI.
  • Higher earnings at Exelon Corporate due to certain BSC costs that were historically allocated to Constellation Energy Generation, LLC (Generation) but are presented as part of continuing operations in Exelon’s results in the fourth quarter of 2021 as these costs do not qualify as expenses of the discontinued operations per the accounting rules, partially offset by higher interest expense.

Operating Company Results1

ComEd

ComEd's fourth quarter of 2022 GAAP Net Income increased to $211 million from $133 million in the fourth quarter of 2021. ComEd's Adjusted (non-GAAP) Operating Earnings for the fourth quarter of 2022 increased to $211 million from $138 million in the fourth quarter of 2021, primarily due to increases in electric distribution formula rate earnings (reflecting higher allowed electric distribution ROE due to an increase in treasury rates and the impacts of higher rate base). Due to revenue decoupling, ComEd's distribution earnings are not affected by actual weather or customer usage patterns.

PECO

PECO’s fourth quarter of 2022 GAAP Net Income decreased to $102 million from $122 million in the fourth quarter of 2021. PECO's Adjusted (non-GAAP) Operating Earnings for the fourth quarter of 2022 decreased to $102 million from $125 million in the fourth quarter of 2021, primarily due to increases in depreciation expense, credit loss expense, and interest expense, partially offset by distribution rate increases.

BGE

BGE’s fourth quarter of 2022 GAAP Net Income decreased to $113 million from $117 million in the fourth quarter of 2021. BGE's Adjusted (non-GAAP) Operating Earnings for the fourth quarter of 2022 decreased to $114 million from $121 million in the fourth quarter of 2021, primarily due to an increase in various expenses, offset by favorable impacts of the multi-year plans. Due to revenue decoupling, BGE's distribution earnings are not affected by actual weather or customer usage patterns.

PHI

PHI’s fourth quarter of 2022 GAAP Net Income increased to $90 million from $26 million in the fourth quarter of 2021. PHI’s Adjusted (non-GAAP) Operating Earnings for the fourth quarter of 2022 increased to $90 million from $64 million in the fourth quarter of 2021, primarily due to distribution rate increases, lower contracting costs, and timing of excess deferred tax amortization, partially offset by increases in depreciation expense and credit loss expense. Due to revenue decoupling, PHI's distribution earnings related to Pepco Maryland, DPL Maryland, Pepco District of Columbia, and ACE are not affected by actual weather or customer usage patterns.

Initiates Annual Guidance for 2023

Exelon introduced a guidance range for 2023 Adjusted (non-GAAP) Operating Earnings of $2.30-$2.42 per share. The outlook for 2023 Adjusted (non-GAAP) Operating Earnings for Exelon and its subsidiaries excludes costs related to the separation.

___________

1Exelon’s four business units include ComEd, which consists of electricity transmission and distribution operations in northern Illinois; PECO, which consists of electricity transmission and distribution operations and retail natural gas distribution operations in southeastern Pennsylvania; BGE, which consists of electricity transmission and distribution operations and retail natural gas distribution operations in central Maryland; and PHI, which consists of electricity transmission and distribution operations in the District of Columbia and portions of Maryland, Delaware, and New Jersey and retail natural gas distribution operations in northern Delaware.

Recent Developments and Fourth Quarter Highlights

  • Dividend: On February 14, 2023, Exelon’s Board of Directors declared a regular quarterly dividend of $0.36 per share on Exelon’s common stock for the first quarter of 2023. The dividend is payable on Friday, March 10, 2023, to shareholders of record of Exelon as of 5 p.m. Eastern time on Monday, February 27, 2023.
  • ComEd Electric Base Rate Case: On January 17, 2023, ComEd filed an application for a four-year cumulative multi-year rate plan for January 1, 2024 to December 31, 2027 with the ICC to increase its electric distribution rates by $877 million effective January 1, 2024, $175 million effective January 1, 2025, $217 million effective January 1, 2026, and $203 million effective January 1, 2027, based on forecasted revenue requirements. The revenue requirement will provide for a weighted average debt and equity return on distribution rate base of 7.43% in 2024, 7.50% in 2025, 7.62% in 2026, and 7.70% in 2027, inclusive of an allowed ROE of 10.50% in 2024, 10.55% in 2025, 10.60% in 2026, and 10.65% in 2027. The requested revenue requirements are based on capital structures that reflect between 50.58% and 51.19% common equity. ComEd’s MRP also includes a proposed rate phase-in to defer approximately $307 million of the $877 million year-over-year increase for 2024 revenue from 2024 to 2026. ComEd currently expects a decision in the fourth quarter of 2023, but cannot predict if the ICC will approve the application as filed.
  • ComEd Distribution Formula Rate: On November 17, 2022, the ICC approved ComEd's electric distribution formula rate of $199 million, which will take effect on January 1, 2023. ComEd’s 2023 approved revenue requirement above reflects an increase of $144 million for the initial year revenue requirement for 2023 and an increase of $55 million related to the annual reconciliation for 2021. The revenue requirement for 2023 provides for a weighted average debt and equity return on distribution rate base of 5.94% inclusive of an allowed ROE of 7.85%, reflecting the monthly average yields for 30-year treasury bonds plus 580 basis points. The reconciliation revenue requirement for 2021 provides for a weighted average debt and equity return on distribution rate base of 5.91%, inclusive of an allowed ROE of 7.78%, reflecting the monthly yields on 30-year treasury bonds plus 580 basis points less a performance metrics penalty of 7 basis points.
  • DPL Maryland Electric Base Rate Case: On December 14, 2022, the MDPSC approved DPL’s three-year multi-year plan for January 1, 2023 through December 31, 2025. The order approved an incremental increase in DPL’s electric distribution rates of $17 million, $6 million, and $6 million for 2023, 2024, and, 2025, respectively, reflecting an ROE of 9.60%.
  • DPL Delaware Electric Base Rate Case: On December 15, 2022, DPL Delaware filed an application with the DEPSC to increase its annual electric distribution rates by $60 million, reflecting an ROE of 10.50%. DPL currently expects a decision in the second quarter of 2024 but cannot predict if the DEPSC will approve the application as filed.
  • Financing Activities:
    • On October 4, 2022, ComEd entered into a 364-day term loan agreement for $150 million with a variable rate equal to SOFR plus 0.75% and an expiration date of October 3, 2023. The proceeds from this loan were used to repay outstanding commercial paper obligations.
    • On October 7, 2022, Exelon Corporate entered into an 18-month term loan agreement for $500 million with a variable rate equal to SOFR plus 0.85% and an expiration date of April 7, 2024. In conjunction with this loan, Exelon repaid the remaining $575 million in borrowings on the $1.15 billion term loan entered into on January 24, 2022.
    • On January 3, 2023, ComEd entered into a purchase agreement of First Mortgage Bonds of $400 million and $575 million at 4.90% and 5.30% due on February 1, 2033 and February 1, 2053, respectively. The closing date of the issuance occurred on January 10, 2023.

GAAP/Adjusted (non-GAAP) Operating Earnings Reconciliation

Adjusted (non-GAAP) Operating Earnings for the fourth quarter of 2022 do not include the following items (after tax) that were included in reported GAAP Net Income from Continuing Operations:

(in millions, except per share amounts)

Exelon
Earnings per
Diluted
Share

Exelon

ComEd

PECO

BGE

PHI

2022 GAAP Net Income (Loss) from Continuing Operations

$

0.43


$

432


$

211

$

102

$

113

$

90

Mark-to-Market Impact of Economic Hedging Activities (net of taxes of $1)


4


Asset Impairments (net of taxes of $0)


1


1


Separation Costs (net of taxes of $0)


(1

)


Income Tax-Related Adjustments (entire amount represents tax expense)


(0.01

)


(8

)


2022 Adjusted (non-GAAP) Operating Earnings

$

0.43


$

428


$

211

$

102

$

114

$

90


Adjusted (non-GAAP) Operating Earnings for the fourth quarter of 2021 do not include the following items (after tax) that were included in reported GAAP Net Income from Continuing Operations:

(in millions, except per share amounts)

Exelon
Earnings per
Diluted
Share

Exelon

ComEd

PECO

BGE

PHI

2021 GAAP Net Income (Loss) from Continuing Operations

$

0.31

$

309

$

133

$

122

$

117

$

26

COVID-19 Direct Costs (net of taxes of $2, $0, $0, and $1, respectively)


0.01


7


1


1


2

ERP System Implementation Costs (net of taxes of $1)


3


Separation Costs (net of taxes of $8, $2, $1, $1, and $1, respectively)


0.03


27


5


2


3


4

Income Tax-Related Adjustments (entire amount represents tax expense)


0.04


39


32

2021 Adjusted (non-GAAP) Operating Earnings

$

0.39

$

385

$

138

$

125

$

121

$

64


Adjusted (non-GAAP) Operating Earnings for the full year of 2022 do not include the following items (after tax) that were included in reported GAAP Net Income from Continuing Operations:

(in millions, except per share amounts)

Exelon
Earnings per
Diluted
Share

Exelon

ComEd

PECO

BGE

PHI

2022 GAAP Net Income (Loss) from Continuing Operations

$

2.08

$

2,054


$

917

$

576

$

380

$

608


Mark-to-Market Impact of Economic Hedging Activities (net of taxes of $1)


4


Asset Retirement Obligation (net of taxes of $2)


(4

)


(4

)

Asset Impairments (net of taxes of $10)


0.04


38


38


ERP System Implementation Costs (net of taxes of $0)


1


Separation Costs (net of taxes of $10, $4, $2, $2, and $3, respectively)


0.02


24


9


4


4


7


Income Tax-Related Adjustments (entire amount represents tax expense)


0.12


122


38


3


2022 Adjusted (non-GAAP) Operating Earnings

$

2.27

$

2,239


$

926

$

619

$

423

$

614


Adjusted (non-GAAP) Operating Earnings for the full year of 2021 do not include the following items (after tax) that were included in reported GAAP Net Income from Continuing Operations:

(in millions, except per share amounts)

Exelon
Earnings per
Diluted
Share

Exelon

ComEd

PECO

BGE

PHI

2021 GAAP Net Income (Loss) from Continuing Operations

$

1.65

$

1,616

$

742

$

504

$

408

$

561

Mark-to-Market Impact of Economic Hedging Activities (net of taxes of $3)


4


Cost Management Program (net of taxes of $1, $0, $0, and $0)


0.01


6


1


1


1

COVID-19 Direct Costs (net of taxes of $6, $2, $1, and $2, respectively)


0.01


14


4


3


4

Asset Retirement Obligation (net of taxes of $1)


2


2

Acquisition Related Costs (net of taxes of $5)


0.02


15


ERP System Implementation Costs (net of taxes of $4, $0, $0, and $0)


0.01


13


1


1


1

Separation Costs (net of taxes of $21, $5, $2, $3, and $3, respectively)


0.06


58


12


6


7


9

Income Tax-Related Adjustments (entire amount represents tax expense)


0.06


62


32

2021 Adjusted (non-GAAP) Operating Earnings

$

1.83

$

1,791

$

754

$

516

$

419

$

609


Note:
Amounts may not sum due to rounding.
Unless otherwise noted, the income tax impact of each reconciling item between GAAP Net Income (Loss) from Continuing Operations and Adjusted (non-GAAP) Operating Earnings is based on the marginal statutory federal and state income tax rates for each Registrant, taking into account whether the income or expense item is taxable or deductible, respectively, in whole or in part. For all items, the marginal statutory income tax rates for 2022 and 2021 ranged from 24.0% to 29.0%.

Webcast Information

Exelon will discuss fourth quarter 2022 earnings in a conference call scheduled for today at 9 a.m. Central Time (10 a.m. Eastern Time). The webcast and associated materials can be accessed at www.exeloncorp.com/investor-relations.

About Exelon

Exelon (Nasdaq: EXC) is a Fortune 200 company and the nation’s largest energy delivery company, serving more than 10 million customers through six fully regulated transmission and distribution utilities — Atlantic City Electric (ACE), Baltimore Gas and Electric (BGE), Commonwealth Edison (ComEd), Delmarva Power & Light (DPL), PECO Energy Company (PECO), and Potomac Electric Power Company (Pepco). More than 18,000 Exelon employees dedicate their time and expertise to powering a cleaner and brighter future for our customers and communities through reliable, affordable and efficient energy delivery, workforce development, equity, economic development and volunteerism. Follow Exelon on Twitter @Exelon.

Non-GAAP Financial Measures

In addition to net income as determined under generally accepted accounting principles in the United States (GAAP), Exelon evaluates its operating performance using the measure of Adjusted (non-GAAP) Operating Earnings because management believes it represents earnings directly related to the ongoing operations of the business. Adjusted (non-GAAP) Operating Earnings exclude certain costs, expenses, gains and losses, and other specified items. This measure is intended to enhance an investor’s overall understanding of period over period operating results and provide an indication of Exelon’s baseline operating performance excluding items that are considered by management to be not directly related to the ongoing operations of the business. In addition, this measure is among the primary indicators management uses as a basis for evaluating performance, allocating resources, setting incentive compensation targets, and planning and forecasting of future periods. Adjusted (non-GAAP) Operating Earnings is not a presentation defined under GAAP and may not be comparable to other companies’ presentation. Exelon has provided the non-GAAP financial measure as supplemental information and in addition to the financial measures that are calculated and presented in accordance with GAAP. Adjusted (non-GAAP) Operating Earnings should not be deemed more useful than, a substitute for, or an alternative to the most comparable GAAP Net Income measures provided in this earnings release and attachments. This press release and earnings release attachments provide reconciliations of Adjusted (non-GAAP) Operating Earnings to the most directly comparable financial measures calculated and presented in accordance with GAAP, are posted on Exelon’s website: www.exeloncorp.com, and have been furnished to the Securities and Exchange Commission on Form 8-K on Feb. 14, 2023.

Cautionary Statements Regarding Forward-Looking Information

This press release contains certain forward-looking statements within the meaning of the Private Securities Litigation Reform Act of 1995 that are subject to risks and uncertainties. Words such as “could,” “may,” “expects,” “anticipates,” “will,” “targets,” “goals,” “projects,” “intends,” “plans,” “believes,” “seeks,” “estimates,” “predicts,” “should,” and variations on such words, and similar expressions that reflect our current views with respect to future events and operational, economic, and financial performance, are intended to identify such forward-looking statements.

The factors that could cause actual results to differ materially from the forward-looking statements made by Exelon Corporation, Commonwealth Edison Company, PECO Energy Company, Baltimore Gas and Electric Company, Pepco Holdings LLC, Potomac Electric Power Company, Delmarva Power & Light Company, and Atlantic City Electric Company (Registrants) include those factors discussed herein, as well as the items discussed in (1) the Registrants' 2021 Annual Report on Form 10-K filed with the SEC on February 25, 2022 in Part I, ITEM 1A. Risk Factors; (2) the Registrants' Current Report on Form 8-K filed with the SEC on June 30, 2022 to recast Exelon's consolidated financial statements and certain other financial information originally included in the 2021 Form 10-K in (a) Part II, ITEM 7. Management’s Discussion and Analysis of Financial Condition and Results of Operations and (b) Part II, ITEM 8. Financial Statements and Supplementary Data: Note 17, Commitments and Contingencies; (3) the Registrants' Third Quarter 2022 Quarterly Report on Form 10-Q (filed on Nov. 3, 2022) in (a) Part II, ITEM 1A. Risk Factors, (b) Part I, ITEM 2. Management’s Discussion and Analysis of Financial Condition and Results of Operations, and (c) Part I, ITEM 1. Financial Statements: Note 13, Commitments and Contingencies; and (4) other factors discussed in filings with the SEC by the Registrants.

Investors are cautioned not to place undue reliance on these forward-looking statements, whether written or oral, which apply only as of the date of this press release. None of the Registrants undertakes any obligation to publicly release any revision to its forward-looking statements to reflect events or circumstances after the date of this press release.


Earnings Release Attachments

Table of Contents


Consolidating Statement of Operations

1


Consolidated Balance Sheets

3


Consolidated Statements of Cash Flows

5


Reconciliation of GAAP Net Income from Continuing Operations to Adjusted (non-GAAP) Operating Earnings and Analysis of Earnings

6


Statistics


ComEd

10

PECO

11

BGE

13

Pepco

16

DPL

17

ACE

19


Consolidating Statements of Operations

(unaudited)

(in millions)


ComEd


PECO


BGE


PHI


Other (a)


Exelon

Three Months Ended December 31, 2022


Operating revenues

$

1,225


$

1,026


$

1,086


$

1,342


$

(12

)


$

4,667


Operating expenses


Purchased power and fuel


68


442


474


554


1,538


Operating and maintenance


368


288


220


292


69


1,237


Depreciation and amortization


341


95


161


240


15


852


Taxes other than income taxes


84


47


77


114


8


330


Total operating expenses


861


872


932


1,200


92


3,957


Operating income (loss)


364


154


154


142


(104

)


710


Other income and (deductions)


Interest expense, net


(106

)


(48

)


(41

)


(75

)


(115

)


(385

)

Other, net


14


8


5


22


52


101


Total other (deductions)


(92

)


(40

)


(36

)


(53

)


(63

)


(284

)

Income (loss) from continuing operations before income taxes


272


114


118


89


(167

)


426


Income taxes


61


12


5


(1

)


(83

)


(6

)

Net income (loss) from continuing operations after income taxes


211


102


113


90


(84

)


432


Net income from discontinued operations after income taxes


Net income (loss)


211


102


113


90


(84

)


432


Net income attributable to noncontrolling interests


Net income (loss) attributable to common shareholders

$

211


$

102


$

113


$

90


$

(84

)


$

432


Three Months Ended December 31, 2021


Operating revenues

$

1,567


$

798


$

915


$

1,187


$

(43

)


$

4,424


Operating expenses


Purchased power and fuel


544


282


336


444


(2

)


1,604


Operating and maintenance


387


227


215


313


65


1,207


Depreciation and amortization


311


89


157


207


16


780


Taxes other than income taxes


77


41


72


109


9


308


Total operating expenses


1,319


639


780


1,073


88


3,899


Loss on sales of assets and businesses


(3

)


(3

)

Operating income (loss)


248


159


135


114


(134

)


522


Other income and (deductions)


Interest expense, net


(97

)


(41

)


(35

)


(66

)


(83

)


(322

)

Other, net


13


7


7


16


28


71


Total other (deductions)


(84

)


(34

)


(28

)


(50

)


(55

)


(251

)

Income (loss) from continuing operations before income taxes


164


125


107


64


(189

)


271


Income taxes


31


3


(10

)


38


(100

)


(38

)

Net income (loss) from continuing operations after income taxes


133


122


117


26


(89

)


309


Net income from discontinued operations after income taxes


79


79


Net income (loss)


133


122


117


26


(10

)


388


Net loss attributable to noncontrolling interests


(3

)


(3

)

Net income (loss) attributable to common shareholders

$

133


$

122


$

117


$

26


$

(7

)


$

391


Change in Net income from continuing operations 2021 to 2022

$

78


$

(20

)


$

(4

)


$

64


$

5


$

123


Contacts

Elizabeth Keating
Corporate Communications
312-394-7417

Andrew Plenge
Investor Relations
312-394-2345


Read full story here

Enteligent’s charger is powered directly from the sun and eliminates inefficient DC to AC power conversion, reducing energy consumption and cost

MORGAN HILL, Calif.--(BUSINESS WIRE)--Enteligent Inc., developer of solar power optimization and electric vehicle (EV) solar charging technologies that delivers more of the clean solar energy you generate and dramatically reduces cost, is unveiling the world’s first DC-to-DC solar hybrid bi-directional EV charger this week at Intersolar NA 2023 in Booth 2460. Powered directly from the sun, Enteligent’s solar EV charger can supply 25 kW of fast DC charging – three times faster than AC Level 2 EV chargers – while also supporting vehicle-to-home (V2H) and vehicle-to-grid (V2G) home energy resilience and providing significant energy savings.


Image: Enteligent solar EV charger

Currently, EV owners plug their cars into home chargers which are powered by an alternating current (AC) flow of energy generated from the electric grid. But EV batteries operate on a direct current (DC) requiring the power to be converted from AC-to-DC in the charging process. This conversion is inefficient and results in a significant amount of lost energy and a longer charging time.

By eliminating the AC-to-DC conversion, Enteligent’s EV chargers help users optimize every kilowatt of precious, clean energy, resulting in up to 25% energy savings. And direct charging DC by-passes the EV’s internal conversion electronics, dramatically improving the time necessary to charge.

Additionally, BloombergNEF forecasts that by the end of this decade 52% of the total car market will be composed of EVs. Today, the vast majority of EVs are charged overnight by a fossil fuel-powered grid. With the dramatically increased number of EVs plugged in at night and with the rapidly growing array of household electronics we rely on daily, this proliferation of required electricity will strain the grid’s ability to reliability meet energy demand.

Enteligent’s proprietary solar EV chargers make it convenient and affordable to charge during the day, direct from convenient on-site solar generation, fostering a fundamental shift in energy consumption habits that leverage solar power when it is locally generated and readily available.

“Rapid growth in EV ownership and usage and the resulting demand for energy are putting increased pressure on an already stretched electricity grid,” said Sean Burke, founder, and CEO of Enteligent. “This first-of-its-kind technology will benefit consumers by enabling them to shift from night-time charging, which is dependent on the fossil-fuel powered grid, to clean, solar-based, daytime charging.”

About Enteligent

Enteligent is a California-based developer of smart solar power optimization and solar EV charging technologies that dramatically increase energy utilization, improve returns on energy investments and enable critical paradigm shifts in how we use energy for the upcoming green electrification revolution. Enteligent’s NMax photovoltaic module power optimizers use smart digital technology to dynamically adjust when to optimize and provide panel-level monitoring data, resulting in greater rooftop yield, more energy harvesting and higher system reliability. Enteligent’s bidirectional DC solar EV chargers enable direct electrification from clean energy to charge faster and more efficiently, recouping up to 25% of the electricity lost by traditional means. Learn more about Enteligent at: https://enteligent.com/


Contacts

Wendy Prabhu, Mercom Communications
This email address is being protected from spambots. You need JavaScript enabled to view it.
US: +1.512.215.4452

Offshore Source Logo

Offshore Source keeps you updated with relevant information concerning the Offshore Energy Sector.

Any views or opinions represented on this website belong solely to the author and do not represent those of the people, institutions or organizations that Offshore Source or collaborators may or may not have been associated with in a professional or personal capacity, unless explicitly stated.

Corporate Offices

Technology Systems Corporation
8502 SW Kansas Ave
Stuart, FL 34997

info@tscpublishing.com