Business Wire News

MIAMI--(BUSINESS WIRE)--World Fuel Services Corporation (NYSE:INT) announced today that its board of directors has declared a quarterly cash dividend of $0.10 per share payable on October 9, 2020 to shareholders of record on September 25, 2020.


About World Fuel Services Corporation

Headquartered in Miami, Florida, World Fuel Services is a global energy management company involved in providing energy procurement advisory services, supply fulfillment and transaction and payment management solutions to commercial and industrial customers, principally in the aviation, marine and land transportation industries. World Fuel Services sells fuel and delivers services to its clients at more than 8,000 locations in more than 200 countries and territories worldwide.

For more information, call 305-428-8000 or visit www.wfscorp.com.


Contacts

Ira M. Birns,
Executive Vice President &
Chief Financial Officer

Glenn Klevitz,
Vice President & Treasurer
305-428-8000

DUBLIN--(BUSINESS WIRE)--The "Flow Computer Oil Gas Market - Growth, Trends, Forecasts (2020 - 2025)" report has been added to ResearchAndMarkets.com's offering.


The Flow Computer Oil Gas Market is expected to grow at a CAGR of 4.83% during the forecast period. The growth can be attributed to the growing need for reliable flow and high-tech computing systems and the continually evolving data computational capacity of flow computers.

Over the past decade, the shale boom and changing oil and gas markets have driven the growth of oil and gas production, much of which has been enabled by advancement in communications and computing technology. The modern shale production well pad designs require for 8 to 24 wells, each of which may produce oil and natural gas. The economics of the modern oil and gas field requires concentration of measurement controls in a single location.

Companies Mentioned

  • Schneider Electric SE
  • ABB Ltd.
  • Honeywell International Inc.
  • Emerson Electric Company
  • Bedrock Automation Platforms, Inc. (Maxim Integrated Products, Inc.)
  • Yokogawa Electric Corporation
  • Quorum Business Solutions, Inc.
  • OMNI Flow Computers, Inc.
  • Dynamic Flow Computers, Inc.

Key Market Trends

Evolving Data Computational Capacity of Flow Computers

  • The development of single, rugged platform equipped with consolidated measurement and controls, edge computing, advanced connectivity and intrinsic cyber security by many players for the oil and gas industry has led to the expansion of flow computer processing capabilities.
  • Many players like Quorum are already offering integrated solutions for core processing demands across the upstream, midstream and downstream segments of the value chain. Quorum offers its software platform to more than 75% of the top oil and gas producers in the United States.
  • Further product improvements in new and traditional technology flowmeters are also contributing to the data capturing ability of such systems. Vortex and turbine suppliers have now started offering flowmeters with two sensors and simultaneously calibrated dual flowmeter. FCI expanded its Adaptive Sensor Technology (AST) to offer ST80 Series Thermal Mass Flow Meter that has enhanced the rangeability, accuracy, extended service life, and reliability for process industry air/gas flow measurement.
  • The introduction of these sensors have led to the possibility to create new internal and external applications for flow computers. For instance, predictive maintenance along with virtual- and augmented-reality capabilities has the potential to enable remote maintenance and technical support thereby reducing flow measurement costs in day to day operations.

North America to Hold the Largest Market Share

  • The region has been continually increasing Oil Production since the commercial exploration of Shale Oil has gained prominence in the past decade. In 2019, US exports of crude, as well as liquefied natural gas (LNG) and refined products, continue to rise, which aligned perfectly with the new administration's motto of energy dominance for the United States.
  • In September 2019 the country exported 140,000 bpd more crude oil and petroleum products than imported. According to the Energy Information Agency the total crude oil and petroleum net exports is expected to rise up to an average 750,000 bpd in 2020 as compared with the net imports of 520,000 bpd in 2019.
  • The region already has a favourable ecosystem where SCADA is widely applied in the upstream, midstream, and downstream oil and gas sectors . In the upstream sector, its role often is stereotyped as being largely in support of remote data transmission. However, due to the wide and varied use of SCADA in other industrial sectors, this is expected to change. Baker Hughes for instance uses InForce surface control system which combines the hydraulic power to activate downhole tools and the control logic to govern an intelligent well system. PLC controls system functions for more complex completion configurations. It is primarily used where remote operations must be done through existing SCADA.

Key Topics Covered:

1 INTRODUCTION

2 RESEARCH METHODOLOGY

3 EXECUTIVE SUMMARY

4 MARKET DYNAMICS

4.1 Market Overview

4.2 Market Drivers

4.2.1 Growing Need for Reliable Flow and High-Tech Computing Systems

4.2.2 Continually Evolving Data Computational Capacity of Flow Computers.

4.3 Market Restraints

4.3.1 Cyber-Security Threats Deterring Deployment of Advanced Flow Computer Systems

4.3.2 Dynamic Changes in Oil & Gas Prices leading to Reduced Investment in Infrastructure

4.4 Industry Value Chain Analysis

4.5 Assessment of Impact of Covid-19 on the Industry

5 MARKET SEGMENTATION

5.1 Offering

5.1.1 Hardware

5.1.2 Software

5.2 Geography

5.2.1 North America

5.2.2 Europe

5.2.3 Asia-Pacific

5.2.4 Latin America

5.2.5 Middle East and Africa

6 COMPETITIVE LANDSCAPE

6.1 Company Profiles

7 INVESTMENT ANALYSIS

8 MARKET OPPORTUNITIES AND FUTURE TRENDS

For more information about this report visit https://www.researchandmarkets.com/r/czriic


Contacts

ResearchAndMarkets.com
Laura Wood, Senior Press Manager
This email address is being protected from spambots. You need JavaScript enabled to view it.
For E.S.T Office Hours Call 1-917-300-0470
For U.S./CAN Toll Free Call 1-800-526-8630
For GMT Office Hours Call +353-1-416-8900

MIDLAND, Texas--(BUSINESS WIRE)--Concho Resources Inc. (NYSE: CXO) today announced that Jack Harper, President, will present at the Raymond James 16th Annual North American Equities Conference. The presentation will begin at 7:50 AM CT on Tuesday, September 15, 2020.


A live audio webcast of the presentation will be available on the “Events & Presentations” page under the “Investors” section of the Company’s website at www.concho.com. The webcast will be archived and available at the same location after the conclusion of the live event.

Concho Resources Inc.

Concho Resources (NYSE: CXO) is one of the largest unconventional shale producers in the Permian Basin, with operations focused on safely and efficiently developing and producing oil and natural gas resources. We are working today to deliver a better tomorrow for our shareholders, people and communities. For more information about Concho, visit www.concho.com.


Contacts

INVESTOR RELATIONS
Megan P. Hays
Vice President of Investor Relations & Public Affairs
432.685.2533

MEDIA
Mary T. Starnes
Manager of Public Affairs & Corporate Responsibility Strategy
432.221.0477

DUBLIN--(BUSINESS WIRE)--The "Shale Gas Market - Growth, Trends, and Forecasts (2020 - 2025)" report has been added to ResearchAndMarkets.com's offering.


The overall worldwide production of shale gas is about 535.915 bcm per year, in 2018.

The increase in domestic consumption of natural gas is likely to increase the demand for shale gas. Besides this, advancement in horizontal drilling technology and the development of hydraulic fracturing technology have made the shale gas production activity economically viable and also improved access to deeper shale gas deposits. However, technological advancement in the use of renewable energy and government environment policies have affected the shale gas market.

Environmental activists are protesting against shale gas & oil drilling and production activity as it requires lots of water and produced harmful emissions. Whereas, the European Union and many other country's governments are investing in renewable energy technology for clean energy requirements. This, in turn, is expected to hinder the growth of the shale gas market in the coming years.

Companies Mentioned

  • Antero Resources Corp
  • Southwestern Energy Company
  • EQT Corporation
  • Equinor ASA
  • Repsol SA
  • SINOPEC/Shs
  • Chesapeake Energy Corporation
  • Royal Dutch Shell plc
  • Exxon Mobil Corporation
  • Chevron Corporation
  • PETROCHINA/Shs
  • ConocoPhillips
  • Pioneer Natural Resources

Key Market Trends

Increasing Environmental Concerns to Restrain the Market

  • Despite the economic benefits, environmental risks associated with hydraulic fracturing are restraining the shale gas market.
  • Methane gas emissions during the drilling process pose potential air pollution risks. Additionally, incorrect disposal of large volumes of chemically treated water used in hydraulic fracturing operations can potentially cause severe surface water contamination. This has attracted criticism from environment protection bodies and NGOs, around the world. Local farmers and residents have also repeatedly opposed hydraulic fracturing, owing to its impact on health and farming.
  • Additionally, a typical fracking well requires approximately 2-10 million gallons of water during fracking operations, which puts additional strain on the water supply, particularly in the drought-prone regions.
  • In West Texas, where the Permian Basin (which is expected to drive the growth of shale gas activities in the United States ) is located, shale gas companies have already faced opposition and criticism from the farmers, owing to the water shortage due to hydraulic fracturing.
  • The United States Geological Survey (USGS) blamed shale gas activities for the increase in earthquakes in the recent times, in certain parts of the Central and Eastern United States that are well-known for the extraction of oil and gas.
  • Thus, this is expected to restrain the market during the forecast period.

North America to Dominate the Market

  • In 2018, the statistics of the International Trade Center (ITC) observed that the USA climbed to first place in the world ranking of gas producers due to the increasing production of unconventional gas. Major companies are investing in shale gas because it is an excellent option to reduce carbon footprint. However, the IRENA's database has estimated that, over three-quarters of the onshore wind and four-fifths of the solar PV project capacity due to be commissioned in 2020 worldwide should produce cheaper electricity than any coal, oil or natural gas option. This factor is likely to have a negative impact on the ongoing shale gas revolution in the United States.
  • Canada has been known to have significant conventional gas reserves, and the country was a key supplier of natural gas to the United States for decades until the recent shale boom in the country. But with conventional natural gas sources in decline, Canada's industry is turning to unconventional sources, including shale gas. Many oil & gas companies are now exploring and developing shale gas resources in Alberta, British Columbia, Quebec, and New Brunswick, which could balance the difference in shale gas production in the coming future.
  • An estimation by EIA shows that American dry shale gas production in 2018 is about 593.23 bcm and is equal to approximately 69 % of total natural gas production in the United States. The current scenario of the region, demands more natural gas supply in the forecast period, which attracts investment in the exploration and production of shale gas.

Key Topics Covered:

1 INTRODUCTION

2 RESEARCH METHODOLOGY

3 EXECUTIVE SUMMARY

4 MARKET OVERVIEW

4.1 Introduction

4.2 Shale Gas Production and Forecast in billion cubic meter (BCM), till 2025

4.3 Recent Trends and Developments

4.4 Government Policies and Regulations

4.5 Market Dynamics

4.5.1 Drivers

4.5.2 Restraints

4.6 Supply Chain Analysis

4.7 Porter's Five Forces Analysis

5 MARKET SEGMENTATION

5.1 Geography

5.1.1 North America

5.1.2 South America

5.1.3 Asia-Pacific

5.1.4 Europe

5.1.5 Middle-East and Africa

6 COMPETITIVE LANDSCAPE

6.1 Mergers and Acquisitions, Joint Ventures, Collaborations, and Agreements

6.2 Strategies Adopted by Leading Players

6.3 Company Profiles

7 MARKET OPPORTUNITIES AND FUTURE TRENDS

For more information about this report visit https://www.researchandmarkets.com/r/sd0y5t


Contacts

ResearchAndMarkets.com
Laura Wood, Senior Press Manager
This email address is being protected from spambots. You need JavaScript enabled to view it.
For E.S.T Office Hours Call 1-917-300-0470
For U.S./CAN Toll Free Call 1-800-526-8630
For GMT Office Hours Call +353-1-416-8900

LEAWOOD, KS--(BUSINESS WIRE)--TortoiseEcofin today announced upcoming additions to its indices as part of its regular quarterly rebalancing for the third quarter of 2020. Following the close of trading on September 18, 2020, the indices will be rebalanced and as a result, the following changes will become effective.


Ecofin Global Water ESG Index SM
(EGWESG/EGWESGT)

Action

Company

Ticker

Addition

Lindsay Corp

LNN

Addition

Tetra Tech Inc

TTEK

Addition

Montrose Environmental Group Inc

MEG

The full constituent list can be viewed at https://tortoiseadvisors.com/media/1260/egwesg-constituent-overview-61920.pdf

Ecofin Global Digital Payments Infrastructure IndexSM
(TPMT/TPAYMENT)

Action

Company

Ticker

Addition

BigCommerce Holdings Inc

BIGC

The full constituent list can be viewed at https://tortoiseadvisors.com/media/1539/tpmt-constituent-overview-61920.pdf

There were no third quarter rebalancing updates to report for the Tortoise MLP Index® (TMLP) and the Tortoise North American Pipeline IndexSM (TNAP).

The full constituent list for TMLP can be viewed at https://tortoiseadvisors.com/media/1528/tmlp-constituent-overview-61920.pdf

The full constituent list for TNAP can be viewed at https://tortoiseadvisors.com/media/1530/tnap-constituent-overview-61920.pdf

About TortoiseEcofin

TortoiseEcofin focuses on essential assets – those assets and services that are indispensable to the economy and society. We strive to make a positive impact on clients and communities by investing in energy infrastructure and the transition to cleaner energy and by providing capital for social impact projects focused on education and senior housing. TortoiseEcofin brings together strong legacies from Tortoise, with expertise investing across the energy value chain for more than 20 years, and from Ecofin, which unites ecology and finance and has roots back to the early 1990s. To learn more, please visit www.tortoiseadvisors.com.

The Tortoise MLP Index® is a float-adjusted, capitalization weighted index of energy master limited partnerships (MLPs). The index is comprised of publicly traded companies organized in the form of limited partnerships or limited liability companies engaged in transportation, production, processing and/or storage of energy commodities.

The Tortoise North American Pipeline IndexSM is a float-adjusted, capitalization weighted index of pipeline companies that are organized and have their principal place of business in the United States or Canada. A pipeline company is defined as a company that either 1) has been assigned a standard industrial classification (“SIC”) system code that indicates the company operates in the energy pipeline industry or 2) has at least 50% of its assets, cash flow or revenue associated with the operation or ownership of energy pipelines. Pipeline companies engage in the business of transporting natural gas, crude oil and refined products, storing, gathering and processing such gas, oil and products and local gas distribution. The index includes pipeline companies structured as corporations, limited liability companies and master limited partnerships (MLPs).

The Ecofin Global Water ESG Total Return IndexSM is a proprietary, rules-based, modified capitalization-weighted, float-adjusted index comprised of companies that are materially engaged in the water infrastructure or water management industries.

The indices mentioned above are the exclusive property of TIS Advisors, which has contracted with S&P Opco, LLC (a subsidiary of S&P Dow Jones Indices LLC) to calculate and maintain the Tortoise MLP Index®, Tortoise North American Pipeline IndexSM, and Ecofin Global Water ESG IndexSM (the “Indices”). The Indices are not sponsored by S&P Dow Jones Indices or its affiliates or its third party licensors (collectively, “S&P Dow Jones Indices”). S&P Dow Jones Indices will not be liable for any errors or omissions in calculating the Indices. “Calculated by S&P Dow Jones Indices” and its related stylized mark(s) are service marks of S&P Dow Jones Indices and have been licensed for use by TIS Advisors and its affiliates. S&P® is a registered trademark of Standard & Poor’s Financial Services LLC (“SPFS”), and Dow Jones® is a registered trademark of Dow Jones Trademark Holdings LLC (“Dow Jones”).

The Ecofin Global Digital Payments Infrastructure IndexSM represents the existing global digital payments landscape. It is a proprietary, rules-based, modified market capitalization-weighted, float-adjusted index comprised of companies that are materially engaged in digital payments, including merchant processing and settlement, real time record keeping, settlement networks, and Fintech products/ services that facilitate the ease, efficiency, and speed of electronic transactions. This includes companies whose primary business is comprised of one or a combination of the following categories: credit card networks, electronic transaction processing and associated products/services, credit card issuers, electronic transaction processing software (payments Fintech) or online financial services market places.

This index mentioned above is the exclusive property of TIS Advisors and is calculated by Solactive AG (“Solactive”). The financial instruments that are based on the Index are not sponsored, endorsed, promoted or sold by Solactive AG (“Solactive”) in any way and Solactive makes no express or implied representation, guarantee or assurance with regard to: (a) the advisability in investing in the financial instruments; (b) the quality, accuracy and/or the completeness of the Index or the calculations thereof; and/or (c) the results obtained or to be obtained by any person or entity from the use of the Index.

This data is provided for informational purposes only and is not intended for trading purposes. This document shall not constitute an offering of any security, product or service. The addition, removal or inclusion of a security in the index is not a recommendation to buy, sell or hold that security, nor is it investment advice. The information contained in this document is current as of the publication date. TortoiseEcofin makes no representations with respect to the accuracy or completeness of these materials and will not accept responsibility for damages, direct or indirect, resulting from an error or omission in this document. The methodology involves rebalancing and maintenance of the index that is made periodically during each year and may not, therefore, reflect real time information.

Safe Harbor Statement

This press release shall not constitute an offer to sell or a solicitation to buy, nor shall there be any sale of these securities in any state or jurisdiction in which such offer or solicitation or sale would be unlawful prior to registration or qualification under the laws of such state or jurisdiction.


Contacts

Maggie Zastrow at (913) 981-1020 or This email address is being protected from spambots. You need JavaScript enabled to view it.

DUBLIN--(BUSINESS WIRE)--The "Nigeria Energy Requirements Forecasted to 2050" report has been added to ResearchAndMarkets.com's offering.


The scope of this report is the analysis and forecast of energy carriers in Nigeria. Energy is the facilitator of activity. This report focuses on the energy generated from all energy sources in the country, both primary and secondary and quantifies useful energy available for consumption now (2020) and forecasted to 2050.

The various structural changes envisaged in the future such as the decommissioning of back-up generators and the entry of renewables such solar and wind, the emergence of the use of electric vehicles but the ongoing demand for liquid fuels as well as the fall in the demand for coal all form part of the parameters of the scope of the report.

The primary energy carriers of oil, natural gas, coal, hydro-electric and renewables are all analysed as useful energy in the hands of the consumer. Natural gas consumption is combined with the use of oil and coal where it plays the significant role in the generation of electricity The scope outlook is from 2020 to 2050 integrating all end-user energy carrier generation outputs into a coherent energy mix to meet the needs of an increasingly urbanized population and strongly growing economy.

Methodology

The principal methodology used in the report is applying econometric analysis modelling to an extensive database of global and Nigerian time series that include energy, economic, demographic and social indicators.

A global economic outlook and forecast to 2050 is compiled from seven regions which are benchmarked against forecasts from international bodies such as the OECD. The model allows for input by the user who can alter the forecasts to predict different scenarios. The next section deals with the global oil market and specifically with the international oil price. Here again, the user may alter the forecasted oil consumption levels in each of the seven regions. The oil price is forecast based on an ordinary least squares model econometric as outlined in the report.

The Nigerian macroeconomy is dealt with next where an extensive, national accounts forecast table is part of the model (which also allows user input) and is benchmarked to forecasts made by international organizations.

The energy carriers for Nigeria are individually analysed. In the case of oil, a virtual refinery is modeled with the base being the forecasted oil price. A refining margin is added and through the exchange rate petrol and diesel pump prices for Kenya are arrived at. However, the models for petrol and diesel built below both produced poor fits as evidenced by the low adjusted R-squared and hence had inferior predictive abilities. Hence other statistical techniques were used to forecast their values to

2050.

Electricity generation is the sum of the electricity produced by wind, solar, hydro, biomass, coal, oil, gas and back-up generator energy carriers. In the report, all these sources of energy are forecasted using econometric models and other modelling techniques.

Key Topics Covered:

  • Scope
  • Methodology
  • Key Findings
  • World Economic Growth
    • Introduction
    • Corona Virus Shock
    • Impacted Economic Sectors
    • World Economic Growth 2020
  • World Economic Outlook
    • World Economic Drivers
    • Development Economies
    • World Growth Levers
  • Supply and Demand in the World Energy Markets
    • Global Primary Energy Matrix
    • World Oil
    • Sectoral Growth of Energy
    • 2020 Consumption of Energy
    • 2050 Consumption of Energy
    • Oil Price
  • The Nigerian Economy
    • Introduction
    • Corona Virus Pandemic
    • 2020
    • 2021 - 2050
  • Nigeria Energy Matrices
    • Nigeria Primary Energy Matrix
      • Oil
      • Petrol
      • Diesel
      • Electricity
      • Fossil Fuels
      • Renewables
      • 2040
      • Renewable Regulations
      • Cost
      • Battery Storage
      • Solar Photovoltaic and Concentrated
      • Wind
    • Electricity Storage
  • Biography Guy McGregor
  • Biography Simon McGregor
  • Glossary

List of Figures

Figure A - Consumption of Electrical Energy 2018 to 2050

Figure 1 - Maslow's Hierarchy of Needs Triangle

Figure 2 - Forecasts of Global Economic Growth

Figure 3 - Global Economic Growth: Selected Economies

Figure 4 - Nigeria Energy Forecasts 2020 to 2050: Economic Assumptions Table

Figure 5 - World Consumption of Primary Energy 2014 - 2018

Figure 6 - World Consumption of Primary Energy 2020 - 2050

Figure 7 - World Proven Oil Reserves

Figure 8 - Oil Econometric Model Statistics

Figure 9 - Ongoing Consumption of Oil while Price Declines due to Oversupply

Figure 10 - Nigerian Energy Forecasts 2020 to 2050: Oil Consumption Table

Figure 11 - Map Nigeria

Figure 12 - Gross Domestic Product at 2010 Constant Basic Prices

Figure 13 - Nigeria: Expenditure on GDP - 2010 Prices (Naira billions)

Figure 14 - Nigeria: Expenditure on GDP - 2010 Prices (Naira billions)

Figure 15 - Nigerian Economic Growth

Figure 16 - Nigerian Economic Growth closing in on the Population

Figure 17 - World Consumption of Primary Energy

Figure 18 - Position of the size of the Nigerian economy amongst its peers in the world

Figure 19 - Petrol Econometric Model Statistics

Figure 20 - Diesel Econometric Model Statistics

Figure 21 - Domestic Petroleum Product Consumption

Figure 22 - Liquid Fuels Demand

Figure 23 - Fossil Fuel Econometric Model Statistics

Figure 24 - Hydro Econometric Model Statistics

Figure 25 - Electricity Component Generators

Figure 26 - Consumption of Electrical Energy

Figure 27 - Long Term Average of PVOUT

Figure 28 - Distribution of Wind Energy

For more information about this report visit https://www.researchandmarkets.com/r/3zvmfn

About ResearchAndMarkets.com

ResearchAndMarkets.com is the world's leading source for international market research reports and market data. We provide you with the latest data on international and regional markets, key industries, the top companies, new products and the latest trends.


Contacts

ResearchAndMarkets.com
Laura Wood, Senior Press Manager
This email address is being protected from spambots. You need JavaScript enabled to view it.
For E.S.T Office Hours Call 1-917-300-0470
For U.S./CAN Toll Free Call 1-800-526-8630
For GMT Office Hours Call +353-1-416-8900

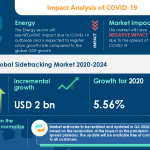
LONDON--(BUSINESS WIRE)--#GlobalSidetrackingMarket--Technavio has been monitoring the sidetracking market and it is poised to grow by USD 2 bn during 2020-2024, progressing at a CAGR of almost 6% during the forecast period. The report offers an up-to-date analysis regarding the current market scenario, latest trends and drivers, and the overall market environment.


Although the COVID-19 pandemic continues to transform the growth of various industries, the immediate impact of the outbreak is varied. While a few industries will register a drop in demand, numerous others will continue to remain unscathed and show promising growth opportunities. Technavio’s in-depth research has all your needs covered as our research reports include all foreseeable market scenarios, including pre- & post-COVID-19 analysis. Download a Free Sample Report on COVID-19 Impacts

Frequently Asked Questions:

  • What are the major trends in the market?
    Adoption of automation in oilfield operations is a major trend driving the growth of the market.
  • At what rate is the market projected to grow?
    The year-over-year growth for 2020 is estimated at 5.56% and the incremental growth of the market is anticipated to be $ 2 bn.
  • Who are the top players in the market?
    Baker Hughes Co., Equinor ASA, Eurasia Drilling Co. Ltd., Halliburton Energy Services, Inc., Nabors Industries Ltd., National Oilwell Varco Inc., Odfjell Drilling Ltd., Schlumberger Ltd., Weatherford International Plc, and Yantai Jereh Oilfield Services Group Co. Ltd., are some of the major market participants.
  • What are the key market drivers and challenges?
    The production optimization of mature oil and gas fields is one of the major factors driving the market.
  • How big is the Europe market?
    The Europe region will contribute 37% of the market share.

The market is fragmented, and the degree of fragmentation will accelerate during the forecast period. Baker Hughes Co., Equinor ASA, Eurasia Drilling Co. Ltd., Halliburton Energy Services, Inc., Nabors Industries Ltd., National Oilwell Varco Inc., Odfjell Drilling Ltd., Schlumberger Ltd., Weatherford International Plc, and Yantai Jereh Oilfield Services Group Co. Ltd. are some of the major market participants. The production optimization of mature oil and gas fields will offer immense growth opportunities. To make most of the opportunities, market vendors should focus more on the growth prospects in the fast-growing segments, while maintaining their positions in the slow-growing segments.

Buy 1 Technavio report and get the second for 50% off. Buy 2 Technavio reports and get the third for free.

View market snapshot before purchasing

Technavio's custom research reports offer detailed insights on the impact of COVID-19 at an industry level, a regional level, and subsequent supply chain operations. This customized report will also help clients keep up with new product launches in direct & indirect COVID-19 related markets, upcoming vaccines and pipeline analysis, and significant developments in vendor operations and government regulations.

Sidetracking Market 2020-2024: Segmentation

Sidetracking Market is segmented as below:

  • Application
    • Onshore
    • Offshore
  • Geographic Landscape
    • APAC
    • Europe
    • MEA
    • North America
    • South America

To learn more about the global trends impacting the future of market research, download a free sample: https://www.technavio.com/talk-to-us?report=IRTNTR41404

Sidetracking Market 2020-2024: Scope

Technavio presents a detailed picture of the market by the way of study, synthesis, and summation of data from multiple sources. The sidetracking market report covers the following areas:

  • Sidetracking Market Size
  • Sidetracking Market Trends
  • Sidetracking Market Industry Analysis

This study identifies the adoption of automation in oilfield operations as one of the prime reasons driving the sidetracking market growth during the next few years.

Technavio suggests three forecast scenarios (optimistic, probable, and pessimistic) considering the impact of COVID-19. Technavio’s in-depth research has direct and indirect COVID-19 impacted market research reports.

Register for a free trial today and gain instant access to 17,000+ market research reports. Technavio's SUBSCRIPTION platform

Sidetracking Market 2020-2024: Key Highlights

  • CAGR of the market during the forecast period 2020-2024
  • Detailed information on factors that will assist sidetracking market growth during the next five years
  • Estimation of the sidetracking market size and its contribution to the parent market
  • Predictions on upcoming trends and changes in consumer behavior
  • The growth of the sidetracking market
  • Analysis of the market’s competitive landscape and detailed information on vendors
  • Comprehensive details of factors that will challenge the growth of sidetracking market vendors

Table of Contents:

Executive Summary

  • Market Overview

Market Landscape

  • Market ecosystem
  • Value chain analysis

Market Sizing

  • Market definition
  • Market segment analysis
  • Market size 2019
  • Market outlook: Forecast for 2019 - 2024

Five Forces Analysis

  • Five Forces Summary
  • Bargaining power of buyers
  • Bargaining power of suppliers
  • Threat of new entrants
  • Threat of substitutes
  • Threat of rivalry
  • Market condition

Market Segmentation by Application

  • Market segments
  • Comparison by Application placement
  • Onshore - Market size and forecast 2019-2024
  • Offshore - Market size and forecast 2019-2024
  • Market opportunity by Application

Customer landscape

  • Overview

Geographic Landscape

  • Geographic segmentation
  • Geographic comparison
  • Europe - Market size and forecast 2019-2024
  • North America - Market size and forecast 2019-2024
  • MEA - Market size and forecast 2019-2024
  • APAC - Market size and forecast 2019-2024
  • South America - Market size and forecast 2019-2024
  • Key leading countries
  • Market opportunity by geography

Drivers, Challenges, and Trends

  • Market drivers
  • Volume driver - Demand led growth
  • Volume driver - Supply led growth
  • Volume driver - External factors
  • Volume driver - Demand shift in adjacent markets
  • Price driver - Inflation
  • Price driver - Shift from lower to higher priced units
  • Market challenges
  • Market trends

Vendor Landscape

  • Overview
  • Vendor landscape
  • Landscape disruption

Vendor Analysis

  • Vendors covered
  • Market positioning of vendors
  • Baker Hughes Co.
  • Equinor ASA
  • Eurasia Drilling Co. Ltd.
  • Halliburton Energy Services, Inc.
  • Nabors Industries Ltd.
  • National Oilwell Varco Inc.
  • Odfjell Drilling Ltd.
  • Schlumberger Ltd.
  • Weatherford International Plc
  • Yantai Jereh Oilfield Services Group Co. Ltd.

Appendix

  • Scope of the report
  • Currency conversion rates for US$
  • Research methodology
  • List of abbreviations

About Us

Technavio is a leading global technology research and advisory company. Their research and analysis focuses on emerging market trends and provides actionable insights to help businesses identify market opportunities and develop effective strategies to optimize their market positions. With over 500 specialized analysts, Technavio’s report library consists of more than 17,000 reports and counting, covering 800 technologies, spanning across 50 countries. Their client base consists of enterprises of all sizes, including more than 100 Fortune 500 companies. This growing client base relies on Technavio’s comprehensive coverage, extensive research, and actionable market insights to identify opportunities in existing and potential markets and assess their competitive positions within changing market scenarios.


Contacts

Technavio Research
Jesse Maida
Media & Marketing Executive
US: +1 844 364 1100
UK: +44 203 893 3200
Email: This email address is being protected from spambots. You need JavaScript enabled to view it.
Website: www.technavio.com/

DALLAS--(BUSINESS WIRE)--Amen Properties, Inc. (Pink Sheets: AMEN) today announced financial results for its fiscal quarter ended June 30, 2020. The Company posted quarterly revenue of $20 thousand and a net loss of $(108) thousand. These results compare to revenue of $642 thousand and net income of $58 thousand for the same quarter last year. The Company’s decline in revenue and profitability for the quarter was driven by decreases in oil and gas production and commodity prices.

Amen announced that the Company’s Board of Directors has approved the payment of a quarterly dividend of $10 per share, to be paid on September 30, 2020 to shareholders of record as of the close of business on September 23, 2020.

Finally, Amen reiterated that its Board has approved a plan whereby the Company will no longer hedge the revenue stream associated with its oil and gas royalties. “Shareholders of Amen need to understand that they hold an un-hedged long oil and gas position and should pursue their own hedging strategy if they are uncomfortable with that risk,” said Kris Oliver, Amen’s Chief Financial Officer.

The Company’s 2020 second quarter report is available for viewing or download from the company’s web site – www.amenproperties.com.

About Amen Properties:

Amen Properties owns a portfolio of properties including real estate and oil and gas interests.

Cautionary Statement:

This document contains forward-looking statements, which involve a number of risks and uncertainties that could cause our actual results to differ materially from those reflected in the forward-looking statements. Forward-looking statements can be identified by use of the words "expect," "project," "may," "might," potential," and similar terms. AMEN Properties, Inc. ("Amen", "we" or the "Company") cautions readers that any forward-looking information is not a guarantee of future performance and that actual results could differ materially from those contained in the forward-looking information. Forward-looking statements involve a number of risks, uncertainties or other factors beyond Amen's control. These factors include, but are not limited to, our ability to implement our strategic initiatives, economic, political and market conditions and price fluctuations, government and industry regulation, U.S. and global competition and other factors. We undertake no obligation to update any forward-looking statement, whether as a result of new information, future events or otherwise.


Contacts

Press and Investor Relations Contact:
Kris Oliver
(972) 999-0494

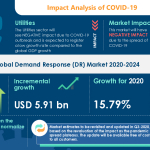
LONDON--(BUSINESS WIRE)--#DemandResponseDRMarket--Technavio has been monitoring the demand response (DR) market and it is poised to grow by USD 5.91 bn during 2020-2024, progressing at a CAGR of over 17% during the forecast period. The report offers an up-to-date analysis regarding the current market scenario, latest trends and drivers, and the overall market environment.


Although the COVID-19 pandemic continues to transform the growth of various industries, the immediate impact of the outbreak is varied. While a few industries will register a drop in demand, numerous others will continue to remain unscathed and show promising growth opportunities. Technavio’s in-depth research has all your needs covered as our research reports include all foreseeable market scenarios, including pre- & post-COVID-19 analysis. Download a Free Sample Report on COVID-19 Impacts

Frequently Asked Questions-

  • What are the major trends in the market?
  • Rising popularity of clean energy technologies is one of the major trends in the market.
  • At what rate is the market projected to grow?
  • Growing at a CAGR of over 17%, the incremental growth of the market is anticipated to be USD 5.91 billion.
  • Who are the top players in the market?
  • ABB Ltd., Cisco Systems Inc., Enel Spa, Honeywell International Inc., Itron Inc., LS Power Development LLC, Oracle Corp., Schneider Electric SE, Siemens AG, and Toshiba Corp. are some of the major market participants.
  • What are the key market drivers and challenges?
  • Gap between electricity supply and demand is one of the major factors driving the market. However, the growing threat of hacking restraints the market growth.
  • How big is the North America market?
  • The North America region will contribute 53% of market growth.

The market is fragmented, and the degree of fragmentation will accelerate during the forecast period. ABB Ltd., Cisco Systems Inc., Enel Spa, Honeywell International Inc., Itron Inc., LS Power Development LLC, Oracle Corp., Schneider Electric SE, Siemens AG, and Toshiba Corp. are some of the major market participants. the gap between electricity supply and demand will offer immense growth opportunities. To make most of the opportunities, market vendors should focus more on the growth prospects in the fast-growing segments, while maintaining their positions in the slow-growing segments.

Buy 1 Technavio report and get the second for 50% off. Buy 2 Technavio reports and get the third for free.

View market snapshot before purchasing

Technavio's custom research reports offer detailed insights on the impact of COVID-19 at an industry level, a regional level, and subsequent supply chain operations. This customized report will also help clients keep up with new product launches in direct & indirect COVID-19 related markets, upcoming vaccines and pipeline analysis, and significant developments in vendor operations and government regulations.

Demand Response (DR) Market 2020-2024: Segmentation

Demand Response (DR) Market is segmented as below:

  • Product
    • Hardware
    • Software
    • Service
  • Geography
    • North America
    • Europe
    • APAC
    • South America
    • MEA

To learn more about the global trends impacting the future of market research, download a free sample: https://www.technavio.com/talk-to-us?report=IRTNTR41453

Demand Response (DR) Market 2020-2024: Scope

Technavio presents a detailed picture of the market by the way of study, synthesis, and summation of data from multiple sources. The demand response (DR) market report covers the following areas:

  • Demand Response (DR) Market Size
  • Demand Response (DR) Market Trends
  • Demand Response (DR) Market Analysis

This study identifies the rising popularity of clean energy technologies as one of the prime reasons driving the demand response (DR) market growth during the next few years.

Technavio suggests three forecast scenarios (optimistic, probable, and pessimistic) considering the impact of COVID-19. Technavio’s in-depth research has direct and indirect COVID-19 impacted market research reports.

Register for a free trial today and gain instant access to 17,000+ market research reports. Technavio's SUBSCRIPTION platform

Demand Response (DR) Market 2020-2024: Key Highlights

  • CAGR of the market during the forecast period 2020-2024
  • Detailed information on factors that will assist demand response (DR) market growth during the next five years
  • Estimation of the demand response (DR) market size and its contribution to the parent market
  • Predictions on upcoming trends and changes in consumer behavior
  • The growth of the demand response (DR) market
  • Analysis of the market’s competitive landscape and detailed information on vendors
  • Comprehensive details of factors that will challenge the growth of demand response (DR) market vendors

Table of Contents:

Executive Summary

Market Landscape

  • Market ecosystem
  • Value chain analysis

Market Sizing

  • Market definition
  • Market segment analysis
  • Market size 2019
  • Market outlook: Forecast for 2019 - 2024

Five Forces Analysis

  • Five forces summary
  • Bargaining power of buyers
  • Bargaining power of suppliers
  • Threat of new entrants
  • Threat of substitutes
  • Threat of rivalry
  • Market condition

Market Segmentation by Product

  • Market segments
  • Comparison by Product
  • Hardware and software - Market size and forecast 2019-2024
  • Service - Market size and forecast 2019-2024
  • Market opportunity by Product

Market Segmentation by End-user

  • Market segments
  • Comparison by End-user
  • Industrial - Market size and forecast 2019-2024
  • Residential - Market size and forecast 2019-2024
  • Commercial - Market size and forecast 2019-2024
  • Market opportunity by End-user

Customer landscape

Geographic Landscape

  • Geographic segmentation
  • Geographic comparison
  • North America - Market size and forecast 2019-2024
  • Europe - Market size and forecast 2019-2024
  • APAC - Market size and forecast 2019-2024
  • South America - Market size and forecast 2019-2024
  • MEA - Market size and forecast 2019-2024
  • Key leading countries
  • Market opportunity by geography
  • Volume driver- Demand led growth
  • Market challenges
  • Market trends

Vendor Landscape

  • Overview
  • Vendor landscape
  • Landscape disruption

Vendor Analysis

  • Vendors covered
  • Market positioning of vendors
  • ABB Ltd.
  • Cisco Systems Inc.
  • Enel Spa
  • Honeywell International Inc.
  • Itron Inc.
  • LS Power Development LLC
  • Oracle Corp.
  • Schneider Electric SE
  • Siemens AG
  • Toshiba Corp.

Appendix

  • Scope of the report
  • Currency conversion rates for US$
  • Research methodology
  • List of abbreviations


About Us

Technavio is a leading global technology research and advisory company. Their research and analysis focuses on emerging market trends and provides actionable insights to help businesses identify market opportunities and develop effective strategies to optimize their market positions. With over 500 specialized analysts, Technavio’s report library consists of more than 17,000 reports and counting, covering 800 technologies, spanning across 50 countries. Their client base consists of enterprises of all sizes, including more than 100 Fortune 500 companies. This growing client base relies on Technavio’s comprehensive coverage, extensive research, and actionable market insights to identify opportunities in existing and potential markets and assess their competitive positions within changing market scenarios.


Contacts

Technavio Research

Jesse Maida

Media & Marketing Executive

US: +1 844 364 1100

UK: +44 203 893 3200

Email: This email address is being protected from spambots. You need JavaScript enabled to view it.

Website: www.technavio.com/

DUBLIN--(BUSINESS WIRE)--The "Kenyan Energy Requirements Forecasted to 2050" report has been added to ResearchAndMarkets.com's offering.


The scope of this report is the analysis and forecast of energy carriers in Kenya. The report focuses on the energy generated from all sources in the country, both primary and secondary. It quantifies useful energy available for consumption now (2020) and forecast to 2050.

Kenya's energy journey from a primary biomass-based country through geothermal, hydro and solar and wind are all analysed in detail and forecasted over the period. Government's Kenya Vision 2030 aspires to transform Kenya from low income status into a middle-income country and a key element to this vision is a lower cost of power reaching more broadly across the population. The Programme for Infrastructure Development in Africa is forecasting an additional 140,000 MW of power over for the East African Power Pool. Kenya's share of this is 13,852 MW of planned peak demand by 2038 or an increase of just over 11,000 MW over this 20-year period.

Kenya is moving towards procuring more of its additional power from wind and solar. In recent years the substantial growth in hydro, wind and solar energy led to a decline in generation from oil, gas and coal sources and electricity imports. The report analyses the expected progress of renewable energy over the forecasted period.

The scope outlook is from 2020 to 2050 integrating all end user energy carrier generation outputs into a coherent energy mix to meet the needs of an increasingly urbanized population and growing economy.

Corona Virus Pandemic

The report includes an analysis of the effects of the virus on the Kenyan economy and the sectors most impacted by the pandemic.

Methodology

The principal methodology used in the report is applying econometric analysis modelling to an extensive database of global and Kenyan time series that include energy, economic, demographic and social indicators.

A global economic outlook and forecast to 2050 is compiled from seven regions which are benchmarked against forecasts from international bodies such as the OECD. The model allows for input by the user who can alter the forecasts to predict different scenarios. The next section deals with the global oil market and specifically with the international oil price. Here again the user may alter the forecasted oil consumption levels in each of the seven regions. The oil price is forecast based on an ordinary least squares econometric model as outlined in the report.

An extensive, national accounts forecast table is part of the model (which also allows us-er input) and is benchmarked to forecasts made by international organizations e.g. OECD and EIA).

The energy carriers for Kenya are individually analysed. In the case of oil, a virtual refinery is modeled with the base being the forecasted oil price. A refining margin is added and through the exchange rate petrol and diesel pump prices for Kenya is arrived at. The price for petrol is forecast to 2050 as part of the petrol econometric model used together with real household consumption expenditure to arrive at petrol volumes. Diesel volumes are forecast using real Gross Domestic Fixed Investment, the Kenyan Urban Population and Kenya Petrol sales.

Electricity generation is the sum of the electricity produced by wind, solar, hydro, biomass, coal, oil, gas and geothermal energy carriers. In the report all these sources of energy are forecasted using econometric models and other modelling techniques.

Key Topics Covered:

  • Scope
  • Methodology
  • Key Findings
  • World Economic Growth
  • Introduction
  • Corona Virus Shock
  • Impacted Economic Sectors
  • World Economic Growth 2020
  • World Economic Outlook
  • World Economic Drivers
  • Developing Economies
  • World Growth Levers
  • Supply and Demand in the World Energy Markets
  • Global Primary Energy Matrix
  • World Oil
  • Sectoral Growth of Energy
  • 2020 Consumption of Energy
  • 2050 Consumption of Energy
  • Oil Price
  • The Kenyan Economy
  • Introduction
  • Corona Virus Pandemic
  • 2020
  • 2021 - 2050
  • Kenya Energy Matrices
  • Kenya Primary Energy Matrix
  • Oil
  • Petrol
  • Diesel
  • Wind
  • Energy Supply Matrix
  • Electricity Storage
  • Glossary and References

Companies Mentioned

  • Olkaria Geothermal Power Station
  • Lake Turkana Wind Power Station
  • Garissa Solar Power

For more information about this report visit https://www.researchandmarkets.com/r/t6un9


Contacts

ResearchAndMarkets.com
Laura Wood, Senior Press Manager
This email address is being protected from spambots. You need JavaScript enabled to view it.
For E.S.T Office Hours Call 1-917-300-0470
For U.S./CAN Toll Free Call 1-800-526-8630
For GMT Office Hours Call +353-1-416-8900

PARIS--(BUSINESS WIRE)--EODev (Energy Observer Developments) announces the closing of a first round of funding to accelerate the industrialization and commercialization of its solutions developed around the latest hydrogen technologies.


Thanks to a seed round mid-2019, EODev was able to set up its operational structure, to sign its first strategic agreements and contracts, and to finance and design prototypes.

Today, EODev announces the closing of its first round of funding, for a total amount of €20 million, thus positioning itself as one of the innovative players in the French hydrogen industry, whose growth is now a government priority.

This funding will accelerate the industrialization and commercialization of sustainable, reliable, innovative, and accessible energy solutions. EODev's products address the entire energy chain: medium-power hydrogen power generators (GEH2®); on-board hydrogen energy systems (REXH2®) for maritime and river use (propulsion and hotel load), and mobile floating hydrogen refueling stations (STSH2) for the production and distribution of green hydrogen.

EODev could count on the complete confidence and support of its shareholders and long-time partners in the Energy Observer Odyssey (the Accor Group and Thélem Assurances), and on the contribution of new industrial players involved in the project (the Monnoyeur Group). This commitment demonstrates the technical excellence of the products offered and the relevance of a strategy resolutely oriented towards the energy transition.

With technologies directly addressing the demand for an efficient and accessible hydrogen use with a limited environmental footprint, EODev is ready to contribute to the ambitions announced by the government as part of the "France Relance" plan, which marks a watershed in the support of the entire hydrogen industry.

Created in March 2019, EODev is the result of the research and development carried out on board Energy Observer, the first energy self-sufficient hydrogen vessel to circumnavigate the world. The company thus benefits from the expertise acquired by its engineers and validated over the 30,000 nautical miles its laboratory boat has already covered since 2017, using hydrogen / fuel cell technologies.

About EODev
Based in Saint-Malo (France), EODev is a subsidiary of the Energy Observer Group, an organization bringing together both expeditions and innovations, and developing solutions proving that another future, more respectful of mankind and nature, is possible. The company's ambition is to be a key player and an accelerator of the energy transition by offering sustainable, reliable, and accessible industrial solutions. The products and solutions developed by EODev are based on the smart and optimized use of energy mixes combining different renewable energy sources and hydrogen as a storage means. The company also offers energy mix optimization services with its Energy Consulting Department: Energy Designer.
www.energy-observer-developments.com


Contacts

Media:
This email address is being protected from spambots. You need JavaScript enabled to view it.
Joséphine Guinard
+33 (0)7 86 43 79 91

NEW YORK--(BUSINESS WIRE)--#exploration--Hess Corporation (NYSE:HES) announced today that John Hess, Chief Executive Officer, will participate in a Fireside Chat at the J.P. Morgan U.S. All Stars Conference September 15 at noon Eastern Time.


A live audio webcast and a replay of the discussion will be accessible via Hess Corporation’s website.

Hess Corporation is a leading global independent energy company engaged in the exploration and production of crude oil and natural gas. More information on Hess Corporation is available at https://www.hess.com/.

Cautionary Statements

This presentation will contain projections and other forward-looking statements within the meaning of Section 27A of the Securities Act of 1933 and Section 21E of the Securities Exchange Act of 1934. These projections and statements reflect the company’s current views with respect to future events and financial performance. No assurances can be given, however, that these events will occur or that these projections will be achieved, and actual results could differ materially from those projected as a result of certain risk factors. A discussion of these risk factors is included in the company’s periodic reports filed with the Securities and Exchange Commission.


Contacts

Investors:
Jay Wilson
(212) 536-8940
This email address is being protected from spambots. You need JavaScript enabled to view it.

Media:
Lorrie Hecker
(212) 536-8250
This email address is being protected from spambots. You need JavaScript enabled to view it.

DUBLIN--(BUSINESS WIRE)--The "Green Technology and Sustainability Market Research Report: By Technology, Application - Global Industry Size, Share, Trends, Growth Analysis and Forecast Report to 2030" report has been added to ResearchAndMarkets.com's offering.


Compared to $8.3 billion in 2019, the industry is predicted to generate revenue of $57.8 billion in 2030. Additionally, between 2020 and 2030 (forecast period), the market would advance at a CAGR of 20.0%.

Due to the rising awareness about the harmful effects of greenhouse gas emission on the environment, the need for low-carbon electricity is increasing, which is driving the global green technology and sustainability market. Governments and utility firms around the world are focusing on generate power from renewable sources like the sun, wind, and water, to reduce the carbon footprint. By employing artificial intelligence (AI), the created energy can be stored for cloudy days, when the photovoltaic (PV) panels cannot function.

Thus, with an increase in the renewable power capacity and integration of advanced systems to store the energy, the green technology and sustainability market is growing.

Green Buildings to be Largest Application Area till 2030

Green buildings are expected to continue dominating the green technology and sustainability market till 2030. This is attributed to the fact that since buildings consume a lot of power, thus resulting in air pollution, the focus on making them energy-efficient is dire. By using green technologies during the construction and operation of buildings, the energy usage and wastage can be significantly reduced, therefore despite their high capital requirement, they are finding widespread adoption, thus driving the market.

During the forecast period, the AI and analytics category would witness the fastest growth in the green technology and sustainability market, at a CAGR of 21.5%. It would be because of rapid adoption of these technologies in urban planning advancement, ecological outline creation for building structures, and spatial evaluation. In addition, to transition to smart manufacturing processes, the adoption of AI and analytics is necessary.

In 2019, North America was the largest green technology and sustainability market, due to the heavy investments granted to the residential, industrial, and commercial sectors for the deployment of emerging technologies, by private and public companies. In the coming years, Asia-Pacific (APAC) is projected to grow the fastest in the industry, on account of the increasing awareness about environmental damage. Further, with the booming population, the demand for electricity is rising, which contributed to global warming, ultimately.

Key Topics Covered:

Chapter 1. Research Background

Chapter 2. Research Methodology

Chapter 3. Executive Summary

Chapter 4. Introduction

4.1 Definition of Market Segments

4.1.1 By Technology

4.1.1.1 IoT

4.1.1.2 AI and analytics

4.1.1.3 Cloud computing

4.1.1.4 Blockchain

4.1.1.5 Digital twin

4.1.1.6 Others

4.1.2 By Application

4.1.2.1 Green buildings

4.1.2.2 Environment management

4.1.2.3 Air quality management

4.1.2.4 Water and wastewater management

4.1.2.5 Solid waste management

4.1.2.6 Climate change management

4.1.2.7 Others

4.2 Value Chain Analysis

4.3 Market Dynamics

4.3.1 Trends

4.3.1.1 Integration of IoT in EMSs

4.3.1.2 Increasing usage of smart grids

4.3.2 Drivers

4.3.2.1 Shifting focus on renewable energy sources

4.3.2.2 Rising demand for low-carbon electricity generation

4.3.2.3 Electrical energy price volatility

4.3.2.4 Favorable government initiatives

4.3.2.5 Rising adoption of building automation

4.3.2.6 Rising need to reduce operating costs

4.3.2.7 Impact analysis of drivers on market forecast

4.3.3 Restraints

4.3.3.1 Energy networks vulnerable to cyberattacks

4.3.3.2 Huge costs of deployment

4.3.3.3 Long payback period for energy-intensive industries

4.3.3.4 Impact analysis of restraints on market forecast

4.3.4 Opportunities

4.3.4.1 Use of AI-enabled robots for improved sustainability management

4.3.4.2 Technological developments at workplace and asset management

4.4 Porter's Five Forces Analysis

Chapter 5. Global Market Size and Forecast

5.1 By Technology

5.2 By Application

5.3 By Region

Chapter 6. North America Market Size and Forecast

Chapter 7. Europe Market Size and Forecast

Chapter 8. APAC Market Size and Forecast

Chapter 9. LATAM Market Size and Forecast

Chapter 10. MEA Market Size and Forecast

Chapter 11. Competitive Landscape

11.1 Competitive Analysis

11.2 List of Players and Their Offerings

11.3 Strategic Developments of Players

11.3.1 Mergers and Acquisitions

11.3.2 Partnerships

11.3.3 Product Launches

11.3.4 Client Wins

Chapter 12. Company Profiles

  • CropX Inc.
  • Minesense Technologies Ltd.
  • ConSensys Inc.
  • Pycno Industries Inc.
  • Semtech Corporation
  • Enviance Inc.
  • General Electric Company
  • Verdigris Technologies Inc.
  • IBM Corporation
  • WINT
  • Hortau Inc.
  • SMAP Energy Limited
  • Treevia Forest Technologies
  • Taranis Visual Ltd.
  • Trace Genomics Inc.
  • Xylum Inc.

For more information about this report visit https://www.researchandmarkets.com/r/7h65ku


Contacts

ResearchAndMarkets.com
Laura Wood, Senior Press Manager
This email address is being protected from spambots. You need JavaScript enabled to view it.

For E.S.T Office Hours Call 1-917-300-0470
For U.S./CAN Toll Free Call 1-800-526-8630
For GMT Office Hours Call +353-1-416-8900

LONDON--(BUSINESS WIRE)--#energyindustry--Infiniti Research is the world's leading independent provider of strategic market intelligence solutions. Our market intelligence services are designed to connect your organization’s goals with global opportunities. Infiniti Research has announced the completion of its latest article on spearheading transformations in the oil and gas supply chain.


As the supply chain spending by operators has been cut back due to crumbling crude prices, the Oil Field Services and Equipment companies (OFSE) have been losing business. To cope with the changing market conditions, companies in the oil and gas industry have cut down costs and, in some cases, made changes to their business models to thrive. Players in the oil and gas industry are confronting significant strategic challenges and complex decision-making due to volatile market conditions. Request a free proposal to know more about how we can help oil and gas companies formulate sustainable business strategies.

According to experts at Infiniti Research, here are some critical considerations for the C-suite in the oil and gas sector to stabilize revenues and cope with market transformations:

Cost-cutting

The oil and gas industry has grown exponentially over the years, owing to soaring crude prices in both domestic and international markets. However, the current oil and gas industry landscape and the recurring need to cut down prices have come as a big blow for oil and gas companies. Operators are now rediscovering the spirit of efficiency to overcome these challenging times. Tactical initiatives such as project postponements, expenditure cuts, and staff reductions are increasingly being given importance, and OFSE firms are responding by cutting back on their own service and manufacturing footprint to cope with less activity, lowering their costs for solutions delivered.

In the past 15 years, we have undertaken 500+ projects across all major regions and industry sectors, helping clients plan and execute the strategies required to sustain and grow. Get in touch with our experts for more insights on our market intelligence solutions and how it can help your organization.

New revenue models

New revenue models have emerged in the oil and gas sector, including performance-based contracts that combine equipment and services and participation in project financing. This allows oil and gas companies to give operators more flexibility by reducing their cost base and need for investment during challenging times.

Investment in new technologies

Investments in modern technologies are facilitating oil and gas companies to capture new growth and attain sustainability. Many OFSEs now are redesigning equipment using modular designs to drive out inefficiencies and achieve maximum cost reduction.

Our custom market intelligence solutions can help oil and gas companies to manage uncertainty and improve performance through analysis, insights, and benchmarking. To learn more, request for more information.

About Infiniti Research

Established in 2003, Infiniti Research is a leading market intelligence company providing smart solutions to address your business challenges. Infiniti Research studies markets in more than 100 countries to help analyze competitive activity, see beyond market disruptions, and develop intelligent business strategies. To know more, visit:https://www.infinitiresearch.com/about-us


Contacts

Infiniti Research
Anirban Choudhury
Marketing Manager
US: +1 844 778 0600
UK: +44 203 893 3400
https://www.infinitiresearch.com/contact-us

WARRENVILLE, Ill.--(BUSINESS WIRE)--Fuel Tech, Inc. (NASDAQ: FTEK), a technology company providing advanced engineering solutions for the optimization of combustion systems, emissions control and water treatment in utility and industrial applications, today announced that President & CEO Vincent J. Arnone is scheduled to present at the 22nd Annual H.C. Wainwright Global Investment Conference on Tuesday, September 15, 2020 at 10:00 am EDT. The presentation will be accessible on the "Investor Relations" section of Fuel Tech’s website at www.ftek.com.


About Fuel Tech

Fuel Tech develops and commercializes state-of-the-art proprietary technologies for air pollution control, process optimization, water treatment, and advanced engineering services. These technologies enable customers to operate in a cost-effective and environmentally sustainable manner. Fuel Tech is a leader in nitrogen oxide (NOx) reduction and particulate control technologies and its solutions have been in installed on over 1,200 utility, industrial and municipal units worldwide. The Company’s FUEL CHEM® technology improves the efficiency, reliability, fuel flexibility, boiler heat rate, and environmental status of combustion units by controlling slagging, fouling, corrosion, and opacity. Water treatment technologies include DGI™ Dissolved Gas Infusion Systems which utilize a patented nozzle to deliver supersaturated oxygen solutions and other gas-water combinations to target process applications or environmental issues. This infusion process has a variety of applications in the water and wastewater industries, including remediation, aeration, biological treatment, and wastewater odor management. Many of Fuel Tech’s products and services rely heavily on the Company’s exceptional Computational Fluid Dynamics modeling capabilities, which are enhanced by internally developed, high-end visualization software. For more information, visit Fuel Tech’s web site at www.ftek.com.

NOTE REGARDING FORWARD-LOOKING STATEMENTS

This press release contains “forward-looking statements” as defined in Section 21E of the Securities Exchange Act of 1934, as amended, which are made pursuant to the safe harbor provisions of the Private Securities Litigation Reform Act of 1995 and reflect Fuel Tech’s current expectations regarding future growth, results of operations, cash flows, performance and business prospects, and opportunities, as well as assumptions made by, and information currently available to, our management. Fuel Tech has tried to identify forward-looking statements by using words such as “anticipate,” “believe,” “plan,” “expect,” “estimate,” “intend,” “will,” and similar expressions, but these words are not the exclusive means of identifying forward-looking statements. These statements are based on information currently available to Fuel Tech and are subject to various risks, uncertainties, and other factors, including, but not limited to, those discussed in Fuel Tech’s Annual Report on Form 10-K in Item 1A under the caption “Risk Factors,” and subsequent filings under the Securities Exchange Act of 1934, as amended, which could cause Fuel Tech’s actual growth, results of operations, financial condition, cash flows, performance and business prospects and opportunities to differ materially from those expressed in, or implied by, these statements. Fuel Tech undertakes no obligation to update such factors or to publicly announce the results of any of the forward-looking statements contained herein to reflect future events, developments, or changed circumstances or for any other reason. Investors are cautioned that all forward-looking statements involve risks and uncertainties, including those detailed in Fuel Tech’s filings with the Securities and Exchange Commission.


Contacts

Vince Arnone
President and CEO
(630) 845-4500

Devin Sullivan
Senior Vice President
The Equity Group Inc.
(212) 836-9608

Chevron’s Delo Traveling Technology Lab wins top honors for Best Road Show & Multivenue Event Activation

SAN RAMON, Calif.--(BUSINESS WIRE)--Chevron Products Company, a division of Chevron U.S.A. Inc., maker of technologically advanced engine oils, lubricants and coolants, is proud to announce the Delo® Traveling Technology Lab (DTTL) has been awarded top honors for best road show & multivenue event by EXHIBITOR Magazine, a leading publication for trade show and event exhibitions. EXHIBITOR’s Corporate Event Awards are judged on the level of innovation and their measurable results.


“The Delo Traveling Technology Lab represents a massive step change in how Chevron brings information to customers by leveraging advantages in digital technology delivered in the most compelling way,” said James Booth, Commercial Sector Manager, North America at Chevron. “We’re proud to accept this award in recognition of the value we are bringing to our customers by helping the heavy-duty trucking and equipment industry understand the latest trends and providing timely business insights.”

The Chevron DTTL consists of 11 interactive exhibits, including the use of virtual reality (VR) and augmented reality (AR). Centered inside and outside a double-sized trailer, attendees have the opportunity to build a maintenance shop, fly through an engine in VR, formulate oil, test their coolant, select the best products for the vehicles, and take a closer look at proof of performance in AR. The interactive exhibits cohesively tell the story of the life of a heavy-duty powertrain and how lubricant technology can impact the bottom line of businesses that depend on heavy-duty trucks and equipment.

The level of engagement the Chevron DTTL has brought to customers and the feedback from exhibit visitors validates Chevron’s customer-focused and forward-thinking methods of industry and product education. Chevron is proud of the ways this unique digital experience has elevated customer awareness of complex technical information, with the result of enabling customers to better understand the needs of their heavy-duty vehicles and equipment and the solutions available to meet those needs.

In addition to the overwhelmingly positive feedback Chevron has received from exhibit visitors, this industry-leading award amplifies Chevron’s determination to provide above-and-beyond customer service.

“The fact this award is global, judged by a formidable multidisciplinary panel, and has a prestigious list of former winners, is a testament to the vision and fortitude of the DTTL team, including agency partner Deckel & Moneypenny,” said Booth. “As the world continues to adjust to uncertainties around when public gatherings will recommence, it is the forward-thinking approach that has readily allowed Chevron to pivot to virtual events.”

About Chevron Products Company

Chevron Products Company is a division of an indirect, wholly owned subsidiary of Chevron Corporation (NYSE: CVX) headquartered in San Ramon, CA. A full line of lubrication and coolant products are marketed through this organization. Select brands include Havoline®, Delo® and Havoline Xpress Lube®. Chevron Intellectual Property LLC owns patented technology in advanced lubricants products, new generation base oil technology and coolants.

For more information go to: www.ChevronLubricants.com


Contacts

Ryan Donough
BCW for Chevron’s Delo Brand
This email address is being protected from spambots. You need JavaScript enabled to view it.
415-403-8311

DUBLIN--(BUSINESS WIRE)--The "Light Tower Market - By Lighting, By Application, and By Region: Global Industry Perspective, Market Size, Statistical Research, Market Intelligence, Comprehensive Analysis, Historical Trends, and Forecasts, 2019-2025" report has been added to ResearchAndMarkets.com's offering.


This report analyzes and estimates the light tower market at global, regional, and country level. The research study provides historic data from 2015 to 2019 along with the forecast from 2020 to 2025 based on revenue (USD Billion). The report offers detailed insights of the light tower market drivers and restraints along with their impact analysis at a global level from 2015 to 2025.

The report covers an in-depth analysis of the strategies adopted by major competitors in the global light tower market. To understand the competitive landscape in the light tower market, an analysis of Porter's Five Forces model is also included. The research study comprises of market attractiveness analysis, wherein all the segments are benchmarked on the basis of their market size and growth rate.

The research study provides a decisive view on the global light tower market based on lighting, product, technology, power source, application, and region. All the segments of the market have been analyzed based on the past, present, and future trends. The market is estimated from 2019 to 2025.

Deployment of light towers is generally favored at mining, construction, and oil & gas sites to ensure safety while performing operations. Owing to the significantly increasing construction projects across the globe and growing fatality rate at worksites owing to insufficient lighting conditions, the demand for light towers is likely to propel drastically throughout the study timeframe, thereby escalating the global light tower market.

The global light tower market is segmented as:

Global Light Tower Market: By Lighting Segmentation Analysis

  • Electric
  • LED
  • Metal Halide
  • Others

Global Light Tower Market: By Product Segmentation Analysis

  • Mobile
  • Stationary

Global Light Tower Market: By Technology Segmentation Analysis

  • Hydraulic Lifting System
  • Manual Lifting System

Global Light Tower Market: By Power Source Segmentation Analysis

  • Direct
  • Diesel
  • Solar
  • Others

Global Light Tower Market: By Application Segmentation Analysis

  • Emergency & Disaster Relief
  • Construction
  • Mining
  • Infrastructure Development
  • Highway Construction
  • Bridge Construction
  • Railway Line Construction
  • Others
  • Military & Defense
  • Oil & Gas
  • Others

Global Light tower Market: Regional Segmentation Analysis

  • North America
  • The U.S.
  • Canada
  • Europe
  • France
  • The UK
  • Spain
  • Germany
  • Italy
  • Rest of Europe
  • Asia Pacific
  • China
  • Japan
  • India
  • South Korea
  • Southeast Asia
  • Rest of Asia Pacific
  • Latin America
  • Brazil
  • Mexico
  • Rest of Latin America
  • Middle East & Africa
  • GCC
  • South Africa
  • Rest of Middle East & Africa

Company Profiles

  • Generac Power Systems
  • Wacker Neuson Group
  • Doosan Portable Power
  • Culorado Standby
  • The Will-Burt Company
  • DMI Light Towers
  • Progress Sular Sulutions LLC
  • Larson Electronics LLC
  • Trime Srl
  • Atlas Copco
  • J C Bamford Excavators Ltd.
  • Light Boy Co. Ltd.
  • Inmesul SL
  • LTA Projects
  • Chicago Pneumatic
  • Aska Equipments Ltd.
  • Youngman Richardson & Co. Ltd.
  • Terex Corporation
  • ulikara Lighting Towers

For more information about this report visit https://www.researchandmarkets.com/r/vdbxzr


Contacts

ResearchAndMarkets.com
Laura Wood, Senior Press Manager
This email address is being protected from spambots. You need JavaScript enabled to view it.
For E.S.T Office Hours Call 1-917-300-0470
For U.S./CAN Toll Free Call 1-800-526-8630
For GMT Office Hours Call +353-1-416-8900

BRYN MAWR, Pa.--(BUSINESS WIRE)--Essential Utilities Inc. (NYSE: WTRG) announced that Shreen Williams of Philadelphia has been hired as director, risk management for their water and gas utility operations. As director, Shreen will report directly to Essential’s General Counsel, Chris Luning.


Williams comes to Essential from the City of Philadelphia where she was risk management claims manager, responsible for the city’s claims unit including a staff of professional claims adjusters who investigated all property and personal injury claims to determine liability under applicable laws. In addition to negotiating and settling such claims against the city, she was also responsible for recovering debt owed to the city as a result of damage to city property and working proactively with the safety and loss prevention staff to mitigate risk through the establishment of public safety practices and initiatives.

“Shreen’s extensive experience in risk management in an organization as large as the City of Philadelphia, coupled with her previous experience with insurance companies and other private sector experience, has provided her with a broad and well-rounded background that will be put to great use at Essential,” said Luning.

Williams earned her Bachelor of Business Administration at Temple University and her Master of Business Administration at LaSalle University, both in Philadelphia.

About Essential

Essential is one of the largest publicly traded water, wastewater and natural gas providers in the U.S., serving approximately 5 million people across 10 states under the Aqua and Peoples brands. Essential is committed to excellence in proactive infrastructure investment, regulatory expertise, operational efficiency and environmental stewardship. The company recognizes the importance water and natural gas play in everyday life and is proud to deliver safe, reliable services that contribute to the quality of life in the communities it serves. For more information, visit http://www.essential.co.

WTRGG


Contacts

Donna Alston
Communications
M: 484.368.4720
This email address is being protected from spambots. You need JavaScript enabled to view it.

LONDON--(BUSINESS WIRE)--#UnconventionalGasMarket--Technavio has been monitoring the unconventional gas market and it is poised to grow by $ 41.76 bn during 2020-2024, progressing at a CAGR of almost 7% during the forecast period. The report offers an up-to-date analysis regarding the current market scenario, latest trends and drivers, and the overall market environment.


Although the COVID-19 pandemic continues to transform the growth of various industries, the immediate impact of the outbreak is varied. While a few industries will register a drop in demand, numerous others will continue to remain unscathed and show promising growth opportunities. Technavio’s in-depth research has all your needs covered as our research reports include all foreseeable market scenarios, including pre- & post-COVID-19 analysis. Download a Free Sample Report on COVID-19 Impacts

Frequently Asked Questions:

  • What are the major trends in the market?
    Technology development in hydraulic fracturing process is a major trend driving the growth of the market.
  • At what rate is the market projected to grow?
    The year-over-year growth for 2020 is estimated at 5.67% and the incremental growth of the market is anticipated to be $ 41.76 bn.
  • Who are the top players in the market?
    BP Plc, Chevron Corp., ConocoPhillips Co., Exxon Mobil Corp., PetroChina Co. Ltd., PJSC Gazprom, Royal Dutch Shell Plc, Santos Ltd., Saudi Arabian Oil Co., and YPF SA., are some of the major market participants.
  • What is the key market driver?
    The abundance of unconventional gas resources is one of the major factors driving the market.
  • How big is the Americas market?
    The Americas region will contribute 87% of the market share.

The market is fragmented, and the degree of fragmentation will accelerate during the forecast period. BP Plc, Chevron Corp., ConocoPhillips Co., Exxon Mobil Corp., PetroChina Co. Ltd., PJSC Gazprom, Royal Dutch Shell Plc, Santos Ltd., Saudi Arabian Oil Co., and YPF SA are some of the major market participants. The abundance of unconventional gas resources will offer immense growth opportunities. To make most of the opportunities, market vendors should focus more on the growth prospects in the fast-growing segments, while maintaining their positions in the slow-growing segments.

Buy 1 Technavio report and get the second for 50% off. Buy 2 Technavio reports and get the third for free.

View market snapshot before purchasing

Technavio's custom research reports offer detailed insights on the impact of COVID-19 at an industry level, a regional level, and subsequent supply chain operations. This customized report will also help clients keep up with new product launches in direct & indirect COVID-19 related markets, upcoming vaccines and pipeline analysis, and significant developments in vendor operations and government regulations.

Unconventional Gas Market 2020-2024: Segmentation

Unconventional Gas Market is segmented as below:

  • Type
    • Shale Gas
    • Tight Gas
    • Coalbed Methane
  • End-user
    • Power Generation
    • Residential And Commercial
    • Industrial
    • Others
  • Geography
    • APAC
    • EMEA
    • Americas

To learn more about the global trends impacting the future of market research, download a free sample: https://www.technavio.com/talk-to-us?report=IRTNTR40159

Unconventional Gas Market 2020-2024: Scope

Technavio presents a detailed picture of the market by the way of study, synthesis, and summation of data from multiple sources. The unconventional gas market report covers the following areas:

  • Unconventional Gas Market Size
  • Unconventional Gas Market Trends
  • Unconventional Gas Market Industry Analysis

This study identifies technology development in hydraulic fracturing process as one of the prime reasons driving the unconventional gas market growth during the next few years.

Technavio suggests three forecast scenarios (optimistic, probable, and pessimistic) considering the impact of COVID-19. Technavio’s in-depth research has direct and indirect COVID-19 impacted market research reports.

Register for a free trial today and gain instant access to 17,000+ market research reports. Technavio's SUBSCRIPTION platform

Unconventional Gas Market 2020-2024: Key Highlights

  • CAGR of the market during the forecast period 2020-2024
  • Detailed information on factors that will assist unconventional gas market growth during the next five years
  • Estimation of the unconventional gas market size and its contribution to the parent market
  • Predictions on upcoming trends and changes in consumer behavior
  • The growth of the unconventional gas market
  • Analysis of the market’s competitive landscape and detailed information on vendors
  • Comprehensive details of factors that will challenge the growth of unconventional gas market vendors

Table of Contents:

PART 01: EXECUTIVE SUMMARY

PART 02: SCOPE OF THE REPORT

  • Preface
  • Currency conversion rates for US$

PART 03: MARKET LANDSCAPE

  • Market ecosystem
  • Market characteristics
  • Value chain analysis
  • Market segmentation analysis

PART 04: MARKET SIZING

  • Market definition
  • Market sizing 2019
  • Market outlook
  • Market size and forecast 2019-2024

PART 05: FIVE FORCES ANALYSIS

  • Bargaining power of buyers
  • Bargaining power of suppliers
  • Threat of new entrants
  • Threat of substitutes
  • Threat of rivalry
  • Market condition

PART 06: MARKET SEGMENTATION BY TYPE

  • Market segmentation by type
  • Comparison by type
  • Shale gas - Market size and forecast 2019-2024
  • Tight gas - Market size and forecast 2019-2024
  • Coalbed methane - Market size and forecast 2019-2024
  • Market opportunity by type

PART 07: CUSTOMER LANDSCAPE

PART 08: MARKET SEGMENTATION BY END-USER

  • Market segmentation by end-user
  • Comparison by end-user
  • Power generation - Market size and forecast 2019-2024
  • Residential and commercial - Market size and forecast 2019-2024
  • Industrial - Market size and forecast 2019-2024
  • Others - Market size and forecast 2019-2024
  • Market opportunity by end-user

PART 09: GEOGRAPHIC LANDSCAPE

  • Geographic segmentation
  • Geographic comparison
  • Americas - Market size and forecast 2019-2024
  • APAC - Market size and forecast 2019-2024
  • EMEA - Market size and forecast 2019-2024
  • Key leading countries
  • Market opportunity

PART 10: DECISION FRAMEWORK

PART 11: DRIVERS AND CHALLENGES

  • Market drivers
  • Market challenges

PART 12: MARKET TRENDS

  • Technology development in hydraulic fracturing process
  • Innovation at frac sites to reduce wastage
  • Commoditization of LNG

PART 13: VENDOR LANDSCAPE

  • Overview
  • Landscape disruption
  • Competitive scenario

PART 14: VENDOR ANALYSIS

  • Vendors covered
  • Vendor classification
  • Market positioning of vendors
  • BP Plc
  • Chevron Corp.
  • ConocoPhillips Co.
  • Exxon Mobil Corp.
  • PetroChina Co. Ltd.
  • PJSC Gazprom
  • Royal Dutch Shell Plc
  • Santos Ltd.
  • Saudi Arabian Oil Co.
  • YPF SA

PART 15: APPENDIX

  • Research methodology
  • List of abbreviations
  • Definition of market positioning of vendors

PART 16: EXPLORE TECHNAVIO

About Us

Technavio is a leading global technology research and advisory company. Their research and analysis focuses on emerging market trends and provides actionable insights to help businesses identify market opportunities and develop effective strategies to optimize their market positions. With over 500 specialized analysts, Technavio’s report library consists of more than 17,000 reports and counting, covering 800 technologies, spanning across 50 countries. Their client base consists of enterprises of all sizes, including more than 100 Fortune 500 companies. This growing client base relies on Technavio’s comprehensive coverage, extensive research, and actionable market insights to identify opportunities in existing and potential markets and assess their competitive positions within changing market scenarios.


Contacts

Technavio Research
Jesse Maida
Media & Marketing Executive
US: +1 844 364 1100
UK: +44 203 893 3200
Email: This email address is being protected from spambots. You need JavaScript enabled to view it.
Website: www.technavio.com/

Essential emphasizes need for ongoing infrastructure investment during United for Infrastructure Week

BRYN MAWR, Pa.--(BUSINESS WIRE)--Essential Utilities Inc. (NYSE: WTRG) recognizes United for Infrastructure 2020: A Week to Champion America’s Infrastructure (Sept. 14-21) by raising awareness of the country’s critical need for infrastructure improvements and reporting progress on its planned approximately $950 million capital investment in 2020 in the 10 states where the company provides water and wastewater service as Aqua and natural gas service as Peoples.


Essential has an immense responsibility to provide our customers safe and reliable utility services,” said Essential Chairman and CEO Christopher Franklin. “As we’ve continued to deliver water, wastewater and natural gas services amidst the challenges of COVID-19, we know that repairing and replacing aging infrastructure remains critical to our mission to protect the public health and strengthen communities.”

In 2017, the American Society of Civil Engineers’ Infrastructure Report Card gave the United States a D+ for the state of its infrastructure.

Infrastructure projects are planned and taking place across Essential’s states in 2020, and some of this year’s projects are highlighted below.

Aqua Pennsylvania – Replacing aging water mains throughout Pennsylvania continues to be a large part of Aqua Pennsylvania’s capital project program this year. Aqua Pennsylvania plans to replace approximately 120 miles of aging water mains to improve distribution and reduce service interruptions caused by main breaks. Aqua Pennsylvania also broke ground on an $8 million, 14,700 square-foot laboratory to support the utility’s microbiologists and chemists who perform about 300,000 tests on 30,000 water samples each year.

Aqua Ohio – Aqua Ohio’s planned water and wastewater system improvements this year include completion of the Struthers water treatment plant modernization project and construction of a new Franklin County operations center. Aqua Ohio also began a project to rehabilitate the Ashtabula water treatment plant. The Ashtabula plant project, which Aqua Ohio expects to complete in 2021, includes an engineering master plan for the plant to address future expansion needs.

Aqua North Carolina – Aqua North Carolina has completed the installation of eight new water treatment systems so far this year with plans to install two more in 2020. Aqua North Carolina is also working on several wastewater projects to improve service and reliability including upgrade projects currently underway for three separate wastewater treatment plants in High Point, New Hanover County and Union County.

Aqua Illinois – Aqua Illinois has completed improvements to the Lake Vermilion dam, investing $20 million in this vital resource. Aqua Illinois is preparing for the future with an intensive study of the Joseph Donovan Regional Water Treatment Plant in the City of Kankakee.

Aqua Texas – Aqua Texas plans improvements to water and wastewater service for customers statewide this year. Projects include expansions of three wastewater treatment plants to serve the growing needs of communities in Chambers, Harris and Montgomery counties.

Aqua New Jersey – This year, Aqua New Jersey’s capital plans include upgrades and integrations to SCADA computer systems that monitor and control several wastewater plants to make operations more efficient and improve service for customers. These improvements will be completed in the fourth quarter. Plans also include improvements to drinking water treatment, including a new filtration system at a northwest New Jersey well.

Aqua Indiana – This year, Aqua Indiana’s capital project plans include an expansion of the Hendricks wastewater treatment plant to serve the growing needs of the Avon and Brownsburg communities and unincorporated areas of eastern Hendricks County. Aqua Indiana expects to begin construction this fall and expects to complete the Hendricks expansion project in the first half of 2022.

Aqua Virginia – This year, Aqua Virginia is installing water meters at two of its largest remaining unmetered systems, Lake Caroline in Caroline County and Captain’s Cove in Accomack County. The installation of water meters at these locations means customers pay only for water they use, while promoting conservation. Meters also enable Aqua to measure water losses from the distribution system and identify leaks in customers’ homes. These improvements will be completed in the fourth quarter.

Peoples – In addition to investments included in its long-term infrastructure improvement plan projects in Western Pennsylvania and Kentucky this year, Peoples began a 7-year project on a pipeline system known as Goodwin Tombaugh, which runs through Greene and Washington counties in southwestern Pennsylvania. The 300-mile pipeline replacement project will transform an old gathering system into a new modern distribution system. The Goodwin Tombaugh project will provide multiple benefits including a reduction of methane emissions and continued safe and reliable service to 1,600 residents.

About Aqua

Aqua’s water and wastewater utilities serve more than 3 million people in Pennsylvania, Ohio, North Carolina, Illinois, Texas, New Jersey, Indiana and Virginia. Visit Aqua online at AquaAmerica.com, facebook.com/MyAquaAmerica, and twitter.com/MyAquaAmerica.

About Peoples

Peoples is a natural gas provider serving approximately 740,000 homes and businesses in Western Pennsylvania, West Virginia and Kentucky. The company’s mission is to improve the lives of its customers and to help build long-term economic growth for the regions it serves. For more information about Peoples, visit Peoples-Gas.com and follow Peoples on social media @peoplesnatgas.

About Essential

Essential is one of the largest publicly traded water, wastewater and natural gas providers in the U.S., serving approximately 5 million people across 10 states under the Aqua and Peoples brands. Essential is committed to excellence in proactive infrastructure investment, regulatory expertise, operational efficiency and environmental stewardship. The company recognizes the importance water and natural gas play in everyday life and is proud to deliver safe, reliable services that contribute to the quality of life in the communities it serves. For more information, visit http://www.essential.co.

Forward-Looking Statements

This release contains forward-looking statements within the meaning of the Private Securities Litigation Reform Act of 1995, which generally include words such as “believes,” “expects,” “intends,” “anticipates,” “estimates” and similar expressions. The company can give no assurance that any actual or future results or events discussed in these statements will be achieved. Any forward-looking statements represent its views only as of today and should not be relied upon as representing its views as of any subsequent date. Readers are cautioned that such forward-looking statements are subject to a variety of risks, uncertainties and other factors that may cause the company’s actual results to differ materially from the statements contained in this release. Such forward-looking statements include, but are not limited to, statements relating to the capital to be invested by the water, wastewater and gas distribution divisions of the company. There are important factors that may cause actual results to differ materially from those expressed or implied by such forward-looking statements including the risks and uncertainties described in our Annual Report on Form 10-K, our Quarterly Reports on Form 10-Q, and other filings with the Securities and Exchange Commission. For more information regarding risks and uncertainties associated with the company’s business, please refer to the company’s annual, quarterly and other SEC filings. The company is not under any obligation — and expressly disclaims any such obligation — to update or alter its forward-looking statements whether as a result of new information, future events or otherwise.

WTRGG


Contacts

Gretchen Toner
Communications and Marketing
484.368.4816
This email address is being protected from spambots. You need JavaScript enabled to view it.

Offshore Source Logo

Offshore Source keeps you updated with relevant information concerning the Offshore Energy Sector.

Any views or opinions represented on this website belong solely to the author and do not represent those of the people, institutions or organizations that Offshore Source or collaborators may or may not have been associated with in a professional or personal capacity, unless explicitly stated.

Corporate Offices

Technology Systems Corporation
8502 SW Kansas Ave
Stuart, FL 34997

info@tscpublishing.com