Business Wire News

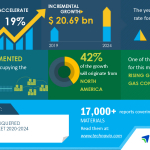
LONDON--(BUSINESS WIRE)--#BiogasMarket--Technavio predicts the global biogas market to grow steadily at a CAGR of almost 6% by 2023. One of the primary drivers for this market is the stringent regulations for the reduction of GHG emissions. Rising quantities of methane, CO2, and GHGs in the atmosphere is leading to rising land and sea temperatures, changes in rainfall and snow patterns, and extreme climatic conditions. Hence, governments around the world are undertaking various initiatives to reduce GHG emissions. Biogas energy plants capture GHGs and use them for energy generation. This is one of the key factors driving the growth of the global biogas market. Download Free Sample Report with COVID-19 Impact Analysis


The global biogas market is a part of the global coal and consumable fuels market. The global biogas market includes companies primarily involved in the production and mining of coal, related products, and other consumable fuels related to the generation of energy. Our research reports provide a holistic analysis, market size and forecast, trends, growth drivers, and challenges, as well as vendor analysis covering around 25 vendors

Latest reports related to biogas market analysis

Global Biomass Power Generation Market 2020-2024

Get FREE Sample Report

Global Utility Battery Market 2020-2024

Get FREE Sample Report

Technavio’s reports are aimed at providing key insights on biogas markets by identifying the key drivers, trends, and, challenges that are impacting the overall coal and consumable fuels market. The research analyses the impact on these factors on the biogas markets, for the present market scenario and over the forecast period. Technavio’s reports provide a comprehensive analysis on the vendors and their offerings, major growth strategies adopted by stakeholders, and the key happenings in the market.

Buy 1 Technavio report and get the second for 50% off. Buy 2 Technavio reports and get the third for free.

View market snapshot before purchasing

Coal and Consumable Fuels Market: Segmentation

Coal and consumable fuels, the parent market, includes the global biogas market within its scope and it is further segmented into multiple sub-segments. Technavio’s reports identify the high growth areas and opportunities for vendors operating in each sub-segment of the global biogas market. The market is segmented as follows:

Grade

  • Coking or metallurgical coal
  • Non-coking or steam or thermal coal

Coal type

  • Lignite
  • Sub-bituminous
  • Bituminous
  • Thermal
  • Metallurgical
  • Anthracite

Mining source

  • Surface mining (opencast)
  • Underground mining (deep mining)

End-user industries

  • Power generation
  • Cement
  • Iron and steel
  • Industrial uses
  • Domestic uses

Coal processing

  • Coal tar
  • Coal tar pitch
  • Needle coke
  • Charcoal
  • Pitch coke
  • Cenospheres

Register for a free trial today and gain instant access to 17,000+ market research reports

Technavio's SUBSCRIPTION platform

Coal and Consumable Fuels Market: Geographic Segmentation

The global coal and consumable fuels market has been analyzed across key geographical regions to identify region level market dynamics, developments, and the key growth countries for the forecast period. The regional level analysis identifies the market shares, growth momentum, and key leading countries in the market, which include (but ae not limited to) the following:

  • North America (NA)
  • South America (SA)
  • Europe
  • Asia Pacific (APAC)
  • Middle East and Africa (MEA)

Vendor Landscape

Technavio’s industry coverage utilizes multiple sources and tools to gather information of the multiple stakeholders and their offerings towards the market. Sources such as company websites, annual reports, whitepapers, subscription & in-house databases, industry journals, publications and magazines are used in addition to other relevant sources. The vendor landscape provides a framework to estimate the health care supplies market, while also categorizing the vendors into pure play, category focused, or diversified based on their offerings. All market reports provide the key and contributing players across the value chain based on in-house influence index, developed using multiple industry and market parameters.

About Technavio

Technavio is a leading global technology research and advisory company. Their research and analysis focus on emerging market trends and provides actionable insights to help businesses identify market opportunities and develop effective strategies to optimize their market positions.

With over 500 specialized analysts, Technavio’s report library consists of more than 17,000 reports and counting, covering 800 technologies, spanning across 50 countries. Their client base consists of enterprises of all sizes, including more than 100 Fortune 500 companies. This growing client base relies on Technavio’s comprehensive coverage, extensive research, and actionable market insights to identify opportunities in existing and potential markets and assess their competitive positions within changing market scenarios.


Contacts

Technavio Research
Jesse Maida
Media & Marketing Executive
US: +1 844 364 1100
UK: +44 203 893 3200
Email: This email address is being protected from spambots. You need JavaScript enabled to view it.
Website: https://www.technavio.com

Closures for Great Lakes Transmission System Expansion

LOUISVILLE, Ky.--(BUSINESS WIRE)--$SYPR--Sypris Technologies, Inc., a subsidiary of Sypris Solutions, Inc. (Nasdaq/GM: SYPR), announced today that it has recently received an order for its Tube Turns® Tool-less® closures. Production will begin immediately and is expected to be completed prior to year-end. Terms of the purchase were not disclosed.


Brett Keener, General Manager of Sypris Technologies, commented, "This is another good example of a project that leverages our extensive experience in engineering high-quality closures for the demanding requirements to continually support major energy projects around the globe. We are proud to be a part of enhancing energy infrastructure with these types of important global projects."

The Tube Turns® Tool-less® closure has been chosen for the Alberta XPress Project (AXP). According to the project website, AXP will utilize existing capacity on the Great Lakes Gas Transmission (GLGT) system and American Natural Resources (ANR) pipeline system, with facility expansions taking place along ANR’s Southeast Mainline (SEML). The combined effort will result in an addition of 165,000 Dth/d of incremental firm transmission capacity from the GLGT Emerson receipt point in Manitoba to delivery locations along ANR’s SEML in the Midwestern and Southern U.S.

As part of the ANR expansion, a new compressor station will be built in Evangeline Parish, Louisiana. This project has an estimated cost of $300 million USD for compressor station and pipeline modifications to increase the performance of the system which will serve the rising demand for natural gas on the U. S. Gulf Coast and beyond. The Gulf Coast is the principal area in the U.S. for LNG export terminals. These closures will be up to 58” in diameter and rated to a pressure of 1,000 psi.

Sypris Technologies, Inc. is a global leader in the manufacture of custom engineered closures for high pressure critical applications serving the oil and gas pipeline infrastructure, hydrocarbon and petrochemical processing, and utility industry since 1927. Headquartered in Louisville, Kentucky, the Company's products are marketed worldwide, and can be found in projects ranging from the Trans Alaska Pipeline and Strategic Petroleum Reserve in the U.S. to the Tengiz Oil Field in Kazakhstan and the Bonny Island Gas Field in Nigeria. For more information about the Company, visit its Web site at www.sypris.com.

Forward-Looking Statements

This press release contains “forward-looking” statements within the meaning of the federal securities laws. Forward-looking statements include our plans and expectations of future financial and operational performance. Such statements may relate to projections of the company’s revenue, earnings, and other financial and operational measures, our liquidity, our ability to mitigate or manage disruptions posed by COVID-19, and the impact of COVID-19 and economic conditions on our future operations, among other matters.

Each forward-looking statement herein is subject to risks and uncertainties, as detailed in our most recent Form 10-K and Form 10-Q and other SEC filings.

Briefly, we currently believe that such risks also include the following: the impact of COVID19 and economic conditions on our future operations; possible public policy response to the pandemic, including legislation or restrictions that may impact our operations or supply chain; our failure to successfully complete final contract negotiations with regard to our announced contract “orders”, “wins” or “awards”; our failure to achieve and maintain profitability on a timely basis by steadily increasing our revenues from profitable contracts with a diversified group of customers, which would cause us to continue to use existing cash resources or other assets to fund operating losses; dependence on, retention or recruitment of key employees and distribution of our human capital; the cost, quality, timeliness, efficiency and yield of our operations and capital investments, including the impact of tariffs, product recalls or related liabilities, employee training, working capital, production schedules, cycle times, scrap rates, injuries, wages, overtime costs, freight or expediting costs; disputes or litigation involving governmental, supplier, customer, employee, creditor, product liability or environmental claims; our inability to develop new or improved products or new markets for our products; cost, quality and availability of raw materials such as steel, component parts, natural gas or utilities; our reliance on a few key customers, third party vendors and sub-suppliers; unanticipated or uninsured disasters, public health crises, losses or business risks; volatility of our customers’ forecasts, scheduling demands and production levels which negatively impact our operational capacity and our effectiveness to integrate new customers or suppliers, and in turn cause increases in our inventory and working capital levels; our inability to patent or otherwise protect our inventions or other intellectual property from potential competitors; adverse impacts of new technologies or other competitive pressures which increase our costs or erode our margins; legal rights to operate, manage our work force or import and export as needed; inaccurate data about markets, customers or business conditions; or unknown risks and uncertainties. We undertake no obligation to update our forward-looking statements, except as may be required by law.


Contacts

Brett H. Keener
General Manager
(502) 774-6271

TORONTO--(BUSINESS WIRE)--Chemtrade Logistics Income Fund (TSX: CHE.UN) today announced that it has declared a cash distribution of $0.05 per unit for the month of August 2020 payable on September 25, 2020 to unitholders of record at the close of business on August 31, 2020.


Holders of units who are non-residents of Canada will be required to pay all withholding taxes payable in respect of any distributions of income by the Fund.


Contacts

Mark Davis
President & CEO
Tel: (416) 496-4176

Rohit Bhardwaj
Vice President, Finance & CFO
Tel: (416) 496-4177

COLUMBIA, Md.--(BUSINESS WIRE)--GSE Systems, Inc. (“GSE Solutions”, “GSE” or “we”) (Nasdaq: GVP), a leader in delivering and supporting end-to-end training, engineering, compliance, simulation and workforce solutions to the power industry, announced today its financial results for the three months ended June 30, 2020.


Financial overview for the second quarter of fiscal 2020

  • Revenue of $14.3 million, compared to $23.5 million in Q2 2019
  • Gross profit of $3.6 million, compared to $5.9 million in Q2 2019
  • Net loss of $2.1 million or $(0.11) per basic and diluted share in Q2 2020, compared to a net loss of $216 thousand or $(0.01) per basic and diluted share in Q2 2019
  • Adjusted net loss1 of $707 thousand or $(0.03) adjusted loss per diluted share in Q2 2020, compared to adjusted net income of $964 thousand or $0.05 adjusted earnings per diluted share in Q2 2019
  • Adjusted EBITDA1 of $(191) thousand, compared to $1.9 million in Q2 2019
  • Cash provided by operations of $2 million YTD, compared to cash used in operations of $909 thousand YTD 2019
  • Repaid $3.5 million of long-term debt during Q2 2020
  • New orders of $6.8 million, compared to $9.5 million in Q2 2019

At June 30, 2020

  • Cash and cash equivalents of $18.3 million
  • Total indebtedness of $23.3 million, inclusive of $10.0 million loan pursuant to the Payroll Protection Program
  • Working capital totaled $3.4 million and current ratio equaled 1.1x
  • Backlog of $46.6 million

1 Refer to the non-GAAP reconciliation tables at the end of this press release for a definition of "EBITDA", “adjusted EBITDA” and “adjusted net income”.

Kyle J. Loudermilk, GSE’s President and Chief Executive Officer, said, “As anticipated, our second quarter financial results were depressed due to the COVID-19 pandemic. The pandemic has resulted in industrywide RFP delays, project postponements and softer customer demand. Nonetheless, we generated positive cash flow and paid down approximately $3.5 million of long-term debt during the quarter. This demonstrates our ability to manage through the current challenges through providing essential services to our industry while operating the business within the constraints of the pandemic.”

Mr. Loudermilk continued, “We believe that significant pent-up demand for our services ultimately will be released as the COVID-19 impact abates. In the meantime, we are pursuing a number of meaningful second-half opportunities in Nuclear Industry Training & Consulting and expect a steady flow of new orders in Performance Improvement Solutions. To emerge stronger from the current challenges, we are focused on driving organic growth, containing costs, generating cash flow and deleveraging our balance sheet. Our long-term outlook remains bullish as GSE delivers differentiated products and services required for the safe, efficient and reliable operation of our clients’ nuclear facilities.”

Q2 2020 FINANCIAL RESULTS

Q2 2020 revenue of $14.3 million decreased by $9.1 million from $23.5 million in Q1 2019.

Three months ended


Six months ended

(in thousands)

June 30, 2020


June 30, 2019


June 30, 2020


June 30, 2019

Revenue:


Performance

$

8,273

$

13,010

$

17,984

$

25,200

NITC


6,067


10,448


14,061


20,452

Total revenue

$

14,340

$

23,458

$

32,045

$

45,652

Performance revenue decreased to $8.3 million in Q2 2020 from $13.0 million in Q2 2019. The change was mainly driven by a decrease of $2.2 million due to major project completions in the second quarter of 2019. We recorded total Performance orders of $7.1 million and $3.7 million for Q2 2020 and Q2 2019, respectively.

NITC revenue decreased to $6.1 million in Q2 2020 from $10.4 million in Q2 2019. The decrease in revenue was largely due to lower staffing needs during the quarter, particularly attributed to lower demand for staff augmentation support from two major customers. NITC orders totaled $(0.3) million and $5.8 million for Q2 2020 and Q2 2019, respectively.

Q2 2020 gross profit was $3.6 million or 24.8% of revenue, compared to $5.9 million or 25.0% of revenue, in Q2 2019.

Three months ended


Six months ended

June 30, 2020

June 30, 2019

June 30, 2020

June 30, 2019

(in thousands)

$


%


$


%


$


%


$


%

Gross profit:


Performance

$

2,970


35.9%


$

4,540


34.9%


$

5,758


32.0%


$

8,239


32.7%

NITC


592

9.8%


1,327

12.7%


1,919

13.6%


2,364

11.6%

Consolidated gross profit

$

3,562

24.8%

$

5,867

25.0%

$

7,677

24.%

$

10,603

23.2%

The decrease in our gross profit of $2.9 million was primarily driven by decreased gross profit margins in our Performance segment, due to completion of higher margin projects in our True North and DP Engineering subsidiaries during fiscal 2019.

Selling, general and administrative expenses in Q2 2020 totaled $4.7 million or 32.9% of revenue, compared to $4.3 million or 18.5% of revenue, in Q2 2019. The increase in SG&A during the three months ended June 30, 2020 over the same period for fiscal 2019, relates to a relates primarily to a provision for a loss on legal settlement of $861 thousand and an increase in the consulting expenses due to the COVID-19 pandemic.

Net loss for Q2 2020 totaled $2.1 million or $(0.11) per basic and diluted share, compared to a net loss of $216 thousand or $(0.01) per basic and diluted share, in Q2 2019.

Adjusted net loss1 totaled $707 thousand or $(0.03) per diluted share in Q2 2020, compared to adjusted net income of $964 thousand, or $0.05 per diluted share, in Q2 2019.

Earnings before interest, taxes, depreciation and amortization ("EBITDA")1 for Q2 2020 was approximately $(1.2) million, compared to $1.3 million in Q2 2019.

Adjusted EBITDA1 totaled $(191) thousand in Q2 2020, compared to $1.9 million in Q2 2019.

BACKLOG AND CASH POSITION

Backlog at June 30, 2020 was $46.6 million, compared to $52.7 million at December 31, 2019. Backlog at June 30, 2020 included $31.2 million of Performance backlog and $15.4 million of NITC backlog. Performance backlog decreased by $6 million primarily due to 2019 backlog that was converted to revenues during 2020 and has only been partially replaced by new orders.

Our cash position was $18.3 million at June 30, 2020, compared to $11.7 million at December 31, 2019. The increase of $6.6 million during the six months ended June 30, 2020 in our cash and cash equivalents was primarily due to a positive, operating cash flow of $2 million, receipt of $10 million from the Paycheck Protection Program Loan and a draw on our revolving line of credit of $3.5 million on our credit line, offset by repayments of debt of $8.7 million.

CONFERENCE CALL

Management will host a conference call today at 4:30 pm Eastern Time to discuss Q2 2020 results as well as other matters.

Interested parties may participate in the call by dialing:
(877) 407-9753 (United States)
(201) 493-6739 (International)

The conference call will also be accessible via the following link: https://78449.themediaframe.com/dataconf/productusers/gvp/mediaframe/40287/indexl.html

For those who cannot listen to the live broadcast, an online webcast replay will be available at the following link: https://78449.themediaframe.com/dataconf/productusers/gvp/mediaframe/40287/indexl.html or at www.gses.com for a longer period.

ABOUT GSE SOLUTIONS

We are the future of operational excellence in the power industry. As a collective group, GSE Solutions leverages top skills, expertise, and technology to provide highly specialized solutions that enable customers to achieve the performance they envision. Our experts deliver and support end-to-end training, engineering, compliance, simulation, and workforce solutions that help the power industry reduce risk and optimize plant operations. GSE is a proven solution provider, with more than four decades of industry experience and more than 1,100 installations serving hundreds of customers in over 50 countries spanning the globe. www.gses.com

FORWARD LOOKING STATEMENTS

We make statements in this press release that are considered forward-looking statements within the meaning of Section 27A of the Securities Act of 1933, as amended, and Section 21E of the Securities Exchange Act of 1934. These statements reflect our current expectations concerning future events and results. We use words such as “expect,” “intend,” “believe,” “may,” “will,” “should,” “could,” “anticipates,” and similar expressions to identify forward-looking statements, but their absence does not mean a statement is not forward-looking. These statements are not guarantees of our future performance and are subject to risks, uncertainties, and other important factors that could cause our actual performance or achievements to be materially different from those we project. For a full discussion of these risks, uncertainties, and factors, we encourage you to read our documents on file with the Securities and Exchange Commission, including those set forth in our periodic reports under the forward-looking statements and risk factors sections. We do not intend to update or revise any forward-looking statements, whether as a result of new information, future events, or otherwise.

CONDENSED CONSOLIDATED STATEMENT OF OPERATIONS


Three months ended

Six months ended

June 30, 2020

June 30, 2019

June 30, 2020

June 30, 2019


Revenue

$

14,340

23,458


$

32,045


45,652

Cost of revenue

10,778

17,591


24,368


35,049

Gross profit

$

3,562

5,867


$

7,677


10,603

Operating expenses:


Selling, general and administrative

4,722

4,343


9,670


8,766

Research and development

179

156


389


396

Restructuring charges

-

2


10


2

Loss on impairment

-

-


4,302


5,464

Depreciation

70

102


178


193

Amortization of definite-lived intangible assets

444

638


1,114


1,208

Total operating expenses

5,415

5,241


15,663


16,029

Operating (loss) income

$

(1,853)

626


$

(7,986)


(5,426)


Interest expense, net

(187)

(316)


(428)


(524)

Gain (loss) on derivative instruments, net

47

(101)


4


(8)

Other income (expense), net

24

(19)


53


3

(Loss) income before income taxes

(1,969)

190


(8,357)


(5,955)

Provision for (benefit from) income taxes

180

406


50


(1,442)

Net loss

$

(2,149)

(216)


$

(8,407)


(4,513)


Net loss per common share - basic and diluted

$

(0.11)

(0.01)


$

(0.41)


(0.23)


Weighted average shares outstanding used to
compute net loss per share - basic and diluted

20,407,958

20,006,492


20,375,446


19,979,018

Selected Consolidated Balance Sheet Data

(in thousands)


(unaudited)

(audited)


June 30, 2020

December 31, 2019


Cash and cash equivalents

$

18,298

11,691

Current assets


14,270

19,087

Noncurrent assets


21,691


27,731

Total assets

$

54,259

58,509


Current liabilities

$

29,207

34,434

Long-term liabilities


13,041

3,956

Stockholders’ equity


12,001


20,119

Total liabilities and
stockholders' equity

$

54,259

58,509

EBITDA and Adjusted EBITDA
(in thousands)

References to “EBITDA” mean net (loss) income, before taking into account interest expense (income), provision for income taxes, depreciation and amortization. References to Adjusted EBITDA exclude loss on impairment, impact of the change in fair value of contingent consideration, restructuring charges, stock-based compensation expense, impact of the change in fair value of derivative instruments, and acquisition-related expense. EBITDA and Adjusted EBITDA are not measures of financial performance under generally accepted accounting principles (GAAP). Management believes EBITDA and Adjusted EBITDA, in addition to operating profit, net income and other GAAP measures, are useful to investors to evaluate the Company’s results because it excludes certain items that are not directly related to the Company’s core operating performance that may, or could, have a disproportionate positive or negative impact on our results for any particular period. Investors should recognize that EBITDA and Adjusted EBITDA might not be comparable to similarly-titled measures of other companies. This measure should be considered in addition to, and not as a substitute for or superior to, any measure of performance prepared in accordance with GAAP. A reconciliation of non-GAAP EBITDA and Adjusted EBITDA to the most directly comparable GAAP measure in accordance with SEC Regulation G follows:

(in thousands)

Three months ended

Six months ended

June 30, 2020

June 30, 2019

June 30, 2020

June 30, 2019


Net loss

$

(2,149)

(216)

$

(8,407)

(4,513)


Interest expense, net

187

316

428

524

Provision for (benefit from) income taxes

180

406

50

(1,442)

Depreciation and amortization

593

839


1,451


1,629

EBITDA

(1,189)

1,345

(6,478)

(3,802)


Provision for legal settlement

861

-

861

-

Loss on impairment


-


-


4,302


5,464

Impact of the change in contingent consideration

-

-

-

(1,200)

Restructuring charges

-

2

10

2

Stock-based compensation expense

171

439

324

1,036

Gain (loss) on derivative instruments, net

(47)

101

(4)

8

Acquisition-related expenses

7

-

188

628

Adjusted EBITDA

$

(191)

1,887

$

(797)

2,136

Adjusted Net (Loss) Income per Common and Diluted share
(in thousands)

References to Adjusted net income exclude the impact of gain from loss on impairment, impact of the change in fair value of contingent consideration, restructuring charges, stock-based compensation expense, impact of the change in fair value of derivative instruments, acquisition-related expense, and amortization of intangible assets related to acquisitions, net of income tax expense impact of adjustments. Adjusted Net Income and adjusted earnings per share (adjusted EPS) are not measures of financial performance under generally accepted accounting principles (GAAP). Management believes adjusted net income and adjusted EPS, in addition to other GAAP measures, are useful to investors to evaluate the Company’s results because they exclude certain items that are not directly related to the Company’s core operating performance and non-cash items that may, or could, have a disproportionate positive or negative impact on our results for any particular period, such as stock-based compensation expense. These measures should be considered in addition to, and not as a substitute for or superior to, any measure of performance prepared in accordance with GAAP. A reconciliation of non-GAAP adjusted net income and adjusted EPS to GAAP net income, the most directly comparable GAAP financial measure, is as follows:

(in thousands)

Three months ended

Six months ended


June 30, 2020

June 30, 2019

June 30, 2020


June 30, 2019


Net loss

$

(2,149)

(216)

$

(8,407)

(4,513)


Provision for legal settlement

861

-

861

-

Loss on impairment


4,302


5,464

Impact of the change in fair value of
contingent consideration

-

-

-

(1,200)

Restructuring charges

-

2

10

2

Stock-based compensation expense

177

439

324

1,036

Gain (loss) on derivative instruments, net

(47)

101

(4)

8

Acquisition-related expense

7

-

188

628

Amortization of intangible assets related to acquisitions

444

638

1,114

1,208

Adjusted net (loss) income

$

(707)

964

$

(1,612)

2,633


Adjusted (loss) earnings per common share
– basic and diluted

$

(0.03)

0.05

$

(0.08)

0.13


Weighted average shares outstanding used
to compute adjusted net (loss) earnings per
share - basic and diluted(1)

20,407,958

20,269,733


20,375,446


20,154,866


(1) During the three months ended June 30, 2020 and 2019, we reported a GAAP net loss. Accordingly there were 74,732 an 263,241 dilutive shares from RSUs included in the adjusted earnings per common share calculation that were considered anti-dilutive when calculating the adjusted net (loss) income per common share for the six months ended June 30, 2020 and 2019, respectively.

(1) During the six months ended June 30, 2020 and 2019, we reported a GAAP net loss. Accordingly there were 56,373 and 175,848 dilutive shares from RSUs included in the adjusted earnings per common share calculation that were considered anti-dilutive when calculating the adjusted net (loss) income per common share for the three months ended June 30, 2020 and 2019, respectively.


Contacts

Company Contact
Kyle Loudermilk
Chief Executive Officer
GSE Systems, Inc.
(410) 970-7800

The Equity Group Inc.
Kalle Ahl, CFA
(212) 836-9614
This email address is being protected from spambots. You need JavaScript enabled to view it.

Platform to simplify the commodity supply chain and enable growth of the logistics-heavy decentralized LNG-for-trucks business

EAST BRUNSWICK, N.J. & BANGALORE, India--(BUSINESS WIRE)--#LNG--Wipro Limited (NYSE: WIT, BSE: 507685, NSE: WIPRO), a leading global information technology, consulting, and business process services company, today announced the successful implementation of a blockchain-based small-scale liquefied natural gas (ssLNG) trading/fulfillment platform for Uniper Global Commodities SE and its 100% LNG-for-trucks subsidiary Liqvis GmbH. Uniper SE is a leading international energy company headquartered in Germany.


The platform built in collaboration with Uniper utilizes a consortium model for all ssLNG market participants to help transform the trading market space resulting in market efficiencies and significant cost savings for traders.

Uniper selected Wipro to build the blockchain platform to address the complexity of the European ssLNG market. As a result of the implementation, commodity flow management is simplified in a market characterized by extensive manual and paper-based transactions and high operational cost. The platform implemented by Wipro involves multiple peer-to-peer trading cycle participants, enables order and supply placement, delivery of goods, validation of the state of goods and bill settlements. It further helps Uniper streamline trade by reducing turnaround time, effort and inefficiencies, enables scalability and brings visibility, transparency and trust in all stages of LNG trade. Strategically, it paves the way for Uniper to become the market maker for low-carbon modern supply of alternative fuels and decentralized energy solutions.

Dr. Grigory Shevchenko, Senior Account Manager Gas Supply and Origination, LNG Business Development, Uniper said, “Uniper’s strength is its customer-centricity, product creation and market development. Building upon that when we enter more downstream logistics-heavy markets, we encourage the use of innovative technologies to optimize our processes and operations. Blockchain will enable business volume growth without needing a lot of additional headcount to manage transactions. This will be true for us and our counterparts that will engage with Uniper through the paperless blockchain platform. The ssLNG trading platform provides for easy scalability and enhancements based on the growing marketplace. To achieve this, we jointly deployed the required building blocks such as security, distributed computing and node network.”

Sarat Chand, Vice President and EMEA Utilities Business Head, Wipro Limited said, “We are delighted to build and implement the Small Scale LNG blockchain platform for Uniper and support their initiative to promote LNG as an advanced and environmentally friendly fuel alternative. The platform helps Uniper’s LNG-for-trucks subsidiary Liqvis ensure that LNG is always available when and where it is needed and achieve price security through Uniper’s long-term LNG supply contracts and seamless supply chain execution. This is a landmark partnership between Wipro and Uniper. Our Utilities ETRM business competency combined with industry leading blockchain expertise has enabled Uniper to modernize its trading platform, reduce friction, improve process efficiency and simplify settlements in business processes.”

Krishnakumar N Menon, Vice President - Service Transformation and Blockchain Theme Leader, Wipro Limited said, “The trading/fulfillment platform for ssLNG market leverages blockchain to simplify the LNG trade process with greater efficiency, transparency and security. Smart contracts used in the platform automate processes such as demand creation, trade confirmation, shipment creation, bunkering, invoice generation and settlement, leading to lesser manual interventions. The blockchain-based platform benefits Uniper and its customers in their trade cycles by enabling digitization and exchange of documents; real-time sharing of information and alerts for an immutable audit trail of activities performed.”

Wipro is a recognized leader in implementing blockchain technology for its clients, providing strategic advisory and consulting services combined with a strong portfolio of industry solutions, platforms and patents paired with an ecosystem of technology partners, consortia, industry regulatory bodies, and academia. Wipro is committed to creating strong blockchain communities while developing talent for building extensive technology expertise across multiple leading blockchain platforms such as Hyperledger Fabric, Ethereum, Quorum, Corda, Multichain, Hyperledger Indy and Hyperledger Sawtooth. The company is also involved in a number of distributed ledger technology consortia and alliances including the Hyperledger project, the Ethereum Enterprise Alliance, the Energy Web Foundation and the Blockchain in Transport Alliance. To learn more, click here.

About Uniper

Uniper is a leading international energy company with around 11,500 employees and activities in more than 40 countries. With about 34 GW of installed generation capacity, Uniper is among the largest global power generators. Its main activities include power generation in Europe and Russia as well as global energy trading, including a diversified gas portfolio that makes Uniper one of Europe’s leading gas companies. In 2019, Uniper sold a gas volume of about 220 bcm. The company is headquartered in Düsseldorf, being the third-largest listed German utility. Under its new strategy, Uniper aims to become carbon-neutral in Europe by 2035.

About Wipro Limited

Wipro Limited (NYSE: WIT, BSE: 507685, NSE: WIPRO) is a leading information technology, consulting and business process services company that delivers solutions to enable its clients do business better. Wipro delivers winning business outcomes through its deep industry experience and a 360 degree view of “Business through Technology.” By combining digital strategy, customer centric design, advanced analytics and product engineering approach, Wipro helps its clients create successful and adaptive businesses. A company recognized globally for its comprehensive portfolio of services, strong commitment to sustainability and good corporate citizenship, Wipro has a dedicated workforce of over 180,000 serving clients across 6 continents. For more information, please visit www.wipro.com.

Forward-looking and Cautionary Statements

The forward-looking statements contained herein represent Wipro’s beliefs regarding future events, many of which are by their nature, inherently uncertain and outside Wipro’s control. Such statements include, but are not limited to, statements regarding Wipro’s growth prospects, its future financial operating results, and its plans, expectations and intentions. Wipro cautions readers that the forward-looking statements contained herein are subject to risks and uncertainties that could cause actual results to differ materially from the results anticipated by such statements. Such risks and uncertainties include, but are not limited to, risks and uncertainties regarding fluctuations in our earnings, revenue and profits, our ability to generate and manage growth, complete proposed corporate actions, intense competition in IT services, our ability to maintain our cost advantage, wage increases in India, our ability to attract and retain highly skilled professionals, time and cost overruns on fixed-price, fixed-time frame contracts, client concentration, restrictions on immigration, our ability to manage our international operations, reduced demand for technology in our key focus areas, disruptions in telecommunication networks, our ability to successfully complete and integrate potential acquisitions, liability for damages on our service contracts, the success of the companies in which we make strategic investments, withdrawal of fiscal governmental incentives, political instability, war, legal restrictions on raising capital or acquiring companies outside India, unauthorized use of our intellectual property and general economic conditions affecting our business and industry. The conditions caused by the COVID-19 pandemic could decrease technology spending, adversely affect demand for our products, affect the rate of customer spending and could adversely affect our customers’ ability or willingness to purchase our offerings, delay prospective customers’ purchasing decisions, adversely impact our ability to provide on-site consulting services and our inability to deliver our customers or delay the provisioning of our offerings, all of which could adversely affect our future sales, operating results and overall financial performance. Our operations may also be negatively affected by a range of external factors related to the COVID-19 pandemic that are not within our control. Additional risks that could affect our future operating results are more fully described in our filings with the United States Securities and Exchange Commission, including, but not limited to, Annual Reports on Form 20-F. These filings are available at www.sec.gov. We may, from time to time, make additional written and oral forward-looking statements, including statements contained in the company’s filings with the Securities and Exchange Commission and our reports to shareholders. We do not undertake to update any forward-looking statement that may be made from time to time by us or on our behalf.


Contacts

Shraboni Banerjee
Wipro Limited
This email address is being protected from spambots. You need JavaScript enabled to view it.
KANSAS CITY, Mo.--(BUSINESS WIRE)--Kansas City Southern (KCS) (NYSE: KSU) announced today that it has been recognized by Logistics Management magazine with a 2020 Quest for Quality award. Kansas City Southern Railway is this year’s Rail/Intermodal Service Provider winner by leading in the key categories of On-Time Performance and Customer Service and tying for the top spot in Equipment and Operations.


Logistics Management readers evaluate companies in all modes and service disciplines, choosing the top performers in categories including motor carriers, railroad and intermodal services, ocean carriers, airlines, freight forwarders, third party/contract logistics services and ports. Transportation service providers are rated on five key criteria: On-Time Performance, Value, Information Technology, Customer Service, and Equipment and Operations.

We are so pleased to have received this recognition from our customers and Logistics Management magazine,” said KCS executive vice president and chief marketing officer Mike Naatz. “A core part of the KCS vision is to be the most-customer focused transportation service provider in North America, so this validation from our customers is important.”

To read more on the 37th Annual Quest for Quality Awards, visit: https://www.logisticsmgmt.com/article/quest_for_quality_2020_rail_intermodal.

Headquartered in Kansas City, Mo., KCS is a transportation holding company that has railroad investments in the U.S., Mexico and Panama. Its primary U.S. holding is The Kansas City Southern Railway Company, serving the central and south central U.S. Its international holdings include Kansas City Southern de Mexico, S.A. de C.V., serving northeastern and central Mexico and the port cities of Lázaro Cárdenas, Tampico and Veracruz, and a 50 percent interest in Panama Canal Railway Company, providing ocean-to-ocean freight and passenger service along the Panama Canal. KCS' North American rail holdings and strategic alliances with other North American rail partners are primary components of a unique railway system, linking the commercial and industrial centers of the U.S., Mexico and Canada.


Contacts

C. Doniele Carlson
816-983-1372
This email address is being protected from spambots. You need JavaScript enabled to view it.

FRANKFURT, Germany--(BUSINESS WIRE)--MV Index Solutions GmbH (MVIS®) this week licensed the BlueStar Travel & Vacation Index (ticker: BTOURNTR) and the BlueStar Solar Energy Index (ticker: BSOLRNTR) to Migdal Mutual Funds, a leading Israeli issuer of ETFs and index mutual funds.


The BlueStar Travel & Vacation Index (ticker: BTOURNTR) tracks the 50 largest US-listed companies operating in industries such as: Hotels & Resorts, Airlines, Theme Parks, Cruises, and Casino Hotels. The index follows a modified market cap-weighting strategy to ensure diversification across the industries represented in the index.

The BlueStar Solar Energy Index (ticker: BSOLRNTR) tracks globally-listed companies that derive 50% or more of annual revenue or attribute 50% or more of operating assets to the development, production, or installation of solar energy and solar energy-related technologies. The index follows a modified market cap-weighting strategy.

We are pleased to announce the licensing of the BTOURNTR and BSOLRNTR indices, two new indices that extend our product range, to Migdal Mutual Funds. The travel and vacation industry has been beleaguered by COVID-19 but represents an opportunity for investors to express a forward-looking view on underlying trends driving the growth of the travel and vacation industry that have propelled the industry over the years leading up to the outbreak of COVID-19,” said Joshua Kaplan, Global Head of Research at MV Index Solutions.

Joshua continued, “The Solar Energy industry is one of the fastest-growing segments within the alternative energy industry and we are pleased to bring to market our first index which is a pure-play index targeting the dynamic and evolving renewable energy segment.”

The BlueStar Travel and Vacation Index and the Bluestar Solar Energy Industry Index are calculated in US Dollars as net total return indices. Detailed information about each index is available on MV Index Solutions website.

Key Index Features
BlueStar Travel & Vacation Index (ticker: BTOURNTR)
Number of Components: 50
Base Date: 12/31/2015
Base Value: 100

Key Index Features
BlueStar Solar Energy Index (ticker: BSOLRNTR)
Number of Components: 24
Base Date: 12/31/2015
Base Value: 100

Note to Editors:

About MV Index Solutions - www.mvis-indices.com

MV Index Solutions (MVIS®) develops, monitors and licenses the MVIS Indices, a selection of focused, investable and diversified benchmark indices. The indices are especially designed to underlie financial products. MVIS Indices cover several asset classes, including equity, fixed income markets and digital assets and are licensed to serve as underlying indices for financial products. Approximately USD 17.54 billion in assets under management (as of 20 August 2020) are currently invested in financial products based on MVIS Indices. MVIS is a VanEck company.


Contacts

Media
Séverine Thäsler-Jäger, MV Index Solutions
+49 (0)69 4056 695 53
This email address is being protected from spambots. You need JavaScript enabled to view it.

NEW YORK--(BUSINESS WIRE)--New Fortress Energy Inc. (NASDAQ:NFE) (the “Company”) announced today the pricing of its previously announced private offering of $1,000 million (upsized from $800 million) aggregate principal amount of senior secured notes due 2025 (the “Notes”). The Notes will bear interest at 6.750% per annum and will be issued at an issue price equal to 100% of principal, plus accrued interest, if any, from September 2, 2020. The Company intends to use the net proceeds from the offering, together with cash on hand, to repay in full the amounts outstanding under its credit agreement and to redeem in full the senior secured bonds and senior unsecured bonds issued by its subsidiary, NFE South Power Holdings Limited, terminating the credit agreement and the documentation governing such bonds, in each case including related premiums, costs and expenses. The closing of the offering is subject to certain limited conditions.


The Notes and the guarantees thereof were offered in the United States to qualified institutional buyers under Rule 144A under the Securities Act of 1933, as amended (the “Securities Act”), and to persons outside of the United States under Regulation S under the Securities Act. The Notes and the guarantees thereof will not be registered under the Securities Act or any state securities laws, and, unless so registered, may not be offered or sold in the United States absent registration or an applicable exemption from registration requirements.

This press release does not constitute an offer to sell or a solicitation of an offer to buy the securities described herein, nor shall there be any sale of these securities in any state or other jurisdiction in which such an offer, solicitation or sale would be unlawful prior to registration or qualification under the securities laws of any such jurisdiction.

About New Fortress Energy Inc.

New Fortress Energy (NASDAQ:NFE) is a global energy infrastructure company founded to help accelerate the world’s transition to clean energy. The company funds, builds and operates natural gas infrastructure and logistics to rapidly deliver fully integrated, turnkey energy solutions that enable economic growth, enhance environmental stewardship and transform local industries and communities.

Cautionary Language Regarding Forward-Looking Statements

This press release contains forward-looking statements, including but not limited to statements regarding the consummation of the offering or the Company’s anticipated use of the net proceeds from the offering. All statements contained in this press release other than historical information are forward-looking statements that involve known and unknown risks and relate to future events, our future financial performance or our projected business results. In some cases, you can identify forward-looking statements by terminology such as “may,” “will,” “should,” “expects,” “plans,” “anticipates,” “believes,” “estimates,” “predicts,” “projects,” “targets,” “potential” or “continue” or the negative of these terms or other comparable terminology. Such forward-looking statements are necessarily estimates based upon current information and involve a number of risks and uncertainties. Actual events or results may differ materially from the results anticipated in these forward-looking statements as a result of a variety of factors.

All forward-looking statements speak only as of the date on which it is made. When considering forward-looking statements, you should keep in mind the risk factors and other cautionary statements included in our annual, quarterly and other reports we file with the SEC. We undertake no duty to update these forward-looking statements, even though our situation may change in the future. Furthermore, we cannot guarantee future results, events, levels of activity, performance, projections or achievements.


Contacts

IR:
Alan Andreini
(212) 798-6128
This email address is being protected from spambots. You need JavaScript enabled to view it.

Joshua Kane
(516) 268-7455
This email address is being protected from spambots. You need JavaScript enabled to view it.

Media:
Jake Suski
(516) 268-7403
This email address is being protected from spambots. You need JavaScript enabled to view it.

DUBLIN--(BUSINESS WIRE)--The "Global Genset Rental Market (2020-2026): Market Forecast by Types, by KVA Rating, by Applications, by Prime Applications, by Verticals, by Region, and Competitive Landscape" report has been added to ResearchAndMarkets.com's offering.


The global genset rental market is anticipated to show robust growth during the forecast period on account of rising demand for reliable power supply from several verticals including manufacturing, utilities, and oil & gas segments. On account of projected growth in the construction sector, growing industrialization, and various government initiatives to boost infrastructure development in emerging economies, the rental genset market is anticipated to flourish over the coming years.

The massive coronavirus outbreak affecting almost all countries across the globe would hamper the demand for genset rental in the current year as a result of a decline in consumer demand leading to production cuts and oil & gas sector slump. However, demand would pick up pace post-2020 with the gradual opening of economies that were put under lockdown measures to curtail the spread of coronavirus and resumption of business activities moving towards full capacity utilization.

According to this research, Global Genset Rental Market is projected to grow at a CAGR of 10.6% during 2020-26. At present, Asia Pacific region accounts for the highest revenue share in the overall global genset rental market. Countries, such as China and India, contribute the major revenue share in the region owing to the rapid urbanization and growing infrastructure development activities across several verticals, which would drive the genset rental market growth over the coming years. Further, the Africa region also looks promising and would present lucrative opportunities for genset rental during the forecast period, mainly attributed to growing construction activities in the region and unreliable power supply from the grids.

The diesel genset rental segment accounted for the largest revenue share in the overall genset rental market globally in 2019 on the back of wide applications, various range of power rating variants, and high operational efficiency. However, gas gensets are expected to grow at a faster pace during the forecast period owing to rising environmental awareness and implementation of strict environmental norms by governments across several nations.

The report thoroughly covers the global genset rental market by types, kVA Rating, applications, prime applications, verticals, and regions. The report provides an unbiased and detailed analysis of the on-going trends, opportunities/high growth areas, and market drivers which would help the stakeholders to device and align their market strategies according to the current and future market dynamics.

Companies Mentioned

  • AGCO Corporation
  • Aggreko PLC
  • Aksa Power Generation
  • APR Energy
  • Atlas Copco
  • Caterpillar Inc.
  • Cummins Inc.
  • Himoinsa S.L.
  • Teksan
  • United Rentals Inc.

Key Topics Covered:

1. Executive Summary

2. Introduction

2.1 Report Description

2.2 Key Highlights of the Report

2.3 Market Scope & Segmentation

2.4 Research Methodology

2.5 Assumptions

3. Global Genset Rental Market Overview

3.1 Global Genset Rental Market Revenues, 2016-2026F

3.2 Global Genset Rental Market Industry Life Cycle

3.3 Global Genset Rental Market Porter's Five Forces Model

3.4 Global Genset Rental Market Ecosystem

3.5 Global Genset Rental Market Revenue Share, By Types, 2019 & 2026F

3.6 Global Genset Rental Market Revenue Share, By Applications, 2019 & 2026F

3.7 Global Genset Rental Market Revenue Share, By Regions, 2019 & 2026F

4. Global Genset Rental Market Dynamics

4.1. Impact Analysis

4.2. Market Drivers

4.3. Market Restraints

5. Global Genset Rental Market Trends

6. Asia Pacific Genset Rental Market Overview

7. Middle East Genset Rental Market Overview

8. Africa Genset Rental Market Overview

9. Europe Genset Rental Market Overview

10. North America Genset Rental Market Overview

11. Latin America Genset Rental Market Overview

12. Global Genset Rental Market Opportunity Assessment

13. Global Genset Rental Market Competitive Landscape

13.1 Global Genset Rental Market Revenue Share, By Company, 2019

13.1.1 Asia Pacific Genset Rental Market Revenue Share, By Company, 2019

13.1.2 Middle East Genset Rental Market Revenue Share, By Company, 2019

13.1.3 Africa Genset Rental Market Revenue Share, By Company, 2019

13.1.4 Europe Genset Rental Market Revenue Share, By Company, 2019

13.1.5 North America Genset Rental Market Revenue Share, By Company, 2019

13.1.6 Latin America Genset Rental Market Revenue Share, By Company, 2019

13.2 Global Genset Rental Market Competitive Benchmarking

13.2.1 Global Genset Rental Market Competitive Benchmarking, on Technical Parameters

14. Company Profiles

15. Key Strategic Recommendations

16. Disclaimer

For more information about this report visit https://www.researchandmarkets.com/r/mh9mg7


Contacts

ResearchAndMarkets.com
Laura Wood, Senior Press Manager
This email address is being protected from spambots. You need JavaScript enabled to view it.
For E.S.T Office Hours Call 1-917-300-0470
For U.S./CAN Toll Free Call 1-800-526-8630
For GMT Office Hours Call +353-1-416-8900

HOUSTON--(BUSINESS WIRE)--Live Oak Resource Partners, LLC (“Live Oak”) and Posse Resources, LLC (“Posse”) announced the closing of the sale of Live Oaks’ mineral and royalty assets held by Live Oak Resource Partners I, LP (“Fund I”) to Posse, through Posse’s newly created entity, Oak Ridge Royalties, LP.


The transaction includes all of Live Oak Fund I’s remaining north Louisiana mineral & royalty assets, consisting of ~4,800 net royalty acres (normalized to 1/8 royalty), with production across the Haynesville Shale, Bossier Shale, and Cotton Valley formations.

“The successful closing on the sale of Fund I’s remaining assets during a challenging time for the industry highlights the quality of the portfolio assembled and managed by the Live Oak team. Fund I was a demonstrable success in validating the scalability and efficiency of Live Oak’s aggregation business model. We are sincerely appreciative for the support of our Fund I partners and are thrilled to deliver this successful result,” said Andrew Keene, Live Oak’s President and Chief Financial Officer.

Discussing the transaction, Mitchell Currie, Vice President of Posse said, “We believe this acquisition of mineral and royalty interests with exposure to the Haynesville, Bossier and Cotton Valley formations enhances our diverse portfolio of oil & gas investments. This transaction complements our existing north Louisiana property base held by our affiliated entity, Louisiana Minerals, Ltd.”

Commenting further, Mr. Keene said, “We appreciate the professionalism and diligence of Posse and wish them great success with this asset. In a challenging A&D market, we believe our Fund I portfolio found the proper suitor; a firm with a long history and substantial existing footprint in the basin, deep technical understanding of the Haynesville, and a long-term view towards the ownership of mineral rights.”

“While this sale provides for a successful exit in Fund I, Live Oak remains principally active in the Haynesville as the leading acquiror of royalty, mineral and non-operated working interests in the basin. In the last five years, the Live Oak team has closed over 600 transactions covering more than 18,000 royalty acres,” said Mr. Keene.

“We enjoyed working alongside the Live Oak team and appreciated their commitment to closing a successful transaction. Posse remains focused on growing its diversified mineral and non-operated oil and gas portfolio through both opportunistic acquisitions and participation in drilling proposals,” said Mr. Currie.

Willkie, Farr, & Gallagher LLP served as legal counsel to Live Oak. Kean Miller, LLP and Ewing & Jones, PLLC served as legal counsel to Posse.

About Live Oak Resource Partners

Live Oak Resource Partners is a privately held firm based in Houston, Texas, focused on the aggregation and management of royalty and mineral interests and non-operated working interests in the Haynesville Shale of north Louisiana and east Texas. For more information visit www.liveoakrp.com.

About Posse Resources

Posse Resources (formerly Peter Paul Petroleum Co.), founded by B.P. Huddleston in 1967, is a family-owned private company based in Houston, Texas. Posse focuses on the acquisition and management of mineral and royalty properties and non-operated working interests, primarily in Louisiana, Texas and Oklahoma, among other areas within the U.S. For more information on Posse Resources and its affiliated entities, visit www.PosseResources.com.


Contacts

Live Oak Resource Partners
Katy Franz (832) 982-0787
This email address is being protected from spambots. You need JavaScript enabled to view it.
Posse Resources
Mitchell Currie (713) 209-1111
This email address is being protected from spambots. You need JavaScript enabled to view it.

Plans to electrify half of fleet will reduce greenhouse gas emissions, support EV adoption

CHICAGO--(BUSINESS WIRE)--ComEd is going electric with more of its own fleet vehicles to help electrify the transportation sector, which accounts for one-third of all U.S. greenhouse gas (GHG) emissions, and advance the adoption of electric vehicle (EV) technology in Illinois.


ComEd’s current fleet of 3,000 vehicles includes 1,400 biodiesel-fueled line trucks and another 430 units that are capable of running on high-level ethanol-gasoline blends, or E85. More than 200 of its vehicles have electric hybrid or plug-in hybrid electric systems and another 10 are all-electric vehicles. ComEd plans to electrify 30 percent of its fleet by 2025. This will eliminate 2,000 metric tons of GHG emissions, in addition to the 4,000 metric tons that the ComEd fleet already avoids annually. The company’s goal of electrifying 50 percent of its fleet by 2030 has the potential to eliminate an additional 29,000 metric tons of GHG emissions.

“We’re all learning more about the link between air pollution and higher mortality rates from COVID-19 and the disproportionate impact on communities of color,” said ComEd CEO Joe Dominguez. “Cleaning up the transportation sector is key to improving the lives of our citizens. Greening our own fleet is one way we can help create cleaner air in our communities. A crucial next step is preparing the grid to support increased electrification of our large customer’s vehicle fleets and the widespread adoption of personal EVs.”

ComEd will replace end-of-life internal combustion vehicles with plug-in hybrid and fully electric vehicles, reducing fuel and maintenance costs and creating savings that will be passed on to customers. By 2025, all of the company’s light duty vehicles (LDVs) approaching the end of their life cycle will be replaced with electric vehicles, and all LDVs will be electrified by 2030.

There are now 21,885 EVs registered in Illinois, up from fewer than 8,000 registered EVs in 2017, according to the Secretary of State’s office. In addition to environmental benefits, key factors driving the growing popularity of EVs include lower operating costs compared to gas-powered cars. ComEd has recently introduced an EV Toolkit that provides information on savings, benefits and incentives for the purchase of electric vehicles, along with an overview of EV brands and models, rate options, EV chargers and a public charging station locator by zip code. ComEd.com/EV.

ComEd is a unit of Chicago-based Exelon Corporation (NASDAQ: EXC), a Fortune 100 energy company with approximately 10 million electricity and natural gas customers – the largest number of customers in the U.S. ComEd powers the lives of more than 4 million customers across northern Illinois, or 70 percent of the state’s population. For more information visit ComEd.com and connect with the company on Facebook, Twitter and YouTube.


Contacts

ComEd Media Relations
312-394-3500

California Grid Operator Confirms State’s Energy Supply Expected to Meet Demand Tonight as Heatwave Continues

PG&E Thanks All Customers for Coming Together to Conserve Power

Customers Strongly Urged to Continue Conserving through Thursday Night

SAN FRANCISCO--(BUSINESS WIRE)--Based on forecasts for electricity supply and demand, the state’s electric grid operator, the California Independent System Operator (CAISO), has confirmed that Pacific Gas and Electric Company (PG&E) will not need to employ rotating power outages on Wednesday.

PG&E has been on standby throughout the day and for the duration of this heat wave, which began Friday (Aug. 14). The company’s Emergency Operations Center remains open and prepared to initiate potential rotating outages at the request of the CAISO. PG&E teams will continue to coordinate with the CAISO as the heatwave extends through Thursday. The CAISO oversees the larger power grid and balances energy demand with supply.

Even with the request to start conserving energy an hour earlier, with a 2 p.m. start time today versus a 3 p.m. start time on Sunday, Monday and Tuesday, customers helped the state meet the energy challenge. Thanks to the conservation efforts of California residents, the CAISO was able to call off potential rotating outages Sunday, Monday, Tuesday and now Wednesday.

Electricity Conservation Is Key Through Thursday

Residential and commercial PG&E customers alike have all come together to conserve electricity and help avoid the need for rotating outages.

With the heatwave expected to continue at least through Thursday night, PG&E strongly encourages all customers to continue conserving to reduce overall power demand.

“The end of this record heatwave is in sight. Thanks to a remarkable joint effort among all Californians to conserve, the state’s grid has weathered this heat storm without significant interruption so far this week. We are incredibly appreciative of the contributions our customers have made to help avoid rotating outages. We urge our customers to keep up their great efforts to conserve through Thursday, and we thank them for their support and patience during this extreme weather event,” said Laurie Giammona, Senior Vice President and Chief Customer Officer for PG&E.

PG&E Tips to Save Energy and Reduce Usage

  • Raise the thermostat: Cool homes and use air conditioners more during morning hours. Set the thermostat to 78 degrees when at home during the rest of the day, health permitting. Turn it up to 85 degrees or turn it off when not at home.
  • Use a ceiling fan: Turn on a ceiling fan when using the air conditioner, which will allow the thermostat to be raised about 4 degrees to save on cooling costs with no reduction in comfort. Turn off fans and lights when you leave the room.
  • Cover windows: Use shade coverings and awnings so the air conditioner won’t have to work as hard to cool the home.
  • Avoid using the oven: Instead, cook on the stove, use a microwave or grill outside.
  • Limit the opening of refrigerators, which are major users of electricity in most homes. The average refrigerator is opened 33 times a day.
  • Clean clothes and dishes early: Use large energy-consuming appliances like washing machines and dishwashers earlier in the day or late at night after 10:00 pm.

PG&E Tips to Stay Safe and Cool

  • Plan ahead: Check the weather forecast to prepare for hot days.
  • Keep an emergency contact list: Keep a list of emergency phone numbers.
  • Have a buddy system: Check in on elderly or people with access and function needs.
  • Stay hydrated: Drink plenty of water, even when you are not thirsty.
  • Stay cool: Take a cool shower or bath and wear lightweight, loose, light-colored clothing.
  • Stay safe: Stay out of direct sunlight and avoid alcoholic or caffeinated beverages.

Rotating outages directed by the CAISO are not Public Safety Power Shutoffs, which are called by PG&E during specific high fire threat conditions, and they are not related to any issues with PG&E’s equipment or its ability to deliver energy locally.

About PG&E

Pacific Gas and Electric Company, a subsidiary of PG&E Corporation (NYSE:PCG), is one of the largest combined natural gas and electric energy companies in the United States. Based in San Francisco, with more than 23,000 employees, the company delivers some of the nation's cleanest energy to 16 million people in Northern and Central California. For more information, visit pge.com and pge.com/news


Contacts

Media Relations
415.973.5930

PG&E’s Emergency Operations Center Remains Open to Monitor and Respond to Numerous Wildfires in Its Service Area

SAN FRANCISCO--(BUSINESS WIRE)--Pacific Gas and Electric Company (PG&E) is reminding customers to continue taking steps to conserve energy today, despite slightly less adverse weather conditions than earlier in the week. The state’s electric grid operator, the California Independent System Operator (CAISO), has lifted their statewide Flex Alert, but with hot weather in today’s forecast, PG&E urges all customers to take the conservation steps that helped avoid rotating outages all week.

This week, PG&E and other California utilities informed customers of potential outages due to high demand driven by the continued heatwave. Customers across the state responded to the call to conserve energy, helping to avoid the need for rotating outages for the fourth day in a row.

PG&E’s Wildfire Safety Operations Center continues to monitor several substantial fires in our service area, including the LNU Lightning Complex in the North Bay, SCU Lightning Complex in San Jose, the Loyalton Fire in the Tahoe National Forest and the River Fire in Monterey County. During any wildfire, PG&E works closely with CAL FIRE and local fire agencies to de-energize PG&E equipment when necessary to protect first responders and the public.

PG&E funds the operation of existing cooling centers throughout the state. These centers fill a critical need for those who might not have the means to cool and shelter themselves from prolonged hot temperatures. To find a cooling center near you, please call your local city or county government, or call PG&E’s toll-free cooling center locator line at 1-877-474-3266 or visit pge.com/coolingcenters.

Energy conservation is the best way to prevent stress and strain on the local power grid, which helps to reduce heat-caused power outages.

PG&E Tips to Save Energy and Reduce Usage

PG&E strongly urges all customers to conserve energy through Thursday.

  • Raise the thermostat: Cool homes and use air conditioners more during morning hours. Set the thermostat to 78 degrees when at home during the rest of the day, health permitting. Turn it up to 85 degrees or turn it off when not at home.
  • Use a ceiling fan: Turn on a ceiling fan when using the air conditioner, which will allow the thermostat to be raised about 4 degrees to save on cooling costs with no reduction in comfort. Turn off fans and lights when you leave the room.
  • Cover windows: Use shade coverings and awnings so the air conditioner won’t have to work as hard to cool the home.
  • Avoid using the oven: Instead, cook on the stove, use a microwave or grill outside.
  • Limit the opening of refrigerators, which are major users of electricity in most homes. The average refrigerator is opened 33 times a day.
  • Clean clothes and dishes early: Use large energy-consuming appliances like washing machines and dishwashers earlier in the day or late at night after 10:00 pm. 

PG&E Tips to Stay Safe and Cool

  • Plan ahead: Check the weather forecast to prepare for hot days.
  • Keep an emergency contact list: Keep a list of emergency phone numbers.
  • Have a buddy system: Check in on elderly or frail people.
  • Stay hydrated: Drink plenty of water, even when you are not thirsty.
  • Stay cool: Take a cool shower or bath and wear lightweight, loose, light-colored clothing.
  • Stay safe: Stay out of direct sunlight and avoid alcoholic or caffeinated beverages. 

About PG&E

Pacific Gas and Electric Company, a subsidiary of PG&E Corporation (NYSE:PCG), is one of the largest combined natural gas and electric energy companies in the United States. Based in San Francisco, with more than 23,000 employees, the company delivers some of the nation's cleanest energy to 16 million people in Northern and Central California. For more information, visit pge.com and pge.com/news


Contacts

Media Relations
415.973.5930

HOUSTON--(BUSINESS WIRE)--PrimeEnergy Resources Corporation (NASDAQ: PNRG) announced today the following unaudited results for the periods ended June 30, 2020 and 2019:


Three Months Ended June 30,

Six Months Ended June 30,


2020


2019


2020


2019


Revenues

$

7,278,000


$

31,534,000


$

33,386,000


$

55,953,000


Net Loss

$

(6,266,000

)

$

5,775,000


$

(6,436,000

)

$

2,737,000


Earnings per Common Share:


Basic

$

(3.14

)

$

2.85


$

(3.23

)

$

1.35


Shares Used in Calculation of:


Basic EPS


1,994,177


2,026,119


1,994,675


2,031,569


Total assets at June 30, 2020 were $218,930,000 compared to $229,365,000 at December 31, 2019.

Oil and gas production and the average prices received (excluding gains and losses from derivatives) for the three and six months ended June 30, 2020 and 2019 were as follows:


Three Months Ended June 30,

Six Months Ended June 30,


2020


2019

Increase /
(Decrease)


2020


2019

Increase /
(Decrease)

Barrels of Oil Produced


144,000


332,000


(188,000

)


378,000


688,000


(310,000

)

Average Price Received

$

25.09


$

59.17

$

(11.00

)

$

37.89

$

55.84

$

(17.95

)

Oil Revenue

$

3,613,000

$

19,644,000

$

(16,031,000

)

$

14,324,000

$

38,442,000

$

(24,118

)

Mcf of Gas Sold


874,000


1,295,000


(421,000

)


1,812,000


2,243,000


(431,000

)

Average Price Received

$

0.62


$

1.05

$

(0.63

)

$

0.77

$

1.60

$

(0.83

)

Gas Revenue

$

543,000


$

1,355,000

$

(812

)

$

1,389,000

$

3,590,000

$

(2,201

)

Barrels of Natural Gas Liquids Sold


86,000


146,000


(60,000

)


213,000


288,000


(75,000

)

Average Price Received

$

5.76


$

16.27

$

(0.26

)

$

8.16

$

18.14

$

(9.98

)

Natural Gas Liquids Revenue

$

495,000


$

2,375,000

$

(1,880

)

$

1,738,000

$

5,219,000

$

(3,481

)

Total Oil & Gas Revenues

$

4,651,000


$

23,374,000

$

(18,723

)

$

17,451,000

$

47,251,000

$

(29,800

)

PrimeEnergy is an independent oil and natural gas company actively engaged in acquiring, developing and producing oil and natural gas, and providing oilfield services, primarily in Texas and Oklahoma. The Company’s common stock is traded on the Nasdaq Stock Market under the symbol PNRG. If you have any questions on this release, please contact Connie Ng at (713) 735-0000 ext 6416.

Forward-Looking Statements: This Report contains forward-looking statements that are based on management's current expectations, estimates and projections. Words such as "expects," "anticipates," "intends," "plans," "believes", "projects" and "estimates," and variations of such words and similar expressions are intended to identify such forward-looking statements. These statements constitute "forward-looking statements" within the meaning of Section 27A of the Securities Act of 1933, and are subject to the safe harbors created thereby. These statements are not guarantees of future performance and involve risks and uncertainties and are based on a number of assumptions that could ultimately prove inaccurate and, therefore, there can be no assurance that they will prove to be accurate. Actual results and outcomes may vary materially from what is expressed or forecast in such statements due to various risks and uncertainties. These risks and uncertainties include, among other things, the possibility of drilling cost overruns and technical difficulties, volatility of oil and gas prices, competition, risks inherent in the Company's oil and gas operations, the inexact nature of interpretation of seismic and other geological and geophysical data, imprecision of reserve estimates, and the Company's ability to replace and expand oil and gas reserves. Accordingly, stockholders and potential investors are cautioned that certain events or circumstances could cause actual results to differ materially from those projected.


Contacts

PrimeEnergy Resources Corporation
Connie Ng
(713) 735-0000 ext 6416

MINNEAPOLIS--(BUSINESS WIRE)--The Board of Directors of Xcel Energy Inc. (NASDAQ: XEL) today declared a quarterly dividend on its common stock of 43 cents per share. The dividends are payable October 20, 2020, to shareholders of record on September 15, 2020.


Xcel Energy is a major U.S. electricity and natural gas company, with operations in 8 Western and Midwestern states. Xcel Energy provides a comprehensive portfolio of energy-related products and services to 3.7 million electricity customers and 2.1 million natural gas customers through its regulated operating companies. Company headquarters are located in Minneapolis. More information is available at www.xcelenergy.com.

This information is not given in connection with any sale or offer for sale or offer to buy any securities.

Statements in this press release regarding Xcel Energy’s business which are not historical facts are “forward-looking statements” that involve risks and uncertainties. For a discussion of such risks and uncertainties, which could cause actual results to differ from those contained in the forward-looking statements, see “Risk Factors” in the Company's Annual Report on Form 10-K for the most recently ended fiscal year.


Contacts

Xcel Energy, Minneapolis
Shareholder Services
Darin Norman (612) 337-2310
or
Paul Johnson, Vice President, Investor Relations (612) 215-4535
or
Xcel Energy Media Relations Representatives (612) 215-5300

NINGBO, China--(BUSINESS WIRE)--Recently, the research project titled "Development of 1.5 T cryogen-free superconducting magnets" has achieved a phased breakthrough and the University of Nottingham Ningbo China (UNNC) is expected to introduce the world's first 1.5T rotatable dual-gesture magnetic resonance imaging (MRI) scanner soon.


This is a collaboration among UNNC, Ningbo Gaosi Superconducting Technology Co. Ltd, Ningbo XinGaoYi Medical Equipment Co. Ltd, the First Affiliated Hospital of Zhejiang University School of Medicine, and China Academy of Sciences University Ningbo Hwamei Hospital.

Helium, a rare gas and a by-product of natural gas industry, is the ideal cooling medium to achieve the extreme-low temperature in MRI, but has become strategic material and experienced a rocketed price rise in recent years. The development of cryogen-free superconducting magnets has become more and more important.

"We have successfully developed the first prototype 1.5T cryogen-free superconducting magnet, and run it for over one year to prove its feasibility and stability," said Dr Chengbo Wang, the director of Magnetic Resonance Imaging (MRI) Research Centre at UNNC. This new magnet replaces the refrigerant liquid helium with low-cost copper, making the new MRI system extremely safe. It is expected to save six billion RMB of cost within five years when replacing the traditional MRI system.

According to Dr Wang, his team is responsible for the development of innovative applications for this new cryogen-free MRI. Currently the team is working on developing a rotatable dual-gesture 1.5T MRI, which is probably the first clinically available whole-body rotatable MRI around the globe. The machine is expected to settle in UNNC in the near future.

“Due to the explosive property of liquid helium, conventional MRI are difficult and not safe to move or rotate,” explains Dr Wang. Therefore, the successful development of the whole-body superconducting cryogen-free magnets indicates many new breakthroughs such as mobile MRI, or MRI scans in a standing gesture.

Dr Wang and his team are also seeking solutions to install cryogen-free MRIs in small or enclosed spaces, which will significantly boost the improvement in mobile medical technology.


Contacts

University of Nottingham Ningbo China
Chuchu Lou
Content Manager
This email address is being protected from spambots. You need JavaScript enabled to view it.

DUBLIN--(BUSINESS WIRE)--The "Vessel Traffic Management - Global Market Trajectory & Analytics" report has been added to ResearchAndMarkets.com's offering.


The publisher brings years of research experience to the 6th edition of this report. The 226-page report presents concise insights into how the pandemic has impacted production and the buy side for 2020 and 2021. A short-term phased recovery by key geography is also addressed.

Global Vessel Traffic Management Market to Reach $4.8 Billion by 2027

Amid the COVID-19 crisis, the global market for Vessel Traffic Management estimated at US$3.2 Billion in the year 2020, is projected to reach a revised size of US$4.8 Billion by 2027, growing at a CAGR of 6.1% over the analysis period 2020-2027.

Equipment, one of the segments analyzed in the report, is projected to record a 5.9% CAGR and reach US$2.1 Billion by the end of the analysis period. After an early analysis of the business implications of the pandemic and its induced economic crisis, growth in the Solutions segment is readjusted to a revised 6.8% CAGR for the next 7-year period.

The U.S. Market is Estimated at $929.9 Million, While China is Forecast to Grow at 5.7% CAGR

The Vessel Traffic Management market in the U.S. is estimated at US$929.9 Million in the year 2020. China, the world`s second largest economy, is forecast to reach a projected market size of US$838.3 Million by the year 2027 trailing a CAGR of 5.7% over the analysis period 2020 to 2027. Among the other noteworthy geographic markets are Japan and Canada, each forecast to grow at 5.8% and 4.9% respectively over the 2020-2027 period. Within Europe, Germany is forecast to grow at approximately 5% CAGR.

Services Segment to Record 5.4% CAGR

In the global Services segment, USA, Canada, Japan, China and Europe will drive the 5.4% CAGR estimated for this segment. These regional markets accounting for a combined market size of US$574.7 Million in the year 2020 will reach a projected size of US$832.8 Million by the close of the analysis period. China will remain among the fastest growing in this cluster of regional markets. Led by countries such as Australia, India, and South Korea, the market in Asia-Pacific is forecast to reach US$548.7 Million by the year 2027.

Competitors identified in this market include, among others:

  • Frequentis AG
  • Indra Sistemas SA
  • Japan Radio Co., Ltd.
  • Kelvin Hughes Ltd.
  • Kongsberg Gruppen ASA
  • L3 Technologies, Inc.
  • Leonardo SpA
  • Rolta India Ltd.
  • SAAB AB
  • Signalis
  • Terma A/S
  • Thales Group
  • Tokyo Keiki, Inc.
  • Vissim AS

Key Topics Covered:

I. INTRODUCTION, METHODOLOGY & REPORT SCOPE

II. EXECUTIVE SUMMARY

1. MARKET OVERVIEW

  • Global Competitor Market Shares
  • Vessel Traffic Management Competitor Market Share Scenario Worldwide (in %): 2019 & 2025
  • Impact of COVID-19 and a Looming Global Recession

2. FOCUS ON SELECT PLAYERS

3. MARKET TRENDS & DRIVERS

4. GLOBAL MARKET PERSPECTIVE

III. MARKET ANALYSIS

IV. COMPETITION

Total Companies Profiled: 46

For more information about this report visit https://www.researchandmarkets.com/r/7selhk


Contacts

ResearchAndMarkets.com
Laura Wood, Senior Press Manager
This email address is being protected from spambots. You need JavaScript enabled to view it.

For E.S.T Office Hours Call 1-917-300-0470
For U.S./CAN Toll Free Call 1-800-526-8630
For GMT Office Hours Call +353-1-416-8900

Veteran executive to lead company’s next phase of growth and innovation

BOSTON--(BUSINESS WIRE)--BriefCam, the industry’s leading provider of Video Content Analytics and VIDEO SYNOPSIS® solutions, today announced the appointment of Gil Briman as its Chief Executive Officer. Briman joins the organization to build upon BriefCam’s momentum delivering the best-in-class video analytics platform.

“Gil is a stand-out international technology executive with an impressive track record of market-leading business growth, operational excellence and innovation,” said Seymour Liebman, Executive Vice President, CEO and General Counsel of Canon USA, Inc. and Chairman of BriefCam. “His strategic vision, inspiring leadership and ability to execute are exactly what BriefCam needs as it enters its next chapter. We are thrilled to welcome him aboard and look forward to an exciting future as the company continues to be at the forefront of the video analytics market.”


As CEO, Briman will focus on driving the company strategy to help organizations transform video into actionable intelligence through BriefCam’s innovative and comprehensive video content analytics platform.

“This is an exciting time for intelligent video surveillance, and I am thrilled to lead the BriefCam team towards further growth and innovation,” said Briman. “The company’s long-standing and successful track record in the video analytics space, coupled with a winning strategy, has enabled it to grow continuously. Building further on this success is a challenge I accept with enthusiasm, confidence, and fierce determination. The company’s innovation and differentiation resonates strongly across verticals and industries, and I look forward to this next chapter for the company.”

Briman has 27 years of experience leading global technology companies. Prior to joining BriefCam, he held the position of CEO at Solcon Group, a dynamic power electronics company that has been at the forefront of design, development and manufacturing of industrial electronic systems. During his tenure at Solcon, Briman established a strong track record in initiating and leading change, obtaining strong results and strengthening innovation amid a rapidly market landscape. Before joining Solcon, Briman served as Vice President for APAC at Mellanox, a computer network products company (recently acquired by NVIDIA) where he led a complex business to drive substantial growth and instantiated significant strategic alliances with leading OEM partners. Previous to Mellanox, Briman was Vice President and General Manager at Amdocs, a company specializing in software and services for communications, media and financial services providers and digital enterprises.

About BriefCam

BriefCam is the industry’s leading provider of Deep Learning and VIDEO SYNOPSIS® solutions for rapid video review and search, face and license plate recognition, real-time alerting, and quantitative video insights. By transforming raw video into actionable intelligence, BriefCam dramatically shortens the time-to-target for security threats while increasing safety and optimizing operations. BriefCam’s award-winning products are deployed by law enforcement and public safety organizations, government and transportation agencies, major enterprises, healthcare and educational institutions, and local communities worldwide.


Contacts

BriefCam
Stephanie Weagle
CMO
This email address is being protected from spambots. You need JavaScript enabled to view it.

Moxie & Mettle
Justine Schneider
201-921-9428
This email address is being protected from spambots. You need JavaScript enabled to view it.

LONDON--(BUSINESS WIRE)--#FloatingLiquefiedNaturalGasMarket--The global floating liquefied natural gas market size is expected to grow by USD 20.69 billion during 2020-2024. The report also provides the market impact and new opportunities created due to the COVID-19 pandemic. We expect the impact to be significant in the first quarter but gradually lessen in subsequent quarters – with a limited impact on the full-year economic growth.


Request challenges and opportunities influenced by COVID-19 pandemic - Request a Free Sample Report on COVID-19 Impacts

The global liquid fuel consumption grew at a significant rate during 2011-2019 and it is expected to continue growing at a high rate during the forecast period. However, most oil-producing countries do not have large additional capacities. Hence, there is a rising need to discover greenfield oil wells in the existing and new oil fields to meet the high demand for fuel. In addition, natural gas has witnessed a higher rise in consumption than oil due to increasing adoption of natural gas as a fuel. Also, with the increased consumption of fuel from the developing economies such as India and China, the demand for LNG is likely to propel during the forecast period, thereby increasing the demand for FLNG projects during the forecast period.

To learn more about the global trends impacting the future of market research, download a free sample: https://www.technavio.com/talk-to-us?report=IRTNTR44490

As per Technavio, the growing preference for road transportation will have a positive impact on the market and contribute to its growth significantly over the forecast period. This research report also analyzes other significant trends and market drivers that will influence market growth over 2020-2024.

Floating Liquefied Natural Gas Market: Growing Preference for Road Transportation

The growing preference for road transportation for last mile delivery and the consequent increase in the use of heavy, medium, and light-duty vehicles in emerging countries, will lead to a rise in vehicles, especially HCVs. One of the main reasons for enterprises to opt for road transport for transportation of cargo is the limited rail freight services within a country. The lack of sufficient freight services causes companies to choose roadways as a reliable mode of transportation of products. In India, road transportation is a widely chosen means for container transport. The primary reason for this the high rail freight cost, poor last-mile connectivity, and the lack of availability of freight trains. Road transportation vehicles travel long distances every day to deliver packages, especially during this COVID-19 pandemic, which leads to an increase in the consumption of liquid fuels. This will drive the growth of the global floating liquified natural gas market during the forecast period.

“Other factors such as the increasing demand for cleaner fuel, and the rise in number of deepwater and ultra-deepwater drilling projects will have a significant impact on the growth of the floating liquefied natural gas market value during the forecast period,” says a senior analyst at Technavio.

Register for a free trial today and gain instant access to 17,000+ market research reports

Technavio's SUBSCRIPTION platform

Floating Liquefied Natural Gas Market: Segmentation Analysis

This market research report segments the floating liquefied natural gas market by production capacity (large-scale capacity and small-scale capacity) and geography (North America, MEA, APAC, Europe, and South America).

The North American region led the floating liquefied natural gas market share in 2019, followed by MEA, APAC, Europe, and South America respectively. During the forecast period, the North American region is expected to register the highest incremental growth due to the presence of leading vehicle manufacturers.

Technavio’s sample reports are free of charge and contain multiple sections of the report, such as the market size and forecast, drivers, challenges, trends, and more. Request a free sample report

Some of the key topics covered in the report include:

Market Drivers

Market Challenges

Market Trends

Vendor Landscape

  • Vendors covered
  • Vendor classification
  • Market positioning of vendors
  • Competitive scenario

About Technavio

Technavio is a leading global technology research and advisory company. Their research and analysis focuses on emerging market trends and provides actionable insights to help businesses identify market opportunities and develop effective strategies to optimize their market positions.

With over 500 specialized analysts, Technavio’s report library consists of more than 17,000 reports and counting, covering 800 technologies, spanning across 50 countries. Their client base consists of enterprises of all sizes, including more than 100 Fortune 500 companies. This growing client base relies on Technavio’s comprehensive coverage, extensive research, and actionable market insights to identify opportunities in existing and potential markets and assess their competitive positions within changing market scenarios.


Contacts

Technavio Research
Jesse Maida
Media & Marketing Executive
US: +1 844 364 1100
UK: +44 203 893 3200
Email: This email address is being protected from spambots. You need JavaScript enabled to view it.
Website: www.technavio.com/

DUBLIN--(BUSINESS WIRE)--The "Marine Fuel Injection System - Global Market Trajectory & Analytics" report has been added to ResearchAndMarkets.com's offering.


The publisher brings years of research experience to the 8th edition of this report. The 287-page report presents concise insights into how the pandemic has impacted production and the buy side for 2020 and 2021. A short-term phased recovery by key geography is also addressed.

Global Marine Fuel Injection System Market to Reach $5.6 Billion by 2027

Amid the COVID-19 crisis, the global market for Marine Fuel Injection System estimated at US$4.7 Billion in the year 2020, is projected to reach a revised size of US$5.6 Billion by 2027, growing at a CAGR of 2.5% over the analysis period 2020-2027.

Inland Waterways Transport Vessel, one of the segments analyzed in the report, is projected to record a 2.6% CAGR and reach US$1.5 Billion by the end of the analysis period. After an early analysis of the business implications of the pandemic and its induced economic crisis, growth in the Commercial Vessels segment is readjusted to a revised 2.6% CAGR for the next 7-year period.

The U.S. Market is Estimated at $1.3 Billion, While China is Forecast to Grow at 4.7% CAGR

The Marine Fuel Injection System market in the U.S. is estimated at US$1.3 Billion in the year 2020. China, the world`s second largest economy, is forecast to reach a projected market size of US$1.1 Billion by the year 2027 trailing a CAGR of 4.7% over the analysis period 2020 to 2027. Among the other noteworthy geographic markets are Japan and Canada, each forecast to grow at 0.6% and 1.8% respectively over the 2020-2027 period. Within Europe, Germany is forecast to grow at approximately 1.1% CAGR.

Offshore Support Vessels Segment to Record 2.1% CAGR

In the global Offshore Support Vessels segment, USA, Canada, Japan, China and Europe will drive the 1.7% CAGR estimated for this segment. These regional markets accounting for a combined market size of US$736.7 Million in the year 2020 will reach a projected size of US$828.4 Million by the close of the analysis period. China will remain among the fastest growing in this cluster of regional markets. Led by countries such as Australia, India, and South Korea, the market in Asia-Pacific is forecast to reach US$759.2 Million by the year 2027, while Latin America will expand at a 2.8% CAGR through the analysis period.

Competitors identified in this market include, among others:

  • Caterpillar, Inc.
  • Cummins, Inc.
  • Delphi Automotive PLC
  • Denso Corporation
  • Liebherr International Deutschland GmbH
  • MAN SE
  • Robert Bosch GmbH
  • Rolls-Royce Holdings PLC
  • Woodward, Inc.
  • YANMAR Co., Ltd.

Key Topics Covered:

I. INTRODUCTION, METHODOLOGY & REPORT SCOPE

II. EXECUTIVE SUMMARY

1. MARKET OVERVIEW

  • Product Overview
  • Marine Fuel Injection System: A Prelude
  • Global Competitor Market Shares
  • Marine Fuel Injection System Competitor Market Share Scenario Worldwide (in %): 2019 & 2025
  • Impact of Covid-19 and a Looming Global Recession

2. FOCUS ON SELECT PLAYERS

3. MARKET TRENDS & DRIVERS

  • Innovations & Advancements

4. GLOBAL MARKET PERSPECTIVE

III. MARKET ANALYSIS

IV. COMPETITION

Total Companies Profiled: 47

For more information about this report visit https://www.researchandmarkets.com/r/kqkk0p


Contacts

ResearchAndMarkets.com
Laura Wood, Senior Press Manager
This email address is being protected from spambots. You need JavaScript enabled to view it.
For E.S.T Office Hours Call 1-917-300-0470
For U.S./CAN Toll Free Call 1-800-526-8630
For GMT Office Hours Call +353-1-416-8900

Offshore Source Logo

Offshore Source keeps you updated with relevant information concerning the Offshore Energy Sector.

Any views or opinions represented on this website belong solely to the author and do not represent those of the people, institutions or organizations that Offshore Source or collaborators may or may not have been associated with in a professional or personal capacity, unless explicitly stated.

Corporate Offices

Technology Systems Corporation
8502 SW Kansas Ave
Stuart, FL 34997

info@tscpublishing.com