Business Wire News

ANN ARBOR, Mich.--(BUSINESS WIRE)--The Coretec Group, Inc., (OTCQB: CRTG), developers of engineered silicon, a lithium-ion battery with a silicon-anode, and 3D volumetric displays, will host a shareholder call in mid-to-late April to discuss first-quarter 2022 activities.


The Coretec Group is developing a lithium-ion battery with a silicon anode that will improve battery cycling stability, enable longer run times, and allow for greater energy density in applications such as electric vehicles, mobile devices, and space exploration. The shareholder call will provide background and an update on the Company’s progress in its battery development.

During the shareholder call, the company will discuss current activities and advancements, including developments related to its lithium-ion battery with a silicon anode, its recently filed full-utility patent, progress on synthesizing cyclohexasilane (CHS) in its own wet laboratory, and a recent presentation prepared for a domestic battery conference hosted by the U.S. Department of Energy’s Argonne National Laboratory.

Chief Executive Officer Matthew Kappers, Chief Financial Officer Matthew Hoffman, and Board Director and Co-Chairman Simon Calton will discuss the Company’s recent achievements and future plans, as well as answer questions from the investment community and news media.

The company will share the call date, time and access details in April.

About The Coretec Group

The Coretec Group, Inc. is developing a portfolio of engineered silicon to improve energy-focused verticals, including electric vehicle and consumer batteries, solid-state lighting (LEDs), and semiconductors, as well as 3D volumetric displays and printable electronics. The Coretec Group serves the global technology markets in energy, electronics, semiconductor, solar, health, environment, and security.

For more information, please visit thecoretecgroup.com. Follow The Coretec Group on Twitter and LinkedIn.

Forward-Looking Statements:

The statements in this press release that relate to The Coretec Group’s expectations with regard to the future impact on the Company’s results from operations are forward-looking statements and may involve risks and uncertainties, some of which are beyond our control. Such risks and uncertainties are described in greater detail in our filings with the U.S. Securities and Exchange Commission. Since the information in this press release may contain statements that involve risk and uncertainties and are subject to change at any time, the Company’s actual results may differ materially from expected results. We make no commitment to disclose any subsequent revisions to forward-looking statements. This release does not constitute an offer to sell or a solicitation of offers to buy any securities of any entity.


Contacts

The Coretec Group, Inc.
Lindsay McCarthy
This email address is being protected from spambots. You need JavaScript enabled to view it.
+1 (866) 916-0833

DUBLIN--(BUSINESS WIRE)--The "Subsea Systems - Global Market Trajectory & Analytics" report has been added to ResearchAndMarkets.com's offering.


Amid the COVID-19 crisis, the global market for Subsea Systems estimated at US$11.4 Billion in the year 2020, is projected to reach a revised size of US$14.1 Billion by 2026, growing at a CAGR of 3.5% over the analysis period.

SURF, one of the segments analyzed in the report, is projected to record a 3.9% CAGR and reach US$4.7 Billion by the end of the analysis period. After a thorough analysis of the business implications of the pandemic and its induced economic crisis, growth in the Subsea Trees segment is readjusted to a revised 2.7% CAGR for the next 7-year period.

The U.S. Market is Estimated at $1.7 Billion in 2021, While China is Forecast to Reach $962.3 Million by 2026

The Subsea Systems market in the U.S. is estimated at US$1.7 Billion in the year 2021. China, the world`s second largest economy, is forecast to reach a projected market size of US$962.3 Million by the year 2026 trailing a CAGR of 3.8% over the analysis period. Among the other noteworthy geographic markets are Japan and Canada, each forecast to grow at 2.9% and 3.1% respectively over the analysis period. Within Europe, Germany is forecast to grow at approximately 2.3% CAGR.

Subsea Control Systems Segment to Reach $1.3 Billion by 2026

In the global Subsea Control Systems segment, USA, Canada, Japan, China and Europe will drive the 2% CAGR estimated for this segment. These regional markets accounting for a combined market size of US$633.9 Million in the year 2020 will reach a projected size of US$727.6 Million by the close of the analysis period. China will remain among the fastest growing in this cluster of regional markets. Led by countries such as Australia, India, and South Korea, the market in Asia-Pacific is forecast to reach US$77.2 Million by the year 2026.

Select Competitors (Total 36 Featured) -

  • Aker Solutions ASA
  • Baker Hughes, Inc.
  • Dril-Quip, Inc.
  • Kongsberg Gruppen ASA
  • McDermott International, Inc.
  • National Oilwell Varco
  • Oceaneering International, Inc.
  • OneSubsea
  • Parker Hannifin Corporation
  • Proserv Group Inc.
  • Saipem S.p.A.
  • Siemens AG
  • Subsea 7 S.A.
  • TechnipFMC plc

Key Topics Covered:

I. METHODOLOGY

II. EXECUTIVE SUMMARY

1. MARKET OVERVIEW

  • Influencer Market Insights
  • World Market Trajectories
  • Impact of Covid-19: A Looming Global Recession and Depressive Oil Industry Outlook for 2020
  • Massive Decline in Crude Oil Demand Pushes Oil Industry CAPEX and E&P Spending to Downward Trajectory
  • Global Daily Crude Oil Demand in Million Barrels for the Years 2015 through 2020
  • World E&P Spending (in US$ Billion) for the Years 2016 through 2021
  • Breakdown of Global E&P Spending (in %) by Supply Segment for the Year 2019 & 2020
  • Breakdown of North American E&P Capital Spending (in %) by Type of Company for 2020
  • Breakdown of CAPEX Reductions (in US$ Billion) by Type of Oil Company in 1Q 2020

2. FOCUS ON SELECT PLAYERS

3. MARKET TRENDS & DRIVERS

  • Favorable Long-Term Forecasts for Oil & Gas Sector Instil Market Optimism
  • Top Countries with Proven Reserves of Crude Oil in Billion Barrels for the Years 2014-2019
  • Fossil Fuel Consumption to Remain Unperturbed Despite Rise of Renewables
  • Breakdown World Energy Demand (in %) by Fuel Type for the Years 2019 and 2040
  • Emphasis on Migration from Onshore to Offshore Operations to Augment Long-Term Growth Prospects
  • Offshore Oil and Gas Exploration & Production Expenditure Worldwide by Segment (2015-2019): Percentage Breakdown of Expenditure for Drilling, Engineering, Procurement, Construction, Installation (EPCI), Life of Field, Offshore Supply Vehicle, and Subsea
  • Growing Importance of Deep & Ultra Deep Water Hydrocarbon Exploration Instigates Robust Growth
  • New Offshore Projects Worldwide Prioritize Deep & Ultra Deep Water Exploration
  • Breakdown of Global Oil Production Volume by Onshore, Offshore, and Offshore Deepwater Activity for the Years 2011, 2015 and 2019
  • Subsea Capital Expenditure Worldwide by Depth of Installation (2019 & 2022): Percentage Breakdown of CAPEX for Installations at Depth of Below 99 Meters, 100-499, 500-999, 1000-1499, and 1500 Meters and Above
  • Rise of Sophisticated EOR Technologies Augments Subsea Systems Market
  • Brief Description of EOR Methods
  • A Glance at Select Chemical EOR Projects Worldwide
  • Technology Advancements Widen Scope & Span of Subsea Systems
  • A Brief Review of Technology Innovations in the Subsea Systems Domain
  • Digitalization and IoT Step-In to Revolutionize Subsea Landscape
  • Subsea Systems Market: Strongly Influenced by Trends in Oil Prices
  • Crude Prices Tumble as Covid-19 Pandemic Weakens Demand
  • Average Annual OPEC Crude Oil Prices (in US$ per Barrel) for Years 2010 through 2021
  • OPEC Steps In with Production Cut Strategy to Curb Declining Trend in Crude Prices
  • A Glimpse of OPEC's April 2020 Production Cut Deal

4. GLOBAL MARKET PERSPECTIVE

III. MARKET ANALYSIS

IV. COMPETITION

For more information about this report visit https://www.researchandmarkets.com/r/ce25ua


Contacts

ResearchAndMarkets.com
Laura Wood, Senior Press Manager
This email address is being protected from spambots. You need JavaScript enabled to view it.
For E.S.T Office Hours Call 1-917-300-0470
For U.S./CAN Toll Free Call 1-800-526-8630
For GMT Office Hours Call +353-1-416-8900

PARIS--(BUSINESS WIRE)--Technip Energies (PARIS:TE) (the “Company”), a leading Engineering & Technology company for the Energy Transition, today publishes its 2021 Form 20-F.

The Company filed its 2021 Form 20-F with the United States Securities and Exchange Commission (SEC).

The 2021 Form 20-F is available on:
https://investors.technipenergies.com/regulatory-filings

Technip Energies will hold its Annual General Meeting in Schiphol, the Netherlands, on May 5, 2022. The convening notice, agenda and all related documents are available at https://investors.technipenergies.com/events-presentations/agm.

About Technip Energies

Technip Energies is a leading Engineering & Technology company for the energy transition, with leadership positions in Liquefied Natural Gas (LNG), hydrogen and ethylene as well as growing market positions in blue and green hydrogen, sustainable chemistry and CO2 management. The company benefits from its robust project delivery model supported by extensive technology, products and services offering.

Operating in 34 countries, our 15,000 people are fully committed to bringing our client’s innovative projects to life, breaking boundaries to accelerate the energy transition for a better tomorrow.

Technip Energies is listed on Euronext Paris with American depositary receipts (“ADRs”) traded over-the-counter in the United States.

For further information: www.technipenergies.com.


Contacts

Investor Relations

Phillip Lindsay
Vice-President, Investor Relations
Tel: +44 203 429 3929
Email: This email address is being protected from spambots. You need JavaScript enabled to view it.

Media Relations

Stella Fumey
Director, Press Relations & Digital Communications
Tel: +33 1 85 67 40 95
Email: This email address is being protected from spambots. You need JavaScript enabled to view it.

Jason Hyonne
Press Relations & Social Media Lead
Tel: +33 1 47 78 22 89
Email: This email address is being protected from spambots. You need JavaScript enabled to view it.

Oceana Applauds Lease Sale Announcement as Important Step Toward a Clean Energy Future

WASHINGTON--(BUSINESS WIRE)--#ProtectOurCoast--Today the Biden-Harris administration announced a wind energy auction will take place off the Carolinas on May 11, for 110,091 acres in the Carolina Long Bay offshore wind energy area off North Carolina’s coast. This action builds on the Biden-Harris administration’s commitment to bringing 30 GW of offshore wind power online by 2030 and North Carolina’s goal of 2.8 GW of offshore wind power by 2030. This marks the Biden-Harris administration’s first lease sale off the Carolinas.


Oceana applauded the announcement and released the following statement from campaign director Diane Hoskins:

“Today’s announcement is an important step forward for job creation and securing our clean energy future. Oceana applauds President Biden for working to make offshore wind a reality in the United States. Offshore wind is a critical piece of the puzzle when confronting the climate crisis and replacing the dirty fossil fuels that are driving climate change. Today’s lease sale announcement will help us meet our clean energy goals, which will support the United States becoming energy independent.

Since oil and gas prices are set by global markets, Americans are vulnerable to erratic changes in global oil prices that can be manipulated by autocrats like Putin. Worse, instead of helping lower gas prices, Big Oil is raking in billions of dollars in record profits. While the economic risks of relying on dirty fossil fuels are on full display right now, we know that our oceans can be a part of the solution. Advancing clean, domestic offshore wind energy can create jobs, reduce our reliance on fossil fuels, and help fight climate change. It’s great to see the Biden-Harris administration tackling this challenge head on. Now it’s time for President Biden to follow through on his campaign commitment to protect our oceans and coasts from dirty and dangerous offshore drilling.”

Oceana is the largest international advocacy organization dedicated solely to ocean conservation. Oceana is rebuilding abundant and biodiverse oceans by winning science-based policies in countries that control one-third of the world’s wild fish catch. With more than 225 victories that stop overfishing, habitat destruction, pollution, and the killing of threatened species like turtles and sharks, Oceana’s campaigns are delivering results. A restored ocean means that 1 billion people can enjoy a healthy seafood meal, every day, forever. Together, we can save the oceans and help feed the world. Visit usa.oceana.org to learn more.


Contacts

Austin Matheny, This email address is being protected from spambots. You need JavaScript enabled to view it., 858.395.5577
Dustin Cranor, This email address is being protected from spambots. You need JavaScript enabled to view it., 954.348.1314

SACRAMENTO, Calif.--(BUSINESS WIRE)--Following is a statement from Patrick A. Weller, chairman and CEO of Sol Power Energy, Inc., to foster a path to agricultural solvency for the California family-owned and operated farm:


Sol Power Energy, Inc. today announced Phase II of a multijurisdictional solar distributed generation program for Vino Farms, LLC as part of an ongoing plan for VINO FARMS to use holistic, ecological, and ethical practices in wine grape farming.

Over the past three years, VINO FARMS VP and partner Craig Ledbetter has been converting select vineyards to Biodynamic™ (BD) farming practices, while simultaneously implementing solar photovoltaic systems for irrigation pumping, as a water use efficiency measure.

Air, fire, water, and at times even the abundance of Mother Earth’s energy seem to oppose California agricultural operators. The Clean Air Act, the Sustainable Groundwater Management Act (SGMA), PG&E’s 2022 Wildfire Mitigation Plan (WMP), and most recently PG&E's 2023 General Rate Case (GRC) all contain compliance requirements that can drastically affect the ability of a California family-owned and operated farm to meet its long-term debts and other financial obligations.

Over the past two years, during Phase I, the parties utilized world-class COVID-19 control and prevention practices to successfully develop nearly 1 megawatt of flood-resistant, elevated solar generation plants supplying enough electricity to meet the needs of 164 U.S. homes.

SOL POWER has been retained to provide a broad range of professional services and duties related to the strategic planning, design, development, delivery, and interconnection of renewable energy projects. The solar generation systems were implemented in the Pacific Gas and Electric Company (PG&E) and Sacramento Municipal Utility District (SMUD) service territories within Sacramento and San Joaquin counties.

VINO FARMS, with offices located in Lodi, Healdsburg, Napa, and Paso Robles, is a multi-generational farming operation owned and operated by the Ledbetter family since the 1970s. The company manages or owns nearly 17,000 total acres of vineyards in California including 4,500 acres in the Lodi region.

Craig Ledbetter, VINO FARMS VP and partner stated, “The implementation of solar projects on farmland exposes owners to a range of risks from numerous authorities having jurisdiction. Patrick A. Weller, chairman and CEO of Sol Power Energy, Inc. exhibited the highest standard of care, trustworthiness, risk mitigation, and fiduciary responsibility for our multimillion-dollar project.”

Sol Power Energy, Inc. is a minority-owned California corporation with operations in Sacramento, California. With nearly 30 years of experience in the U.S. energy services company industry, SOL POWER offers free technical assistance to farmers to help them to understand the economics and technical advantages of renewable energy programs to offset their escalating utility expense.

“PG&E intends an initial increase in average electric rates for its agricultural, commercial, and industrial customers between 7 and 25 percent starting in 2023, with a corresponding increase in average gas rates of up to approximately 4 percent. Our objective is to help agricultural producers of wine grapes, livestock, milk production, and crops to obtain renewable energy solutions that foster energy cost savings and sustainable water and food supply,” stated Patrick A. Weller, chairman and CEO of Sol Power Energy, Inc.

Sol Power Energy, Inc. is in the development of MetaDigital™ marketing services for the development of scheduled and on-demand virtual learning environments to share SOL POWER Renewable Best Practices for Agricultural Operators, to include the future integration of virtual reality (VR) and augmented reality (AR) components.


Contacts

Patrick A. Weller, chairman and CEO of Sol Power Energy, Inc., This email address is being protected from spambots. You need JavaScript enabled to view it. (916) 426-8399

DUBLIN--(BUSINESS WIRE)--The "G8 Countries Utilities - Market Summary, Competitive Analysis and Forecast, 2016-2025" report has been added to ResearchAndMarkets.com's offering.


The G8 Utilities industry profile provides top-line qualitative and quantitative summary information including: industry size (value 2016-20, and forecast to 2025).

The profile also contains descriptions of the leading players including key financial metrics and analysis of competitive pressures within the industry.

Key Highlights

  • The G8 countries contributed $3,183.1 billion in 2020 to the global utilities industry, with a compound annual growth rate (CAGR) of -0.1% between 2016 and 2020. The G8 countries are expected to reach a value of $3,486.6 billion in 2025, with a CAGR of 1.8% over the 2020-25 period.
  • Among the G8 nations, the US is the leading country in the utilities industry, with market revenues of $993.1 billion in 2020. This was followed by Germany and the UK, with a value of $587.1 and $432.2 billion, respectively.
  • The US is expected to lead the utilities industry in the G8 nations with a value of $1,069.3 billion in 2016, followed by Germany and the UK with expected values of $616.2 and $486.3 billion, respectively.

Scope

  • Save time carrying out entry-level research by identifying the size, growth, major segments, and leading players in the G8 utilities industry
  • Use the Five Forces analysis to determine the competitive intensity and therefore attractiveness of the G8 utilities industry
  • Leading company profiles reveal details of key utilities industry players' G8 operations and financial performance
  • Add weight to presentations and pitches by understanding the future growth prospects of the G8 utilities industry with five year forecasts
  • Compares data from the US, Canada, Germany, France, UK, Italy, Russia and Japan, alongside individual chapters on each country

Reasons to Buy

  • What was the size of the G8 utilities industry by value in 2020?
  • What will be the size of the G8 utilities industry in 2025?
  • What factors are affecting the strength of competition in the G8 utilities industry?
  • How has the industry performed over the last five years?
  • What are the main segments that make up the G8 utilities industry?

Companies Mentioned

  • Hydro-Quebec
  • Enbridge Inc.
  • Suncor Energy Inc.
  • BC Hydro
  • Electricite de France SA
  • Veolia Environnement S.A.
  • TotalEnergies S.E.
  • Engie SA
  • EnBW Energie Baden-Wuerttenberg AG
  • RWE AG
  • WINGAS GmbH
  • Enel SpA
  • Hera SpA
  • Edison S.p.A.
  • The Tokyo Electric Power Company Hol
  • Tokyo Gas Co., Ltd.
  • Kurita Water Industries Ltd
  • The Kansai Electric Power Co, Incorpora
  • OAO Gazprom
  • JSC Inter RAO
  • Novatek
  • Lukoil Oil Co.
  • Centrica plc
  • Thames Water Utilities Ltd
  • E.ON SE
  • Exelon Corporation
  • Southern Company
  • NextEra Energy, Inc.
  • Duke Energy Corporation

For more information about this report visit https://www.researchandmarkets.com/r/jbm4pj


Contacts

ResearchAndMarkets.com
Laura Wood, Senior Press Manager
This email address is being protected from spambots. You need JavaScript enabled to view it.

For E.S.T. Office Hours Call 1-917-300-0470
For U.S./CAN Toll Free Call 1-800-526-8630
For GMT Office Hours Call +353-1-416-8900

+ Major deliveries have been completed for NMG’s Phase-1 coating module; construction is advancing towards the planned commissioning target before the end of H1-2022 for the Company’s 2,000-tpa-capacity anode material value chain.


+ The integrated 43-101-compliant feasibility study prepared by BBA is progressing for the Phase-2 Bécancour Battery Material Plant and Matawinie Mine, for a comprehensive updated economics structure of NMG’s business model to be announced before the end of Q2-2022.

+ Preparatory works have resumed at the Phase-2 Matawinie Mine ahead of civil works targeted for the year.

+ Thanks to its Phase-1 production, NMG is currently actively engaged in qualification sampling with selected battery manufacturers, now providing A & B samples. Sustained interest from top-tier potential customers is supported by sample quality checks, site visits and requests for information.

+ NMG is advancing with the structuring and securing of project financing for the construction and development of the Phase-2 Bécancour Battery Material Plant and Matawinie Mine, and has received non-binding letters of interest from two Export Credit Agencies, evidencing a clear expression of the potential support which the ECA may offer.

+ NMG continues to demonstrate the ESG-credentials of its business model through an A2 Robust Sustainability Rating from Moody’s and release of its Climate Action Plan.

+ Year-end OSHA rate of 2.61 for the Company’s operations and 0 for its contractors, with no major environmental incident.

+ Year-end cash position of $62.3M.

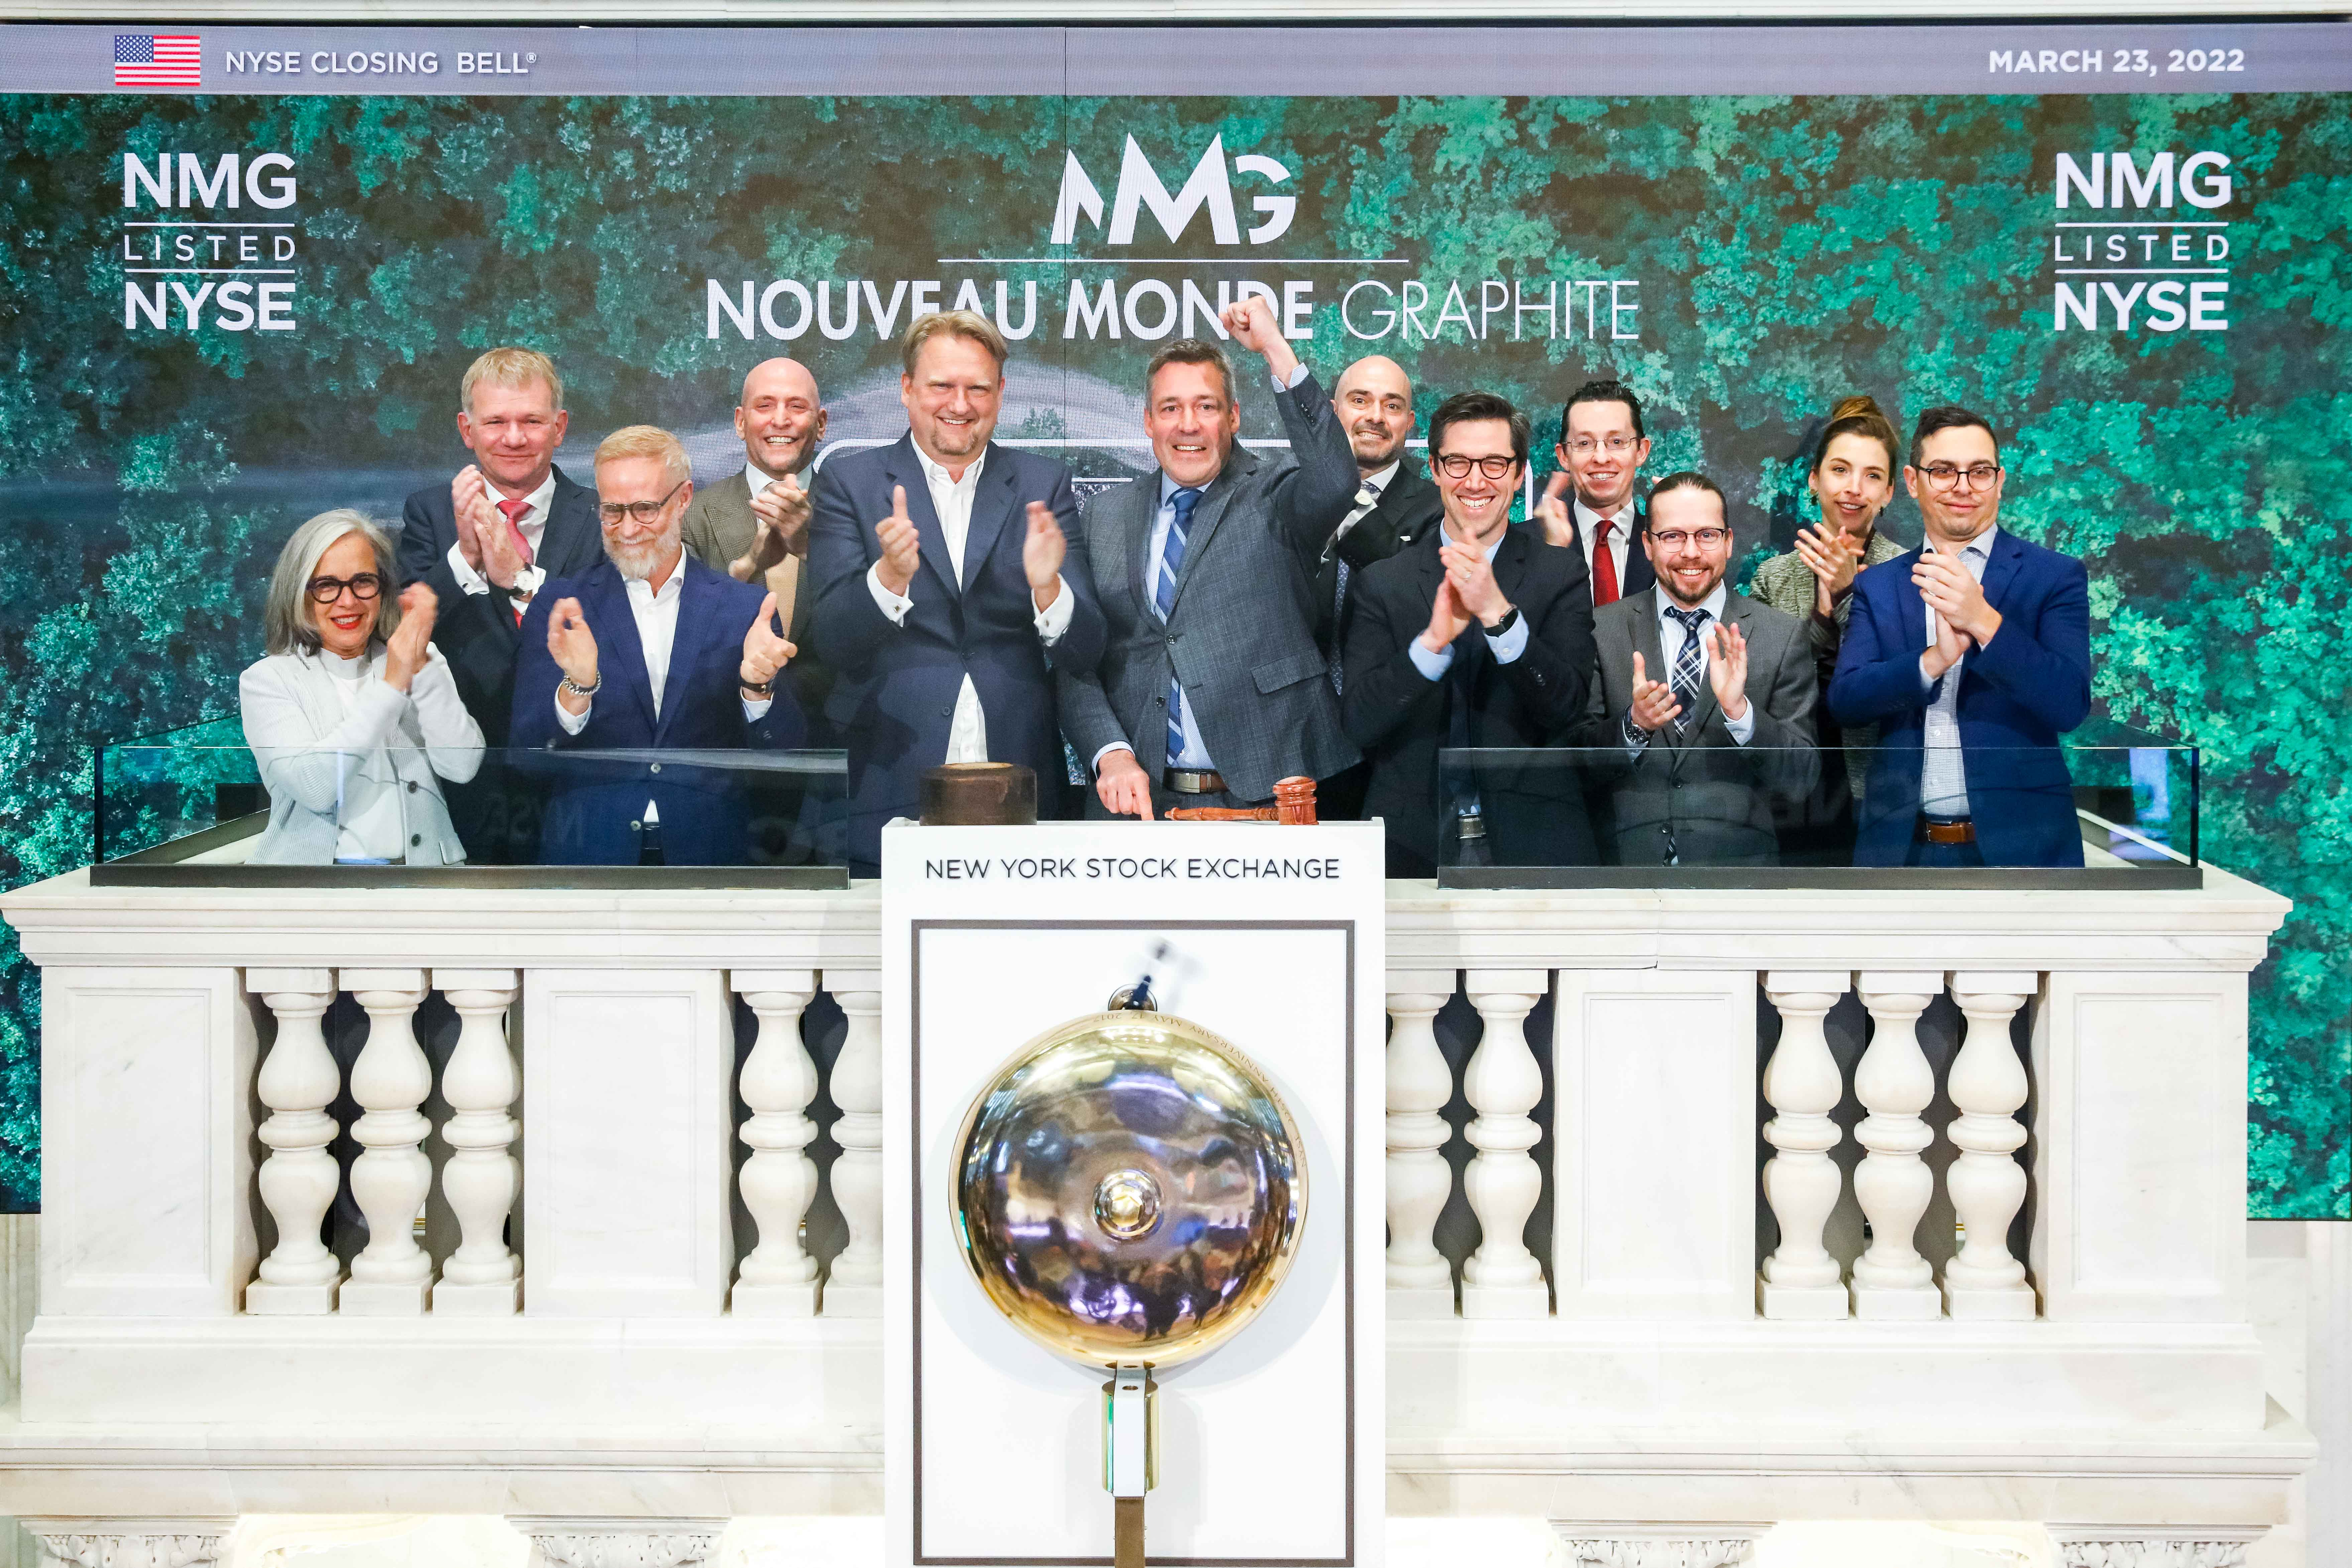
MONTRÉAL--(BUSINESS WIRE)--$NMG #EV--Nouveau Monde Graphite Inc. (“NMG”, “Nouveau Monde” or the “Company”) (NYSE: NMG, TSXV: NOU) publishes its year-end financial results for the twelve-month period ended December 31, 2021 as it advances towards the final stages of its Phase-1 facilities construction demonstrating the full vertical from mining to battery market while maintaining an active development program on its Phase-2 commercial scale up. With the construction of NMG’s coating module well underway, the Company is set to have a 2,000-tonnes-per-annum (“tpa”) capacity integrated graphite production line of anode material by mid-year. At the same time, NMG is defining the updated economics model for its Phase 2 and is engaging with potential customers and financial partners to support the delivery of its full commercial-scale facilities.

Arne H Frandsen, Chair of NMG, commented: “We are making significant progress on our objectives at a time when the market is feeling the pressure of limited supply options, rising prices and complicated logistics. I am confident that the ESG-minded team at NMG can capitalize on our exclusive ecotechnologies and industry-leading practices to position the Company as a Western World’s trailblazer for competitive, sustainable, and local graphite advanced materials production.”

Eric Desaulniers, Founder, President, and CEO of NMG, added: “Upon the completion of our coating module as the final stage of our integrated Phase-1 production, we are set to offer a turnkey solution for the extraction, concentration, value-added transformation and quality assurance of graphite materials manufacturing. Our Phase-1 facilities accelerate our transition to the next phase of our development by providing electric vehicle (“EV”) and battery manufacturers with customized, high-quality, carbon-neutral and low-cost advanced materials, supporting process optimization and value engineering for our Phase 2, as well as providing a unique training platform for our team.”

Battery Material Plant

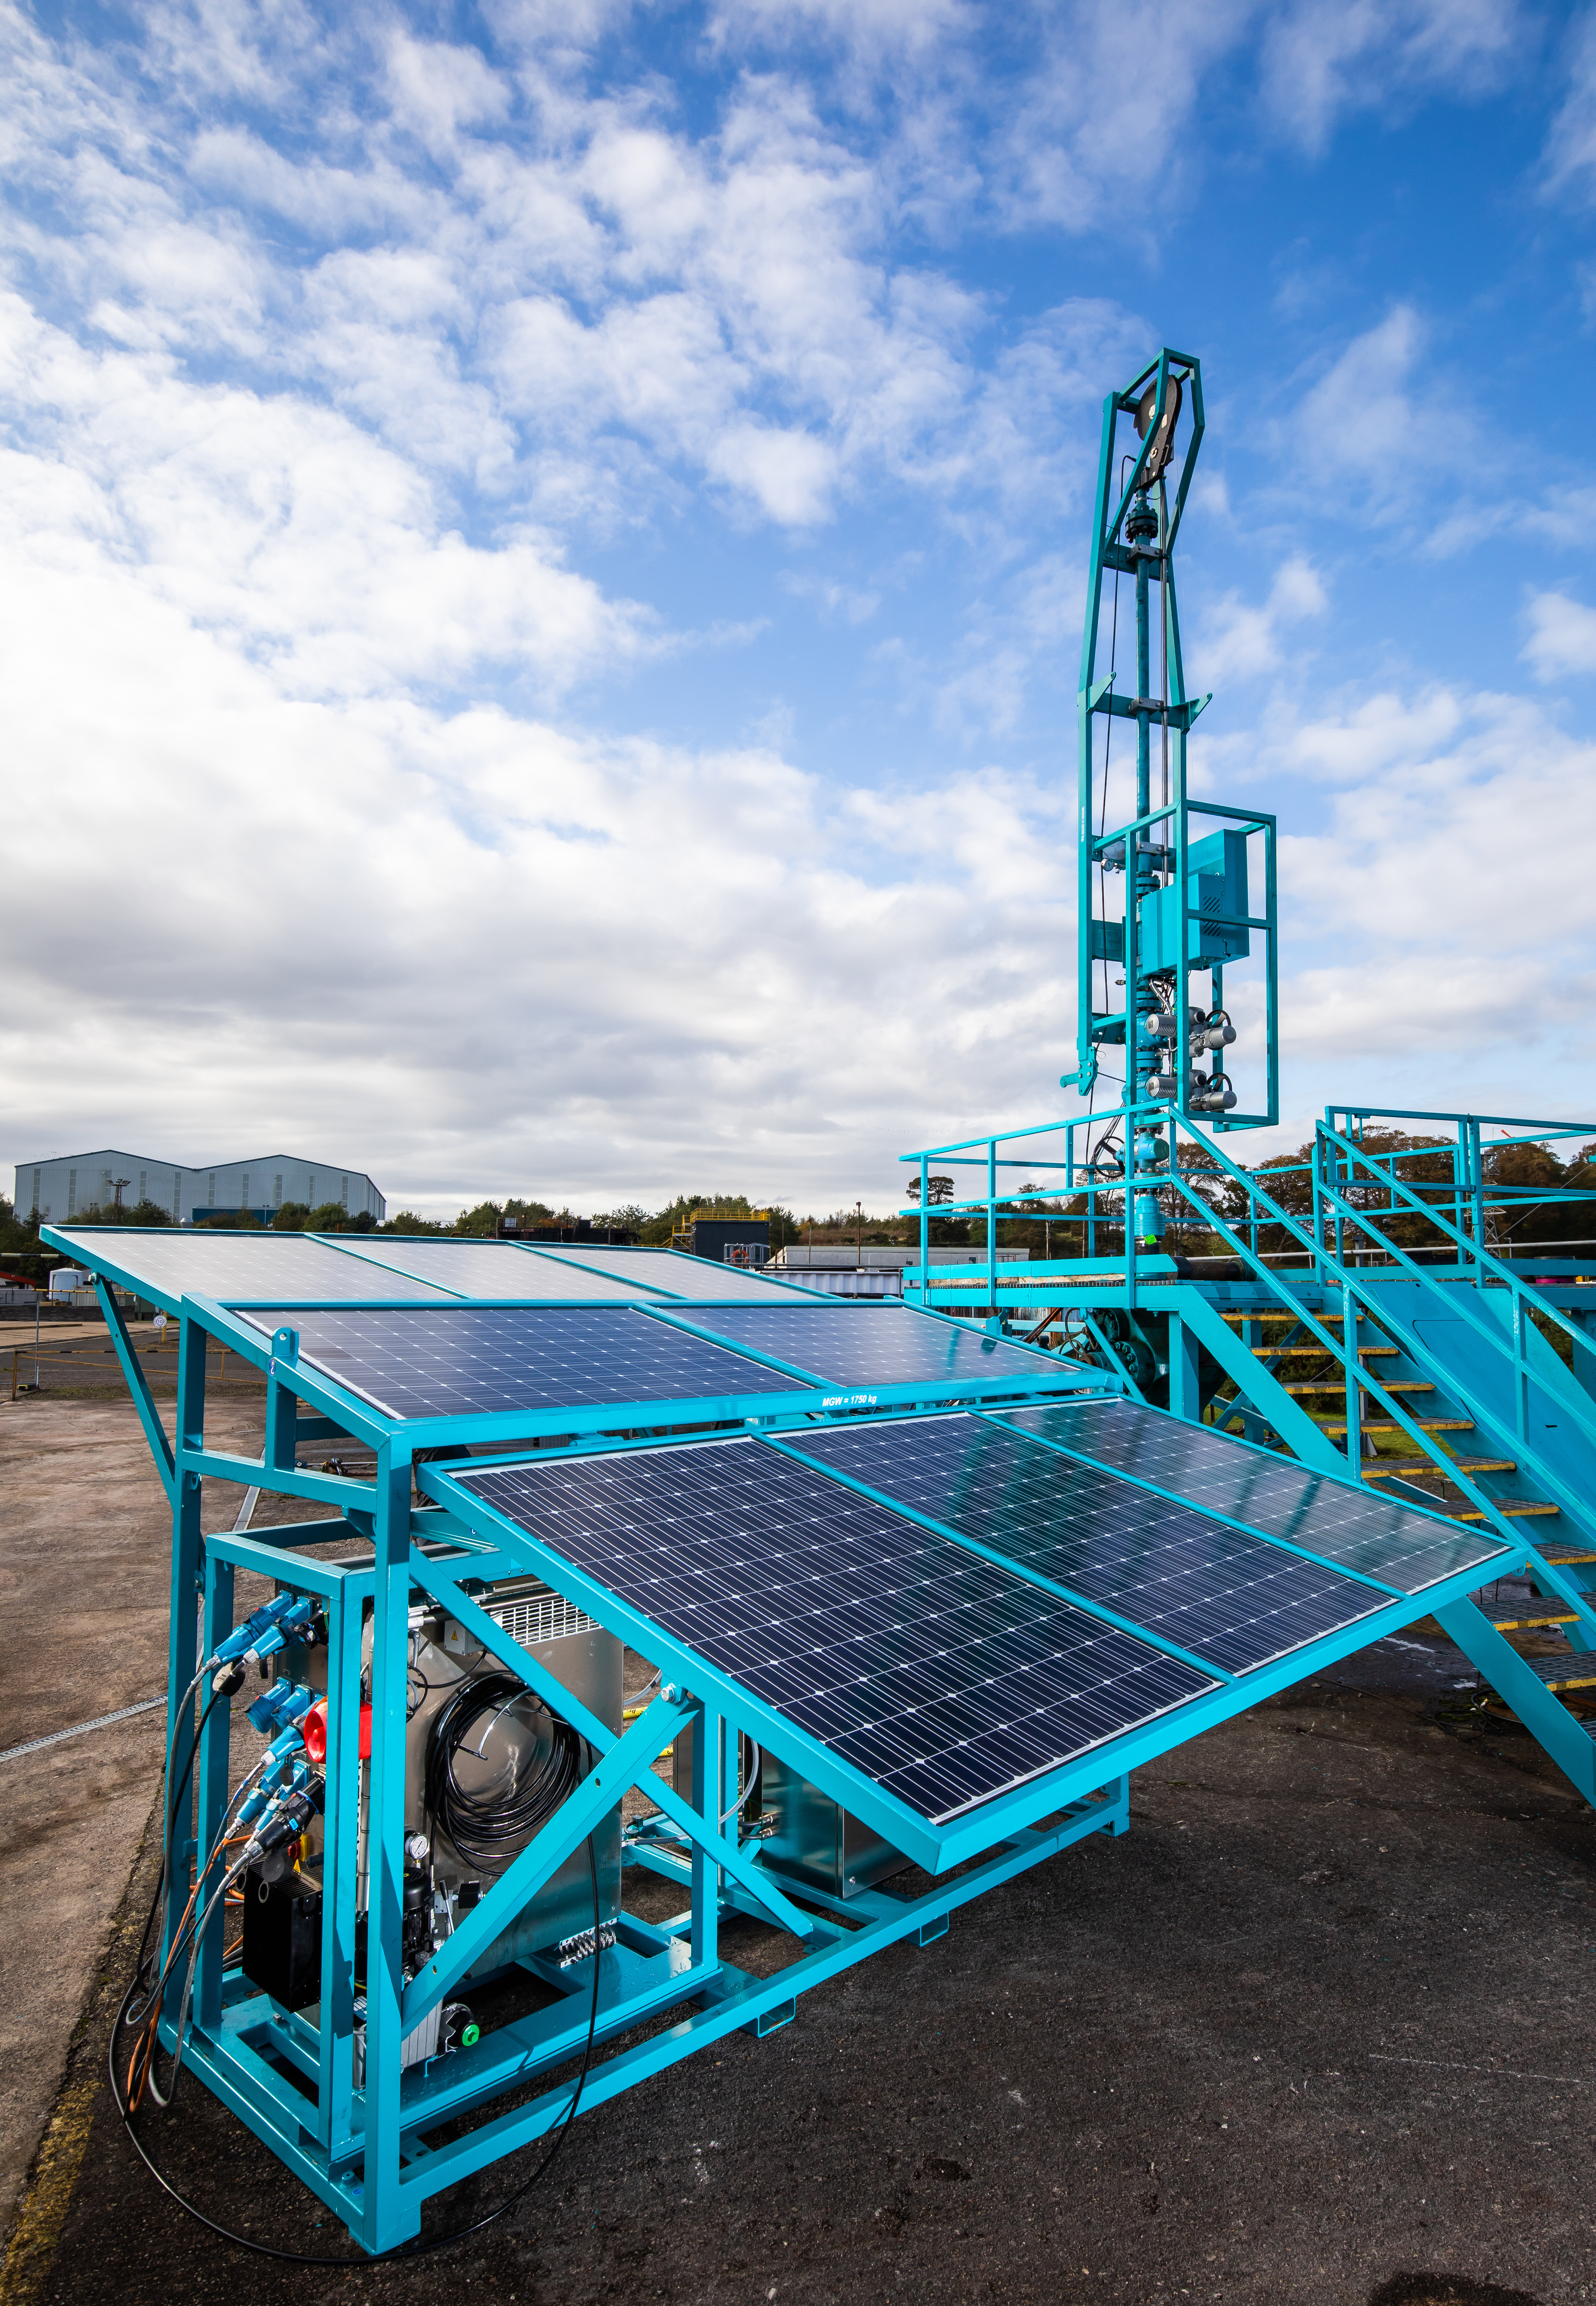
NMG is advancing with the deployment of its coated spherical purified graphite production with the construction of its Phase-1 coating line. This last process step will complete the Company’s graphite-based product range for the EV and renewable energy sectors by having a production capacity of up to 2,000 tpa of anode material. Although some have been delayed due to the worldwide logistics disturbances, deliveries have arrived at the Company’s demonstration plant over Q4-2021 and Q1-2022. All major deliveries have now been received. Construction is underway, and on budget, for a targeted commissioning before the end of H1-2022.

Construction of the coating module at NMG’s facility.

NMG is also expecting the delivery of its second commercial-scale shaping module at its facilities in Q2-2022 which would allow it to triple its spherical graphite production capacity. The construction and equipment commissioning is scheduled to be carried out by the end of H1-2022 for a production start and ramp up during Q3-2022. This addition to NMG’s Phase-1 advanced manufacturing line will enable the Company to provide customers with a broader and more comprehensive range of specs.

NMG’s Phase-1 purification plant continues the production of battery-grade SPG volumes. Positive results obtained by testing the furnaces’ optimal capacity and the validation of operational parameters have enabled NMG to refine the engineering of the Phase-2 Bécancour Battery Material Plant.

Indeed, the Front-End Loading feasibility engineering analysis (“FEL-3”) for the Company’s Phase-2 operations is progressing and on budget, with a 48% completion rate and a scheduled completion by the end of Q2-2022. NMG’s integrated business model will be reflected in this National Instrument 43-101 Standards of Disclosure for Mineral Projects (“NI 43-101”)-compliant feasibility study for the Phase-2 Bécancour Battery Material Plant to update planning, cost projection, and development framework in a unified structure with the Matawinie Mine. In complement to the engineering efforts, the Company has initiated the permitting planning process and community outreach for the Bécancour Battery Materials Plant.

Matawinie Mine

In December 2021, NMG completed the construction of the nearly 8-km access road connecting the mining site to the local highway. Early works were successfully and safely completed, with no recordable environmental, health or safety incidents. Tree clearing activities are currently being conducted – before the nesting season to limit impacts to avifauna – in order to prepare the site for the next phase of civil works.

The detailed engineering and procurement packages of the Matawinie mine and concentrator continue to progress with SNC-Lavalin, Metso Outotec and NMG’s owner’s team. Optimization of facilities, preparation of architectural specifications and plans, mechanical engineering, and equipment selection advance on schedule. The mining plan is also progressing based on the latest drilling campaign. Overall advancement of engineering is estimated at 55%.

NMG has put forward advanced standards for design criteria of tailings management at the Matawinie Mine by prioritizing the desulphurization of tailings, dry-stacking, and the co-disposal of waste rock and tailings. This environmentally sound method involved a recognized approach and has been approved by government officials following a thorough review. An experimental cell was built in 2020 to demonstrate in actual conditions the performance of this proactive environmental method. Field-scale cells were built to calibrate the parameters with respect to the performance of the tailings co-disposal objectives design, including preventing sulfide oxidation and mine water contamination. The field test cells are instrumented and monitored by the Company’s Environment Team. Results from the test cells are positive, validating the co-disposal technology developed by NMG.

As for its electrification strategy, the Company’s technical team is highly engaged with Caterpillar for the planning and development of a zero-emission fleet for the Matawinie Mine. At the beginning of Q1-2022, NMG was awarded Mining Magazine's Future Fleets excellence award for the intended electrification of its Matawinie Mine.

Products Development and Market

The Company’s Phase-1 operations continue to support technical marketing and product qualification efforts in the lithium-ion battery, traditional and niche sectors. Production at the Phase-1 facilities and testing at NMG’s new state-of-the-art laboratory enable the supply of graphite products in various specifications to meet the manufacturer's individual requirements.

Samples have been and continue to be provided to potential customers as part of sales discussions. NMG has advanced into the qualification process with several battery manufacturers, now providing A & B samples. Sustained interest from top-tier potential customers is supported by quality checks, site visits to the Company’s Phase-1 operations and requests for information.

In addition, the Company is actively strengthening its quality assurance and quality control with the implementation of an ISO 9001-compliant system.

Electric vehicles outsold diesel cars in Europe for the first time in December 2021. To meet the soaring demand from consumers, the auto industry is on track to invest half a trillion dollars in the next five years to transition its fleet towards electrification (New York Times, February 2022). This shift is driving major changes in existing supply chains as original equipment manufacturers compete to source the raw materials and electronic components and bring to market enough volume to meet consumers' enthusiasm.

In fact, the lithium-ion battery market expansion is driving growth in demand for natural graphite with a global anode capacity projection of 8,391,550 tonnes per annum by 2031, a 13.2% month-over-month increase for the beginning Q1-2022 (Benchmark Mineral Intelligence, February 2022). Moreover, constrained supply due to mine and factory closures in China have lead to an upward price pressure for flake graphite (Benchmark Mineral Intelligence, January 2022).

These market dynamics create a favorable setting for NMG’s development of a local turnkey supply of green anode material.

Corporate and ESG

NMG conducted its operations guided by its Zero-Harm Philosophy. The Company reports a year-end Occupational Safety and Health Administration (“OSHA”) Recordable Incident Rate of 2.61 for its facilities and 0 for its contractors. NMG had no major environmental incidents as defined by the Global Reporting Initiative. Through its work protocols, continuous monitoring, and environmental program, it responsibly conducted its operations and worked to diligently address and mitigate any minor incident at its sites.

The Company embedded leading ESG principles in its business model alongside carbon-neutral operations and traceability of its value chain. In an independent assessment of the Company’s sustainability performance, Moody’s ESG Solutions provided a Sustainability Rating of A2 (‘Robust’), the second-highest grade on its rating scale, to NMG.

As part of its carbon-neutrality commitment, NMG released its Climate Action Plan detailing efforts around transparent reporting, reduction of the Company’s embedded emissions, transition to Net Zero, research and development for low-carbon materials and activities, as well as industry leadership. The Company has also purchased verified carbon credits to offset its 2021 carbon balance.

NMG is currently completing a lifecycle analysis for its graphite products portfolio to support its marketing and sustainability efforts.

The Company is advancing with the structuring and securing of project financing for the construction and development of the Phase-2 Bécancour Battery Material Plant and the Matawinie Mine. In this regard, the Company has been in discussions with a number of Export Credit Agencies (“ECA”) to provide credit support for a significant portion of the project financing, and has received non-binding letters of interest from two ECA, evidencing a clear expression of the potential support which the ECA may offer.

In 2021, the Company raised over $130M through public offerings, the exercise of warrants, private placements, and financial levers from governments. Capital allocation emphasized the advancement of NMG’s projects through engineering, procurement of key equipment and construction; R&D for the development of new processes and products, and corporate expenses to support the Company’s growth.

At December 31, 2021, the Company had $63.2M.

About Nouveau Monde

Nouveau Monde is striving to become a key contributor to the sustainable energy revolution. The Company is working towards developing a fully integrated source of carbon-neutral battery anode material in Québec, Canada for the growing lithium-ion and fuel cell markets. With low-cost operations and enviable ESG standards, Nouveau Monde aspires to become a strategic supplier to the world’s leading battery and automobile manufacturers, providing high-performing and reliable advanced materials while promoting sustainability and supply chain traceability. www.NMG.com

Subscribe to our news feed: https://NMG.com/investors/#news

Cautionary Note Regarding Forward-Looking Information

All statements, other than statements of historical fact, contained in this press release including, but not limited to those describing the intended results of the Company’s development plans, the timeline and progress of the initiatives described in this press release, future graphite supply and demand, the benefits of the Company’s de-risking strategy, the impact of the foregoing on the project economics, the Company’s intended production capacity of carbon-neutral anode material, the growth of the lithium-ion battery and EV markets, the Company’s commitments and performance with respect to its ESG initiatives, including the intended electrification of the Matawinie Mine, the interest of potential customers, the ability to structure and obtain sufficient project financing for the construction and development of the Bécancour Battery Material Plant and the Matawinie Mine, potential credit support from ECA, the intended results of the initiatives described above, and those statements which are discussed under the “About Nouveau Monde” paragraph and elsewhere in the press release which essentially describe the Company’s outlook and objectives, constitute “forward-looking information” or “forward-looking statements” within the meaning of Canadian and United States securities securities laws, and are based on expectations, estimates and projections as of the time of this press release. Forward-looking statements are necessarily based upon a number of estimates and assumptions that, while considered reasonable by the Company as of the time of such statements, are inherently subject to significant business, economic and competitive uncertainties and contingencies. These estimates and assumptions may prove to be incorrect. Moreover, these forward-looking statements were based upon various underlying factors and assumptions, including the current technological trends, the business relationship between the Company and its stakeholders, the ability to operate in a safe and effective manner, the timely delivery and installation of the equipment supporting the production, the Company’s business prospects and opportunities and estimates of the operational performance of the equipment, and are not guarantees of future performance.

Forward-looking information and statements are subject to known or unknown risks and uncertainties that may cause actual results to differ materially from those anticipated or implied in the forward-looking information and statements. Risk factors that could cause actual results or events to differ materially from current expectations include, among others, delays in the scheduled delivery times of the equipment, the ability of the Company to successfully implement its strategic initiatives and whether such strategic initiatives will yield the expected benefits, the availability of financing or financing on favorable terms for the Company, the dependence on commodity prices, the impact of inflation on costs, the risks of obtaining the necessary permits, the operating performance of the Company’s assets and businesses, competitive factors in the graphite mining and production industry, changes in laws and regulations affecting the Company’s businesses, political and social acceptability risk, environmental regulation risk, currency and exchange rate risk, technological developments, the impacts of the global COVID-19 pandemic and the governments’ responses thereto, and general economic conditions, as well as earnings, capital expenditure, cash flow and capital structure risks and general business risks. Unpredictable or unknown factors not discussed in this Cautionary Note could also have material adverse effects on forward-looking statements.

Many of these uncertainties and contingencies can directly or indirectly affect, and could cause, actual results to differ materially from those expressed or implied in any forward-looking statements. There can be no assurance that forward-looking statements will prove to be accurate, as actual results and future events could differ materially from those anticipated in such statements. Forward-looking statements are provided for the purpose of providing information about management’s expectations and plans relating to the future. The Company disclaims any intention or obligation to update or revise any forward-looking statements or to explain any material difference between subsequent actual events and such forward-looking statements, except to the extent required by applicable law.

The market and industry data contained in this press release is based upon information from independent industry publications, market research, analyst reports and surveys and other publicly available sources. Although the Corporation believes these sources to be generally reliable, market and industry data is subject to interpretation and cannot be verified with complete certainty due to limits on the availability and reliability of raw data, the voluntary nature of the data-gathering process and other limitations and uncertainties inherent in any survey. The Corporation has not independently verified any of the data from third-party sources referred to in this press release and accordingly, the accuracy and completeness of such data is not guaranteed.

Neither the TSX Venture Exchange nor its Regulation Services Provider (as that term is defined in the policies of the TSX Venture Exchange) accepts responsibility for the adequacy or accuracy of this release.

Further information regarding the Company is available in the SEDAR database (www.sedar.com), and for United States readers on EDGAR (www.sec.gov), and on the Company’s website at: www.NMG.com


Contacts

Julie Paquet
VP Communications & ESG Strategy
+1-450-757-8905 #140
This email address is being protected from spambots. You need JavaScript enabled to view it.

DUBLIN--(BUSINESS WIRE)--The "Global Wireless Charging Market for Electric Vehicles by Power Supply Range (3-<11, 11-50 & >50 KW), Application (Home & Commercial), Distribution Channel (Aftermarket & OE), Component, Charging System, Propulsion, Vehicle Type & Region - Forecast to 2027" report has been added to ResearchAndMarkets.com's offering.


The global wireless charging market for electric vehicles is projected to grow from USD 15 million in 2022 to USD 377 million by 2027, at a CAGR of 88.4%.

Factors such as the rising penetration of electric vehicles around the world, along with the increasing focus of automotive OEMs towards autonomous vehicles will boost the demand for the wireless charging market for electric vehicles.

However, the high cost of upgrading to wireless charging technology may restrain the growth of the market. Increasing investments for dynamic wireless charging technology, paired with increasing support from several governments for wireless charging is likely to create lucrative opportunities for the wireless charging market for electric vehicles.

>50 KW segment is expected to grow at a significant rate during the forecast period, by power supply range

The >50 kW segment of the wireless charging for electric vehicle market is projected to grow at a noticeable rate during the forecast period. The increasing adoption of electric buses and rising investment in the dynamic wireless charging system for electric vehicles by several countries such as the US, Italy, Germany, and Sweden, are also expected to augment revenues for the >50 kW power supply segment in the wireless charging market for electric vehicles during the forecast period.

Asia Pacific is expected to be the fastest-growing market during the forecast period

The Asia Pacific region comprises emerging economies such as China and India, along with developed nations such as Japan and South Korea. In recent years, the region has emerged as a hub for automobile production. The increased

purchasing power of the population and growing concerns about the environment have triggered the demand for electric vehicles in the Asia Pacific region.

The concept of reducing carbon emission by electrifying transportation has caught the attention of local and national governments. Hence, the use of electric vehicles has become popular in the region. Governments are focusing on providing extensive charging infrastructure to promote the use of electric vehicles.

Governments in the Asia Pacific region are also focusing on standardizing wireless charging technology and providing subsidies to promote EV sales. In 2020, China set a national standard GB/T 38775 for wireless charging of electric vehicles based on WiTricity technology.

The Standardization Administration of the People's Republic of China (SAC) ratified and published the first four national standards for wireless charging of electric vehicles. GB/T 38775.1, GB/T 38775.2, GB/T 38775.3, and GB/T 38775.4 are the national standards that provide a framework for Tier 1 suppliers, carmakers, and infrastructure suppliers to develop as well as commercialize wireless charging systems for electric vehicles that meet guidelines of performance and safety.

This effort of standardizing the wireless charging technology would augment the revenue growth of the wireless charging market in China in the coming years. In 2020, the Indian government announced National Electric Mobility Mission Plan (NEMMP) 2020 to place India's EV mission on a faster track.

Europe to estimated be the largest region in the wireless charging market for electric vehicles during the forecast period

Europe is estimated to account for 66% of the global wireless charging market for electric vehicles in 2022 by volume. Electric vehicles are expected to become the rational choice for car buyers in Europe as their prices continue to fall with the availability of economical batteries and increasing range.

The charging infrastructure in Europe is expected to become more widespread due to favourable policies and government support. The sales of electric vehicles in the European region increased by approximately 78% in 2019, compared to 2018. In 2020, Germany accounted for approximately 33% share of electric vehicle sales in Europe.

The demand for electric vehicles has increased significantly due to the focus on zero or low-emission vehicles in the region. For instance, the UK announced plans to phase out petrol/diesel-based vehicles by 2030 and encourage the growth of EVs. According to a report by the European Environmental Agency in November 2021, in Europe, 11.41% of all new vehicle registrations have been EVs.

In 2020, EV registrations increased drastically in top European markets. Norway had 75%, Iceland had 46%, Sweden had 33%, and the Netherlands had 28% of new EV registrations. Ongoing projects related to dynamic wireless charging systems in Germany, Italy, and Sweden, among others, are expected to support the market growth in this region.

The wireless charging market for electric vehicles is dominated by major charging providers, including Witricity Corporation (US), Momentum Dynamic Corporation (US), Plugless Power Inc. (US), Efacec (Portugal), and HEVO Inc. (US).

They develop products/systems for the electric vehicle ecosystem. They have initiated partnerships to develop their wireless EV charging technology and provide finished products to their respective customers.

Key Topics Covered:

Premium Insights

  • Increasing Demand for EVs to Boost Growth of Wireless Charging Market for Electric Vehicles
  • Passenger Car Segment Estimated to Lead Wireless Charging Market for Electric Vehicles During Forecast Period
  • Bev Segment Estimated to Lead Wireless Charging Market for Electric Vehicles During Forecast Period
  • 3-<11 Kw Segment Estimated to Lead Wireless Charging Market for Electric Vehicles During Forecast Period
  • Inductive Power Transfer Segment Estimated to Lead Wireless Charging Market for Electric Vehicles from 2022 to 2027
  • Power Control Unit Segment Estimated to Lead Wireless Charging Market for Electric Vehicles from 2022 to 2027
  • OE Segment Estimated to Lead Wireless Charging Market for Electric Vehicles from 2022 to 2027
  • Europe Estimated to be Largest Market for Wireless Charging for Electric Vehicles in 2022

Market Dynamics

Drivers

  • Rising EV Sales Worldwide and Increasing Focus of Automotive OEMs Towards EVs
  • Rapid Development of Fast-Charging Infrastructure for Electric Vehicles
  • Advantages of Wireless Charging Over Wired Charging
  • Strong Governmental Support Towards Emission-Free and Safe Electric Vehicles

Restraints

  • High Cost of Upgrading to Wireless Charging Technology
  • Lower Charging Efficiency Compared to Wired Charging

Opportunities

  • Increasing Support from Governments for Wireless Charging
  • Increasing Investments for Dynamic Wireless Charging Technology

Challenges

  • Minimizing Loss of Efficiency
  • High Investment in Infrastructure for Dynamic Charging

Trends and Disruptions

  • Key Conferences & Events in 2022 & 2023
  • Wireless Charging Market for Electric Vehicles Ecosystem
  • Wireless EV Charging System Providers

OEMs

  • Charging Service Providers
  • End-Users
  • Value Chain Analysis

Pricing Analysis

Patent Analysis

Regulatory Overview

Wireless Charging Market for Electric Vehicles Scenarios (2022-2027)

Industry Trends

Case Study

  • Delta Electronics Deploying Wireless Charging Technology
  • Daihen Incorporating Wireless Charging Technology
  • Mass Transit Case Study: Momentum Dynamics Corporation
  • Hevo Wireless Charging to the Next Level

Technological Analysis

  • Wireless Charging System Technology
  • Inductive Coupling
  • Magnetic Wireless Charging
  • Magnetic Resonance Coupling
  • Magneto Dynamic Coupling (Mdc)
  • Capacitive Wireless Power Transfer (Cwpt)

Company Profiles

  • Alfen
  • Allego
  • Blink Charging
  • Bmw
  • Bp Chargemaster
  • Chargepoint
  • Clippercreek
  • Continental Ag
  • Ecog
  • Efacec
  • Electreon
  • Elix Wireless Inc.
  • Ev Safe Charge
  • Evgo
  • Fortum Corporation
  • Heliox
  • Hella KGaA Hueck & Co.
  • Hevo Inc.
  • Hyundai
  • Intis
  • Ionity
  • Ipt Technology GmbH
  • Lear Corporation
  • Leviton
  • Mitsubishi Electric
  • Mojo Mobility
  • Momentum Dynamics Corporation
  • New Motion
  • Opconnect
  • Plugless Power Inc.
  • Pod Point
  • Robert Bosch GmbH
  • Semaconnect
  • Spark Horizon
  • Tgood Global Ltd.
  • Toshiba Corporation
  • Toyota Motor Corporation
  • Volta
  • Wallbox Chargers, S.L.
  • Wave
  • Webasto
  • Witricity Corporation
  • Zte Corporation

For more information about this report visit https://www.researchandmarkets.com/r/v1799d


Contacts

ResearchAndMarkets.com
Laura Wood, Senior Press Manager
This email address is being protected from spambots. You need JavaScript enabled to view it.

For E.S.T Office Hours Call 1-917-300-0470
For U.S./CAN Toll Free Call 1-800-526-8630
For GMT Office Hours Call +353-1-416-8900

HOUSTON--(BUSINESS WIRE)--DXP Enterprises, Inc. (NASDAQ: DXPE) on Friday, March 25, 2022, announced its Audit Committee selected PricewaterhouseCoopers LLP as its independent registered public accounting firm for the 2022 fiscal year.


On March 23, 2022, the Audit Committee informed McConnell & Jones LLP (“McConnell Jones”) of this decision. McConnell Jones will continue in its capacity through the completion of is audit services for the fiscal year ending December 31, 2021, and the filing of DXP’s 2021 Form 10-K.

Kent Yee, CFO, added, “First, I want to thank McConnell & Jones for working with us to get our third quarter and fiscal 2021 done in a timely manner given the unusual circumstances. The team from McConnell Jones handled everything with the utmost professionalism, diligence, and candor. Their breadth of experience and team depth has been evident. It was extremely refreshing. As discussed back in November, DXP’s auditor transition plan has been about the future of DXP and to align with our vision and goals for the finance and accounting function. Since 2017, we have been focused on ensuring we were building a finance and accounting team, capabilities and function that would support and propel DXP into becoming a multi-billion-dollar company. This plan is centered around continuous improvement in people, accounting processes and technology to support the variety of businesses that are integral to DXP. We look forward to our growth and improvement.”

Gene Padgett, CAO added, “We have talked about aligning service providers and tools befitting DXP from day one. We are at one of those inflection points and we are excited to push forward and continue to raise the bar. We have work to do around accounting processes and technological tools, but we are well on our way and remain excited about the future.”

About DXP Enterprises, Inc.

DXP Enterprises, Inc. is a leading products and service distributor that adds value and total cost savings solutions to industrial customers throughout the United States, Canada and Dubai. DXP provides innovative pumping solutions, supply chain services and maintenance, repair, operating and production ("MROP") services that emphasize and utilize DXP’s vast product knowledge and technical expertise in rotating equipment, bearings, power transmission, metal working, industrial supplies and safety products and services. DXP's breadth of MROP products and service solutions allows DXP to be flexible and customer-driven, creating competitive advantages for our customers. DXP’s business segments include Service Centers, Innovative Pumping Solutions and Supply Chain Services. For more information, go to www.dxpe.com.

The Private Securities Litigation Reform Act of 1995 provides a “safe-harbor” for forward-looking statements. Certain information included in this press release (as well as information included in oral statements or other written statements made by or to be made by the Company) contains statements that are forward-looking. These forward-looking statements include without limitation those about the Company’s expectations regarding the impact of the COVID-19 pandemic and the impact of low commodity prices of oil and gas; the Company's expectations regarding the filing of the Form 10-Q; the description of the anticipated changes in the Company's consolidated balance sheet and the results of operations and the Company's assessment of the impact of such anticipated changes; the Company’s business, the Company’s future profitability, cash flow, liquidity, and growth. Such forward-looking information involves important risks and uncertainties that could significantly affect anticipated results in the future; and accordingly, such results may differ from those expressed in any forward-looking statement made by or on behalf of the Company. These risks and uncertainties include, but are not limited to; decreases in oil and natural gas prices; decreases in oil and natural gas industry expenditure levels, which may result from decreased oil and natural gas prices or other factors; inability of the Company or its independent auditors to complete the work necessary in order to file the Form 10-Q, in the expected time frame; unanticipated changes to the Company's operating results in the Form 10-Q as filed or in relation to prior periods, including as compared to the anticipated changes stated here; unanticipated impact of such changes and its materiality; ability to obtain needed capital, dependence on existing management, leverage and debt service, domestic or global economic conditions, economic risks related to the impact of COVID-19, ability to manage changes and the continued health or availability of management personnel and changes in customer preferences and attitudes. In some cases, you can identify forward-looking statements by terminology such as, but not limited to, “may,” “will,” “should,” “intend,” “expect,” “plan,” “anticipate,” “believe,” “estimate,” “predict,” “potential,” “goal,” or “continue” or the negative of such terms or other comparable terminology. For more information, review the Company’s filings with the Securities and Exchange Commission. More information on these risks and other potential factors that could affect the Company’s business and financial results is included in the Company’s filings with the SEC, including in the “Risk Factors” and “Management’s Discussion and Analysis of Financial Condition and Results of Operations” sections of the Company’s most recently filed periodic reports on Form 10-K and Form 10-Q and subsequent filings. The Company assumes no obligation to update any forward-looking statements or information, which speak as of their respective dates.


Contacts

Kent Yee
Senior Vice President, CFO
713-996-4700
www.dxpe.com

HOUSTON--(BUSINESS WIRE)--ConocoPhillips (NYSE: COP) will host a conference call webcast on Thursday, May 5, 2022, at 12:00 p.m. Eastern time to discuss first-quarter 2022 financial and operating results. The company’s financial and operating results will be released before the market opens on May 5.


To access the webcast, visit ConocoPhillips’ Investor Relations site, www.conocophillips.com/investor, and click on the "Register" link in the Investor Presentations section. You should register at least 15 minutes prior to the start of the webcast. The event will be archived and available for replay later the same day, with a transcript available the following day.

--- # # # ---

About ConocoPhillips

ConocoPhillips is one of the world’s leading exploration and production companies based on both production and reserves, with a globally diversified asset portfolio. Headquartered in Houston, Texas, ConocoPhillips had operations and activities in 14 countries, $91 billion of total assets and approximately 9,900 employees at Dec. 31, 2021. Production including Libya averaged 1,567 thousand barrels of oil equivalent per day for the 12 months ended Dec. 31, 2021, and proved reserves were 6.1 billion barrels of oil equivalent as of Dec. 31, 2021. For more information, go to www.conocophillips.com.


Contacts

Dennis Nuss (media)
281-293-1149
This email address is being protected from spambots. You need JavaScript enabled to view it.

Investor Relations
281-293-5000
This email address is being protected from spambots. You need JavaScript enabled to view it.

NEW YORK & STAMFORD, Conn.--(BUSINESS WIRE)--CBRE Investment Management (“CBRE IM”), a leading real assets investment management firm, and Altus Power, Inc. (NYSE: AMPS) (“Altus Power”), a leading clean electrification company, today announced plans to build and operate a portfolio of rooftop community solar projects to provide renewable energy to residential customers and CBRE IM logistics tenants in Maryland. These projects are expected to produce savings for approximately 5,700 residential customers in Maryland.


CBRE IM and Altus Power each have a long-standing presence in Maryland and together are proud to bring the benefits of community solar to a broader segment of residential customers within the state. Rooftop-based solar systems of up to approximately 20MW will be located on the logistics facilities that are owned by CBRE IM’s funds. Power generated from these solar systems is to be provided to both commercial tenants and residential customers. Thirty percent or more of the generated electricity is also to be allocated to low and moderate income residential customers in the state. Energy storage and electric vehicle charging may be added to these facilities in the future.

“Our collaboration with Altus Power will greatly advance our sustainability goals and support the transition to clean energy,” said Chuck Leitner, chief executive officer of CBRE IM. “This initiative is an excellent example of how we use scale to make our portfolio more resilient, profitable and sustainable.”

“Altus Power has been serving public and private customers in Maryland with solar-generated electricity since 2011,” said Lars Norell, Co-CEO of Altus Power. “We are excited to expand our community solar portfolio in the state and to advance our relationship with our strategic partner, CBRE.”

About CBRE Investment Management

CBRE Investment Management is a leading global real assets investment management firm with $141.9 billion in assets under management* as of December 31, 2021, operating in more than 30 offices and 20 countries around the world. Through its investor-operator culture, the firm seeks to deliver sustainable investment solutions across real assets categories, geographies, risk profiles and execution formats so that its clients, people and communities thrive.

CBRE Investment Management is an independently operated affiliate of CBRE Group, Inc. (NYSE:CBRE), the world’s largest commercial real estate services and investment firm (based on 2021 revenue). CBRE has more than 105,000 employees (excluding Turner & Townsend employees) serving clients in more than 100 countries. CBRE Investment Management harnesses CBRE’s data and market insights, investment sourcing and other resources for the benefit of its clients. For more information, please visit www.cbreim.com.

*Assets under management (AUM) refers to the fair market value of real assets-related investments with respect to which CBRE Investment Management provides, on a global basis, oversight, investment management services and other advice and which generally consist of investments in real assets; equity in funds and joint ventures; securities portfolios; operating companies and real assets-related loans. This AUM is intended principally to reflect the extent of CBRE Investment Management’s presence in the global real assets market, and its calculation of AUM may differ from the calculations of other asset managers and from its calculation of regulatory assets under management for purposes of certain regulatory filings.

About Altus Power

Altus Power, based in Stamford, Connecticut, is the nation’s premier clean electrification company. Altus Power serves its commercial, industrial, public sector and community solar customers by developing, owning and operating locally sited solar generation, energy storage, and EV charging infrastructure across 18 states from Vermont to Hawaii. Visit altuspower.com to learn more.

Forward-Looking Statements

This press release contains forward-looking statements. Forward-looking statements may be identified by the use of words such as “anticipate,” “believe,” “could,” “continue,” “expect,” “estimate,” “may,” “plan,” “outlook,” “future” and “project” and other similar expressions that predict or indicate future events or trends or that are not statements of historical matters. These statements, which involve risks and uncertainties, relate to analyses and other information that are based on forecasts of future results and estimates of amounts not yet determinable and may also relate to Altus Power’s future prospects, developments and business strategies. These statements are based on Altus Power’s management’s current expectations and beliefs, as well as a number of assumptions concerning future events.

Such forward-looking statements are subject to known and unknown risks, uncertainties, assumptions and other important factors, many of which are outside Altus Power’s control, that could cause actual results to differ materially from the results discussed in the forward-looking statements. These risks, uncertainties, assumptions and other important factors include, but are not limited to: (1) the ability of Altus Power to maintain its listing on the New York Stock Exchange; (2) the ability to recognize the anticipated benefits of the recently completed business combination and related transactions (the “Transactions”), which may be affected by, among other things, competition, the ability of Altus Power to grow and manage growth profitably, maintain relationships with customers, business partners, suppliers and agents and retain its management and key employees; (3) costs related to the Transactions; (4) changes in applicable laws or regulations; (5) the possibility that Altus Power may be adversely affected by other economic, business, regulatory and/or competitive factors; (6) the impact of COVID-19 on Altus Power’s business; and (7) the failure to realize anticipated pro forma results and underlying assumptions related to the Transactions.

Additional factors that could cause actual results to differ materially from those expressed or implied in forward-looking statements can be found under the heading “Risk Factors” in Altus Power’s Annual Report on Form 10-K filed with the Securities and Exchange Commission on March 24, 2022, as well as the other information we file with the Securities and Exchange Commission. New risks and uncertainties arise from time to time, and it is impossible for us to predict these events or how they may affect us. You are cautioned not to place undue reliance upon any forward-looking statements, which speak only as of the date made, and Altus Power undertakes no obligation to update or revise the forward-looking statements, whether as a result of new information, changes in expectations, future events or otherwise.

This press release is not intended to be all-inclusive or to contain all the information that a person may desire in considering an investment in Altus Power and is not intended to form the basis of an investment decision in Altus Power. All subsequent written and oral forward-looking statements concerning Altus Power or other matters and attributable to Altus Power or any person acting on its behalf are expressly qualified in their entirety by the cautionary statements above.


Contacts

CBRE Investment Management Contact
For Media:
Pam Barnett
This email address is being protected from spambots. You need JavaScript enabled to view it.

Altus Power Contacts
For Media:
Cory Ziskind
ICR, Inc.
This email address is being protected from spambots. You need JavaScript enabled to view it.

For Investors:
Chris Shelton, Head of IR
Caldwell Bailey, ICR, Inc.
This email address is being protected from spambots. You need JavaScript enabled to view it.

LAFAYETTE, La.--(BUSINESS WIRE)--Waitr Holdings Inc. (Nasdaq: WTRH) (“Waitr” or the “Company”), a leader in on-demand food ordering and delivery, has announced new initiatives to support its delivery drivers as gasoline prices continue to surge throughout the country.

Waitr has implemented a new GasCard program, giving drivers 5% off on gas from all major gas stations. Once the driver activates the GasCard within the driver app, they'll immediately receive the five-percent discount on gas purchases.

“Drivers are an important part of our business and the record-high gas prices are directly impacting them,” said Carl Grimstad, Chairman and CEO of Waitr. “We have implemented this GasCard program as a way to help combat this issue.”

In addition to the GasCard, Waitr is adjusting its driver pay as another way to help drivers.

Chris Barnes, director of driver experience, Delivery Logistics, says Waitr customers are also helping out in their own way. “We have heard from some drivers that they’ve seen an uptick in tips. Our loyal customers know fuel costs are affecting their pay, and many are responding. We serve great communities that really appreciate the drivers, and reciprocate appropriately.”

About Waitr

Founded in 2013 and based in Lafayette, Louisiana, Waitr operates an online ordering technology platform, providing delivery, carryout and dine-in options. Waitr, along with Bite Squad and Delivery Dudes, connect local restaurants and grocery stores to diners in underserved U.S. markets. Additionally, Waitr facilitates access to third parties that provide payment processing solutions for restaurants and other merchants. Together, they are a convenient way to discover, order and receive great food and other products from local restaurants, national chains and grocery stores. As of December 31, 2021, Waitr, Bite Squad and Delivery Dudes operate in approximately 1,000 cities throughout the United States.


Contacts

Investors
This email address is being protected from spambots. You need JavaScript enabled to view it.

Acquisition Expands European Assembly Capacity and Distribution Networks in EMEA and Adds a Strategic Customer Network in Europe

FREEHOLD, N.J.--(BUSINESS WIRE)--Cenntro Electric Group Limited (NASDAQ: CENN), a leading EV technology company with advanced, market-validated electric commercial vehicles, today announced that it completed the previously-announced acquisition of a 65% equity interest in Tropos Motors Europe GmbH (“TME”), a wholly owned subsidiary of Mosolf SE & Co. KG (“Mosolf”), for €3.25 million and the assumption of 100% of a shareholder loan from Mosolf to TME in the amount of €11.9 million.


TME has been a strategic, private label channel partner and one of the largest customers of Cenntro since 2019. As of March 2022, TME has a distribution network of 50 dealers in Germany and 13 importers in Europe across sixteen countries, including France, Spain, Portugal, the Netherlands, Belgium, Austria, Italy, Denmark, and the Czech Republic, and also sells directly to major fleet providers.

The acquisition expands Cenntro’s assembly capabilities and distribution network in EMEA and adds a strategic customer network in Europe. The TME assembly facility in Herne, Germany will be used for the assembly of the full line of Cenntro’s vehicles for the European market, including the Metro®, the Logistar™ series, and the Neibor® series for last mile on-delivery and related services. TME will change its name to Cenntro Automotive Europe GmbH and all the products distributed will be under the Cenntro brand. Additionally, all former TME dealers will have the ability to distribute Cenntro’s product line.

This acquisition adds significant capacity to our production and will fast-track our market expansion and brand recognition within EMEA (Europe, Middle East and Africa),” said Peter Wang, Chairman and CEO of Cenntro.

About Cenntro Electric Group

Cenntro Electric Group (or “Cenntro”) (NASDAQ: CENN) is a leading designer and manufacturer of electric light and medium-duty commercial vehicles. Cenntro’s purpose-built ECVs are designed to serve a variety of organizations in support of city services, last-mile delivery and other commercial applications. Cenntro plans to lead the transformation in the automotive industry through scalable, decentralized production, and smart driving solutions empowered by the Cenntro iChassis. As of November 30, 2021, Cenntro’s first ECV model Metro® has been sold or put into service more than 3,600 units in over 16 countries across North America, Europe and Asia. For more information, please visit Cenntro’s website at: http://www.cenntroauto.com.

About TROPOS MOTORS EUROPE

Tropos Motors Europe is a specialist for compact, electric commercial vehicles for a wide range of target groups and applications. These include, in particular, delivery and parcel services, industry and intralogistics, technical trades and facility management, food retail, hospitality and tourism, zoos, amusement parks and sports facilities as well as cities and municipalities. www.tropos-motors.de

About MOSOLF Group

The MOSOLF Group is one of the leading system service providers for the automobile industry in Europe. The family business, which was founded in 1955, has its headquarters in Kirchheim unter Teck, and provides a range of services. These include tailor-made logistics, technical and service solutions provided using a network of business sites across Europe and a multi-modal fleet. The spectrum of services provided by the MOSOLF Group covers the complete value-added chain for automobile logistics from the end of the production line to recycling. In addition to transporting vehicles (cars, light vans, high & heavy vehicles), workshop services, special vehicle construction, industrial paintwork, mobility services, releasing agent services, and vehicle recycling are all part of the portfolio of services. Within this context, MOSOLF provides all-round, customized solutions for the automobile industry, fleet operators, and dealers from one source and also handles the associated data flow using modern software solutions. To learn more, visit www.mosolf.com.

Forward-Looking Statements

This communication contains "forward-looking statements" within the meaning of the safe harbor provisions of the U.S. Private Securities Litigation Reform Act of 1995. Forward-looking statements include all statements that are not historical facts. Such statements may be, but need not be, identified by words such as "may,'' "believe,'' "anticipate,'' "could,'' "should,'' "intend,'' "plan,'' "will,'' "aim(s),'' "can,'' "would,'' "expect(s),'' "estimate(s),'' "project(s),'' "forecast(s)'', "positioned,'' "approximately,'' "potential,'' "goal,'' "strategy,'' "outlook'' and similar expressions. Examples of forward-looking statements include, among other things, statements regarding assembly and distribution capabilities, decentralized production, fully digitalized autonomous driving solutions and expected synergies and positive developments that could result from this transaction. All such forward-looking statements are based on management's current beliefs, expectations and assumptions, and are subject to risks, uncertainties and other factors that could cause actual results to differ materially from the results expressed or implied in this communication. Among the key factors that could cause actual results to differ materially from those expressed or implied in the forward-looking statements are the following: our ability to successfully integrate the acquired business and to maximize expected synergies; and our ability to realize the expected benefits of the transaction. For additional risks and uncertainties that could impact Cenntro’s forward-looking statements, please see disclosures contained in Cenntro's public filings with the SEC, including the "Risk Factors" in Cenntro's Report of Foreign Private Issuer on Form 6-K filed with the Securities and Exchange Commission on January 5, 2022 and which may be viewed at www.sec.gov.


Contacts

Investor Relations Contact:
Chris Tyson
MZ North America
This email address is being protected from spambots. You need JavaScript enabled to view it.
949-491-8235

Company Contact:
This email address is being protected from spambots. You need JavaScript enabled to view it.

SANTA CRUZ, Calif.--(BUSINESS WIRE)--Joby Aviation (NYSE: JOBY), a California-based company developing all-electric aircraft for commercial passenger service, today announced its financial results for fourth quarter 2021. Please visit the Joby investor relations website https://ir.jobyaviation.com/ to view the fourth quarter 2021 shareholder letter. Today the company will host a live audio webcast of its conference call to discuss the results at 2:00 p.m. PT (5:00 p.m. ET).


Additional Call Details:

What: Joby Fourth Quarter 2021 Earnings Conference Call

When: Thursday, March 24, 2022

Time: 2:00 p.m. PT (5:00 p.m. ET)

Webcast: Upcoming Events section of the company website (www.jobyaviation.com)

Live Call: 1-877-407-3982 or 1-201-493-6780

A replay of the call will be available until midnight, Thursday, April 7, 2022, by dialing 1-844-512-2921 or 1-412-317-6671 and entering passcode 13726125.

About Joby Aviation

Joby Aviation, Inc. (NYSE:JOBY) is a California-headquartered transportation company developing an all-electric vertical take-off and landing aircraft which it intends to operate as part of a fast, quiet, and convenient air taxi service beginning in 2024. The aircraft, which has a maximum range of 150 miles (241 kilometers) on a single charge, can transport a pilot and four passengers at speeds of up to 200 mph (321 km/h). It is designed to help reduce urban congestion and accelerate the shift to sustainable modes of transit. Founded in 2009, Joby employs more than 1,000 people, with offices in Santa Cruz, San Carlos, and Marina, California, as well as Washington, D.C. and Munich, Germany. To learn more, visit www.jobyaviation.com.

Forward Looking Statements

This press release contains “forward-looking statements” within the meaning of the “safe harbor” provisions of the Private Securities Litigation Reform Act of 1995, including but not limited to, statements regarding the development and performance of our aircraft, including the effects of an accident involving our first pre-production aircraft, the growth of our manufacturing capabilities, our regulatory outlook, progress and timing; our business plan, objectives, goals and market opportunity; and our current expectations relating to our business, financial condition, results of operations, prospects, capital needs and growth of our operations. You can identify forward-looking statements by the fact that they do not relate strictly to historical or current facts. These statements may include words such as “anticipate”, “estimate”, "expect”, “project”, “plan”, “intend”, “believe”, “may”, “will”, “should”, “can have”, “likely” and other words and terms of similar meaning in connection with any discussion of the timing or nature of future operating or financial performance or other events. All forward looking statements are subject to risks and uncertainties that may cause actual results to differ materially, including: our ability to launch our aerial ridesharing service and the growth of the urban air mobility market generally; our ability to produce aircraft that meet our performance expectations in the volumes and on the timelines that we project, and our ability to launch our commercial passenger service beginning in 2024, as currently projected; the competitive environment in which we operate; our future capital needs; our ability to adequately protect and enforce our intellectual property rights; our ability to effectively respond to evolving regulations and standards relating to our aircraft; our reliance on third-party suppliers and service partners; uncertainties related to our estimates of the size of the market for our service and future revenue opportunities; and other important factors discussed in the section titled “Risk Factors” in our Registration Statement on Form S-1 (File No. 333-260608), filed with the Securities and Exchange Commission on October 29, 2021, and in future filings and other reports we file with or furnish to the Securities and Exchange Commission, including our Annual Report on Form 10-K for the year ended December 31, 2021. Any such forward-looking statements represent management’s estimates and beliefs as of the date of this press release. While Joby may elect to update such forward-looking statements at some point in the future, it disclaims any obligation to do so, even if subsequent events cause its views to change.


Contacts

Investors:
This email address is being protected from spambots. You need JavaScript enabled to view it.
+1-831-201-6006

Media:
This email address is being protected from spambots. You need JavaScript enabled to view it.

- Bonus shares will be funded as part of utilizing company capital surplus of KRW3.3tn


- Plans to return 10% of Net Income in Cash dividend and 5% Share Buyback for next 3 years

- Actively expand CCUS and eco-friendly business

SEOUL, South Korea--(BUSINESS WIRE)--#BonusShares--On March 24, 2022, DL E&C (KRX: 375500) held a Board of Directors meeting and approved the issue of Bonus Equity shares to existing shareholders.

Maximize Shareholder Value through Bonus Issue

The proposed equity bonus will be issued at a ratio of 1:1. The number of newly issued stocks through this bonus share issue is 19,334,885 common stocks and 2,111,951 preferred stocks. When the bonus issue is completed, the total number of issued shares of DL E&C will increase from the current 21,472,623 to 42,919,459 stocks.

The date of issuance of new shares is April 8th, the date of allotment of new shares is April 11th, and the scheduled listing date is set for April 28th. The bonus issue will be financed by the company’s capital surplus of KRW3.271tn

A company official explained, “By increasing the total number of issued shares, we can hope to create a rebound in stock prices and reflect the core value of the company in future share prices.” He added, “The management’s decision to issue bonus shares reflects its intention to maximize shareholder’s value and profit”.

Uphold Mid to Long-term Shareholder Policy…Plans to Purchase Treasury Stock

Furthermore, in the general meeting held on the same day, DL E&C decided to pay a cash dividend of KRW2,700 per common stock (KRW2,750 for preferred stock). The total dividend payout is KRW58bn, which is 10% of the 2021 consolidated controlling shareholder’s net profit of KRW576.4bn.

In mid to long-term shareholder return policy initiated last year, DL E&C announced its plan to return 15% of annual net income to shareholders through cash dividend equal to 10% of net income and share buyback equal to 5% of net income.

The company official commented, “We are faithfully implementing our promised shareholder return policy and once the issuance of bonus equity share is completed, we will proceed to purchase treasury stock at an appropriate time.”

Promotion of New Eco-Friendly Businesses such as CCUS

DL E&C added CCUS and greenhouse gas emission rights-related business to the company’s articles of incorporation to secure new business growth potential and advance into an eco-friendly business.

In mid-March, DL E&C unveiled its plan to grow into a company that provides comprehensive solutions across the carbon capture, utilization and storage (CCUS) business value chain, which is viewed as the core of carbon neutrality. With leading technology and experience in the CCUS field, DL E&C hopes to expand its carbon business not only in Korea but also in the global market.

During the general meeting, DL E&C CEO Ma, Chang Min noted, “Although the pandemic situation that cast a deep shadow of uncertainty across the global economy continues, we will continue our efforts to not only grow our existing business but also strive towards change and innovation to improve future value.” He declared, “DL E&C, which was newly launched last year, will maximize shareholder value by firmly establishing a future growth engine centering on the new eco-friendly businesses. We will continue to seek ways to strengthen ESG management and eco-friendly business to secure growth drivers in the future and do our best to maximize shareholder value.”


Contacts

DL E&C Co., Ltd
David Cho
+82-2-2011-7192
This email address is being protected from spambots. You need JavaScript enabled to view it.

DALLAS--(BUSINESS WIRE)--Flowserve Corporation (NYSE: FLS), a leading provider of flow control products and services for the global infrastructure markets, announced today it has entered into a non-exclusive partnership agreement with Gradiant to help address the most challenging problems in water and wastewater treatment.


Flowserve has more than two centuries of experience serving the global water industry, providing low maintenance, energy efficient pumps, valves, seals and services to both the municipal and industrial water sectors. This partnership will combine Flowserve’s flow control solutions and product expertise with Gradiant’s innovative tailored water treatment technology to provide unparalleled total water treatment solutions for our customers. Flowserve also continues to upgrade its water portfolio with market leading flow control products and solutions for the water industry. Recent additions include the H2O+ submersible pump, a suite of highly efficient pumps for desalination, as well as our RedRaven IoT platform, which enhances our overall solutions portfolio and aftermarket services.

“As we further diversify, decarbonize and digitize to drive growth and continue to support our customers, this partnership is a tangible way we’re advancing our offerings in new geographies, new marketing applications and new technology synergies,” said Scott Rowe, Flowserve president and chief executive officer. “This new partnership with Gradiant not only strengthens Flowserve’s commitment and offering to the water market, but it also supports our sustainable development goals to make the world better for everyone.”

Gradiant develops and delivers advanced water and wastewater treatment facilities around the world, with a primary focus in the rapidly growing Asia Pacific and Americas for customers with mission-critical needs in cleantech water and sustainable operations. The company offers a broad portfolio of proprietary and patented technologies and services that focus on water reuse, resource recovery, brine concentration for minimum and zero liquid discharge (MLD / ZLD), and digital solutions for plant performance optimization. Gradiant offers flexible models for the design-build, operate-maintain, and financing of projects based on customers’ specific needs and situations.

“Working with a global flow control leader like Flowserve gives us access to a wider range of industry for our total solutions,” said Anurag Bajpayee, Gradiant co-founder and CEO. “This collaboration allows more rapid adoption of Gradiant’s cleantech water solutions into new market segments, leveraging Gradiant’s established project delivery resources and process expertise with Flowserve’s distribution reach.”

About Flowserve:

Flowserve Corp. is one of the world’s leading providers of fluid motion and control products and services. Operating in more than 50 countries, the company produces engineered and industrial pumps, seals and valves as well as a range of related flow management services. More information about Flowserve can be obtained by visiting the company’s website at www.flowserve.com.

About Gradiant:

Gradiant is a global solutions provider and developer of cleantech water projects for advanced water and wastewater treatment. Gradiant's end-to-end solutions and technology expertise enable sustainable and cost-effective treatment of the world's most important water challenges. Today, with over 400 employees, Gradiant operates from its corporate headquarters in Boston, regional headquarters and global R&D center in Singapore, and offices across ten countries. At Gradiant, we create New Possibilities for Water for our clients and the communities they serve to ensure a safer and more promising tomorrow. For more information, please visit www.gradiant.com.

Safe Harbor Statement: This news release includes forward-looking statements within the meaning of Section 27A of the Securities Act of 1933 and Section 21E of the Securities Exchange Act of 1934, which are made pursuant to the safe harbor provisions of the Private Securities Litigation Reform Act of 1995, as amended. Words or phrases such as, "may," "should," "expects," "could," "intends," "plans," "anticipates," "estimates," "believes," "forecasts," "predicts" or other similar expressions are intended to identify forward-looking statements, which include, without limitation, earnings forecasts, statements relating to our business strategy and statements of expectations, beliefs, future plans and strategies and anticipated developments concerning our industry, business, operations and financial performance and condition.

The forward-looking statements included in this news release are based on our current expectations, projections, estimates and assumptions. These statements are only predictions, not guarantees. Such forward-looking statements are subject to numerous risks and uncertainties that are difficult to predict. These risks and uncertainties may cause actual results to differ materially from what is forecast in such forward-looking statements, and include, without limitation, the following: the impact of the global outbreak of COVID-19 on our business and operations; a portion of our bookings may not lead to completed sales, and our ability to convert bookings into revenues at acceptable profit margins; changes in global economic conditions and the potential for unexpected cancellations or delays of customer orders in our reported backlog; our dependence on our customers’ ability to make required capital investment and maintenance expenditures; if we are not able to successfully execute and realize the expected financial benefits from our strategic transformation and realignment initiatives, our business could be adversely affected; risks associated with cost overruns on fixed-fee projects and in taking customer orders for large complex custom engineered products; the substantial dependence of our sales on the success of the oil and gas, chemical, power generation and water management industries; the adverse impact of volatile raw materials prices on our products and operating margins; economic, political and other risks associated with our international operations, including military actions, trade embargoes, epidemics or pandemics or changes to tariffs or trade agreements that could affect customer markets, particularly North African, Russian and Middle Eastern markets and global oil and gas producers, and non-compliance with U.S. export/re-export control, foreign corrupt practice laws, economic sanctions and import laws and regulations; increased aging and slower collection of receivables, particularly in Latin America and other emerging markets; our exposure to fluctuations in foreign currency exchange rates, including in hyperinflationary countries such as Venezuela and Argentina; our furnishing of products and services to nuclear power plant facilities and other critical processes; potential adverse consequences resulting from litigation to which we are a party, such as litigation involving asbestos-containing material claims; expectations regarding acquisitions and the integration of acquired businesses; our relative geographical profitability and its impact on our utilization of deferred tax assets, including foreign tax credits; the potential adverse impact of an impairment in the carrying value of goodwill or other intangible assets; our dependence upon third-party suppliers whose failure to perform timely could adversely affect our business operations; the highly competitive nature of the markets in which we operate; environmental compliance costs and liabilities; potential work stoppages and other labor matters; access to public and private sources of debt financing; our inability to protect our intellectual property in the U.S., as well as in foreign countries; obligations under our defined benefit pension plans; our internal control over financial reporting may not prevent or detect misstatements because of its inherent limitations, including the possibility of human error, the circumvention or overriding of controls, or fraud; the recording of increased deferred tax asset valuation allowances in the future or the impact of tax law changes on such deferred tax assets could affect our operating results; our information technology infrastructure could be subject to service interruptions, data corruption, cyber-based attacks or network security breaches, which could disrupt our business operations and result in the loss of critical and confidential information; ineffective internal controls could impact the accuracy and timely reporting of our business and financial results; and other factors described from time to time in our filings with the Securities and Exchange Commission.

All forward-looking statements included in this news release are based on information available to us on the date hereof, and we assume no obligation to update any forward-looking statement.


Contacts

Investor Contacts:
Jay Roueche, Vice President, Investor Relations & Treasurer (972) 443-6560
Mike Mullin, Director, Investor Relations (972) 443-6636

Media Contact:
Lars Rosene, Vice President, Corporate Communications & Public Affairs (972) 443-6644

  • Fiscal 2021 sales of $1.1 billion, up 10.8 percent from fiscal 2020
  • Solid full Year GAAP diluted EPS of $0.83
  • $70.2 million in earnings before interest, taxes, depreciation, amortization and other non-cash charges ("Adjusted EBITDA")
  • $49.0 million in cash
  • Free cash flow for the year of $32.8 million
  • Closed three acquisitions during the fiscal year - Carter & Verplanck, Process Machinery and Premier Water

HOUSTON--(BUSINESS WIRE)--DXP Enterprises, Inc. (NASDAQ: DXPE) today announced financial results for the fourth quarter and fiscal year ended December 31, 2021. The following are results for the three and twelve months ended December 31, 2021, compared to the three and twelve months ended December 31, 2020. A reconciliation of the non-GAAP financial measures can be found in the back of this press release.


Fourth Quarter 2021 financial highlights:

  • Sales grew 26.0 percent to $293.1 million, compared to $232.7 million for the fourth quarter of 2020.
  • Earnings per diluted share for the fourth quarter was $0.05 based upon 19.6 million diluted shares, compared to $(0.18) per share in the fourth quarter of 2020, based on 17.8 million diluted shares. Excluding inventory impairment charges and debt extinguishment costs, earnings per diluted share was $0.13 per share, for the fourth quarter of 2020.

Fiscal Year 2021 financial highlights:

  • Sales increased 10.8 percent to $1.1 billion, compared to $1.0 billion for 2020.
  • Earnings per diluted share for 2021 was $0.83 based upon 19.8 million diluted shares, compared to a loss of $(1.65) per share in 2020, based on 17.7 million basic shares. Excluding non-cash impairment and other one-time charges of $59.9 million, and $5.4 million in debt extinguishment costs, earnings per diluted share were $0.73 per share, assuming a 22.5% tax rate for full year 2020 .
  • Adjusted EBITDA for 2021 was $70.2 million compared to $59.0 million for 2020. Adjusted EBITDA as a percentage of sales was 6.3 percent and 5.9 percent, respectively.
  • Free cash flow (cash flow from operating activities less capital expenditures) for the full year was $32.8 million.

David R. Little, Chairman and CEO commented, “Given that our oil and gas customers' budgets were significantly reduced and the impact of COVID were stronger during the first of half of 2021, impacting the industrial side of DXP, fiscal 2021 was a good transitional year. DXP experienced growth in sales and gross margin resulting in 19.1 percent year-over-year growth in adjusted EBITDA. We are pleased with the overall financial performance in 2021. Similar to last year, fiscal 2021 was another unique year and presented corporate, societal and individual challenges. During the second half of 2021, we worked through accelerating supply chain headwinds and the beginning of meaningful inflation along with the continued impacts from COVID-19. DXP’s fiscal 2021 total sales were $1.1 billion a 10.8 percent increase year-over-year. Service Center sales were up 23.2 percent to $816.5 million, followed by Supply Chain Services growing 2.1 percent at $157.8 million and Innovative Pumping Solutions sales declined 25.8 percent to $139.6 million."

Mr. Little continued, "The sales momentum from our fourth quarter has positioned us for continued success as we move into 2022. Specifically, we have now experienced two sequential quarters of organic growth within IPS. The improved but volatile conditions in our traditional end markets along with DXP setting the stage to accelerate new growth through our focus on new markets, products and continued efficiency will be a catalyst as we move forward and into 2022. We are targeting opportunities in less cyclical markets, such as water and other general industries, while supporting our customers’ aspirations to decarbonize and maximize energy efficiency. We are confident that our growth strategy, coupled with a continued focus on improving margins will drive shareholder value."

Kent Yee, CFO commented, "Fiscal year 2021 financial performance reflects a turning of the business during the second half of the year. During the first and second quarter, the business was still declining and working through the impacts of COVID-19 on a year-over-year basis. In the second half of fiscal year 2021, we grew the business organically 13.1 percent. Overall, we are pleased with our fourth quarter and full year results. Total sales for the year grew 10.8 percent. Our fiscal year 2021 diluted earnings per share was $0.83. We generated $32.8 million in free cash flow, which reflects investments in working capital as we started to grow during the second half of the year. We continue to execute on our acquisition program having closed three acquisitions, bringing the total to seven acquisitions during this COVID cycle. We continue to deliver financial results that display our ability to adjust to the current environment while keeping our eyes toward the future with proactive actions including opportunistic share repurchases. During the year we repurchased 1.2 million shares or $33.5M in stock. As of December 31, 2021, we had $49.1 million in cash and cash equivalents on the balance sheet. Our secured leverage was 3.71:1, well under our covenant limit of 5.50:1. We continue to have momentum going into fiscal 2022 and we expect to drive organic and acquisition based growth."

Auditor Transition Update

DXP has successfully completed its auditor transition plan. Earlier this morning, DXP announced its Audit Committee selected PricewaterhouseCoopers LLP as its independent registered public accounting firm for the 2022 fiscal year. McConnell & Jones LLP will continue in its capacity through the completion of their audit services for the fiscal year ended December 31, 2021, and the filing of DXP’s 2021 Form 10-K.

Over the last four years, DXP has been focused on ensuring we are building a strong finance and accounting team, enhanced capabilities and increased functionality that would support and propel DXP into becoming a multi-billion-dollar company. This plan is centered around continuous improvement in people, accounting processes and technology to support the variety of businesses that are integral to DXP.

Financial Strength and Liquidity

Net debt, calculated as total long-term debt, net of cash and cash equivalents, on our balance sheet as of December 31, 2021, was $277.7 million compared to $210.7 million at December 31, 2020. As of December 31, 2021, DXP has approximately $180.7 million in liquidity, consisting of $49.0 million in cash on hand and approximately $131.7 million in availability under our ABL facility.

We will host a conference call regarding December 31, 2021 fourth quarter results on the Company’s website (www.dxpe.com) Friday, March 25, 2022 at 10:30 am CST. Web participants are encouraged to go to the Company’s website at least 15 minutes prior to the start of the call to register, download and install any necessary audio software. The online archived replay will be available immediately after the conference call at www.dxpe.com.

Non-GAAP Financial Measures

DXP supplements reporting of net income with non-GAAP measurements, including EBITDA, adjusted EBITDA, free cash flow, non-GAAP net income and net debt. This supplemental information should not be considered in isolation or as a substitute for the unaudited GAAP measurements. Additional information regarding EBITDA, free cash flow and non-GAAP net income referred to in this press release are included below under "Unaudited Reconciliation of Non-GAAP Financial Information."

The Company believes EBITDA provides additional information about: (i) operating performance, because it assists in comparing the operating performance of the business, as it removes the impact of non-cash depreciation and amortization expense as well as items not directly resulting from core operations such as interest expense and income taxes and (ii) the performance and the effectiveness of operational strategies. Additionally, EBITDA performance is a component of a measure of the Company’s financial covenants under its credit facility. Furthermore, some investors use EBITDA as a supplemental measure to evaluate the overall operating performance of companies in the industry. Management believes that some investors’ understanding of performance is enhanced by including this non-GAAP financial measure as a reasonable basis for comparing ongoing results of operations. By providing this non-GAAP financial measure, together with a reconciliation from net income, the Company believes it is enhancing investors’ understanding of the business and results of operations, as well as assisting investors in evaluating how well the Company is executing strategic initiatives.

About DXP Enterprises, Inc.

DXP Enterprises, Inc. is a leading products and service distributor that adds value and total cost savings solutions to industrial customers throughout the United States, Canada and Dubai. DXP provides innovative pumping solutions, supply chain services and maintenance, repair, operating and production ("MROP") services that emphasize and utilize DXP’s vast product knowledge and technical expertise in rotating equipment, bearings, power transmission, metal working, industrial supplies and safety products and services. DXP's breadth of MROP products and service solutions allows DXP to be flexible and customer-driven, creating competitive advantages for our customers. DXP’s business segments include Service Centers, Innovative Pumping Solutions and Supply Chain Services. For more information, go to www.dxpe.com.

The Private Securities Litigation Reform Act of 1995 provides a “safe-harbor” for forward-looking statements. Certain information included in this press release (as well as information included in oral statements or other written statements made by or to be made by the Company) contains statements that are forward-looking. These forward-looking statements include without limitation those about the Company’s expectations regarding the impact of the COVID-19 pandemic and the impact of low commodity prices of oil and gas; the Company’s business, the Company’s future profitability, cash flow, liquidity, and growth. Such forward-looking information involves important risks and uncertainties that could significantly affect anticipated results in the future; and accordingly, such results may differ from those expressed in any forward-looking statement made by or on behalf of the Company. These risks and uncertainties include, but are not limited to; decreases in oil and natural gas prices; decreases in oil and natural gas industry expenditure levels, which may result from decreased oil and natural gas prices or other factors; ability to obtain needed capital, dependence on existing management, leverage and debt service, domestic or global economic conditions, economic risks related to the impact of COVID-19, ability to manage changes and the continued health or availability of management personnel and changes in customer preferences and attitudes. In some cases, you can identify forward-looking statements by terminology such as, but not limited to, “may,” “will,” “should,” “intend,” “expect,” “plan,” “anticipate,” “believe,” “estimate,” “predict,” “potential,” “goal,” or “continue” or the negative of such terms or other comparable terminology. For more information, review the Company’s filings with the Securities and Exchange Commission. More information on these risks and other potential factors that could affect the Company’s business and financial results is included in the Company’s filings with the SEC, including in the “Risk Factors” and “Management’s Discussion and Analysis of Financial Condition and Results of Operations” sections of the Company’s most recently filed periodic reports on Form 10-K and Form 10-Q and subsequent filings. The Company assumes no obligation to update any forward-looking statements or information, which speak as of their respective dates.


DXP ENTERPRISES, INC. AND SUBSIDIARIES

UNAUDITED CONSOLIDATED STATEMENTS OF OPERATIONS

($ thousands, except per share amounts)


Three Months Ended
December 31,


Twelve Months Ended
December 31,


2021


2020


2021


2020


Sales


$

293,149


$

232,689


$

1,113,921


$

1,005,266


Cost of sales


208,494


170,122


785,415


728,070


Gross profit


84,655


62,567


328,506


277,196


Selling, general and administrative expenses


77,062


56,497


288,649


244,981


Impairments and other charges


11,482


59,883


Operating income (loss)


7,593


(5,412

)


39,857


(27,668

)

Other expense (income), net


570


455


(414

)


74


Interest expense


5,245


8,512


21,089


20,571


Income (loss) before income taxes


1,778


(14,379

)


19,182


(48,313

)

Provision (benefit) for income taxes


1,051


(11,049

)


3,431


(18,696

)

Net income (loss)


727


(3,330

)


15,751


(29,617

)

Net loss attributable to NCI*


(155

)


(115

)


(745

)


(348

)

Net income (loss) attributable to DXP Enterprises, Inc.


882


(3,215

)


16,496


(29,269

)

Preferred stock dividend


22


22


90


90


Net income (loss) attributable to common shareholders


$

860


$

(3,237

)


$

16,406


$

(29,359

)

Diluted earnings (loss) per share attributable to DXP Enterprises, Inc. **


$

0.05


$

(0.18

)


$

0.83


$

(1.65

)

Weighted average common shares and common equivalent shares outstanding


19,579


17,777


19,789


17,748


*NCI represents non-controlling interest

** Fiscal year 2020 diluted earnings per share for GAAP purposes was calculated using basic weighted average shares outstanding. Due to a loss for the period, convertible preferred stock shares are excluded from the computation of diluted EPS because the effect will be antidilutive.

Business segment financial highlights:

  • Service Centers’ revenue for the fiscal year was $816.5 million, an increase of 23.2 percent year-over-year with a 12.1 percent operating income margin.
    • Revenue for the fourth quarter was $208.0 million, an increase of 28.9 percent year-over-year with a 10.4 percent operating income margin.
  • Innovative Pumping Solutions’ revenue for the fiscal year was $139.6 million, a decrease of 25.7 percent year over year with an 8.6 percent operating income margin.
    • Revenue for the fourth quarter was $43.2 million, an increase of 21.2 percent year-over-year with an operating income margin of 14.0 percent.
  • Supply Chain Services’ revenue for the fiscal year was $157.8 million, an increase of 2.1 percent year-over-year with a 7.6 percent operating margin.
    • Revenue for the fourth quarter was $42.0 million, an increase of 17.4 percent year-over-year with a 6.6 percent operating income margin.
 

SEGMENT DATA

($ thousands, unaudited)


Three Months Ended December 31,


Twelve Months Ended December 31,

Sales

2021


2020


2021


2020

Service Centers

$

207,955


$

161,284


$

816,496


$

662,617

Innovative Pumping Solutions


43,179


35,615


139,591


187,991

Supply Chain Services


42,015


35,790


157,834


154,658

Total DXP Sales

$

293,149


$

232,689


$

1,113,921


$

1,005,266


Three Months Ended December 31,


Twelve Months Ended December 31,

Operating Income

2021


2020


2021


2020

Service Centers

$

21,679


$

18,303


$

98,931


$

71,834

Innovative Pumping Solutions


6,043


802


12,070


16,882

Supply Chain Services


2,787


2,796


11,963


12,804

Total segments operating income

$

30,509


$

21,901


$

122,964


$

101,520

Reconciliation of Operating Income for Reportable Segments

($ thousands, unaudited)


Three Months Ended December 31,


Twelve Months Ended December 31,


2021


2020


2021


2020

Operating income for reportable segments

$

30,509


$

21,901


$

122,964


$

101,520


Adjustment for:


Impairments and other charges


11,482


59,883


Amortization of intangibles


4,507


2,991


17,197


12,287


Corporate expenses


18,409


12,707


65,910


57,018


Total operating income (loss)

$

7,593


$

(5,279

)


$

39,857


$

(27,668

)

Interest and other financing expenses


5,245


8,512


21,089


20,571


Other expense (income), net


570


455


(414

)


74


Income (loss) before income taxes

$

1,778


$

(14,246

)


$

19,182


$

(48,313

)

Unaudited Reconciliation of Non-GAAP Financial Information

($ thousands, unaudited)


The following table is a reconciliation of EBITDA and adjusted EBITDA, a non-GAAP financial measure, to income (loss) before income taxes, calculated and reported in accordance with U.S. GAAP.


Three Months Ended December 31,


Twelve Months Ended December 31,


2021


2020


2021


2020

Income (loss) before income taxes


1,778


(14,379

)


$

19,182


$

(48,313

)

Plus: interest and other financing expenses


5,245


8,512


21,089


20,571


Plus: depreciation and amortization


7,073


5,389


27,143


22,683


EBITDA

$

14,096


$

(478

)


$

67,414


$

(5,059

)


Plus: NCI loss income before tax*


206


232


993


632


Plus: Impairment and other charges


11,482


59,883


Plus: stock compensation expense


469


662


1,823


3,532


Adjusted EBITDA

$

14,771


$

11,898


$

70,230


$

58,988


* NCI represents non-controlling interest


DXP ENTERPRISES, INC. AND SUBSIDIARIES

UNAUDITED CONSOLIDATED BALANCE SHEETS

($ thousands, except per share amounts)


December 31, 2021


December 31, 2020

ASSETS


Current assets:


Cash

$

48,989


$

119,328

Restricted cash


91


91

Accounts receivable, net of allowances for doubtful accounts


218,137


166,941

Inventories


100,894


97,071

Costs and estimated profits in excess of billings


17,193


18,459

Prepaid expenses and other current assets


9,522


4,548

Federal income taxes receivable


9,748


2,987

Total current assets

$

404,574


$

409,425

Property and equipment, net


51,880


56,899

Goodwill


308,506


261,767

Other intangible assets, net of accumulated amortization


79,205


80,088

Operating lease right-of-use assets


57,221


55,188

Other long-term assets


4,806


4,764

Total assets

$

906,192


$

868,131


LIABILITIES AND EQUITY


Current liabilities:


Current maturities of long-term debt

$

3,300


$

3,300

Trade accounts payable


77,842


64,849

Accrued wages and benefits


23,006


20,621

Customer advances


12,924


3,688

Billings in excess of costs and estimated profits


3,581


4,061

Current-portion operating lease liabilities


18,203


15,891

Other current liabilities


42,206


34,729

Total current liabilities

$

181,062


$

147,139

Long-term debt, less unamortized debt issuance costs


315,397


317,139

Long-term operating lease liabilities


39,922


38,010

Other long-term liabilities


3,603


2,930

Deferred income taxes


7,516


1,777

Total long-term liabilities

$

366,438


$

359,856

Total Liabilities

$

547,500


$

506,995

Equity:


Total DXP Enterprises, Inc. equity


358,639


360,338

Non-controlling interest


53


798

Total Equity

$

358,692


$

361,136

Total liabilities and equity

$

906,192


$

868,131

Unaudited Reconciliation of Non-GAAP Financial Information

($ thousands, unaudited)

 
The following table is a reconciliation of free cash flow, a non-GAAP financial measure, to cash flow from operating activities, calculated and reported in accordance with U.S. GAAP.


Three Months Ended
December 31,


Twelve Months Ended
December 31,


2021


2020


2021


2020

Net cash from operating activities

$

14,258


$

17,413


$

37,089


$

109,650


Less: purchases of property and equipment


(3,015

)


(142

)


(5,999

)


(6,672

)

Plus: proceeds from sales of property and equipment


372


1,669


123


Free cash flow

$

11,615


$

17,271


$

32,759


$

103,101


The following table is a reconciliation of adjusted net income, a non-GAAP financial measure, to net income, calculated and reported in accordance with U.S. GAAP.


Three Months Ended
December 31,


Twelve Months Ended
December 31,


2021


2020


2021


2020

GAAP Net Income (Loss) :

$

882


$

(3,215

)


$

16,496


$

(29,269

)

Impairment and other charges


11,482


59,883


Extinguishment of debt in connection with refinancing


5,443


5,443


Adjustment for taxes*


(11,527

)


(22,363

)

Non-GAAP net income

$

882


$

2,183


$

16,496


$

13,694


Weighted average common shares and common equivalent shares outstanding **


Basic


18,739


17,777


18,949


17,748


Diluted


19,579


17,777


19,789


17,748


Diluted earnings (loss) per share:


GAAP **

$

0.05


$

(0.18

)


$

0.83


$

(1.65

)

Non-GAAP

$

0.05


$

0.13


$

0.83


$

0.73


* Adjustment for taxes relates to the tax effects of the adjustments that we incorporated into non-GAAP measures in order to provide a more meaningful measure of non-GAAP net income. Also, we have included an adjustment for the normalizing of tax credits and adjustments. The year-to-date effective tax rate of 22.5 percent was applied to the impairments and other charges for conservative purposes.

** Fiscal year 2020 diluted earnings per share for GAAP purposes was calculated using basic weighted average shares outstanding. Due to a loss for the period, convertible preferred stock shares are excluded from the computation of diluted EPS because the effect will be antidilutive.


Contacts

DXP Enterprises, Inc.
Kent Yee, 713-996-4700
Senior Vice President, CFO
www.dxpe.com

Facility houses high-tech R&D and product development for gate drivers used in renewable energy, electric transportation and other clean technologies

BIEL, Switzerland--(BUSINESS WIRE)--Power Integrations (Nasdaq: POWI), the leader in high-voltage integrated circuits for energy-efficient power conversion, today opened its newly constructed facility in Biel, Switzerland at a ceremony hosted by the company’s CEO, Balu Balakrishnan, and attended by Biel mayor Erich Fehr. The 4,600-square-meter, $20 million facility is the new home for about 60 engineers and other technology professionals, a number that is expected to rise as the company continues to grow in the years ahead. In addition to modern office and laboratory space, the contemporary building houses a surface-mounted-technology (SMT) line used to develop prototypes for the company’s gate-driver products. The facility also features a 25-kilowatt rooftop solar array.


Power Integrations’ presence in Switzerland dates to its 2012 acquisition of CT-Concept Technologie AG. Its Biel operation specializes in gate drivers for high-power applications such as solar and wind energy, electric locomotives and efficient DC transmission lines, and is an integral part of the company’s efforts in the electric-vehicle market. Worldwide, Power Integrations employs approximately 770 people, with additional R&D centers at its Silicon Valley headquarters as well as in Canada, Malaysia and the United Kingdom, and design-support centers in Germany and the Philippines.

In addition to its innovative gate drivers, Power Integrations is known for high-voltage integrated circuits (ICs) used in power supplies for appliances, smartphones, computers and myriad consumer-electronics and industrial products. The company’s ICs feature proprietary energy-saving technologies such as gallium-nitride transistors and EcoSmart™ technology, which reduces the energy consumed by electronic products in “standby” or idle modes. Reflecting the environmental benefits of the company’s products, the company’s Nasdaq-listed shares are included in clean-technology indexes such as The Cleantech Index and the Nasdaq Clean Edge Green Energy Index. The company shipped nearly two billion ICs and gate drivers in 2021, generating revenues of $703 million—an increase of more than 40 percent from the prior year.

Commented Mr. Balakrishnan: "We are delighted to open our new, permanent home in Biel, bringing all of our local employees under one roof and giving us ample room for the growth we expect in the years ahead. Our presence here is an essential part of our company’s efforts to develop innovative products for a low-carbon future. We are grateful to the city’s leaders for their support of this project, and we look forward to a long and productive future together.”

Biel mayor Erich Fehr commented: "I am pleased by Power Integrations' enduring commitment to the city of Biel. The fact that such an innovative, fast-growing company has chosen to establish roots here speaks for the attractiveness of our city and our region as a business location. At the same time, our city benefits from Power Integrations' dynamism and innovation, as the past decade has already proven."

Power Integrations' new Swiss home was planned and built by Biel-based architectural firm GLS Architects. Commented Nik Liechti, CEO of GLS Architects: "This has been an exciting project for our firm from its very beginning more than five years ago. We have particularly enjoyed the challenge of integrating a high-tech SMT line into this contemporary office building, and we are extremely proud of the result. The cooperation with Power Integrations and the authorities on this project was excellent and a key factor in the successful development of this high-density building. We were able to meet all deadlines and cost projections despite the difficult circumstances during the pandemic.”

About Power Integrations

Power Integrations, Inc. is a leading innovator in semiconductor technologies for high-voltage power conversion. The company’s products are key building blocks in the clean-power ecosystem, enabling the generation of renewable energy as well as the efficient transmission and consumption of power in applications ranging from milliwatts to megawatts. For more information, please visit www.power.com.

Power Integrations, EcoSmart and the Power Integrations logo are trademarks or registered trademarks of Power Integrations, Inc. All other trademarks are the property of their respective owner.


Contacts

Joe Shiffler
Power Integrations
1-408-414-8528
This email address is being protected from spambots. You need JavaScript enabled to view it.

HOUSTON--(BUSINESS WIRE)--$XPRO #XPRO--Expro (NYSE: XPRO), is honored to be recognized at the 2022 Offshore Technology Conference (OTC) in Houston with a Spotlight on New Technology® Award for the Autonomous Well Intervention System – GaleaTM .


This prestigious award highlights the latest and most innovative global technologies that are advancing and revolutionizing the future of the energy industry. Galea was selected based on its innovative autonomous technology and significant environmental, cost, and HSE impact beyond existing technologies.

Galea is the world’s first fully autonomous well intervention system, to maximize production while reducing intervention costs, HSE risks, and the carbon footprint of operations.

The system replaces larger, conventional, and more labor-intensive wireline rig-ups for a range of routine slickline operations. Galea can be configured in a variety of operating modes ranging from fully autonomous to manual to suit a range of applications on and offshore.

Galea deploys a tool string into the well either at regular intervals or as defined by the well conditions in fully autonomous mode. The system performs a pre-programmed intervention sequence in semi-autonomous mode, initiated locally or remotely. When in manual mode, quick rig-up intervention compared to conventional operations is enabled.

The system also reduces the impact of operations on the environment around the well site. A small self-contained intervention package located at the well site all year-round eliminates the need for repetitive environmentally disruptive wireline unit or truck operations required for traditional approaches.

Galea has several fail-safe features to ensure containment and elimination of potential wire-breaks during interventions.

Expro’s Well Intervention and Integrity Vice President Max Tseplic said:

“At Expro, we are very focused on the well optimization and integrity challenges faced by our customers. We have developed Galea, an intelligent autonomous well intervention system, to maximize production, while reducing operational overheads and provide a positive impact to the environment.

“Following successful field trials Galea is now available to our customers as a solution to a wide range of well intervention applications.

“This prestigious award from our industry recognizes not only one technology, but also Expro’s wider commitment to delivering cost-effective, innovative technologies and solutions, and what we consider to be best-in-class safety and service quality performance, as part of creating a more sustainable business and a lower carbon future.”

Expro’s North and Latin America Region Vice President Toby Pitre added:

“Enhancing our technology development remains a key focus for Expro. With a wide breadth of capabilities and expertise across the entire well lifecycle, we are fully focused on meeting changing industry demands.

“Galea is the latest addition to our balanced portfolio of world-class services and future-facing technologies that we will presenting at OTC Houston.

“As we see the return of global travel and in person events, OTC Houston 2022 will be an excellent opportunity for us to meet with customers and showcase our exciting new developments.”

Expro’s new future facing technologies and presentations will be available at OTC Houston 2022, from 2 – 5 May, 2022 – booth #2626.

Watch how Galea works here

ENDS

Notes to Editors:

Expro

Working for clients across the entire well life cycle, Expro is a leading provider of energy services, offering cost-effective, innovative solutions and best-in-class safety and service quality. The company’s extensive portfolio of capabilities spans well construction, well flow management, subsea well access, and well integrity and intervention.

Founded in 1938, Expro has more than 6,500 employees and provides services and solutions to leading exploration and production companies in both onshore and offshore environments in approximately 60 countries with over 100 locations.

For more information, please visit: expro.com and connect with Expro on Twitter @ExproGroup and LinkedIn @Expro.

SPECIAL NOTE REGARDING FORWARD-LOOKING STATEMENTS

This press release, and oral statements made from time to time by representatives of the Company, may contain certain "forward-looking statements" within the meaning of the Private Securities Litigation Reform Act of 1995. Forward-looking statements include statements regarding, among other things, subsea well access activity and delivering technical and operational regional requirements, and are indicated by words or phrases such as "anticipate," "outlook," "estimate," "expect," "project," "believe," "envision," "goal," "target," "can," "will," and similar words or phrases. These forward-looking statements involve known and unknown risks, uncertainties and other factors which may cause actual results, performance or achievements to be materially different from the future results, performance or achievements expressed in or implied by such forward-looking statements. Forward-looking statements are based largely on the Company's expectations and judgments and are subject to certain risks and uncertainties, many of which are unforeseeable and beyond our control. The factors that could cause actual results, performance or achievements to materially differ include, among others the risk factors identified in the Company’s Annual Report on Form 10-K, Form 10-Q and Form 8-K reports filed with the Securities and Exchange Commission. The Company undertakes no obligation to publicly update or revise any forward-looking statements, whether as a result of new information, future events or otherwise.


Contacts

Expro – Hannah Rumbles   +44 (0) 1224-796729 


Fourth Quarter and Full Year 2021 Financial Highlights


  • Generated revenues of $71.8 million for full year 2021, an increase of 59% over full year 2020
  • Full year 2021 GAAP net income of $13.0 million, as compared to 2020 net loss of $1.9 million
  • Full year 2021 adjusted EBITDA of $41.0 million, an increase of 60% over full year 2020*
  • Generated revenues of $21.6 million for fourth quarter 2021, an increase of 92% over fourth quarter 2020
  • Fourth quarter 2021 GAAP net income of $14.5 million, as compared to fourth quarter 2020 net loss of $3.3 million
  • Fourth quarter 2021 adjusted EBITDA of $12.9 million, an increase of 129% over fourth quarter 2021*
  • Increased installed portfolio of solar generation assets to 362 megawatts across 18 states during 2021

Recent Business Highlights

  • Increased actionable project pipeline to over 1 gigawatt driven by growing opportunity set
  • Awarded 35 megawatts in New Jersey community solar pilot in November, leveraging Blackstone Industrial Real Estate portfolio
  • Announced key hires Dan Alcombright as Chief Platform Officer, and Chris Shelton as Head of Investor Relations


STAMFORD, Conn.--(BUSINESS WIRE)--Altus Power, Inc. (NYSE: AMPS) (“Altus Power” or the “Company”), a leading clean electrification company, today announced results for the fourth quarter and full year 2021. Revenues for the full year 2021 were $71.8 million, compared with $45.3 million for full year 2020. The Company reported 2021 GAAP net income of $13.0 million, compared to a $1.9 million net loss in 2020. Adjusted EBITDA for 2021 totaled $41.0 million, with adjusted EBITDA margin of 57%.*

“In 2021, Altus Power continued to drive our business forward, providing clean electrification options to customers and growing our operating footprint. At the same time, we executed on strategic partnerships and added key personnel to provide for our growing customer pipeline,” said Lars Norell, Co-CEO of Altus Power. “Altus Power expects to continue our success through emphasis on streamlined customer acquisition, leveraging digital capabilities and deploying low cost capital.”

Commercial Momentum Continuing

During 2021, Altus Power increased the size of its portfolio of assets by over 50% to a total of 362 megawatts of installed capacity. In 2022 Altus Power will continue its close collaboration with Blackstone Real Estate and cultivate new relationships under its agreement with CBRE.

Since the close of its business combination with CBRE Acquisition Holdings in December, Altus Power and CBRE’s Renewable Energy Solutions team have quickly identified a pool of CBRE clients that could immediately benefit from Altus Power’s clean energy project development expertise. This process has yielded immediate results, and the Company looks forward to executing on these and additional opportunities in the near future.

“We’ve hit the ground running with the CBRE team in 2022,” said Gregg Felton, Co-CEO of Altus Power. “The types of commercial partnerships we’re exploring are exactly what we envisioned under our agreement with CBRE. We look forward to the opportunity to partner with additional CBRE clients to reduce their electricity costs and help decarbonize their operations.

“Work also continues with our long-time partner Blackstone to prioritize and execute on clean energy opportunities across their commercial real estate holdings, highlighted by our recent 35 megawatt community solar award which will be hosted on Blackstone industrial real estate in New Jersey,” continued Felton.

Altus Power continues to prioritize the digitization of its processes, which promises to further streamline origination and construction workflows and reduce costs as Altus Power scales its business.

“Our number one digitization goal is building out the technology infrastructure that leverages CBRE’s vast data resources, allowing us to efficiently capitalize on our new relationship,” said Julia Sears, Chief Digital Officer at Altus Power. “By leveraging our enhanced technology platform to clearly identify the massive value Altus Power can deliver to our clients, we will be able to convert prospects into customers more efficiently, including for the ever-growing Community Solar market. Whether evaluating building and usage data, measuring client consumption, or managing our operations from initial customer engagement through construction and ongoing maintenance, we are investing in our technology platform to support all areas of our growth.”

Fourth Quarter Financial Results

Revenues during the fourth quarter of 2021 totaled $21.6 million, compared to $11.3 million during the same period of 2020, an increase of 92%.

Fourth quarter 2021 GAAP net income totaled $14.5 million, which included a $12.8 million one-time gain on sale, compared to a net loss of $3.3 million for the same period last year.

Adjusted EBITDA during the fourth quarter of 2021 was $12.9 million, compared to $5.6 million for the fourth quarter of 2020, a 129% increase.* The quarter over quarter growth in adjusted EBITDA is the result of increased revenue from additional solar energy facilities outpacing the increase of operating and general administrative expenses.*

Full Year 2021 Financial Results

Revenues for the full year 2021 totaled $71.8 million, an increase of 59% over 2020 full year revenue of $45.3 million, primarily due to the increased number of solar energy facilities in our portfolio.

GAAP net income for full year 2021 totaled $13.0 million, including a one-time gain on sale of $12.8 million, compared to a net loss of $1.9 million for 2020.

Adjusted EBITDA for the full year 2021 totaled $41.0 million, an increase of 60% over 2020 adjusted EBITDA of $25.6 million, due to the growth in revenue from additional solar energy facilities outpacing the increase of operating and general administrative expenses.*

Balance Sheet and Liquidity

Altus Power ended 2021 with $326 million in unrestricted cash, and $546 million of total debt, resulting in net debt of $220 million. The Company expects to fund its operations using available cash, additional borrowings under debt facilities and third-party tax equity, for the foreseeable future.

Initiating 2022 Adjusted EBITDA guidance

Today Altus Power is initiating a 2022 adjusted EBITDA guidance range of $57-63 million, nearly 50% growth over 2021 at the midpoint.* Management focuses on adjusted EBITDA and adjusted EBITDA margin as key measures of profitable growth and approximation of cash flow generation. Management will give further details on guidance during the Company’s earnings call.

Conference Call Information

The Altus Power management team will host a conference call to discuss its full year and fourth quarter 2021 financial results on Friday, March 25, 2022, at 8:30 a.m. Eastern Time. The call can be accessed via a live webcast accessible on the Events & Presentations page in the Investor Relations section of Altus Power’s website at www.altuspower.com. An archive of the webcast will be available after the call on the Investor Relations section of Altus Power’s website as well.

Use of Non-GAAP Financial Information

*We present our operating results in accordance with accounting principles generally accepted in the U.S. (“GAAP”). We believe certain financial measures, such as adjusted EBITDA and adjusted EBITDA margin provide users of our financial statements with supplemental information that may be useful in evaluating our business. The presentation of non-GAAP financial information is not intended to be considered in isolation or as a substitute for, or superior to, the financial information prepared and presented in accordance with GAAP.

We define adjusted EBITDA as net income (loss) plus net interest expense, depreciation, amortization and accretion expense, income tax expense, acquisition and entity formation costs, non-cash compensation expense, and excluding the effect of certain non-recurring items we do not consider to be indicative of our ongoing operating performance such as, but not limited to, gain on fair value remeasurement of contingent consideration, gain on disposal of property, plant and equipment, change in fair value of redeemable warrant liability, change in fair value of alignment shares, loss on extinguishment of debt, and other miscellaneous items of other income and expenses.

Adjusted EBITDA is a non-GAAP financial measure that we use as a performance measure. We believe that investors and securities analysts also use adjusted EBITDA in evaluating our operating performance. This measurement is not recognized in accordance with GAAP and should not be viewed as an alternative to GAAP measures of performance. The GAAP measure most directly comparable to adjusted EBITDA is net income. The presentation of adjusted EBITDA should not be construed to suggest that our future results will be unaffected by non-cash or non-recurring items. In addition, our calculation of adjusted EBITDA is not necessarily comparable to adjusted EBITDA as calculated by other companies.

We believe adjusted EBITDA is useful to management, investors and analysts in providing a measure of core financial performance adjusted to allow for comparisons of results of operations across reporting periods on a consistent basis. These adjustments are intended to exclude items that are not indicative of the ongoing operating performance of the business. Adjusted EBITDA is also used by our management for internal planning purposes, including our consolidated operating budget, and by our board of directors in setting performance-based compensation targets. Adjusted EBITDA should not be considered an alternative to but viewed in conjunction with GAAP results, as we believe it provides a more complete understanding of ongoing business performance and trends than GAAP measures alone. Adjusted EBITDA has limitations as an analytical tool, and you should not consider it in isolation or as a substitute for analysis of our results as reported under GAAP.

Altus Power does not provide GAAP financial measures on a forward-looking basis because the Company is unable to predict with reasonable certainty and without unreasonable effort, items such as acquisition and entity formation costs, gain on fair value remeasurement of contingent consideration, change in fair value of redeemable warrant liability, change in fair value of alignment shares. These items are uncertain, depend on various factors, and could be material to Altus Power’s results computed in accordance with GAAP.

About Altus Power, Inc.

Altus Power, based in Stamford, Connecticut, is the nation’s premier clean electrification company. Altus Power serves its commercial, industrial, public sector and community solar customers by developing, owning and operating locally sited solar generation, energy storage, and EV charging infrastructure across 18 states from Vermont to Hawaii. Visit altuspower.com to learn more.

Forward-Looking Statements

This press release contains forward-looking statements. Forward-looking statements may be identified by the use of words such as “anticipate”, “believe”, “could”, “continue”, “expect”, “estimate”, “may”, “plan”, “outlook”, “future” and “project” and other similar expressions that predict or indicate future events or trends or that are not statements of historical matters. These statements, which involve risks and uncertainties, relate to analyses and other information that are based on forecasts of future results and estimates of amounts not yet determinable and may also relate to Altus Power’s future prospects, developments and business strategies. These statements are based on Altus Power’s management’s current expectations and beliefs, as well as a number of assumptions concerning future events.

Such forward-looking statements are subject to known and unknown risks, uncertainties, assumptions and other important factors, many of which are outside Altus Power’s control, that could cause actual results to differ materially from the results discussed in the forward-looking statements. These risks, uncertainties, assumptions and other important factors include, but are not limited to: (1) the ability of Altus Power to maintain its listing on the New York Stock Exchange; (2) the ability to recognize the anticipated benefits of the recently completed business combination and related transactions (the “Transactions”), which may be affected by, among other things, competition, the ability of Altus Power to grow and manage growth profitably, maintain relationships with customers, business partners, suppliers and agents and retain its management and key employees; (3) costs related to the Transactions; (4) changes in applicable laws or regulations; (5) the possibility that Altus Power may be adversely affected by other economic, business, regulatory and/or competitive factors; (6) the impact of COVID-19 on Altus Power’s business; and (7) the failure to realize anticipated pro forma results and underlying assumptions related to the Transactions.

Additional factors that could cause actual results to differ materially from those expressed or implied in forward-looking statements can be found under the heading “Risk Factors” in Altus Power’s Form 10-K filed with the Securities and Exchange Commission on March 24th, 2022, as well as the other information we file with the Securities and Exchange Commission., as well as the other information we file with the Securities and Exchange Commission. New risks and uncertainties arise from time to time, and it is impossible for us to predict these events or how they may affect us. You are cautioned not to place undue reliance upon any forward-looking statements, which speak only as of the date made, and Altus Power undertakes no obligation to update or revise the forward-looking statements, whether as a result of new information, changes in expectations, future events or otherwise.

This press release is not intended to be all-inclusive or to contain all the information that a person may desire in considering an investment in Altus Power and is not intended to form the basis of an investment decision in Altus Power. All subsequent written and oral forward-looking statements concerning Altus Power or other matters and attributable to Altus Power or any person acting on its behalf are expressly qualified in their entirety by the cautionary statements above.


Altus Power, Inc.

CONSOLIDATED STATEMENTS OF OPERATIONS

(In thousands, except share and per share data)


Three Months Ended
December 31,


Year Ended
December 31,


2021


2020


2021


2020


Operating revenues, net

$

21,578


$

11,265


$

71,800


$

45,278


Operating expenses


Cost of operations (exclusive of depreciation and amortization shown separately below)


4,024


2,633


14,029


9,661


General and administrative


4,731


3,032


16,915


10,143


Depreciation, amortization and accretion expense


6,800


3,522


20,967


11,932


Acquisition and entity formation costs


303


575


1,489


1,015


Gain on fair value remeasurement of contingent consideration


(400

)


(2,800

)


Gain on disposal of property, plant and equipment


(12,842

)


(12,842

)


Total operating expenses

$

2,616


$

9,762


$

37,758


$

32,751


Operating income


18,962


1,503


34,042


12,527


Other (income) expenses


Change in fair value of redeemable warrant liability


2,332


2,332


Change in fair value of alignment shares liability


(5,013

)


(5,013

)


Other (income) expense, net


(593

)


154


245


258


Interest expense, net


5,971


3,730


19,933


14,073


Loss on extinguishment of debt


3,245


Total other expense

$

2,697


$

3,884


$

20,742


$

14,331


Income (loss) before income tax expense

$

16,265


$

(2,381

)


$

13,300


$

(1,804

)

Income tax expense


(1,792

)


(964

)


(295

)


(83

)

Net income (loss)

$

14,473


$

(3,345

)


$

13,005


$

(1,887

)

Net income (loss) attributable to noncontrolling interests and redeemable noncontrolling interests


7,285


(334

)


7,099


(8,680

)

Net income (loss) attributable to Altus Power, Inc.

$

7,188


$

(3,011

)


$

5,906


$

6,793


Net income (loss) per share attributable to common stockholders


Basic

$

0.07


$

(0.03

)


$

0.06


$

0.08


Diluted

$

0.06


$

(0.03

)


$

0.06


$

0.07


Weighted average shares used to compute net income (loss) per share attributable to common stockholders


Basic


104,653,303


88,741,089


92,751,839


88,741,089


Diluted


109,155,128


88,741,089


96,603,428


90,858,718


Altus Power, Inc.

CONSOLIDATED BALANCE SHEETS

(In thousands, except share and per share data)


As of December 31,


2021


2020


Assets


Current assets:


Cash

$

325,983


$

33,832


Current portion of restricted cash


2,544


3,465


Accounts receivable, net


9,218


5,752


Other current assets


6,659


1,748


Total current assets


344,404


44,797


Restricted cash, noncurrent portion


1,794


909


Property, plant and equipment, net


745,711


519,394


Intangible assets, net


16,702


11,758


Goodwill


601


Other assets


4,037


4,702


Total assets

$

1,113,249


$

581,560


Liabilities, redeemable noncontrolling interests, and stockholders' equity


Current liabilities:


Accounts payable

$

3,591


$

1,571


Interest payable


4,494


2,665


Purchase price payable


2,638


Current portion of long-term debt


21,143


35,209


Other current liabilities


3,663


1,369


Total current liabilities


32,891


43,452


Redeemable warrant liability


49,933


Alignment shares liability


127,474


Long-term debt, net of unamortized debt issuance costs and current portion


524,837


353,934


Intangible liabilities, net


13,758


4,647


Asset retirement obligations


7,628


4,446


Deferred tax liabilities, net


9,603


11,001


Other long-term liabilities


5,587


6,774


Total liabilities

$

771,711


$

424,254


Commitments and contingent liabilities


Redeemable noncontrolling interests


15,527


18,311


Stockholders' equity


Common stock $0.0001 par value; 988,591,250 shares authorized as of December 31, 2021 and 2020; 153,648,830 and 89,999,976 shares issued and outstanding as of December 31, 2021 and 2020, respectively


15


9


Preferred stock $0.0001 par value; 10,000,000 shares authorized; zero shares issued and outstanding as of December 31, 2021 and 2020


Additional paid-in capital


406,259


205,772


Accumulated deficit


(101,356

)


(80,802

)

Total stockholders' equity

$

304,918


$

124,979


Noncontrolling interests


21,093


14,016


Total equity

$

326,011


$

138,995


Total liabilities, redeemable noncontrolling interests, and stockholders' equity

$

1,113,249


$

581,560


Altus Power, Inc.

CONSOLIDATED STATEMENTS OF CASH FLOWS

(In thousands)


Year ended December 31,


2021


2020


Cash flows from operating activities


Net income (loss)

$

13,005


$

(1,887

)

Adjustments to reconcile net income (loss) to net cash from operating activities:


Depreciation, amortization and accretion


20,967


11,932


Unrealized (gain) loss on interest rate swaps


(324

)


82


Deferred tax expense


219


60


Amortization of debt discount and financing costs


2,873


2,538


Loss on extinguishment of debt


3,245


Change in fair value of redeemable warrant liability


2,332


Change in fair value of alignment shares liability


(5,013

)


Remeasurement of contingent consideration


(2,800

)


Gain on disposal of property, plant and equipment


(12,842

)


Stock-based compensation


148


82


Other


104


780


Changes in assets and liabilities, excluding the effect of acquisitions


Accounts receivable


162


(1,287

)

Due from related parties


3


Other assets


(4,647

)


495


Accounts payable


2,001


(1,477

)

Interest payable


1,909


1,769


Other liabilities


2,365


(794

)

Net cash provided by operating activities


23,704


12,296


Cash flows from investing activities


Capital expenditures


(14,585

)


(36,677

)

Payments to acquire businesses, net of cash and restricted cash acquired


(201,175

)


(110,691

)

Payments to acquire renewable energy facilities from third parties, net of cash and restricted cash acquired


(27,364

)


(23,381

)

Proceeds from disposal of property, plant and equipment


19,910


Payments for customer and site lease acquisitions


(893

)

Other


(36

)


300


Net cash used for investing activities


(223,250

)


(171,342

)

Cash flows from financing activities


Proceeds from issuance of long-term debt


311,053


205,808


Repayments of long-term debt


(160,487

)


(55,754

)

Payment of debt issuance costs


(2,628

)


(1,584

)

Payment of debt extinguishment costs


(1,477

)


Distributions to common equity stockholder


(22,500

)

Proceeds from the Merger and PIPE financing


637,458


Payment of transaction costs related to the Merger


(55,442

)


Proceeds from issuance of common stock and Series A preferred stock


82,000


31,500


Repayment of Series A preferred stock


(290,000

)


Payment of dividends and commitment fees on Series A preferred stock


(22,207

)


(12,950

)

Payment of contingent consideration


(153

)


(501

)

Contributions from noncontrolling interests


3,846


23,927


Redemption of noncontrolling interests


(5,324

)


(1,524

)

Distributions to noncontrolling interests


(4,978

)


(1,307

)

Net cash provided by financing activities


491,661


165,115


Net increase in cash and restricted cash


292,115


6,069


Cash and restricted cash, beginning of year


38,206


32,137


Cash and restricted cash, end of year

$

330,321


$

38,206


Non-GAAP Financial Reconciliation

Reconciliation of GAAP reported Net Income to non-GAAP adjusted EBITDA:


Three Months Ended
December 31,


Year Ended
December 31,


2021


2020


2021


2020


(in thousands)

Reconciliation of Net income (loss) to Adjusted EBITDA:


Net income (loss)

$

14,473


$

(3,345

)


$

13,005


$

(1,887

)

Income tax expense


1,792


964


295


83


Interest expense, net


5,971


3,730


19,933


14,073


Depreciation, amortization and accretion expense


6,800


3,522


20,967


11,932


Non-cash compensation expense


37


21


148


82


Acquisition and entity formation costs


303


575


1,489


1,015


Gain on fair value remeasurement of contingent consideration


(400

)


-


(2,800

)


-


Gain on disposal of property, plant and equipment


(12,842

)


-


(12,842

)


-


Change in fair value of redeemable warrant liability


2,332


-


2,332


-


Change in fair value of alignment shares liability


(5,013

)


-


(5,013

)


-


Loss on extinguishment of debt


-


-


3,245


-


Other (income) expense, net


(593

)


154


245


258


Adjusted EBITDA

$

12,860


$

5,621


$

41,004


$

25,556


Contacts

Altus Power
For Media:
Cory Ziskind
ICR, Inc.
This email address is being protected from spambots. You need JavaScript enabled to view it.

For Investors:
Chris Shelton, Head of IR
Caldwell Bailey, ICR, Inc.
This email address is being protected from spambots. You need JavaScript enabled to view it.

Offshore Source Logo

Offshore Source keeps you updated with relevant information concerning the Offshore Energy Sector.

Any views or opinions represented on this website belong solely to the author and do not represent those of the people, institutions or organizations that Offshore Source or collaborators may or may not have been associated with in a professional or personal capacity, unless explicitly stated.

Corporate Offices

Technology Systems Corporation
8502 SW Kansas Ave
Stuart, FL 34997

info@tscpublishing.com