Business Wire News

AUSTIN, Texas--(BUSINESS WIRE)--Atwell, LLC is pleased to promote Larry Cole to Project Manager in our real estate and land development division. Based in Atwell’s Austin, TX office, Larry will be responsible for managing project coordination and execution, developing project objectives, guiding his team’s deliverables, providing quality control, maintaining project budgets and schedules, and managing and developing client relationships.


With over 30 years of experience in the surveying field, Larry brings tremendous technical and industry leadership to the firm, as well as a diverse project portfolio ranging from residential and commercial developments to transmission lines and wind farms, as well as marine surveying. Prior to Atwell, he worked nearly 10 years as Chief of Crews where he managed survey crews and regularly updated clients for subdivision projects throughout Texas. At Atwell, whether he is performing transmission line surveying for a 256-mile line in West Texas for Oncor or working on wind farms in West Texas for Sun Electric staking location of turbines, Larry’s experience has proved him invaluable to his team and clients through all project types and phases.

“Larry’s management skills and experience on land development projects, along with his expertise in power and energy makes him an excellent leader for our team,” said Atwell Vice President Todd Janssen. “He brings the industry knowledge, expertise, and responsiveness necessary to meet our clients’ needs and help expand our growing professional services.”

Atwell, LLC is a national consulting, engineering, and construction services firm with technical professionals located across the country. Creating innovative solutions for clients in industries such as real estate and land development, power and energy, and oil and gas, Atwell provides comprehensive turnkey services including land and right-of-way support, planning, landscape architecture, engineering, land surveying, environmental compliance and permitting, and project and program management.


Contacts

Timothy Augustine, Senior Vice President
ATWELL, LLC
248.447.2005
This email address is being protected from spambots. You need JavaScript enabled to view it.

HOUSTON--(BUSINESS WIRE)--USD Partners LP (NYSE: USDP) (the “Partnership”) today announced it has entered into an agreement to acquire entities owning the Hardisty South terminal assets (“Hardisty South”) from USD Group LLC (“USDG” or the “Sponsor”), exchange the Sponsor’s economic general partner interest in the Partnership (“GP Interest”) for a non-economic GP Interest and eliminate the Sponsor’s incentive distribution rights (“IDRs”) in the Partnership for total consideration of $75 million in cash and approximately 5.75 million common units (the “Transaction”). The cash portion of the Transaction is expected to be funded with borrowings under the Partnership’s $275 million senior secured credit facility.


Transaction Highlights

  • Increases size, scale and growth capacity of the Partnership’s asset base
  • Expected to provide double-digit accretion to the Partnership’s Distributable Cash Flow per Unit in 2023, improving the potential for Distribution Per Unit growth
  • Supports Management’s focus on delivering sustainable, long-term Distributable Cash Flow to the Partnership’s unitholders by improving contract profile tenor, anchored by a long-term contract with ConocoPhillips
  • Optimizes operational and commercial synergies of Hardisty Terminal and consolidates benefits of blue-chip Diluent Recovery Unit (“DRU”) asset growth at the MLP for the benefit of all Partnership unitholders
  • Elimination of IDRs and economic GP Interest simplifies the Partnership’s financial structure and better aligns the interests of its unitholders with our Sponsor, who will continue to own a substantial number of common units post-transaction

“We are pleased to announce that the Partnership is acquiring Hardisty South from USDG and simplifying its financial structure by eliminating its IDRs and economic GP Interest. As we have previously stated, we are very focused on maintaining our momentum in 2022 as we continue to see opportunities for our DRUbit™ by Rail™ network to provide safer and more economic benefits to our customers,” said Dan Borgen, the Partnership’s Chief Executive Officer. “The acquisition of Hardisty South is expected to provide the Partnership with a growth platform by which it can realize the accretion and additional long-term commitments that our DRUbit™ by Rail™ network is able to provide. Simplifying the Partnership’s structure is critical to our growth strategy, and we look forward to sharing more details about our growth opportunities in the future.”

“We are excited to announce this accretive set of transactions at the Partnership,” said Adam Altsuler, the Partnership’s Chief Financial Officer. “Based on our estimates for future heavy crude oil production in Western Canada and the current availability of egress alternatives, we are expecting double digit accretion to the Partnership’s Distributable Cash Flow starting in 2023, as a result of the Transaction. This estimated accretion is based on an estimated annual Net Cash Provided by Operating Activities and Adjusted EBITDA contribution of between $14 and $18 million in 2023.”

Estimated Closing

  • The Transaction is expected to close during the second quarter of 2022, subject to receipt of required consents
  • Post-closing, USDG will hold a non-economic GP interest in the Partnership and approximately 17.3 million common units, representing approximately 52% of the total outstanding units in the Partnership
  • The Transaction was approved by the Board of Directors of the general partner of the Partnership based on the approval and recommendation of its Conflicts Committee, which consists entirely of independent directors

Advisors

The Conflicts Committee engaged Jefferies LLC as its financial advisor and Sidley Austin LLP as its legal advisor. The Sponsor engaged Tudor, Pickering, Holt & Co. as its financial advisor and Gibson, Dunn & Crutcher LLP as its legal advisor.

About USD Partners LP

USD Partners LP is a fee-based, growth-oriented master limited partnership formed in 2014 by USDG to acquire, develop and operate midstream infrastructure and complementary logistics solutions for crude oil, biofuels and other energy-related products. The Partnership generates substantially all of its operating cash flows from multi-year, take-or-pay contracts with primarily investment grade customers, including major integrated oil companies and refiners. The Partnership’s principal assets include a network of crude oil terminals that facilitate the transportation of heavy crude oil from Western Canada to key demand centers across North America. The Partnership’s operations include railcar loading and unloading, storage and blending in on-site tanks, inbound and outbound pipeline connectivity, truck transloading, as well as other related logistics services. In addition, the Partnership provides customers with leased railcars and fleet services to facilitate the transportation of liquid hydrocarbons and biofuels by rail. For additional information, please visit www.usdp.com.

About USDG

USDG and its affiliates, which own the general partner of USD Partners LP, are engaged in designing, developing, owning, and managing large-scale multi-modal logistics centers and energy-related infrastructure across North America. USDG solutions create flexible market access for customers in significant growth areas and key demand centers, including Western Canada, the U.S. Gulf Coast and Mexico. Among other projects, USDG is currently pursuing the development of a premier energy logistics terminal on the Houston Ship Channel with capacity for substantial tank storage, multiple docks (including barge and deepwater), inbound and outbound pipeline connectivity, as well as a rail terminal with unit train capabilities. For additional information, please visit www.usdg.com. Information on websites referenced in this release is not part of this release.

Adjusted EBITDA

The Partnership defines Adjusted EBITDA as Net Cash Provided by Operating Activities adjusted for changes in working capital items, interest, income taxes, foreign currency transaction gains and losses, and other items which do not affect the underlying cash flows produced by the Partnership’s businesses. Adjusted EBITDA is a non-GAAP, supplemental financial measure used by management and external users of the Partnership’s financial statements, such as investors and commercial banks, to assess:

  • the Partnership’s liquidity and the ability of the Partnership’s businesses to produce sufficient cash flows to make distributions to the Partnership’s unitholders; and
  • the Partnership’s ability to incur and service debt and fund capital expenditures.

The Partnership believes that the presentation of Adjusted EBITDA in this press release provides information that enhances an investor's understanding of the Partnership’s ability to generate cash for payment of distributions and other purposes. The GAAP measure most directly comparable to Adjusted EBITDA is Net Cash Provided by Operating Activities. Adjusted EBITDA should not be considered an alternative to Net Cash Provided by Operating Activities or any other measure of liquidity presented in accordance with GAAP. Adjusted EBITDA exclude some, but not all, items that affect Net Cash Provided by Operating Activities and this measure may vary among other companies. Due to the uncertainty and inherent difficulty of predicting the occurrence and future impact of certain items, which could be significant, the Partnership is unable to provide a quantitative reconciliation of the estimated future Adjusted EBITDA contribution from Hardisty South to Net Cash Provided by Operating Activities.

Distributable Cash Flow

The Partnership defines Distributable Cash Flow, or DCF, as Adjusted EBITDA less net cash paid for interest, income taxes and maintenance capital expenditures. DCF does not reflect changes in working capital balances. DCF is a non-GAAP, supplemental financial measure used by management and by external users of the Partnership’s financial statements, such as investors and commercial banks, to assess:

  • the amount of cash available for making distributions to the Partnership’s unitholders;
  • the excess cash flow being retained for use in enhancing the Partnership’s existing business; and
  • the sustainability of the Partnership’s current distribution rate per unit.

Cautionary Note Regarding Forward-Looking Statements

This press release contains forward-looking statements within the meaning of U.S. federal securities laws, including statements with respect to the timing and benefits of the transaction, future financial results, growth, closing of the transaction, and performance of assets. Words and phrases such as “expect,” “plan,” “intent,” “believes,” “projects,” “begin,” “anticipates,” “able,” “subject to” and similar expressions are used to identify such forward-looking statements. However, the absence of these words does not mean that a statement is not forward-looking. Forward-looking statements relating to the Partnership are based on management’s expectations, estimates and projections about the Partnership, its interests, USD’s projects and the energy industry in general on the date this press release was issued. These statements are not guarantees of future performance and involve certain risks, uncertainties and assumptions that are difficult to predict. Therefore, actual outcomes and results may differ materially from what is expressed or forecast in such forward-looking statements. Factors that could cause actual results or events to differ materially from those described in the forward-looking statements include the impact of the novel coronavirus (COVID-19) pandemic and related economic impact and changes in general economic conditions and commodity prices, as well as those factors set forth under the heading “Risk Factors” and elsewhere in the Partnership’s most recent Annual Report on Form 10-K and in the Partnership’s subsequent filings with the Securities and Exchange Commission (many of which may be amplified by the COVID-19 pandemic and the significant volatility in demand for, and fluctuations in the prices of, crude oil, natural gas and natural gas liquids). The Partnership is under no obligation (and expressly disclaims any such obligation) to update or alter its forward-looking statements, whether as a result of new information, future events or otherwise, except as required by law.


Contacts

Adam Altsuler
Executive Vice President, Chief Financial Officer
(281) 291-3995
This email address is being protected from spambots. You need JavaScript enabled to view it.

Jennifer Waller
Senior Director, Financial Reporting & Investor Relations
(281) 991-8383
This email address is being protected from spambots. You need JavaScript enabled to view it.

This year’s Symposium is a forum to learn from those paving the way for the continued viability of nuclear power through work digitalization

SAN FRANCISCO--(BUSINESS WIRE)--NextAxiom, the creator of technology enabling digitalization of all work performed within an organization, will host the inaugural Dynamic Work Execution Symposium at The Cosmopolitan in Las Vegas from March 31-April 1.


The majority of Symposium participants will be from the nuclear industry, where modernization of plant operations is business critical and application of the significant advancements to maximize the operational efficiencies and reduce costs through technology is driving change. Attendees, spanning Department of Energy researchers to heads of business and IT from some of the country’s largest nuclear operators, will gather to collaborate on how technology is being used to ensure the continued viability of nuclear power through the digitalization of work with computer-guided instructions, forms, and workflows.

Presenters from nuclear organizations will share first-hand experiences on the benefits, business justification, and lessons learned from the implementation of innovative technologies – such as Dynamic Instructions (formerly known as Computer based Procedures) and Integrated Smart Forms – to help guide attendees forward and make work digitalization a reality across the entire industry.

Session topics include:

  • Innovation and Digital Transformation for Sustainable Operations
  • End State and Business Case for Work Digitalization
  • Implementation Experiences: multiple utilities will discuss their Business Cases, Implementation Approaches, Lessons Learned and Next Steps
  • Panel discussion on Approaches, Options and Trade-Offs
  • Transitioning from Paper-Centric to a Digitalized Paradigm
  • The Scope and Components of Dynamic Work Digitalization
  • The Art of the Possible

“Collaboration is strong within the nuclear industry and learning from each other is essential as we collectively work to solve challenges that hold the sector back from its full potential,” said Ash Massoudi, CEO and co-founder of NextAxiom. “We are excited to be able to finally gather again in-person and continue propelling the industry forward so nuclear can expand its role in the clean energy mix as a viable and reliable source of power.”

The intention for this year’s Symposium is to serve as the charter for a Special Interest Group (SIG) focused on Dynamic Work Execution that is managed by the Nuclear Industry Peers themselves. A leading nuclear energy facility operator has already signed on to host the 2023 Dynamic Work Execution Symposium.

To learn more and register for the 2022 Symposium, please visit here soon as space is limited: https://nextaxiom.com/symposium.

About NextAxiom

NextAxiom is a proven leader in nuclear with over a decade of experience enabling operators to increase profitability, streamline operations, and expand the industry’s carbon-free energy contributions. Its flagship software technology, the Dynamic Work Execution Platform (DWEP), transforms nuclear plant paper and legacy processes into digitalized work processes to support improved performance, decrease production costs, and make nuclear power more profitable to produce. With DWEP, nuclear plants realize reduced labor costs and time spent per process, enhanced data, predictive insights, automated and actionable intelligence, and more. To learn more about how NextAxiom makes Digitalized Work a reality and transforms how all work is performed, go to https://nextaxiom.com/.


Contacts

Media:
Katie Conroy
This email address is being protected from spambots. You need JavaScript enabled to view it.

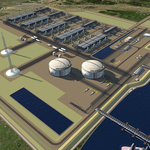
HOUSTON--(BUSINESS WIRE)--$TELL #LNG--Tellurian Inc. (Tellurian) (NYSE American: TELL) announced today that it has issued a limited notice to proceed to Bechtel Energy Inc. (Bechtel) under its executed Engineering, Procurement and Construction (EPC) contract to begin construction of phase one of the Driftwood LNG terminal, a liquefied natural gas (LNG) export facility near Lake Charles, Louisiana.


President and CEO Octávio Simões said, “Energy security is a leading concern in many countries today and the United States must do our part to supply LNG to the global market as quickly as possible. Beginning construction now allows Tellurian to deliver upon our robust schedule for first LNG in 2026 while we complete the project financing. We are well advanced in Driftwood LNG’s detailed engineering and major equipment orders, and we have completed all the owners’ projects required for us to turn the site over to Bechtel.”

Craig Albert, Chief Operating Officer of Bechtel, said, “We are very proud and honored to continue our long partnership with Tellurian on the Driftwood LNG project. It is as apparent as ever that the world needs this reliable source of energy from the USA. And we are excited to now shift our focus to the field to begin construction.”

“We are pleased to continue our longstanding partnership with Tellurian as we deliver cleaner and more affordable energy for communities around the world. We are honored to help bring their vision to a reality by commencing the major field work on a project of this magnitude,” added Paul Marsden, President of Bechtel Energy.

Bechtel’s first activities include demolition, civil site preparation and construction of critical foundations, and Baker Hughes will progress manufacturing two of the natural gas turbines required for phase one of the project.

Driftwood LNG is an approximately 27.6 mtpa liquefaction export facility. Phase one will include two LNG plants with an export capacity of up to 11 million tonnes per annum (mtpa). Driftwood has received all the major permits required for construction and operation, has progressed detailed engineering to approximately 30% complete, and has finalized the purchase and lease of approximately 1,200 acres of real estate ensuring an ideal construction site with ample laydown and deepwater access for shipping.

About Tellurian Inc.

Tellurian intends to create value for shareholders by building a low-cost, global natural gas business, profitably delivering natural gas to customers worldwide. Tellurian is developing a portfolio of natural gas production, LNG marketing and trading, and infrastructure that includes an ~ 27.6 mtpa LNG export facility and an associated pipeline. Tellurian is based in Houston, Texas, and its common stock is listed on the NYSE American under the symbol “TELL”.

For more information, please visit www.tellurianinc.com. Follow us on Twitter at twitter.com/TellurianLNG

About Bechtel

Bechtel is a trusted engineering, construction and project management partner to industry and government. Differentiated by the quality of our people and our relentless drive to deliver the most successful outcomes, we align our capabilities to our customers’ objectives to create a lasting positive impact. Since 1898, we have helped customers complete more than 25,000 projects in 160 countries on all seven continents that have created jobs, grown economies, improved the resiliency of the world's infrastructure, increased access to energy, resources, and vital services, and made the world a safer, cleaner place.

Bechtel serves the Energy; Infrastructure; Nuclear, Security & Environmental; and Mining & Metals markets. Our services span from initial planning and investment, through start-up and operations. www.bechtel.com

CAUTIONARY INFORMATION ABOUT FORWARD-LOOKING STATEMENTS

This press release contains forward-looking statements within the meaning of U.S. federal securities laws. The words “anticipate,” “assume,” “believe,” “budget,” “estimate,” “expect,” “forecast,” “initial,” “intend,” “may,” “plan,” “potential,” “project,” “proposed,” “should,” “will,” “would,” and similar expressions are intended to identify forward-looking statements. Forward-looking statements herein relate to, among other things, the capacity, timing, and other aspects of the Driftwood LNG project, financing and construction activities relating to Driftwood LNG and the timing of delivery of LNG from the Driftwood LNG project. These statements involve a number of known and unknown risks, which may cause actual results to differ materially from expectations expressed or implied in the forward-looking statements. These risks include the matters discussed in Item 1A of Part I of the Annual Report on Form 10-K of Tellurian for the fiscal year ended December 31, 2021 filed by Tellurian with the Securities and Exchange Commission (the SEC) on February 23, 2022, and other Tellurian filings with the SEC, all of which are incorporated by reference herein. The forward-looking statements in this press release speak as of the date of this release. Although Tellurian may from time to time voluntarily update its prior forward-looking statements, it disclaims any commitment to do so except as required by securities laws.


Contacts

Media:
Joi Lecznar
EVP Public and Government Affairs
Phone +1.832.962.4044
This email address is being protected from spambots. You need JavaScript enabled to view it.

Investors:
Matt Phillips
Vice President, Investor Relations
Phone +1.832.320.9331
This email address is being protected from spambots. You need JavaScript enabled to view it.

HOUSTON--(BUSINESS WIRE)--Permianville Royalty Trust (NYSE: PVL) (the “Trust”) today announced that its Annual Report on Form 10-K for the year ended December 31, 2021 was with the SEC on March 25, 2022. The Annual Report on Form 10-K is available in the “SEC Filings” section of the Trust’s website at www.permianvilleroyaltytrust.com, as well as on the SEC’s website at www.sec.gov. Trust unitholders have the ability to request a printed copy of the Annual Report on Form 10-K, which contains the Trust’s audited financial statements, free of charge (via first class mail) by sending a written request to Permianville Royalty Trust, The Bank of New York Mellon Trust Company, N.A., 601 Travis Street, 16th Floor, Houston, TX 77002.


Contacts

Permianville Royalty Trust
The Bank of New York Mellon Trust Company, N.A., as Trustee
Sarah Newell 1 (512) 236-6555

This critical work will focus on improving the efficiency and resiliency of Texas ports, including Port Houston, the largest U.S. port by waterborne tonnage

DALLAS--(BUSINESS WIRE)--AECOM (NYSE: ACM), the world’s trusted infrastructure consulting firm, today announced it has been selected by the Texas Department of Transportation (TxDOT) to provide design and engineering services for its Maritime Division. In this role, AECOM will deliver services required for port, waterway, and intermodal freight planning for the Texas port system, which includes the major deep-draft ports of Port Houston, the largest in the U.S. by waterborne tonnage; Port of Corpus Christi; Port of Beaumont; and Port Freeport, among others.

Texas is a port-driven state and with the recent attention on the global supply chain, there has never been a more critical time than present to ensure its systems remain robust,” said Jennifer Aument, chief executive of AECOM’s global Transportation business. “We are excited to bring our world-class technical teams to these high-value projects that will help enhance port efficiency and resiliency, expand the movement of freight through intermodal systems, and create new jobs – bolstering the state’s standing as an essential trade gateway to the world.”

The scope of AECOM’s work includes project management and planning, economic analysis, environmental and permitting, public involvement, technical report development, geotechnical exploration, and signage and illumination design. This work is a continuation of services AECOM has provided to TxDOT Maritime since 2016 while developing deliverables such as the Port Mission Plan and Investment Strategy, which highlights the funding needs of the Texas port system.

We are honored to have a dynamic history supporting the TxDOT Maritime Division and look forward to strengthening our partnership in this new role,” said Travis Boone, chief executive of AECOM’s U.S. West region. “Texas’ maritime system is a vital part of the state’s transportation network and includes several of the nation’s fastest growing ports by export revenue. We understand the improvement opportunities that will lead to more effective and safer transportation systems and look forward to leveraging our cross-discipline service offering to help deliver these key capital investments.”

Founded in 2012, the TxDOT Maritime Division promotes the development and intermodal connectivity of Texas ports, waterways, and marine infrastructure and operations. The state has eleven deep-draft ports, eight shallow-draft ports, and two recreational ports that are critical to its economic growth.

About AECOM

AECOM (NYSE: ACM) is the world’s trusted infrastructure consulting firm, delivering professional services throughout the project lifecycle – from planning, design and engineering to program and construction management. On projects spanning transportation, buildings, water, new energy, and the environment, our public- and private-sector clients trust us to solve their most complex challenges. Our teams are driven by a common purpose to deliver a better world through our unrivaled technical expertise and innovation, a culture of equity, diversity and inclusion, and a commitment to environmental, social and governance priorities. AECOM is a Fortune 500 firm and its Professional Services business had revenue of $13.3 billion in fiscal year 2021. See how we are delivering sustainable legacies for generations to come at aecom.com and @AECOM.

Forward-Looking Statements

All statements in this communication other than statements of historical fact are “forward-looking statements” for purposes of federal and state securities laws, including any statements of the plans, strategies and objectives for future operations, profitability, strategic value creation, coronavirus impacts, risk profile and investment strategies, and any statements regarding future economic conditions or performance, and the expected financial and operational results of AECOM. Although we believe that the expectations reflected in our forward-looking statements are reasonable, actual results could differ materially from those projected or assumed in any of our forward-looking statements. Important factors that could cause our actual results, performance and achievements, or industry results to differ materially from estimates or projections contained in our forward-looking statements include, but are not limited to, the following: our business is cyclical and vulnerable to economic downturns and client spending reductions; impacts caused by the coronavirus and the related economic instability and market volatility, including the reaction of governments to the coronavirus, including any prolonged period of travel, commercial or other similar restrictions, the delay in commencement, or temporary or permanent halting of construction, infrastructure or other projects, requirements that we remove our employees or personnel from the field for their protection, and delays or reductions in planned initiatives by our governmental or commercial clients or potential clients; losses under fixed-price contracts; limited control over operations run through our joint venture entities; liability for misconduct by our employees or consultants; failure to comply with laws or regulations applicable to our business; maintaining adequate surety and financial capacity; high leverage and potential inability to service our debt and guarantees; ability to continue payment of dividends; exposure to Brexit; exposure to political and economic risks in different countries; currency exchange rate fluctuations; retaining and recruiting key technical and management personnel; legal claims; inadequate insurance coverage; environmental law compliance and adequate nuclear indemnification; unexpected adjustments and cancellations related to our backlog; partners and third parties who may fail to satisfy their legal obligations; AECOM Capital real estate development projects; managing pension cost; cybersecurity issues, IT outages and data privacy; risks associated with the benefits and costs of various dispositions such as the sale of our Management Services, self-perform at-risk civil infrastructure and power construction, and oil & gas maintenance and turnaround businesses, including the risk that purchase price adjustments, if any, from those transactions could be unfavorable and any future proceeds owed to us as part of those transactions could be lower than we expect; as well as other additional risks and factors that could cause actual results to differ materially from our forward-looking statements set forth in our reports filed with the Securities and Exchange Commission. Any forward-looking statements are made as of the date hereof. We do not intend, and undertake no obligation, to update any forward-looking statement.


Contacts

Media::
Brendan Ranson-Walsh
Senior Vice President, Global Communications
1.213.996.2367
This email address is being protected from spambots. You need JavaScript enabled to view it.

Investor::
Will Gabrielski
Senior Vice President, Finance, Treasurer
1.213.593.8208
This email address is being protected from spambots. You need JavaScript enabled to view it.

– Record full year revenue of $21.0 million, increased 131% year-over-year
– Record full year sales of 146 zero-emission vehicles, increased 103% year-over-year
– Record fourth quarter revenue of $4.2 million, increased 13% year-over-year
– Announced GM partnership to strengthen our chassis supply
– Announced today a partnership with Forest River for factory-certified Lightning repower powertrains supporting over 50,000 eligible Forest River Shuttle buses and Vans currently on the road

LOVELAND, Colo.--(BUSINESS WIRE)--Lightning eMotors, Inc. (“Lightning eMotors”, “Lightning”, or the “Company”), a leading provider of zero-emission powertrains and medium-duty and specialty commercial electric vehicles for fleets, today announced consolidated results for the fourth quarter and full year ending December 31, 2021.

“The fourth quarter capped a transformational year for Lightning, as we strengthened the company by announcing new strategic OEM partnerships, increasing our sales pipeline, expanding our factory capacity, shipping new products, and adding strong executives to the leadership team,” said Tim Reeser, CEO of Lightning eMotors. “We believe we have more zero-emission Class 3-6 commercial vehicles on the road than any other US OEM, as we continued to deliver vehicles under our key contracts with Forest River and Collins Bus, among others. We shipped our first Class A double deck motorcoach, which we announced as a new product in the fourth quarter. Recently we announced key partnerships with General Motors, CATL, and Winnebago. Further, we received our first orders for electric ambulances from our agreement with REV Group announced last year. The fact that so many industry-leading commercial vehicle OEMs are choosing to partner with us validates our model and product leadership position, and the repeat customer orders we are seeing from major fleets following initial evaluations speaks to their belief in our staying power.”

Reeser continued, “Actions we took last year to address supply chain challenges around battery supply have mitigated much of the risk we faced in 2021. Chassis supply chain uncertainties that started in the summer of 2021 remain and are a key challenge now in 2022. Our engineering and supply chain teams have again taken strategic actions to help mitigate this risk. We announced the development of our own Lightning eChassis, and we entered into a partnership with General Motors. These actions and partnerships should begin to alleviate chassis-related supply constraints later in 2022 and into 2023. Moreover, our team has directed additional resources toward repower opportunities, leading to the partnership we announced today with Forest River to provide factory-certified Lightning repower powertrains to support over 50,000 eligible Forest River Shuttles buses that are on the road today. We believe we are well positioned to capture many of the commercial vehicle EV repower opportunities that have sprung up with the lack of available new commercial vehicle chassis. Lightning is the only OEM today to offer powertrains to replace ICE and EV powertrains in school buses, shuttle buses, transit buses, and motorcoaches.”

Key Company Highlights

We continue to develop relationships and partnerships with leading vocational vehicle OEMs and suppliers:

Lightning eMotors is a leading zero-emission commercial fleet vehicle and powertrain manufacturer, with over 1.3 million miles of zero-emission commercial vehicle road experience. Lightning provides zero-emission solutions (both Battery Electric and Fuel Cell Electric) for commercial fleets, including Class 3-5 cargo and passenger vehicles, school buses, Class 5-6 work trucks, and Class 7 city buses and motorcoaches. Lightning eMotors’ ongoing focus has been on providing a broad range of premium zero-emission vehicle and powertrain platforms and charging solutions to help fleets reduce emissions, improve energy efficiency, and lower costs.

Fourth Quarter 2021 Financial Results

Fourth quarter revenue was $4.2 million, compared to $3.7 million for the prior-year period, an increase of 13% year-over-year.

Net income was $22.2 million, compared to net loss of $13.4 million during the prior year. The change in net income was primarily due to a $40.0 million gain from the non-cash change in the fair value of the earnout liability. Diluted net earnings per share was $0.28, compared to a loss of $0.42 in the prior-year period.

Adjusted EBITDA was -$15.9 million, compared to -$5.1 million during the same period in the prior year. Adjusted net loss was $20.0 million, compared to $6.9 million during the same period in the prior year. Adjusted EBITDA and adjusted net loss are non-GAAP measures. See explanatory language and reconciliation to the GAAP measures below.

2021 Annual Financial Results

Revenue was $21.0 million in 2021, compared to $9.1 million in 2020, an increase of 131% year-over-year.

Net loss was $100.8 million, compared to net loss of $37.7 million during the prior year. Basic and diluted net loss per share were $1.67, compared to $1.25 in the prior-year period.

Adjusted EBITDA was -$38.8 million, compared to -$13.2 million during the prior year. Adjusted net loss was $53.0 million, compared to $16.5 million in 2020.

We ended the quarter with $168.5 million in cash and cash equivalents on the balance sheet.

The Q4 and full year information reflects our preliminary unaudited results and is based on the information available as of the date of this announcement. The audit may require adjustments which could result in changes to the Company’s unaudited financial results included in this press release.

Order Backlog and Awarded Orders

As of March 14, 2022, the Company had an order backlog—including full vehicles, powertrain systems to be sold directly to customers, and charging systems—of approximately 1,500 units valued at $169.3 million.

The Company’s sales pipeline remains strong at $1.5 billion and is expected to grow further due to strengthening forces driving commercial fleet electrification and a larger sales force. We expect the 2021 Federal Infrastructure Bill funding programs to begin to solidify over the next two quarters, resulting in over $10 billion in new funding for medium and heavy duty commercial electric vehicles, driving customer demand for Lightning products and services.

Guidance

We continue to experience supply chain challenges involving chassis and other key components. Delays associated with any of these components may impact the timing of revenue. Fortunately, our customers remain supportive, and we have not seen any order cancellations due to delivery timing. Based on current business conditions, the Company expects:

  • First quarter revenue to be in the range of $5.0 million to $6.0 million. Approximately $7 million of potential Q1 revenue has been pushed into future quarters due to supply constraints, principally chassis.
  • First quarter vehicle and powertrain sales to be in the range of 65 units to 75 units
  • First quarter adjusted EBITDA to be in the range of -$15 million to -$17 million
  • Quarterly revenue to grow sequentially throughout 2022 as supply chain issues are managed and incremental revenue is realized from non-chassis-dependent products such as repowers and Lightning Energy

Webcast and Conference Call Information

Company management will host a webcast and conference call on March 28, 2022, at 4:30 p.m. Eastern Time, to discuss the Company's financial results.

Interested investors and other parties can listen to a webcast of the live conference call and access the Company’s fourth quarter update presentation by logging onto the Investor Relations section of the Company's website at https://ir.lightningemotors.com/.

The conference call can be accessed live over the phone by dialing 1-877-407-6910 (domestic) or +1-201-689-8731 (international).

About Lightning eMotors

Lightning eMotors has been providing specialized and sustainable fleet solutions since 2009, deploying complete zero emission vehicle solutions for commercial fleets since 2018 – including Class 3 cargo and passenger vans and ambulances, Class 4 and 5 cargo vans and shuttle buses, Class 6 work trucks and school buses, Class 7 city buses, and Class A motorcoaches. The Lightning eMotors’ team designs, engineers, customizes, and manufactures ZEVs to support the wide array of fleet customer needs, with a full suite of control software, telematics, analytics, and charging solutions to simplify the buying and ownership experience and maximize uptime and energy efficiency. To learn more, visit https://lightningemotors.com.

Forward-Looking Statements

This press release contains forward-looking statements within the meaning of U.S. federal securities laws. Such forward-looking statements include, but are not limited to, statements regarding the financial statements of Lightning eMotors (including guidance), its product and customer developments, its expectations, hopes, beliefs, intentions, plans, prospects or strategies regarding the future revenues and expenses, its expectations regarding the availability and timing of components and supplies and the business plans of Lightning eMotors’ management team. Any statements contained herein that are not statements of historical fact may be deemed to be forward-looking statements. In addition, any statements that refer to projections, forecasts or other characterizations of future events or circumstances, including any underlying assumptions, are forward-looking statements. The words “anticipate,” “believe,” “continue,” “could,” “estimate,” “expect,” “intends,” “may,” “might,” “plan,” “possible,” “potential,” “predict,” “project,” “should,” “would” and similar expressions may identify forward-looking statements, but the absence of these words does not mean that a statement is not forward-looking. The forward-looking statements contained in this press release are based on certain assumptions and analyses made by the management of Lightning eMotors considering their respective experience and perception of historical trends, current conditions and expected future developments and their potential effects on Lightning eMotors as well as other factors they believe are appropriate in the circumstances. There can be no assurance that future developments affecting Lightning eMotors will be those anticipated. These forward-looking statements contained in this press release are subject to known and unknown risks, uncertainties, assumptions and other factors that may cause actual results or outcomes to be materially different from any future results or outcomes expressed or implied by the forward-looking statements. These risks, uncertainties, assumptions and other factors include, but are not limited to: (i) those related to our operations and business and financial performance; (ii) our ability to have access to an adequate supply of motors, chassis and other critical components for our vehicles on the timeline we expect (iii) our ability to attract and retain customers; (iv) backlog amounts and sales pipeline that may not result in actual revenue or be indicative of future revenues or sales; (v) our ability to up-sell and cross-sell to customers; (vi) the success of our customers' development programs which will drive future revenues; (vii) our ability to execute on our business strategy; (viii) our ability to compete effectively; (ix) our ability to manage growth, scale up infrastructure and manage increased headcount; (x) the ability of the Company to maintain the New York Stock Exchange’s listing standards, (xi) potential business and supply chain disruptions, including those related to physical security threats, information technology or cyber-attacks, epidemics, pandemics, sanctions, political unrest, war, terrorism or natural disasters; (xii) macroeconomic factors, including current global and regional market conditions, commodity prices, inflation and deflation; (xiii) federal, state, and local laws, regulations and government incentives, particularly those related to the commercial electric vehicle market; (xiv) the volatility in the price of our securities due to a variety of factors, including changes in the competitive industries in which the Company operates, variations in operating performance across competitors, changes in laws and regulations affecting the Company’s business and changes in the capital structure; (xv) planned and potential business or asset acquisitions or combinations; (xvi) the size and growth of the markets in which we operate; (xvii) the mix of products utilized by the Company’s customers and such customers’ needs for these products; (xviii) market acceptance of new product offerings; and (xix) our funding and liquidity plans. Moreover, we operate in a competitive and rapidly changing environment, and new risks may emerge from time to time. You should not put undue reliance on any forward-looking statements. Forward-looking statements should not be read as a guarantee of future performance or results and will not necessarily be accurate indications of the times at, or by, which such performance or results will be achieved, if at all. Should one or more of these risks or uncertainties materialize or should any of the assumptions being made prove incorrect, actual results may vary in material respects from those projected in these forward-looking statements. We undertake no obligation to update or revise any forward-looking statements, whether because of new information, future events or otherwise, except as may be required under applicable securities laws.

Lightning eMotors, Inc.

Consolidated Statements of Operations

(in thousands, except share and per share data)

(Unaudited)


Three Months Ended December 31,


Year Ended December 31,


2021


2020


2021


2020


Revenues


$

4,221


$

3,720


$

20,992


$

9,088


Cost of revenues


6,901


4,874


26,293


11,087


Gross loss


(2,680

)


(1,154

)


(5,301

)


(1,999

)

Operating expenses


Research and development


875


567


3,089


1,309


Selling, general and administrative


13,606


3,478


42,851


10,451


Total operating expenses


14,481


4,045


45,940


11,760


Loss from operations


(17,161

)


(5,199

)


(51,241

)


(13,759

)

Other (income) expense, net


Interest expense


3,833


1,741


13,367


2,983


Inducement expense


Loss from change in fair value of warrant liabilities


704


6,472


28,812


20,835


(Gain) loss from change in fair value of derivative liability


(3,949

)


5,341


(Gain) loss from change in fair value of earnout liability


(39,981

)


4,183


Gain on extinguishment of debt


(2,194

)


Other expense (income), net


46


(31

)


19


76


Total other (income) expense, net


(39,347

)


8,182


49,528


23,894


Net Income (Loss)


$

22,186


$

(13,381

)


$

(100,769

)


$

(37,653

)

Net income (loss) per share basic


$

0.30


$

(0.42

)


$

(1.67

)


$

(1.25

)

Net income (loss) per share diluted


$

0.28


$

(0.42

)


$

(1.67

)


$

(1.25

)

Weighted-average shares outstanding, basic


74,984,051


31,585,159


60,260,156


30,095,634


Weighted-average shares outstanding, diluted


78,311,597


31,585,159


60,260,156


30,095,634


Lightning eMotors, Inc.

Consolidated Balance Sheets

(in thousands, except shares)


December 31,


December 31,


2021


2020


Assets


Current assets


Cash and cash equivalents


$

168,538


$

460


Accounts receivable, net of allowance of $3,349 and $0 as of December 31, 2021 and 2020, respectively


9,172


4,122


Inventories


14,621


5,743


Prepaid expenses and other current assets


7,067


3,999


Total current assets


199,398


14,324


Property and equipment, net


4,891


2,615


Operating lease right-of-use asset, net


8,742


7,881


Other assets


379


45


Total assets


$

213,410


$

24,865


Liabilities and stockholders’ equity (deficit)


Current liabilities


Accounts payable


$

6,021


$

2,599


Accrued expenses and other current liabilities


5,045


2,944


Warrant liability


2,185


21,155


Current portion of long-term debt


7,954


Current portion of long-term debt - related party


6,225


Current portion of operating lease obligation


1,166


1,769


Total current liabilities


14,417


42,646


Long-term debt, net of debt discount


63,768


Long-term debt, net of current portion and debt discount - related party


1,649


Operating lease obligation, net of current portion


9,260


7,265


Derivative liability


17,418


Earnout liability


83,144


Other long-term liabilities


191


Total liabilities


188,198


51,560


Stockholders’ equity (deficit)


Preferred stock, par value $.0001, 1,000,000 shares authorized no shares issued and outstanding as of December 31, 2021 and December 31, 2020


Common stock, par value $.0001, 250,000,000 shares authorized as of December 31, 2021 and December 31, 2020; 75,062,642 and 32,949,507 shares issued and outstanding as of December 31, 2021 and December 31, 2020, respectively


8


3


Additional paid-in capital


206,768


54,097


Accumulated deficit


(181,564

)


(80,795

)

Total stockholders’ equity (deficit)


25,212


(26,695

)

Total liabilities and stockholders’ equity (deficit)


$

213,410


$

24,865


Lightning eMotors, Inc.

Consolidated Statements of Cash Flows

(in thousands, except shares)


Three Months Ended


Year Ended


December 31,


December 31,


2021


2020


2021


2020


Cash flows from operating activities


Net income (loss)


$

22,186


$

(13,381

)


$

(100,769

)


$

(37,653

)

Adjustments to reconcile net loss to net cash used in operating activities:


Depreciation and amortization


269


99


874


362


Provision for doubtful accounts


3,207


3,349


Provision for inventory obsolescence and write-downs


917


261


917


261


Loss on disposal of fixed asset


48


39


Gain on extinguishment of debt


(2,194

)


Change in fair value of warrant liability


704


6,472


28,812


20,835


Change in fair value of earnout liability


(39,981

)


4,183


Change in fair value of derivative liability


(3,949

)


5,341


Stock-based compensation


993


15


2,538


275


Amortization of debt discount


2,072


1,319


6,670


1,789


Non-cash impact of operating lease right-of-use asset


(462

)


459


991


1,254


Issuance of common stock warrants for services performed


433


Other non-cash expenses


1


165


Changes in operating assets and liabilities:


Accounts receivable


(309

)


(77

)


(8,399

)


(3,016

)

Inventories


(4,777

)


(1,064

)


(9,795

)


(2,017

)

Prepaid expenses and other assets


131


(1,426

)


(6,380

)


(1,621

)

Accounts payable


2,285


1,209


3,578


1,442


Accrued expenses and other liabilities


(1,179

)


1,580


4,005


1,698


Net cash used in operating activities


(17,845

)


(4,533

)


(65,807

)


(16,226

)

Cash flows from investing activities


Purchase of property and equipment


(924

)


(712

)


(3,244

)


(2,013

)

Proceeds from disposal of property and equipment


46


55


Net cash used in investing activities


(878

)


(712

)


(3,189

)


(2,013

)

Cash flows from financing activities


Proceeds from convertible notes payable, net of issuance costs paid


300


95,000


9,679


Proceeds from Business combination and PIPE Financing, net of issuance costs paid


142,796


Proceeds from facility borrowings


7,000


1,000


Repayments of facility borrowings


(11,500

)


Proceeds as part of a redemption of convertible notes payable and Series C redeemable convertible preferred stock and warrants


3,000


Proceeds from the exercise of Series C redeemable convertible preferred warrants


3,100


Proceeds from exercise of common warrants


157


Proceeds from issuance of Series C convertible preferred stock and preferred stock warrants


3,225


Proceeds for the exercise of Series C redeemable convertible preferred warrants


500


500


Payments on finance lease obligations


(38

)


(54

)


(88

)

Proceeds from exercise of stock options


23


42


575


86


Net cash provided by financing activities


23


804


237,074


17,402


Net increase in cash


(18,700

)


(4,441

)


168,078


(837

)

Cash - Beginning of year


187,238


460


1,297


Cash - End of period


$

168,538


$

(4,441

)


$

168,538


$

460


Supplemental cash flow information - Cash paid for interest


$

3,686


$

223


$

6,245


$

864


Significant noncash transactions


Earnout liability at inception


$


$


$

78,960


$


Warrant liability at inception


1,253


Derivative liability at inception


17,063


Conversion of short-term convertible notes for common stock


9,679


Conversion of convertible notes for common stock


10,089


Conversion of warrant liabilities for common stock


37,580


Conversion of convertible notes payable into Series C redeemable convertible preferred stock


3,000


Finance lease right-of-use asset in exchange for a lease liability


208


208


Non-GAAP Financial Measures

In addition to our results determined in accordance with GAAP, we believe the following non-GAAP measures are useful in evaluating our operational performance. We use the following non-GAAP financial information among other operational metrics to evaluate our ongoing operations and for internal planning and forecasting purposes. We believe that non-GAAP financial information, when taken collectively, may be helpful to investors in assessing our operating performance.

EBITDA, Adjusted EBITDA and Adjusted Net Loss

EBITDA is defined as net income (loss) before depreciation and amortization and interest expense. Adjusted EBITDA is defined as net income (loss) before depreciation and amortization, interest expense, stock-based compensation, gains or losses related to the change in fair value of warrant, derivative and earnout share liabilities, gains or losses on extinguishment of debt and other non-recurring costs determined by management, such as Business Combination related expenses. Adjusted net loss is defined as net income (loss) adjusted for stock-based compensation expense, gains or losses related to the change in fair value of warrant, derivative and earnout share liabilities, gains or losses on extinguishment of debt and certain other non-recurring costs determined by management, such as Business Combination related expenses.


Contacts

Investor Relations Contact:
Brian Smith
(800) 223-0740
This email address is being protected from spambots. You need JavaScript enabled to view it.

Media Relations Contact:
Nick Bettis
(800) 223-0740
This email address is being protected from spambots. You need JavaScript enabled to view it.


Read full story here

MONTRÉAL--(BUSINESS WIRE)--Nouveau Monde Graphite Inc. (“NMG”, “Nouveau Monde” or the “Company”) (NYSE: NMG, TSXV: NOU) announces the grant of 547,500 stock options to the directors and certain officers of the Company. These stock options are granted in accordance with the terms of the stock option plan of the Company. Each option entitles the holder thereof to purchase one common share of the Company at a price of $8.20 per common share for a period expiring on March 28, 2027.


About Nouveau Monde
Nouveau Monde is striving to become a key contributor to the sustainable energy revolution. The Company is working towards developing a fully integrated source of carbon-neutral battery anode material in Québec, Canada for the growing lithium-ion and fuel cell markets. With low-cost operations and enviable ESG standards, Nouveau Monde aspires to become a strategic supplier to the world’s leading battery and automobile manufacturers, providing high-performing and reliable advanced materials while promoting sustainability and supply chain traceability. www.NMG.com

Cautionary Note Regarding Forward-Looking Information
All statements, other than statements of historical fact, contained in this press release including, but not limited to, the “About Nouveau Monde” paragraph which essentially describe the Company’s outlook and objectives, constitute “forward-looking information” or “forward-looking statements” within the meaning of certain securities laws, and are based on expectations, estimates and projections as of the time of this press release. Forward-looking statements are necessarily based upon a number of estimates and assumptions that, while considered reasonable by the Company as of the time of such statements, are inherently subject to significant business, economic and competitive uncertainties and contingencies. These estimates and assumptions may prove to be incorrect. Moreover, these forward-looking statements were based upon various underlying factors and assumptions, including the current technological trends, the business relationship between the Company and its stakeholders, the ability to operate in a safe and effective manner, the timely delivery and installation of the equipment supporting the production, the Company’s business prospects and opportunities and estimates of the operational performance of the equipment, and are not guarantees of future performance.

Forward-looking information and statements are subject to known or unknown risks and uncertainties that may cause actual results to differ materially from those anticipated or implied in the forward-looking information and statements. Risk factors that could cause actual results or events to differ materially from current expectations include, among others, delays in the scheduled delivery times of the equipment, the ability of the Company to successfully implement its strategic initiatives and whether such strategic initiatives will yield the expected benefits, the availability of financing or financing on favorable terms for the Company, the dependence on commodity prices, the impact of inflation on costs, the risks of obtaining the necessary permits, the operating performance of the Company’s assets and businesses, competitive factors in the graphite mining and production industry, changes in laws and regulations affecting the Company’s businesses, political and social acceptability risk, environmental regulation risk, currency and exchange rate risk, technological developments, the impacts of the global COVID-19 pandemic and the governments’ responses thereto, and general economic conditions, as well as earnings, capital expenditure, cash flow and capital structure risks and general business risks. Unpredictable or unknown factors not discussed in this Cautionary Note could also have material adverse effects on forward-looking statements.

Many of these uncertainties and contingencies can directly or indirectly affect, and could cause, actual results to differ materially from those expressed or implied in any forward-looking statements. There can be no assurance that forward-looking statements will prove to be accurate, as actual results and future events could differ materially from those anticipated in such statements. Forward-looking statements are provided for the purpose of providing information about management’s expectations and plans relating to the future. The Company disclaims any intention or obligation to update or revise any forward-looking statements or to explain any material difference between subsequent actual events and such forward-looking statements, except to the extent required by applicable law.

Neither the TSX Venture Exchange nor its Regulation Services Provider (as that term is defined in the policies of the TSX Venture Exchange) accepts responsibility for the adequacy or accuracy of this release.

Further information regarding the Company is available in the SEDAR database (www.sedar.com), and for United States readers on EDGAR (www.sec.gov), and on the Company’s website at: www.NMG.com.


Contacts

Julie Paquet
VP Communications & ESG Strategy
+1-450-757-8905 #140
This email address is being protected from spambots. You need JavaScript enabled to view it.

HOUSTON--(BUSINESS WIRE)--Murphy Oil Corporation (NYSE: MUR) today announced that drilling has concluded at the Cutthroat-1 exploration well in block SEAL-M-428 in the Sergipe-Alagoas Basin offshore Brazil.


While the presence of hydrocarbons was not found, the partner group will continue to integrate the exploration well data into its regional subsurface interpretation efforts in order to better understand the exploration potential of its deepwater blocks located in the Sergipe-Alagoas Basin.

Cutthroat-1 is located nearly 90 kilometers offshore Brazil and was drilled in 3,094 meters of water by the Seadrill West Saturn drillship. It is one of multiple prospects that the partner group has mapped in the Sergipe-Alagoas Basin.

ExxonMobil is the operator and holds 50% working interest in 9 offshore SEAL blocks that spans over 6,800 square kilometers. Enauta Energia S.A. holds 30% working interest and Murphy Oil Corporation holds 20% working interest in the partnership.

ABOUT MURPHY OIL CORPORATION

As an independent oil and natural gas exploration and production company, Murphy Oil Corporation believes in providing energy that empowers people by doing right always, staying with it and thinking beyond possible. Murphy challenges the norm, taps into its strong legacy and uses its foresight and financial discipline to deliver inspired energy solutions. Murphy sees a future where it is an industry leader who is positively impacting lives for the next 100 years and beyond. Additional information can be found on the company’s website at www.murphyoilcorp.com.

FORWARD-LOOKING STATEMENTS

This news release contains forward-looking statements within the meaning of the Private Securities Litigation Reform Act of 1995. Forward-looking statements are generally identified through the inclusion of words such as “aim”, “anticipate”, “believe”, “drive”, “estimate”, “expect”, “expressed confidence”, “forecast”, “future”, “goal”, “guidance”, “intend”, “may”, “objective”, “outlook”, “plan”, “position”, “potential”, “project”, “seek”, “should”, “strategy”, “target”, “will” or variations of such words and other similar expressions. These statements, which express management’s current views concerning future events or results, are subject to inherent risks and uncertainties. Factors that could cause one or more of these future events or results not to occur as implied by any forward-looking statement include, but are not limited to: macro conditions in the oil and gas industry, including supply/demand levels, actions taken by major oil exporters and the resulting impacts on commodity prices; increased volatility or deterioration in the success rate of our exploration programs or in our ability to maintain production rates and replace reserves; reduced customer demand for our products due to environmental, regulatory, technological or other reasons; adverse foreign exchange movements; political and regulatory instability in the markets where we do business; the impact on our operations or market of health pandemics such as COVID-19 and related government responses; other natural hazards impacting our operations or markets; any other deterioration in our business, markets or prospects; any failure to obtain necessary regulatory approvals; any inability to service or refinance our outstanding debt or to access debt markets at acceptable prices; or adverse developments in the U.S. or global capital markets, credit markets or economies in general. For further discussion of factors that could cause one or more of these future events or results not to occur as implied by any forward-looking statement, see “Risk Factors” in our most recent Annual Report on Form 10-K filed with the U.S. Securities and Exchange Commission (“SEC”) and any subsequent Quarterly Report on Form 10-Q or Current Report on Form 8-K that we file, available from the SEC’s website and from Murphy Oil Corporation’s website at http://ir.murphyoilcorp.com. Murphy Oil Corporation undertakes no duty to publicly update or revise any forward-looking statements.


Contacts

Investor Contacts:
Kelly Whitley, This email address is being protected from spambots. You need JavaScript enabled to view it., 281-675-9107
Megan Larson, This email address is being protected from spambots. You need JavaScript enabled to view it., 281-675-9470

Founder and CEO Scott Mercer to Step Down Following Transition Period

Independent Directors Kathy Savitt and Vince Cubbage Named Co-Chairs of the Board

SAN FRANCISCO--(BUSINESS WIRE)--Volta Inc. (NYSE: VLTA) announced today that Founder Scott Mercer has resigned as Chief Executive Officer. He will continue in that role for a transitional period and will serve as an advisor to the Board through March 31, 2023 and assist the Board in a search for a new CEO.


Scott Mercer is also resigning from the Board, effective immediately. The Board has appointed independent directors Vince Cubbage and Kathy Savitt as the Board’s Co-Chairs, and is committed to keeping the CEO and Board Chair roles separate going forward. Co-Founder and President Chris Wendel has also resigned from the company and the Board, effective immediately. As part of the transition, both Scott Mercer and Chris Wendel are converting their existing Class B share holdings and equity awards to Class A stock.

Scott Mercer, Founder and departing CEO, said, “I am incredibly proud of Volta and what this team has achieved so far, and I am truly excited for its next phase of growth as the industry accelerates and matures. Volta was started with the ambition to be the best business model in the EV charging space, and now the company’s focus needs to turn to scaled, public-market-facing growth.”

Since Volta was founded 12 years ago, it has created an entirely new industry as well as an unparalleled experience for both customers and drivers,” said Vince Cubbage, Co-Chair of the Board. “With Volta’s listing as a public company last August, the Board and Founders mutually determined that now is the right time to identify new leadership with experience in managing public companies to serve the best interests of stakeholders and unlock the company’s full value potential.”

The Board believes firmly that Volta is a great company with strong fundamentals, and is well-positioned to capitalize on the enormous opportunity before it,” said Kathy Savitt, Co-Chair of the Board. “We look forward to a smooth transition as Volta’s talented executive leadership team executes on the company’s strategic plan to build the fueling infrastructure of the future.”

About Volta Charging

Volta Inc. (NYSE: VLTA) is the industry leader in commerce-centric EV charging networks. Volta’s vision is to build charging networks that capitalize on and catalyze the shift from combustion-powered miles to electric miles by placing stations where consumers live, work, shop, and play. By leveraging a data-driven understanding of driver behavior to deliver EV charging solutions that fit seamlessly into drivers’ daily routines, Volta’s goal is to benefit consumers, brands, and real-estate locations while helping to build the infrastructure of the future. As part of Volta’s unique EV charging offering, its stations allow it to enhance its site hosts’ and strategic partners’ core commercial interests, creating a new means for them to benefit from the transformative shift to electric mobility. To learn more, visit www.voltacharging.com.

Forward-Looking Statements

This press release includes forward-looking statements, which are subject to the "safe harbor" provisions of the U.S. Private Securities Litigation Reform Act of 1995. These statements may be identified by words such as "feel,” “believes,” expects,” “estimates,” “projects,” “intends,” “should,” “is to be,” or the negative of such terms, or other comparable terminology and include, among other things, statements regarding Volta’s strategy and other future events that involve risks and uncertainties. Such forward-looking statements are not guarantees of future performance and are subject to risks and uncertainties, which could cause actual results to differ materially from the forward-looking statements contained herein due to many factors, including, but not limited to: intense competition faced by Volta in the EV charging market and in its content activities; the possibility that Volta is not able to build on and develop strong relationships with real estate and retail partners to build out its charging network and content partners to expand its content sales activities; market conditions, including seasonality, that may impact the demand for EVs and EV charging stations or content on Volta’s digital displays; risks, cost overruns and delays associated with construction and installation of Volta’s charging stations; risks associated with any future expansion by Volta into additional international markets; cost increases, delays or new or increased taxation or other restrictions on the availability or cost of electricity; rapid technological change in the EV industry may require Volta to continue to develop new products and product innovations, which it may not be able to do successfully or without significant cost; the risk that Volta’s shift to including a pay-for-use charging business model and the requirement of mobile check-ins adversely impacts Volta’s ability to retain driver interest, content partners and site hosts; the EV market may not continue to grow as expected; and the ability to protect its intellectual property rights; and those factors discussed in Volta’s Registration Statement on Form S-1, under the heading “Risk Factors,” filed with the Securities and Exchange Commission (the “SEC”), as supplemented by Quarterly Reports on Form 10-Q, and other reports and documents Volta files from time to time with the SEC. Any forward-looking statements speak only as of the date on which they are made, and Volta undertakes no obligation to update any forward-looking statement to reflect events or circumstances after the date of this press release.


Contacts

Media / Press:
Jette Speights
This email address is being protected from spambots. You need JavaScript enabled to view it.

Investor / Analyst:
Katherine Bailon
This email address is being protected from spambots. You need JavaScript enabled to view it.

 Company raises $32 million in private placement
Trading under “PEGY” on the Nasdaq Capital Market to begin March 29, 2022

MINNETONKA, Minn.--(BUSINESS WIRE)--Communications Systems, Inc. (Nasdaq: JCS) (the “Company” or “Pineapple Energy”) today announced the closing of its merger with Pineapple Energy LLC. In connection with the closing, the Company changed its name to “Pineapple Holdings, Inc.” on March 28, 2022 and its common stock is expected to trade on the Nasdaq Capital Market under the new symbol “PEGY” on Tuesday, March 29, 2022.


Immediately prior to the merger, Pineapple Energy completed its acquisition of two Hawaiian solar companies, Hawaii Energy Connection, LLC and E-Gear, LLC. Following the merger, Pineapple Energy operates a portfolio of brands including Hawaii Energy Connection, E-Gear, Sungevity, and Horizon Solar Power that provide homeowners with an end-to-end product offering spanning solar, battery storage, and grid services.

Immediately following the completion of the merger, the Company completed its previously announced private placement of Series A preferred stock and warrants to institutional investors resulting in gross proceeds to the Company of $32.0 million.

Roger Lacey, Chair of the Board, commented, “We are thrilled to have completed this merger and we extend a warm welcome to our new board members, Marilyn Adler, Tom Holland, Scott Honour, and Kyle Udseth. As we move forward, we have confidence that Pineapple Energy will capitalize on the compelling financial and environmental benefits of residential solar, as well as the strong drive among homeowners and small businesses to increase their energy independence and transition away from fossil fuels.”

Kyle Udseth, who was appointed as Chief Executive Officer of the Company in connection with the merger, commented, “With the closing completed, we are excited to get to work building the nation’s leading residential energy management company. We believe that Pineapple Energy is well positioned as a platform for our national consolidation strategy and there are attractive acquisition opportunities among leading independent solar, storage and energy management companies. The merger and financing provide Pineapple Energy with enhanced resources to pursue its growth and acquisition strategy.”

Scott Honour, Managing Partner of Northern Pacific Group, which through its investment funds was Pineapple Energy LLC’s largest shareholder, added, “We believe U.S. Energy policy is undergoing a sea change before our eyes. Pineapple Energy has the talent and experience to take advantage of these trends to create a nationwide trusted energy partner to households and small businesses. As a member of the Pineapple Energy board, I look forward to leveraging our collective dealmaking and industry expertise to support the Pineapple Energy M&A strategy.”

As previously announced, Company shareholders of record as of the close of business on Friday, March 25, 2022 will receive one contractual non-transferable Contingent Value Right (CVR) per share of Company common stock held, which will entitle the CVR holder to a portion of the proceeds of dispositions of the Company’s pre-merger assets after the effective time of the merger. No ex-dividend date is applicable to the CVRs because they are non-transferrable. The CVRs are issued only in book entry.

Immediately prior to the merger, the Company had 2,429,341 shares of common stock outstanding. Immediately following the merger, the Company had 7,435,586 shares of common stock outstanding. Accordingly, the pre-merger Company shareholders own approximately 32.7% of the Company’s common stock outstanding immediately following the effective time of the merger and the pre-merger Pineapple Energy LLC unit holders own approximately 67.3% of the Company’s common stock outstanding immediately following the effective time of the merger.

On a fully-diluted basis taking into account the closing of the merger and the private placement, the pre-merger Company shareholders own approximately 20.0% of the Company’s stock, the pre-merger Pineapple Energy LLC unit holders own approximately 41.2% of the Company’s stock, and the private placement investors own approximately 38.8% of the Company’s stock.

About Pineapple Holdings, Inc.

Pineapple Holdings, Inc., which does business as Pineapple Energy (f/k/a Communications Systems, Inc.) (Nasdaq: PEGY), is focused on growing leading local and regional solar, storage, and energy services companies nationwide. Our vision is to power the energy transition through grass-roots growth of solar electricity paired with battery storage. Our portfolio of brands, Hawaii Energy Connection, E-Gear, Sungevity and Horizon Solar Power, provide homeowners and small businesses with an end-to-end product offering spanning solar, battery storage, and grid services.

Forward Looking Statements

This press release includes certain forward-looking statements within the meaning of the Private Securities Litigation Reform Act of 1995, including statements regarding future financial performance, future growth, and future acquisitions. These statements are based on Pineapple Energy’s current expectations or beliefs and are subject to uncertainty and changes in circumstances. Actual results may vary materially from those expressed or implied by the statements here due to changes in economic, business, competitive or regulatory factors, and other risks and uncertainties, including those described in “Risks Related to the Combined Company Following Consummation of the Merger” in Item 1A of the Company’s Form 10-K for the fiscal year ended December 31, 2021 filed with the Securities and Exchange Commission on March 14, 2022 and other factors set forth in the company’s filings with the Securities and Exchange Commission. The forward-looking statements in this press release speak only as of the date of this press release. Pineapple Energy does not undertake any obligation to update or revise these forward-looking statements for any reason, except as required by law.


Contacts

 For Pineapple Holdings, Inc.

Kyle Udseth
Chief Executive Officer
+1 (952) 582-6460
This email address is being protected from spambots. You need JavaScript enabled to view it.

Mark D. Fandrich
Chief Financial Officer
+1 (952) 582-6416
This email address is being protected from spambots. You need JavaScript enabled to view it.

The Equity Group Inc.
Lena Cati
Senior Vice President
+1 (212) 836-9611
This email address is being protected from spambots. You need JavaScript enabled to view it.

  • Q4 revenue up 714% versus prior year to $2.9 million, on increased customer demand for fuel cell components, and, fuel cell systems from UltraCell (now Advent LLC), SerEnergy (now Advent Technologies A/S), SerEnergy Philippines, Inc. (now Advent Green Energy Philippines, Inc.), and fischer eco solutions (now Advent Technologies GmbH). The Company also collected $3.0 million from SerEnergy customers during Q4 related to pre-acquisition revenue. 
  • Full year 2021 revenue of $7.1 million; on a pro forma basis as if SerEnergy and fischer eco solutions had been acquired at the beginning of the year, 2021 revenue would have been $16.0 million.
  • Net loss in Q4 of $(9.0) million or $(0.18) per share.
  • Company holds cash reserves of $79.8 million as of December 31, 2021.

BOSTON--(BUSINESS WIRE)--Advent Technologies Holdings, Inc. (NASDAQ: ADN) (“Advent” or the “Company”), an innovation-driven leader in the fuel cell and hydrogen technology space, today announced consolidated financial results for the three months ended December 31, 2021. All amounts are in U.S. dollars unless otherwise noted and have been prepared in accordance with U.S. generally accepted accounting principles (“GAAP”).


Q4 2021 Financial Highlights

(all comparisons are to Q4 2020, unless otherwise stated)

  • Revenue of $2.9 million, a 714% year-over-year increase, the result of increased customer demand for Advent’s products across the board and through the acquisitions of UltraCell, SerEnergy, SerEnergy Philippines, Inc. and fischer eco solutions.
  • Operating expenses of $16.3 million, a year-over-year increase of $14.4 million, primarily due to costs related to the accelerated growth of the Company from the acquired businesses; increased staffing and costs to operate as a public company; higher R&D costs; and incentive and stock-based compensation expenses.
  • Net loss was $(9.0) million, and adjusted net loss was $(15.9) million. Adjusted net loss excludes a $6.9 million gain from the change in the fair value of outstanding warrants.
  • Net loss per share was $(0.18).
  • Cash reserves were $79.8 million as of December 31, 2021, a decrease of $12.7 million from September 30, 2021, driven by the increased level of R&D and administrative and selling expenses.

This solid revenue growth versus the prior year authenticates our business model, while the consolidation of the operations of UltraCell, SerEnergy, SerEnergy Philippines and fischer eco solutions has accelerated our growth and focus across the value chain from fuel cell components to fuel cell systems,” said Dr. Vasilis Gregoriou, Chairman and CEO of Advent Technologies. “We are seeing strong demand for our products across the portable and stationary off-grid power markets and remain confident that we are on a firm path for growth as we deliver efficient solutions for clean energy and decarbonization to a variety of end markets. Our product pipeline is increasing month on month, and this will be reflected in future sales as we convert this pipeline to final supply contracts.”

Q4 2021 Financial Summary

(in Millions of US dollars, except per share data)

Three Months Ended December 31,


2021


2020

$ Change


Revenue, net

$

2.90

$

0.36

$

2.55

Gross Profit

$

0.16

$

0.22

$

(0.06)

Gross Margin (%)


5%


61%


Operating Income/(Loss)

$

(16.66)

$

(1.66)

$

(15.00)

Net Income/(Loss)

$

(9.01)

$

(1.70)

$

(7.30)

Net Income/(Loss) Per Share

$

(0.18)

$

(0.07)

$

(0.11)


Non-GAAP Financial Measures

Adjusted EBITDA – Excl Warrant Adjustment

$

(15.57)

$

(1.65)

$

(13.92)

Adjusted Net Income/(Loss) - Excl Warrant Adjustment

$

(15.91)

$

(1.70)

$

(14.21)


Cash and Cash Equivalents

$

79.8

For a more detailed discussion of Advent’s fourth quarter 2021 results, please see the Company’s financial statements and management’s discussion & analysis, which are available at ir.advent.energy.

The financial results include non-GAAP financial measures. These non-GAAP measures are more fully described and are reconciled from the respective measures determined under GAAP in “Presentation of Non-GAAP Financial Measures” and the attached appendix tables.

Q4 2021 Business Updates:

Rapid Integration of SerEnergy: On October 7, 2021, Advent announced that a new order was placed in September 2021 for Advent’s “SereneU” 5kW fuel cells to roll-out in the Asian market. The new fuel cell stacks and reformers are intended to support internal testing set-ups to evaluate performance and to showcase results with Thai telecom operators. Advent Technologies A/S has been a partner of Thailand-based Alright Combination Centric Co., Ltd. (“ALCC”) since 2017. ALCC is a product distributor and service provider to Thailand’s ICT industry. Advent’s 5kW fuel cell will address the multi-million USD telecom sector in Thailand as well as support ALCC’s government projects for microgrids on remote islands and for back-up at the Marine Security Center of the Royal Thai Navy. Advent SereneU fuel cells are 4th generation fuel cells, which provide customers a lifetime extension to minimize maintenance and leverage profitability. This new generation introduces advantages, including longer lifetime, less service and maintenance fees, and improved total cost of ownership. The product upgrade places Advent fuel cells in a pivotal position to respond to an increasing global demand for sustainable energy. Additional benefits of SereneU include an increase in overall lifetime by more than 30% from the 3rd generation fuel cells; embedded unit swap technology that secures zero or short downtime during power failures; and, a wider temperature operation from -20°C to 50°C, reinforcing climate resilience.

Smart Communications Inc.: In October 2021, Advent announced that with its partner, Smart Communications Inc. (”Smart”), the Company successfully completed the first installation of its HG 5000 fuel cell systems across the Philippines. The delivery agreement was made earlier in 2021 between Smart in the Philippines and Advent Technologies A/S in Denmark. Smart’s partnership with Advent follows its commitment to the United Nations Race to Zero Campaign with the GSM Association, as a member of the trade alliance’s Climate Action Task Force. The movement of the global industry of mobile network operators highlights its broad-based commitment to zero emissions from all stakeholders. Race to Zero is a global campaign that aims to mobilize leadership and support from businesses, cities, regions, and investors for net zero carbon emissions by 2050. As the wireless arm of the Philippines’ largest fully integrated telecommunications company, PLDT Inc., Smart’s shift to green energy follows the announcement of the Philippines Department of Energy in Q4 2020 that the government will no longer accept proposals to build new coal power plants, from the new Energy Conservation and Efficiency Act signed into law in 2019. These significant policy shifts support the deployment of cleaner energy sources to help ensure more sustainable growth for the country.

Advent and BASF New Business GmbH (“BASF”) signed a Memorandum of Understanding (“MoU”): On December 13, 2021, it was announced that the MoU aims to develop and increase the manufacturing scale of advanced fuel cell membranes designed for long-term operations under extreme conditions. BASF intends to improve the long-term stability of its Celtec® membrane and to increase production capacity with advanced technical capabilities to enable further improved and competitive Advent fuel cell systems and membrane electrode assembly (“MEA”). Under the agreement the two companies will explore the implementation of high-volume manufacturing for the Celtec® membranes, utilize Advent’s fuel cell stack and system testing facilities to assess and qualify the new Celtec® membrane for the SereneU (telecom power), M-ZERØ (methane emissions reduction), and Honey Badger (portable power, defense) Advent product families. Furthermore, BASF supports the realization of large-scale Important Projects of Common European Interests (“IPCEIs”) White Dragon and Green HiPo (pending EU approval), through materials for power generation, hydrogen generation, and power storage. The goal of the two projects as submitted by Advent and the White Dragon consortium of companies is to replace Greece’s largest coal-fired power plants with renewable solar energy parks, which will be supported by CO2-free hydrogen production (4.65GW), and fuel cell heat and power production (400MW). In addition, BASF will also evaluate the producibility of the ion-pair membrane developed in collaboration by Advent and the U.S. Department of Energy. Advent has substantial experience in the development of high-temperature PEM fuel cell systems namely for stationary and portable applications as well as critical components such as MEAs and Gas Diffusion Electrodes (“GDEs”). Advent is working to increase the performance and scope of its products to satisfy the requirements of its customers and to address new applications. BASF has substantial experience in the manufacturing and development of proton-conducting membranes, GDEs, HT-PEM MEAs and the pertinent chemicals, catalysts, and compositions for their application in hydrogen separation and fuel cells. BASF is constantly improving the quality, robustness and performance of its products to support growth in fuel cell systems applications.

Advent Fuel Cell for the Maritime Sector: On December 20, 2021, Advent announced that its fuel cell unit for the Maritime Sector, developed within the framework of the RiverCell Consortium, had passed safety testing, as well as a safety assessment completed by DNV, one of the world’s leading classification societies. RiverCell, a demonstration project supported by a consortium of partners, was initiated in 2015. Funded by Germany’s Federal Ministry for Digital and Transport and led by Meyer Werft, it consists of a range of experienced partners throughout the maritime sector, including DNV, HADAG, Helm Proman Methanol, Neptun Werft, Pella Sietas, Technische Universität Berlin, Viking River Technical Cruises, and Advent. The project is dedicated to the design and development of a fuel cell hybrid system for inland vessels, and its realization has provided valuable insights in terms of the suitability, practical use, and economic efficiency of hybrid powertrains. In addition to cutting greenhouse gas emissions, the hybrid concept – featuring energy storage combined with sustainable fuel cell-powered energy production – demonstrated an increase to both safety and efficiency in shipping. As part of the demonstration, a section of a river cruise vessel was set up on dryland at Neptun Werft, in Rostock, Germany. There, the prototype of Advent’s SereneU marine fuel cell unit was successfully integrated into a modern hybrid DC electric energy grid, which was equipped with all relevant ship systems, including battery storage as well as a conventional diesel genset. With current regulations still based on the traditional use of diesel-powered energy sources, another core objective of the demonstrations has been to encourage the development of new global regulatory frameworks for the shipping sector, thus paving the way for future use of sustainable technologies.

Dr. Gregoriou concluded, “We continue to build on the strength of our business with a focus to expand and to grow strategic initiatives. In 2022, we will further consolidate the acquired businesses to maximize efficiency and effectiveness throughout our global operations. The White Dragon and Green HiPo projects are progressing and we believe that, if approved, they will have a significant impact on the implementation of green energy in southeastern Europe, thus shifting the reliability away from the sources of traditional fuels. The acquisitions we completed during 2021 have expanded our growing revenue base in full fuel cell stacks and systems and position Advent with the expertise to be a leader in clean energy production. I am confident in the potential for Advent and our technologies, and very optimistic that we will continue to increase market share as the world moves towards clean energy and decarbonization.”

Conference Call

The Company will host a conference call on Monday, March 28, 2022, at 9:00 AM ET to discuss its results.

To access the call please dial (844) 200-6205 from the United States, or (929) 526-1599 from outside the U.S. The conference call I.D. number is 442422. Participants should dial in 5 to 10 minutes before the scheduled time.

A replay of the call can also be accessed via phone through April 11, 2022, by dialing (866) 813-9403 from the U.S., or (204) 525-0658 from outside the U.S. The conference I.D. number is 661424.

About Advent Technologies Holdings, Inc.

Advent Technologies Holdings, Inc. is a U.S. corporation that develops, manufactures, and assembles complete fuel cell systems, and the critical components for fuel cells in the renewable energy sector. Advent is headquartered in Boston, Massachusetts, with offices in California, Greece, Denmark, Germany, and the Philippines. With more than 100 patents issued for its fuel cell technology, Advent holds the IP for next-generation HT-PEM that enable various fuels to function at high temperatures and under extreme conditions – offering a flexible “Any Fuel. Anywhere.” option for the automotive, aviation, defense, oil and gas, marine, and power generation sectors. For more information, please visit www.advent.energy.

Cautionary Note Regarding Forward-Looking Statements

This press release includes forward-looking statements. These forward-looking statements generally can be identified by the use of words such as “anticipate,” “expect,” “plan,” “could,” “may,” “will,” “believe,” “estimate,” “forecast,” “goal,” “project,” and other words of similar meaning. Each forward-looking statement contained in this press release is subject to risks and uncertainties that could cause actual results to differ materially from those expressed or implied by such statement. Applicable risks and uncertainties include, among others, the Company’s ability to realize the benefits from the business combination; the Company’s ability to maintain the listing of the Company’s common stock on Nasdaq; future financial performance; public securities’ potential liquidity and trading; impact from the outcome of any known and unknown litigation; ability to forecast and maintain an adequate rate of revenue growth and appropriately plan its expenses; expectations regarding future expenditures; future mix of revenue and effect on gross margins; attraction and retention of qualified directors, officers, employees and key personnel; ability to compete effectively in a competitive industry; ability to protect and enhance our corporate reputation and brand; expectations concerning our relationships and actions with our technology partners and other third parties; impact from future regulatory, judicial and legislative changes to the industry; ability to locate and acquire complementary technologies or services and integrate those into the Company’s business; future arrangements with, or investments in, other entities or associations; and intense competition and competitive pressure from other companies worldwide in the industries in which the Company will operate; and the risks identified under the heading “Risk Factors” in our Annual Report on Form 10-K/A filed with the Securities and Exchange Commission on May 20, 2021, as well as the other information we file with the SEC. We caution investors not to place considerable reliance on the forward-looking statements contained in this press release. You are encouraged to read our filings with the SEC, available at www.sec.gov, for a discussion of these and other risks and uncertainties. The forward-looking statements in this press release speak only as of the date of this document, and we undertake no obligation to update or revise any of these statements. Our business is subject to substantial risks and uncertainties, including those referenced above. Investors, potential investors, and others should give careful consideration to these risks and uncertainties.

Presentation of Non-GAAP Financial Measures

In addition to the results provided in accordance with U.S. GAAP throughout this press release, the Company has provided non-GAAP financial measures— Adjusted Net Income /(Loss) and Adjusted EBITDA —which present results on a basis adjusted for certain items. The Company uses these non-GAAP financial measures for business planning purposes and in measuring its performance relative to that of its competitors. The Company believes that these non-GAAP financial measures are useful financial metrics to assess its operating performance from period-to-period by excluding certain items that the Company believes are not representative of its core business. These non-GAAP financial measures are not intended to replace, and should not be considered superior to, the presentation of the Company’s financial results in accordance with GAAP. The use of the terms Adjusted Net Income / (Loss) and Adjusted EBITDA may differ from similar measures reported by other companies and may not be comparable to other similarly titled measures. These measures are reconciled from the respective measures under GAAP in the appendix below.

ADVENT TECHNOLOGIES HOLDINGS, INC.

CONSOLIDATED BALANCE SHEETS


As of

ASSETS


December 31,
2021

(Unaudited)


December 31,
2020

Current assets:


Cash and cash equivalents


$

79,764,430


$

515,734

Accounts receivable, net


3,138,603

421,059

Due from related parties


-


67,781

Contract assets


1,617,231

85,930

Inventories


6,957,776


107,939

Prepaid expenses and Other current assets


5,872,758

496,745

Total current assets


97,350,798


1,695,188

Non-current assets:


Goodwill


30,030,498


-

Intangibles, net


23,343,586

-

Property, plant and equipment, net


8,584,988


198,737

Other non-current assets


2,475,346

136

Deferred tax assets


1,245,539


-

Total non-current assets


65,679,957


198,873

Total assets


$

163,030,755


$

1,894,061

LIABILITIES AND STOCKHOLDERS’ EQUITY/(DEFICIT)


Current liabilities:


Trade payables


$

4,837,369

$

881,394

Due to related parties


-


1,114,659

Deferred income from grants, current


205,212

158,819

Contract liabilities


1,118,130


167,761

Other current liabilities


12,513,770

904,379

Income tax payable


195,599


201,780

Total current liabilities


18,870,080


3,428,792

Non-current liabilities:


Warrant liability


10,373,264

-

Deferred tax liabilities


2,499,920


-

Defined benefit obligation


90,066

33,676

Deferred income from grants, non-current


-


182,273

Other long-term liabilities


995,634

42,793

Total non-current liabilities


13,958,884


258,742

Total liabilities


32,828,964


3,687,534

Commitments and contingent liabilities


Stockholders’ equity / (deficit)


Common stock ($0.0001 par value per share; Shares authorized: 110,000,000 at December 31, 2021 and December 31, 2020; Issued and outstanding: 51,253,591 and 25,033,398 at December 31, and December 31, 2020, respectively)


5,125


2,503

Preferred stock ($0.0001 par value per share; Shares authorized: 1,000,000 at December 31, 2021 and December 31, 2020; nil issued and outstanding at December 31, 2021 and December 31, 2020


-

-

Additional paid-in capital


164,894,039


10,993,762

Accumulated other comprehensive (loss) / income


(1,291,037)

93,256

Accumulated deficit


(33,406,336)


(12,882,994)

Total stockholders’ equity / (deficit)


130,201,791


(1,793,473)

Total liabilities and stockholders’ equity


$

163,030,755


$

1,894,061

ADVENT TECHNOLOGIES HOLDINGS, INC.

CONSOLIDATED STATEMENTS OF OPERATIONS

(All amounts in USD, except for number of shares)


Three months ended December 31,


Years Ended December 31,

(Unaudited)


(Unaudited)


2021


2020


2021


2020

Revenue

$

2,902,088


$

356,620


$

7,068,842


$

882,652

Cost of revenue

(2,743,740)

(139,759)

(5,406,216)

(514,189)

Gross profit


158,348


216,861


1,662,626


368,463

Income from grants

197,420

47,646

829,207

206,828

Research and development expenses


(1,979,491)


(21,265)


(3,540,540)


(102,538)

Administrative and selling expenses

(14,318,499)

(1,907,179)

(41,876,741)

(3,548,242)

Amortization of intangible assets


(717,383)


-


(1,184,830)


-

Operating loss


(16,659,605)


(1,663,937)


(44,110,278)


(3,075,489)

Fair value change of warrant liability


6,909,723


-


22,743,057


-

Finance income / (expenses), net

(24,600)

(793)

(51,561)

(5,542)

Foreign exchange losses, net


(40,567)


511


(42,708)


(26,073)

Other expenses, net

(62,508)

(40,544)

15,638

(15,696)

Loss before income tax


(9,877,557)


(1,704,763)


(21,445,852)


(3,122,800)

Income tax

871,575

-

922,510

-

Net loss

$

(9,005,982)


$

(1,704,763)


$

(20,523,342)


$

(3,122,800)

Net loss per share

Basic loss per share

$

(0.18)


$

(0.07)


$

(0.45)


$

(0.15)

Basic weighted average number of shares

51,253,591

25,033,398

45,814,868

20,518,894

Diluted loss per share

$

(0.18)


$

(0.07)


$

(0.45)


$

(0.15)

Diluted weighted average number of shares

51,253,591

25,033,398

45,814,868

20,518,894

ADVENT TECHNOLOGIES HOLDINGS, INC.

CONSOLIDATED STATEMENTS OF CASH FLOWS


Years Ended December 31,

(Unaudited)

2021

2020

Net Cash used in Operating Activities


$

(35,837,000)


$

(1,425,068)


Cash Flows from Investing Activities:


Proceeds from sale of property and equipment

6,970

-

Purchases of property and equipment


(3,920,470)


(122,508)

Purchases of intangible assets

(17,747)

-

Advances for the acquisition of property and equipment


(2,200,158)


-

Acquisition of subsidiaries, net of cash acquired

(19,425,378)

-

Net Cash used in Investing Activities


$

(25,556,783)


$

(122,508)


Cash Flows from Financing Activities:


Business Combination and PIPE financing, net of issuance costs paid

141,120,851

-

Proceeds of issuance of preferred stock


-


1,430,005

Proceeds from issuance of non-vested stock awards

-

21,756

Repurchase of shares


-


(69,431)

Proceeds of issuance of common stock and paid-in capital from warrants exercise

262,177

-

State loan proceeds


118,274


-

Repayment of convertible promissory notes

-

(500,000)

Net Cash provided by Financing Activities


$

141,501,302


$

882,330


Net increase / (decrease) in cash and cash equivalents


$

80,107,519


$

(665,246)

Effect of exchange rate changes on cash and cash equivalents

(858,823)

(18,035)

Cash and cash equivalents at the beginning of year


515,734


1,199,015

Cash and cash equivalents at the end of year

$

79,764,430

$

515,734

Supplemental Non-GAAP Measures and Reconciliations

In addition to providing measures prepared in accordance with GAAP, we present certain supplemental non-GAAP measures. These measures are EBITDA, Adjusted EBITDA and Adjusted Net Income / (Loss), which we use to evaluate our operating performance, for business planning purposes and to measure our performance relative to that of our peers. These non-GAAP measures do not have any standardized meaning prescribed by GAAP and therefore may differ from similar measures presented by other companies and may not be comparable to other similarly titled measures. We believe these measures are useful in evaluating the operating performance of the Company’s ongoing business. These measures should be considered in addition to, and not as a substitute for net income, operating expense and income, cash flows and other measures of financial performance and liquidity reported in accordance with GAAP.


Contacts

Advent Technologies Holdings, Inc.

Naiem Hussain
This email address is being protected from spambots. You need JavaScript enabled to view it.

Chris Kaskavelis
This email address is being protected from spambots. You need JavaScript enabled to view it.


Read full story here

PASADENA, Calif.--(BUSINESS WIRE)--$HLGN #ArtificialIntelligence--Heliogen, Inc. (“Heliogen” or the “Company”) (NYSE: HLGN), a leading provider of AI-enabled concentrated solar energy, today announced full year 2021 financial and operational results.


Full-Year 2021 Highlights

  • Finalized $39 million U.S. Department of Energy award for deployment of AI-enabled concentrated solar technology
  • Completed first field test of autonomous robots designed to reduce installation and maintenance costs
  • Announced start of equipment procurement for first commercial-scale facility collaboration with Woodside Energy to deploy Heliogen’s power technology
  • Held successful demonstration of green hydrogen production using the Company’s core concentrated solar technology in partnership with Bloom Energy
  • Closed business combination with Athena Technology Acquisition Corp. (“Athena”); began trading on the NYSE on December 31, 2021

Recent Highlights

  • Began site preparation and setup for first full-scale manufacturing facility in Long Beach, California
  • Awarded exclusive lease rights to Brenda Solar Energy Zone by the U.S. Bureau of Land Management for the purposes of green hydrogen production

Executive Commentary

“Our mission is bold but simple,” said Bill Gross, Founder and Chief Executive Officer of Heliogen. “We aim to decarbonize heavy industry, using artificial intelligence, scalable, repeatable manufacturing techniques, and the power of the sun. Our patented closed-loop tracking system for our mirrors will allow us to generate temperatures up to 1,000 degrees Celsius, and efficiently store that heat to create industrial process steam, power and green hydrogen – without the intermittency problems of other renewable energy sources.”

Heliogen Progress in 2021 Continues into 2022

During 2021, Heliogen launched negotiations regarding deployment of its AI-enabled solar energy systems, and began engineering work on one of its first commercial scale facilities. The Company also continued to develop its infrastructure and set the foundation for its commercial-scale operations, to support its prospective project pipeline.

“The past year has been transformational in many ways for Heliogen,” said Mr. Gross. “We debuted on the New York Stock Exchange at the end of the year and, on the commercial side our company announced commercial relationships with Rio Tinto and Woodside Energy, two of the world’s largest resources firms, and partnered with Bloom Energy for the successful demonstration scale production of green hydrogen. We also finalized a cooperative agreement with the Department of Energy for the deployment of our new concentrated solar thermal energy technology. In addition, we expanded our manufacturing and operational capabilities, announcing a successful field test of our ICARUS autonomous robot which we designed with the goal of reducing installation and maintenance costs for our facilities.”

“As you can tell, the team at Heliogen has been busy,” continued Gross. “We intend to carry this momentum through 2022 and have already begun the initial work on our Long Beach manufacturing facility, as well as our green hydrogen production facility in the Brenda Solar Energy Zone in Arizona. Having made exceptional progress in 2021 toward our goals, we are excited about what the future holds for Heliogen.”

Full-Year 2021 Financial and Operational Results

For the full year 2021, Heliogen reported total revenue of $8.8 million, total operating expenses of $43.9 million and net loss of $142.2 million. The company’s net loss was driven primarily by non-cash, remeasurement impacts of $93.6 million related to our legacy SAFE instruments and warrants prior to and through the date of closing of the business combination with Athena and share-based compensation expense of $11.4 million. The Company’s Adjusted EBITDA, which excludes these and other impacts, was negative $32.1 million for full year 2021.

As of December 31, 2021, the Company had approximately $190.1 million in cash and cash equivalents and $32.3 million of available-for-sale investments, for a total of over $222.4 million available to fund its future scaling and development efforts. Heliogen currently has no material debt outstanding.

2022 Guidance

For full-year 2022, Heliogen expects to have between two and three modules contracted and is introducing revenue guidance of $20 - $25 million. The Company believes this metric of modules contracted is the most useful indicator of the demand for Heliogen’s products and technology at this stage in its lifecycle. Over time, it expects these contracts to be converted to revenue as the projects are installed, although there is no assurance as to the time period for such conversion.

Conference Call Information

The Heliogen management team will host a conference call to discuss its full year 2021 financial results on Tuesday, March 29, 2022, at 8:30 a.m. Eastern Time. The call can be accessed via a live webcast accessible on the Events & Presentations page in the Investor Relations section of Heliogen’s website at www.heliogen.com. The call can also be accessed live via telephone by dialing 877-407-0789 (201-689-8562 for international callers) and referencing Heliogen.

An archive of the webcast will also be available shortly after the call on the Investor Relations section of Heliogen’s website and will remain available for twelve months.

About Heliogen

Heliogen is a renewable energy technology company focused on eliminating the need for fossil fuels in heavy industry and powering a sustainable future. The company’s AI-enabled, modular concentrated solar technology aims to cost-effectively deliver near 24/7 carbon-free energy in the form of heat, power, or green hydrogen fuel at scale – for the first time in history. Heliogen was created at Idealab, the leading technology incubator founded by Bill Gross in 1996. For more information about Heliogen, please visit Heliogen.com

Use of Non-GAAP Financial Information

Management uses certain financial measures, including EBITDA and Adjusted EBITDA, to evaluate our financial and operating performance that are calculated and presented on the basis of methodologies other than in accordance with GAAP. We believe these non-GAAP financial measures are useful to investors and analysts to assess our ongoing financial performance because, when reconciled to their most comparable GAAP financial measures, they provide improved comparability between periods through the exclusion of certain items that we believe are not indicative of our core operating performance, enhances the overall understanding of past financial performance and future prospects, and that may obscure our underlying business results and trends. These measures should not be considered a substitute for, or superior to, measures of financial performance prepared in accordance with GAAP, and our calculations thereof may not be comparable to similarly titled measures reported by other companies. Please see the accompanying tables for reconciliations of the following non-GAAP financial measures for Heliogen’s current and historical results: EBITDA and Adjusted EBITDA.

Forward-Looking Statements

This press release contains certain forward-looking statements within the meaning of Section 27A of the Securities Act of 1933, as amended, and Section 21E of the Securities Exchange Act of 1934, as amended. Statements that are not historical in nature, including the words “anticipate,” “expect,” “suggests,” “plan,” “believe,” “intend,” “estimates,” “targets,” “projects,” “should,” “could,” “would,” “may,” “will,” “forecast” and other similar expressions are intended to identify forward-looking statements. These forward-looking statements include, but are not limited to, statements regarding our guidance for full-year 2022, the development of our manufacturing and green hydrogen production facilities and future growth opportunities. Forward-looking statements are predictions, projections and other statements about future events that are based on current expectations and assumptions and, as a result, are subject to risks and uncertainties. Many factors could cause actual future events to differ materially from the forward-looking statements in this press release, including but not limited to: (i) our financial and business performance, including risk of uncertainty in our financial projections and business metrics and any underlying assumptions thereunder; (ii) our ability to execute our business model, including market acceptance of our planned products and services and achieving sufficient production volumes at acceptable quality levels and prices; (iii) our ability to access sources of capital to finance operations, growth and future capital requirements; (iv) our ability to maintain and enhance our products and brand, and to attract and retain customers; (v) our ability to scale in a cost-effective manner; (vi) changes in applicable laws or regulations; (vii) the ongoing impacts of the COVID-19 pandemic and the potential impacts of Russia’s invasion of Ukraine on our business; (viii) developments and projections relating to our competitors and industry; (ix) our ability to access sources of capital to finance operations, growth and future capital requirements; and (x) our ability to protect our intellectual property. You should carefully consider the foregoing factors and the other risks and uncertainties described in the “Risk Factors” section in the prospectus filed with the SEC pursuant to Rule 424(b), dated December 3, 2021 and in our Annual Report on Form 10-K that will be filed for the annual period ended December 31, 2021 and other documents filed by the Company from time to time with the SEC. These filings identify and address other important risks and uncertainties that could cause actual events and results to differ materially from those contained in the forward-looking statements. Forward-looking statements speak only as of the date they are made. Readers are cautioned not to put undue reliance on forward-looking statements, and Heliogen assumes no obligation and does not intend to update or revise these forward-looking statements, whether as a result of new information, future events, or otherwise.

Heliogen, Inc.

($ in thousands, except share data)

Condensed Consolidated Balance Sheets

(unaudited)


December 31,


2021


2020

ASSETS


Cash and cash equivalents


$

190,081


$

18,334


Investments, available-for-sale


32,332


Other current assets


4,770


241


Total current assets


227,183


18,575


Non-current assets


30,265


1,187


Total assets


$

257,448


$

19,762


LIABILITIES, CONVERTIBLE PREFERRED STOCK AND SHAREHOLDERS’ EQUITY (DEFICIT)


Trade payables


$

4,645


$

307


Contract liabilities


513


Contract loss provisions


5,180


Other current liabilities


6,974


849


Total current liabilities


17,312


1,156


Long-term liabilities


30,861


536


Total liabilities


48,173


1,692


Convertible preferred stock


45,932


Shareholders’ equity (deficit)


209,275


(27,862

)

Total liabilities, convertible preferred stock, and shareholders’ equity (deficit)


$

257,448


$

19,762


Heliogen, Inc.

Condensed Consolidated Statements of Operations and Comprehensive Loss

($ in thousands, except per share and share data)

(unaudited)


Years ended December 31,


2021


2020

Revenue


$

8,804


$

200


Cost of revenue


13,688


417


Gross loss


(4,884

)


(217

)


Operating expenses:


Selling, general, and administrative


30,386


3,713


Research and development


13,478


3,583


Total operating expenses


43,864


7,296


Operating loss


(48,748

)


(7,513

)


Interest income (expense)


634


(3

)

SAFE instruments remeasurement


(86,907

)


Warrant remeasurement


(6,651

)


(7

)

Other (expense) income, net


(517

)


86


Net loss before taxes


(142,189

)


(7,437

)

Provision for income taxes


(2

)


Net loss


(142,191

)


(7,437

)

Other comprehensive income (loss), net of taxes


Unrealized losses on available-for-sale securities


(17

)


Cumulative translation adjustment


13


Total comprehensive loss


$

(142,195

)


$

(7,437

)


Loss per share – Basic and Diluted


$

(11.88

)


$

(0.93

)


Weighted average number of shares outstanding – Diluted


11,970,550


7,978,512


Non-GAAP Financial Measures

EBITDA represents consolidated net loss before (i) interest (income) expense, net, (ii) income tax expense (benefit) and (iii) depreciation and amortization expense.

Adjusted EBITDA represents EBITDA adjusted for certain significant non-cash items and items that management believes are not attributable to or indicative of our on-going operations or that may obscure our underlying results and trends.

The following reconciles net loss to EBITDA and Adjusted EBITDA for the periods as shown:


Years ended December 31,

$ in thousands


2021


2020

Net loss


$

(142,191

)


$

(7,437

)

Adjustments


Interest (income) expense, net


(634

)


3


Provision for income taxes


2


Depreciation and amortization


562


139


EBITDA


$

(142,261

)


$

(7,295

)

Adjustments


SAFE instruments remeasurement


86,907


Warrant remeasurement


6,651


7


Share-based compensation


11,380


278


Provision for contract losses, net


5,180


Adjusted EBITDA


$

(32,143

)


$

(7,010

)


Contacts

Heliogen Media Contact:
Cory Ziskind
ICR, Inc.
This email address is being protected from spambots. You need JavaScript enabled to view it.

Heliogen Investor Contact
Caldwell Bailey
ICR, Inc.
This email address is being protected from spambots. You need JavaScript enabled to view it.

DUBLIN--(BUSINESS WIRE)--The "Global Solar Street Lighting Market, By Type, By Component, By Application, Estimation & Forecast, 2017 - 2030" report has been added to ResearchAndMarkets.com's offering.


The global solar street lighting market held a market value of USD 3,972 million in 2021 and is estimated to reach USD 15,716.4 million by the year 2030. The market is projected to list a CAGR of 17.12% during the forecast period.

The solar street lighting industry is projected to grow at a substantial rate owing to the increasing focus on smart city building, rising inclination towards solar energy and other green and clean energy initiatives, and the rising support from government and non-government agencies.

Growth Influencers:

Increasing urbanization

The growing popularity of usage of smart solar street lights in urban areas is promoting the growth of the solar street lighting market. The rising urbanization in the countries across the world require energy efficient tools, such as solar energy panels. The solar energy powered street lights provide quick fault detection and real-time control decisions. Moreover, the solar street lights are a reliable part of smart city projects and are in high demand in the developing countries.

Rising focus on solar energy

Especially in remote areas, solar energy generation tools are being a reliable source. The minimal maintenance and low comparative operational cost promotes the use of solar street lighting in many developing, underdeveloped, as well as developed regions across the world.

The global solar street lighting market report answers questions such as:

  • What is the market size and forecast of the global solar street lighting market?
  • What are the inhibiting factors and impact of COVID-19 on the global solar street lighting market during the assessment period?
  • Which are the types/segments/applications/areas to invest in over the assessment period in the global solar street lighting market?
  • What is the competitive strategic window for opportunities in the global solar street lighting market?
  • What are the technology trends and regulatory frameworks in the global solar street lighting market?
  • What is the market share of the leading players in the global solar street lighting market?
  • What modes and strategic moves are considered favorable for entering the global solar street lighting market?

Segments Overview:

The global solar street lighting market is segmented into type, component, and application.

By Type

  • Portable
  • Standalone
  • Centralized
  • Others

The standalone segment held the largest market share of nearly 49% and is expected to grow at a steady rate owing to its growing adoption. The centralized segment volume is estimated to cross 400 million units by 2028.

By Component

  • Controller
  • Lamp
  • Compact fluorescent light (CFL)
  • Light-emitting diode (LED)
  • Metal halide
  • Sodium vapor
  • Others
  • Solar Panel
  • Sensors
  • Night & Motion Sensors
  • Passive Infrared (PIR) Sensors
  • Battery
  • Lead acid
  • Lithium-Ion
  • Others

On the basis of lamp sub-segment, the LED segment value is projected to cross USD 650 million in 2023 and hit USD 2,293.6 million by 2030. Moreover, the battery segment is estimated to grow at a CAGR of 15.2% during the forecast period.

By Application

  • Parking Lot
  • Highway and Roadway
  • Airport Runway
  • Manufacturing Site
  • Playgrounds
  • Garden
  • Others

The parking lot segment volume is anticipated to cross 150 million tons by 2025 owing to the rising applications of solar street lights in parking lot spaces. The playgrounds market value is projected to be nearly 76% of airport runway market size in 2021 and is predicted to grow till 80% in 2030.

Regional Overview

By region, the global solar street lighting market is divided into Asia Pacific, Europe, North America, Middle East & Africa, and South America.

The Asia Pacific region is expected to hold the largest market share with a growth rate of more than 18% owing to the rising strategic developments by the companies operating in the marketspace.

The European region is anticipated to grow at a steady rate owing to the rising awareness regarding solar energy generation alternatives. Moreover, the North American region is also expected to grow at a substantial rate. The Middle East and African solar street lighting market volume is expected to cross 45 million units by 2030.

Companies Mentioned

  • Acuity Brands, Inc.
  • Bajaj Electricals Ltd.
  • Bridgelux Inc.
  • Cooper Lighting, LLC
  • Dragons Breath Solar
  • Jiangsu SOKOYO Solar Lighting Co., Ltd.
  • Omega Solar
  • Philips Lighting Holding B.V.
  • Signify Holding BV
  • Sol Inc.
  • Solar Street Lights USA
  • Solektra International LLC
  • Sunna Design
  • Urja Global Ltd.
  • VerySol Inc.

For more information about this report visit https://www.researchandmarkets.com/r/jodomf


Contacts

ResearchAndMarkets.com
Laura Wood, Senior Press Manager
This email address is being protected from spambots. You need JavaScript enabled to view it.
For E.S.T Office Hours Call 1-917-300-0470
For U.S./CAN Toll Free Call 1-800-526-8630
For GMT Office Hours Call +353-1-416-8900

- MOU to supply large-scale CO2 compression equipment for world’s largest carbon capture and storage project -

MONTREAL--(BUSINESS WIRE)--Xebec Adsorption Inc. (TSX: XBC) (“Xebec”), a global provider of sustainable gas technologies, is pleased to announce today that it has signed a Memorandum of Understanding (“MOU”) with Iowa-based SCS Carbon Removal LLC, a subsidiary of Summit Carbon Solutions. The MOU supports the negotiation of an order in excess of USD$100 million (CAD$126 million) for 51 carbon dioxide (CO2) reciprocating compression packages to be completed by the end of Q3 2023. This equipment will be used for Summit Carbon Solutions’ proposed carbon capture and sequestration project, which will be the largest in the world if approved. The MOU is an expression of interest and there is no certainty that the negotiations will lead to a final binding order. This agreement showcases both Xebec’s expanding technology portfolio for carbon capture and sequestration, as well as the rapidly expanding customer base for Xebec’s sustainable gas technologies.


The equipment will be manufactured at Xebec Systems USA’s (formerly UECompression, or UEC) Colorado facility. Xebec is also working closely with the customer and major suppliers to manage cash flows and supply chain risks associated with the project.

“Summit Carbon Solutions is pleased to partner with Xebec as we continue to advance our carbon capture and storage project that will open new economic opportunities for ethanol producers and maintain a strong marketplace for corn growers,” said James Powell, COO of Summit Carbon Solutions. “Xebec shares our commitment both to safety and to utilizing innovation to decarbonize critical industries like ethanol production.”

“Xebec is delighted to be involved as a key supplier to Summit Carbon Solutions’ project, which aims to make a material impact in CO2 emissions reductions in the Midwest for agriculture and industry,” stated Jim Vounassis, President and CEO of Xebec Adsorption Inc. “Our U.S. manufacturing capabilities and carbon capture activities are seeing increasing demand, and we are excited to be involved as a long-term partner with Summit Carbon Solutions. As the world aims to decarbonize, we expect the need for carbon capture and sequestration solutions to accelerate, and Xebec is well positioned to provide CO2 purification, capture, liquefaction, and compression technologies,” he added.

Xebec expands compression expertise into CO2 capture and sequestration with the transformative Midwest Carbon Express project

To date, Xebec has demonstrated its compression leadership in renewable natural gas (“RNG”), hydrogen and industrial gases through its subsidiaries Applied Compression Systems (ACS), Xebec Systems USA, and HyGear. Xebec’s compression equipment is typically needed to process sustainable gases to achieve desired operating parameters. For example, Xebec’s compression equipment has been deployed in landfills, at dairy farms for virtual RNG transport, hydrogen production and processing, refueling stations, on-site hydrogen supply and other industrial gas applications. The MOU announced today provides meaningful exposure to CO2 capture and sequestration through Midwest Carbon Express.

Summit Carbon Solutions’ carbon capture and storage project is a USD4.5 billion CO2 capture, pipeline, and sequestration infrastructure project which includes CO2 capture facilities from ethanol plants and industry, associated pipelines and pump stations in Iowa, Nebraska, South Dakota, Minnesota, and North Dakota, as well as Class VI sequestration wells in North Dakota. The project is expected to be the largest CO2 sequestration project in the world when commissioned with a 12 million tons of CO2 per year capacity, equivalent to removing 2.6 million vehicles from our roads annually.

Xebec to Host Live Investor Webinar for First Investor Day in Colorado

An investor webinar will be held tomorrow on Tuesday, March 29, 2022, at 11:00 AM MDT (1:00 PM EDT) for Xebec’s first investor day. The event will showcase the company’s worldwide capabilities, disruptive clean technologies for sustainable gases, and the multi-year strategic plan to enable the successful execution of its many growth opportunities.

Register here: https://app.livestorm.co/xebec-adsorption-inc/2022-investor-day

Related links:
https://www.summitcarbonsolutions.com/
https://www.xebecinc.com

About Summit Carbon Solutions

Summit Carbon Solutions seeks to lower greenhouse gas emissions by connecting industrial facilities via strategic infrastructure to store carbon dioxide safely and permanently in the Midwestern United States. For more information, visit: www.SummitCarbonSolutions.com.

About Xebec Adsorption Inc.

Xebec is a global provider of clean energy solutions for renewable and low carbon gases used in energy, mobility and industrial applications. The company specializes in deploying a portfolio of proprietary technologies for the distributed production of hydrogen, renewable natural gas, oxygen and nitrogen. By focusing on environmentally responsible gas generation, Xebec has helped thousands of customers around the world reduce their carbon footprints and operating costs. Headquartered in Québec, Canada, Xebec has a worldwide presence with nine manufacturing facilities, seventeen Cleantech Service Centers and four sales offices spanning over four continents. Xebec trades on the Toronto Stock Exchange under the symbol (TSX: XBC). For more information, xebecinc.com.

Cautionary Statement

This press release contains forward-looking statements within the meaning of applicable Canadian securities law. These statements relate to future events or future performance and reflect the expectation of Management regarding the growth, results of operations, performance and business prospects and opportunities of the Corporation or its industry. Forward-looking statements typically contain words such as “believes”, “expects”, “anticipates”, “continues”, “could”, “indicates”, “plans”, “will”, “intends”, “may”, “projects”, “schedules”, “would” or similar expressions suggesting future outcomes or events, although not all forward-looking statements contain these identifying words. Examples of such statements include, but are not limited to, statements concerning: (i) the certainty of an order for 51 CO2 compression package being place; (ii) the completion of the order by the end of Q3 2023; (iii) the value of the order; (iv) that the whole project will be commissioned; and (v) the carbon sequestration capacity as noted in this press release.

These statements are neither promises nor guarantees but involve known and unknown risks and uncertainties that may cause the Company’s actual results, level of activity or performance to be materially different from any future results, levels of activity or performance expressed in or implied by these forward-looking statements. These risks include, generally, risks related to the ability of the Corporation to execute its strategy, operating results, purchasing third party supplies for key materials and components in a timely and cost effective basis, industry and products, technology, competition, ability to attract and retain qualified personnel, ability to manage successfully the anticipated expansion of our operations, the economy, the sufficiency of insurance and other factors which are discussed in greater details in the most recent quarterly management discussion ana analysis (“MD&A”) and in the Annual Information Form of the Corporation filed on SEDAR at www.sedar.com.

Forward-looking statements contained herein are based on a number of assumptions believed by the Corporation to be reasonable as at the date of this press release, including, without limitations, assumptions about trends in certain market segments, the economic climate generally, the pace and outcome of technological development, the identity and expected actions of competitors and customers, the value of the Canadian dollar and of foreign currency fluctuations, interest rates, the anticipated margins under new contracts awards, the state of the Corporation’s current backlog, the regulatory environment, and the procurement of key material and components of products. If these assumptions prove to be inaccurate, the Corporation’s actual results may differ materially from those expressed or implied in the forward-looking statements. The forward-looking statements contained herein are made as of the date of this press release and are expressly qualified in their entirety by this cautionary statement. Except to the extent required by law, the Company undertakes no obligation to publicly update or revise any forward-looking statements contained herein. Readers should not place undue reliance on forward looking statements.


Contacts

Investor Relations:
Xebec Adsorption Inc.
Brandon Chow, Director, Investor Relations
This email address is being protected from spambots. You need JavaScript enabled to view it.
+1 450.979.8700 ext. 5762

THE WOODLANDS, Texas--(BUSINESS WIRE)--The Clean Canaveral, a new liquefied natural gas (LNG) bunker barge operating along the coast of the southeastern United States, recently completed its inaugural bunkering in Jacksonville, Florida. The Clean Canaveral has a capacity of 5,500 cubic meters, making it the largest Jones Act LNG bunker barge. The vessel operates as an articulated tug barge unit (“ATB”) and is owned by Polaris New Energy LLC (“Polaris”), a subsidiary of Seaside LNG Holdings (“Seaside”).


This operation marks the first barge-to-ship cool down performed in the United States. As part of the operation, LNG was loaded onto the Clean Canaveral at the Jacksonville dock of JAX LNG, a joint venture between Seaside subsidiary Northstar Jacksonville and Pivotal LNG, a subsidiary of BHE GT&S. The Clean Canaveral then transferred approximately 600 metric tons of LNG to cool-down and bunker the tanker “Eagle Brasilia,” owned by AET.

“As expected, the Clean Canaveral performed very well during the bunkering process. The McAllister Towing crew operating the ATB, our vendors, regulatory agencies, JAXPORT and Polaris worked seamlessly together to ensure we were prepared for a successful bunkering,” said Tom Sullivan, Senior Vice President of Operations for Seaside. “In addition, the working relationship between AET, its ship-manager, Eaglestar, and the crew on the ATB was key to the safe transfer of LNG. We greatly appreciate AET’s confidence in our ability to safely conduct this inaugural bunkering.”

Tim Casey, Senior Vice President of LNG for Seaside said, “It’s rewarding to see the Clean Canaveral accomplish this step as it represents the culmination of years of hard work by many people. We have additional bunker deliveries already scheduled for later this month and are actively growing our customer base to supply much needed last mile logistics services.”

Mac Hummel, Chief Executive Officer of Seaside added, “We’re excited to help lead the maritime industry’s transition to a lower carbon future. The environmental benefits of LNG as a next generation fuel for our maritime customers are well established. I thank Tom and Tim for their leadership in making the physical deliveries of LNG via the Clean Canaveral a success.”

Roger Williams, VP Commercial LNG and Gas Development at BHE GT&S added, “With the addition of the Clean Canaveral, JAX LNG will be able to significantly increase the deliverability of LNG from our facility to the maritime industry in the southeastern United States.”

“AET has invested in dual-fuel shipping,” said John Lindquist, GAC Bunker Fuels’ Head of LNG Bunkering. “With their support, GAC demonstrates our journey to decarbonization with LNG, upholding our commitment to zero oil-based bunker sales by 1 January 2030 and fulfilling our goals, which are aligned to the UN Sustainable Development Goals (SDGs) and the Getting to Zero Coalition. We thank JAX LNG, Polaris New Energy and its partners for executing a safe operation, while we explore more ways to serve the United States southeast region with the Clean Canaveral.”

About Polaris New Energy
Polaris is a wholly owned subsidiary of Seaside LNG Holdings LLC, formed to supply maritime transportation logistics in the U.S. Jones Act market for LNG as a fuel to the maritime, aerospace and transportation industries. Polaris owns the Clean Canaveral and the tug, Polaris, which operate as an ATB for delivery to LNG customers. For more information, visit polarisnewenergy.com.

About Seaside LNG Holdings
Seaside Holdings LLC provides LNG liquefaction and maritime transportation logistics to meet the growing demand for LNG as a transportation fuel through its subsidiaries Northstar Jacksonville and Polaris New Energy.

About JAX LNG
JAX LNG, LLC is a joint venture between NorthStar Jacksonville and Pivotal LNG – a subsidiary of BHE GT&S, a Berkshire Hathaway Energy company – operating a 120,000 gallon per day LNG plant with 2 million gallons of storage, marine and truck-loading capabilities in Jacksonville, FL. An expansion of the facility is nearing completion that will double storage and triple liquefaction capacity by early 2022. The LNG facility was constructed to bring liquefied natural gas to the southeastern U.S. and Puerto Rico. For more information on JAX LNG, visit www.jaxlng.com.


Contacts

Tim Casey
(713) 244-5992
This email address is being protected from spambots. You need JavaScript enabled to view it.

The Green Solutions appoints Black & Veatch to study the generation and storage of green hydrogen and green ammonia in Vietnam


SINGAPORE--(BUSINESS WIRE)--Black & Veatch and The Green Solutions (TGS) have signed a Memorandum of Understanding (MoU) to advance the production and supply of green hydrogen and green ammonia in Vietnam.

Specializing in renewable energy project development, manufacturing and services, TGS leads efforts to harness green energy in Vietnam for the manufacture of green hydrogen and green ammonia. Black & Veatch, a global leader in hydrogen energy development, brings its vast expertise in clean energy technologies and ammonia processing to the project team.

“The Green Solutions is committed to applying the most advanced technologies in the field of renewable energy in Vietnam. Partnering with Black & Veatch will allow us to adapt global best practices to Asia’s requirements and contribute to the region’s zero-carbon future,” said Winnie Huynh, Founder & CEO, TGS.

Hydrogen can be used for power generation, energy storage and advanced transportation solutions. While ammonia, which can be liquified for storage and shipment globally, can be used in multiple energy-intensive industries to produce electricity or other green chemicals.

Under the MoU, Black & Veatch and TGS are targeting to produce 180,000 tons of green ammonia and 30,000 tons of green hydrogen per year to support regional decarbonization efforts.

TGS has appointed Black & Veatch to study the production and storage of green hydrogen in Vietnam utilizing solar or wind power supplied through the grid. The study also includes development of a green ammonia production plant as well as plant configuration and technology review, technology evolution risk and tentative mitigation, conceptual design, order of magnitude cost estimates, and levelized cost calculations. Augustus Global Investments will provide the initial development funding for the project.

“Given our 80-year history working with hydrogen and ammonia production in the fertilizer industry, we bring expertise in all stages of hydrogen infrastructure projects – from technical advisory services and design through operations. As an early mover in serving clients across the hydrogen and ammonia value chains, Black & Veatch is eager to partner with sustainability-focused companies like The Green Solutions as we pursue our shared passion for decarbonizing energy in Asia by broadening the use of green hydrogen and green ammonia,” said Narsingh Chaudhary, Executive Vice President & Managing Director, Asia Pacific, Black & Veatch.

“Augustus integrates environmental, social and corporate governance (ESG) factors in our investment and portfolio management processes. We are pleased to support forward-thinking businesses like The Green Solutions and Black & Veatch as they work to realize Asia’s decarbonization ambitions,” said Fadi Krikor, Founder & CEO, Augustus Global Investments.

The MoU responds to Asia’s optimism for green fuels such as hydrogen and ammonia. According to Black & Veatch’s 2022 Asia Electric Report, 73 percent of respondents believe that hydrogen will help meet carbon emissions goals beyond 10 years from now – more than any other technology. In addition, the report also reveals that 46 percent think it will take off as a clean and affordable alternative to gas generation by 2030.

As a global engineering, procurement, consulting, and construction partner, Black & Veatch has strong experience in the development of renewable energy and natural gas feedstocks; water treatment for industrial applications; hydrogen generation and purification; hydrogen compression, handling and power generation; and selection of cost-effective storage technology.

Click here to download a supporting image.

Editor’s Notes:

  • Black & Veatch has been selected as Owner’s Engineer by Intermountain Power Agency (IPA) for the Intermountain Power Project Renewal Project (IPPRP), which marks one of the earliest installations of combustion turbine technology designed to use a high percentage of green hydrogen.
  • Black & Veatch provided conceptual design and conducted a cost assessment for the integration of gaseous hydrogen from nearby industrial facilities as a combustion fuel into the Long Ridge Energy Terminal 485-MW combined cycle GE 7HA.02 advanced class power plant.
  • Black & Veatch has been selected by Enegix Energy to perform a feasibility study to support the development of the world’s largest green hydrogen plant. The facility is targeting production of more than 600 million kilograms of green hydrogen annually.

About Black & Veatch

Black & Veatch is a 100-percent employee-owned global engineering, procurement, consulting and construction company with a more than 100-year track record of innovation in sustainable infrastructure. Since 1915, we have helped our clients improve the lives of people around the world by addressing the resilience and reliability of our most important infrastructure assets. Our revenues in 2021 exceeded US$3.3 billion. Follow us on www.bv.com and on social media.


Contacts

EMILY CHIA | +65 6335 6623 P | +65 9875 8907 M | This email address is being protected from spambots. You need JavaScript enabled to view it.
24-HOUR MEDIA HOTLINE | +1 855-999-5991

Agreement to deploy a 5 MWe module of Heliogen’s AI-enabled concentrated solar energy technology in California and jointly market Heliogen’s innovative technology in Australia

PASADENA, Calif.--(BUSINESS WIRE)--$HLGN #ArtificialIntelligence--Heliogen, Inc. (NYSE: HLGN), a leading provider of AI-enabled concentrated solar energy, and Woodside Energy (USA) Inc., a wholly-owned subsidiary of leading Australian energy producer Woodside Petroleum Ltd (ASX: WPL), today announced a project agreement (the “Project Agreement”) for the commercial-scale demonstration deployment of Heliogen’s AI-enabled concentrated solar energy technology proposed to be built in Mojave, California.


The Project Agreement follows the previously announced Limited Notice To Proceed (“LNTP”) granted by Woodside to Heliogen to begin procurement of key equipment for the deployment of a commercial scale, single-module 5 megawatt electric (5 MWe) facility. Under the Project Agreement, Heliogen will complete the engineering, procurement, and construction of the facility, with construction expected to begin once permits are approved.

The two companies have agreed to include the scope and associated funding from Heliogen’s previously announced US$39 million award from the U.S. Department of Energy to deploy Heliogen’s renewable energy technology in California. This means that in addition to commercial-scale demonstration of Heliogen’s 5 MWe module, the project will also include the deployment and testing of an innovative approach to converting the thermal energy produced by Heliogen’s facility into power, which has the potential to deliver higher efficiencies with a smaller footprint than traditional steam turbines.

In addition to the Project Agreement, Heliogen and Woodside Energy Technologies Pty. Ltd have also signed a collaboration agreement to jointly market Heliogen’s technology in Australia (the “Australian Collaboration Agreement”). Under this arrangement, the companies expect to define product offerings that use Heliogen’s modular technology for potential customers (including Woodside) in Australia and are establishing a roadmap to identify and engage with those customers. The Australian Collaboration Agreement includes an objective to deploy further commercial-scale modules of Heliogen’s heat and power offerings which may be combined with a hydrogen offering, strengthening Woodside’s role in the energy transition to lower carbon energy sources. The companies are also in similar discussions in relation to Heliogen’s technology in the U.S.

“We are thrilled to be working with leading Australian energy producer, Woodside. Our agreements represent a pivotal next step in the commercialization of Heliogen’s breakthrough concentrated solar technology and the decarbonization of heavy industry,” said Bill Gross, Founder and Chief Executive Officer of Heliogen. “We are also pleased to share that, along with these agreements, our strategic alliance with Woodside includes Woodside taking an equity participation in Heliogen.”

Gross continued, “The proposed Mojave facility will further advance our discussions with Woodside for additional opportunities aiming to produce carbon-free heat, power and hydrogen to help them achieve their sustainability goals.”

“Woodside has set a US$5 billion investment target by 2030 for new energy products and lower-carbon services1,” said Meg O’Neill, Chief Executive Officer of Woodside. “Our collaboration with Heliogen on this innovative technology supports our commitment to building a low cost, lower-carbon, profitable, resilient and diversified portfolio.”

About Heliogen

Heliogen is a renewable energy technology company focused on eliminating the need for fossil fuels in heavy industry and powering a sustainable future. The company’s AI-enabled, modular concentrated solar technology aims to cost-effectively deliver near 24/7 carbon-free energy in the form of heat, power, or green hydrogen fuel at scale – for the first time in history. Heliogen was created at Idealab, the leading technology incubator founded by Bill Gross in 1996. For more information about Heliogen, please visit heliogen.com.

About Woodside

We provide energy which Australia and the world needs to heat homes, keep lights on and enable industry. We have a reputation for safe and reliable operations. Our hydrocarbon business is complemented by a growing portfolio of hydrogen, ammonia and solar opportunities in Australia and internationally. Our new energy opportunities include the proposed hydrogen and ammonia projects H2Perth and H2TAS in Australia and the proposed hydrogen project H2OK in North America. For more visit woodside.com.au.

1 Investment target assumes completion of the proposed merger with BHP’s petroleum business. Individual investment decisions are subject to Woodside’s investment hurdles. Not guidance.


Contacts

Heliogen Media Contact:
Cory Ziskind
ICR, Inc.
This email address is being protected from spambots. You need JavaScript enabled to view it.

Heliogen Investor Contact:
Louis Baltimore
This email address is being protected from spambots. You need JavaScript enabled to view it.

Woodside Media Contact
Christine Forster
M: +61 484 112 469
E: This email address is being protected from spambots. You need JavaScript enabled to view it.

HOUSTON--(BUSINESS WIRE)--CenterPoint Energy, Inc. (NYSE: CNP) or “CenterPoint” continues to execute on its long-term strategic plan of becoming a pure-play regulated utility, with an improved business risk profile and strengthened balance sheet, to benefit both its customers and investors.


The company today announced it has entirely exited its midstream interest with the sale of its Energy Transfer (“ET”) holdings, including its remaining 51 million ET common units and all its ET Series G preferred units.

Including the previously announced transactions, CenterPoint monetized its ownership in ET common units at an approximate 20% premium on an aggregated basis to the ET common unit price when the merger between ET and Enable Midstream Partners, LP (“Enable”) was announced on February 12, 2021. The company fully exited the stake within four months of merger close. The net proceeds will be used to pay down associated debt and taxes from the transaction.

Additionally, Moody’s Investors Service, Inc. recently revised the CenterPoint Energy, Inc. downgrade threshold of cash flow from operations (pre-working capital) to debt ratio to 13% from 14%. The agency noted the company’s recent credit strengths, including improving business risk profile with the exit of the midstream business, its characterization of the company as diverse group of regulated utilities operating in credit supportive regulatory environments, and good economic and regulatory diversity across the company’s service territories.

“As committed, we have taken decisive actions to align our interests more closely with those of our customers and our investors, including refocusing on our core regulated utility businesses. We are committed to delivering on our strategic plan, which includes more than $40 billion of capital investments in our utility footprint over our 10-year financial plan, as well as 8% non-GAAP EPS growth annually through 2024 and the mid-to-high end of 6-8% annual growth of non-GAAP EPS thereafter through 2030. As we extend our track record of meeting and exceeding expectations, we believe our accelerated exit from midstream well ahead of our goal of year-end 2022 demonstrates that we are a management team that is committed to becoming a premium utility with industry-leading growth,” said President and CEO Dave Lesar.

Lesar continued, “We believe that these actions to improve our business risk profile and strengthen our balance sheet, coupled with investments in our pure-play regulated business and efficient recycling of capital, position us firmly on that path. Our long-term strategy also supports a transition to a cleaner energy future that will benefit our customers and our investors.”

About CenterPoint Energy, Inc.

As the only investor owned electric and gas utility based in Texas, CenterPoint Energy, Inc. (NYSE: CNP) is an energy delivery company with electric transmission and distribution, power generation and natural gas distribution operations that serve more than 7 million metered customers in Indiana, Louisiana, Minnesota, Mississippi, Ohio and Texas. As of December 31, 2021, the company owned approximately $38 billion in assets. With approximately 9,400 employees, CenterPoint Energy and its predecessor companies have been in business for more than 150 years. For more information, visit CenterPointEnergy.com.

Earnings Outlook

As included in this press release, non-GAAP diluted earnings per share (“non-GAAP EPS”) is not a generally accepted accounting principles (“GAAP”) financial measure. Generally, a non-GAAP financial measure is a numerical measure of a company’s historical or future financial performance that excludes or includes amounts that are not normally excluded or included in the most directly comparable GAAP financial measure.

Non-GAAP EPS includes net income from the company’s Electric and Natural Gas segments, as well as after tax Corporate and Other operating income and an allocation of corporate overhead based upon Electric’s and Natural Gas’s relative earnings contribution. Corporate overhead consists primarily of interest expense, preferred stock dividend requirements, and other items directly attributable to the parent along with the associated income taxes.

  • Non-GAAP EPS guidance excludes:
    • Earnings or losses from the change in value of CenterPoint Energy’s 2.0% Zero-Premium Exchangeable Subordinated Notes due 2029 (“ZENS”) and related securities;
    • Gain and impact, including related expenses, associated with Arkansas and Oklahoma gas LDC sales; and
    • Income and expense related to ownership and disposal of ET common and Series G preferred units, and a corresponding amount of debt related to the units.

In providing this guidance, CenterPoint Energy does not consider the items noted above and other potential impacts such as changes in accounting standards, impairments or other unusual items, which could have a material impact on GAAP reported results for the applicable guidance period. The non-GAAP EPS guidance range also considers assumptions for certain significant variables that may impact earnings, such as customer growth and usage including normal weather, throughput, recovery of capital invested, effective tax rates, financing activities and related interest rates, and regulatory and judicial proceedings. To the extent actual results deviate from these assumptions, the non-GAAP EPS guidance range may not be met or the projected annual non-GAAP EPS growth rate may change. CenterPoint Energy is unable to present a quantitative reconciliation of forward-looking non-GAAP diluted earnings per share because changes in the value of ZENS and related securities, future impairments, and other unusual items are not estimable and are difficult to predict due to various factors outside of management’s control. Management evaluates CenterPoint Energy’s financial performance in part based on non-GAAP earnings per share. Management believes that presenting this non-GAAP financial measure enhances an investor’s understanding of CenterPoint Energy’s overall financial performance by providing them with an additional meaningful and relevant comparison of current and anticipated future results across periods. The adjustments made in this non-GAAP financial measure excludes items that Management believes do not most accurately reflect the company’s fundamental business performance. CenterPoint Energy’s non-GAAP diluted earnings per share measures should be considered as a supplement to, and not as a substitute for, or superior to, diluted earnings per share, which respectively are the most directly comparable GAAP financial measure. This non-GAAP financial measure also may be different than non-GAAP financial measures used by other companies.

Forward-looking Statements

This news release includes forward-looking statements within the meaning of the Private Securities Litigation Reform Act of 1995. When used in this news release, the words "anticipate," "believe," "continue," "could," "estimate," "expect," "forecast," "goal," "intend," "may," "objective," "plan," "potential," "predict," "projection," "should," "target," "will" or other similar words are intended to identify forward-looking statements. These forward-looking statements are based upon assumptions of management which are believed to be reasonable at the time made and are subject to significant risks and uncertainties. Actual events and results may differ materially from those expressed or implied by these forward-looking statements. Any statements in this news release regarding capital investments, future earnings and guidance, including long-term growth rate, future financial performance and results of operations, including with respect to regulatory actions and recoverability of capital investments, and any other statements that are not historical facts are forward-looking statements. Each forward-looking statement contained in this news release speaks only as of the date of this release.

Important factors that could cause actual results to differ materially from those indicated by the provided forward-looking information include, but are not limited to, risks and uncertainties relating to: (1) CenterPoint Energy’s potential business strategies and strategic initiatives, restructurings, joint ventures and acquisitions or dispositions of assets or businesses, including the completed sale of our Natural Gas businesses in Arkansas and Oklahoma and the exit from midstream, which we cannot assure you will have the anticipated benefits to us; (2) industrial, commercial and residential growth in CenterPoint Energy’s service territories and changes in market demand; (3) CenterPoint Energy's ability to fund and invest planned capital, and timely and appropriate rate actions that allow recovery of costs and a reasonable return on investment, including those related to Indiana Electric’s generation transition plan as part of its more recent IRP; (4) financial market and general economic conditions, including access to debt and equity capital and the effect on sales, prices and costs; (5) continued disruptions to the global supply chain; (6) actions by credit rating agencies, including any potential downgrades to credit ratings; (7) the timing and impact of regulatory proceedings and actions and legal proceedings, including those related to Houston Electric’s mobile generation leases; (8) legislative decisions, including tax and developments related to the environment such as global climate change, air emissions, carbon, waste water discharges and the handling of coal combustion residuals, among others, and CenterPoint Energy’s Net Zero targets; (9) the impact of the COVID-19 pandemic; (10) the recording of impairment charges; (11) weather variations and CenterPoint Energy’s ability to mitigate weather impacts, including impacts from the February 2021 winter storm event; (12) changes in business plans; (13) CenterPoint Energy’s ability to execute on its initiatives, targets and goals, including its Net Zero emission goals and operations and maintenance goals; and (14) other factors discussed CenterPoint Energy’s Annual Report on Form 10-K for the fiscal year ended December 31, 2021, including in the “Risk Factors” and “Cautionary Statement Regarding Forward-Looking Information” sections of such report, and other reports CenterPoint Energy or its subsidiaries may file from time to time with the Securities and Exchange Commission.


Contacts

Media:
Communications
This email address is being protected from spambots. You need JavaScript enabled to view it.
Investors:
Jackie Richert
Phone 713.207.6500

NEW YORK--(BUSINESS WIRE)--Intercontinental Exchange, Inc. (NYSE:ICE), a leading global provider of data, technology, and market infrastructure, today announced the launch of two Renewable Volume Obligation futures contracts, expanding ICE’s U.S. renewable fuels futures markets.

The U.S. Environmental Protection Agency’s (EPA) Renewable Fuel Standard (RFS) mandates the incorporation of renewable fuels into transportation fuel. Each year, the EPA outlines the volume requirements for each renewable fuel category and sets those volumes through the annual renewable volume obligation (RVO).


Obligated parties under the RFS program include refiners and importers of transportation fuel in the U.S. Each year these companies calculate their renewable fuel obligation by multiplying the RVO percentage across the four renewable fuel categories under the RFS, by the volume of transportation fuel they produced or imported that compliance year.

The RVO applies to a basket of U.S. Renewable Identification Numbers (RINs) which are credits generated by renewable fuel producers to track the compliance of transportation fuel under the RFS program. Companies must either generate RINs or purchase them to meet their annual commitments. The RVO is critical to the margin calculations of refiners, as well as importers and exporters of transportation fuels, and is an important consideration when exporting fuel and determining whether arbitrage opportunities exist, as well as influencing the crack spread for refiners using the fuel to create other products.

As a result, companies need a means to hedge their RVO exposure and ICE has today launched the RVO (OPIS) Current Year Future & Argus RVO Current Year Future, based on the OPIS and Argus daily price assessments. Each futures contract is equivalent to 50,000 gallons.

“Compliance with the Renewable Fuel Standard is a cost which refiners and importers of transportation fuel in the U.S. need to manage,” said Jeff Barbuto, Global Head of Oil Markets at ICE. “The RVO futures, in combination with our existing RINs futures, will help the market manage exposure to renewable fuel obligations. RINs volume and open interest have reached record levels in 2022 as this market continues to grow and companies recognize the benefits of hedging this cost.”

ICE offers cash settled RINs futures, including the D6 ethanol and D4 biodiesel (OPIS) (product codes: RIN and RIK). The number of participants trading ICE RINs has doubled versus 2020 as participants manage their exposure to the price of RINs. So far this year, roughly 7,861 RIN futures have traded, equivalent to 393 million RINs.

ICE’s renewable fuels futures markets form part of ICE’s extensive environmental complex. ICE offers customers access to the largest and most liquid environmental markets in the world to manage and price emissions, as well as meet compliance obligations. In 2021, ICE traded a record 18 billion tons of carbon allowances, equivalent to an estimated $1 trillion in notional value and equal to over half the world’s estimated total annual energy-related emissions footprint.

About Intercontinental Exchange

Intercontinental Exchange, Inc. (NYSE: ICE) is a Fortune 500 company that designs, builds and operates digital networks to connect people to opportunity. We provide financial technology and data services across major asset classes that offer our customers access to mission-critical workflow tools that increase transparency and operational efficiencies. We operate exchanges, including the New York Stock Exchange, and clearing houses that help people invest, raise capital and manage risk across multiple asset classes. Our comprehensive fixed income data services and execution capabilities provide information, analytics and platforms that help our customers capitalize on opportunities and operate more efficiently. At ICE Mortgage Technology, we are transforming and digitizing the U.S. residential mortgage process, from consumer engagement through loan registration. Together, we transform, streamline and automate industries to connect our customers to opportunity.

Trademarks of ICE and/or its affiliates include Intercontinental Exchange, ICE, ICE block design, NYSE and New York Stock Exchange. Information regarding additional trademarks and intellectual property rights of Intercontinental Exchange, Inc. and/or its affiliates is located here. Key Information Documents for certain products covered by the EU Packaged Retail and Insurance-based Investment Products Regulation can be accessed on the relevant exchange website under the heading “Key Information Documents (KIDS).”

Safe Harbor Statement under the Private Securities Litigation Reform Act of 1995 -- Statements in this press release regarding ICE's business that are not historical facts are "forward-looking statements" that involve risks and uncertainties. For a discussion of additional risks and uncertainties, which could cause actual results to differ from those contained in the forward-looking statements, see ICE's Securities and Exchange Commission (SEC) filings, including, but not limited to, the risk factors in ICE's Annual Report on Form 10-K for the year ended December 31, 2021, as filed with the SEC on February 3, 2022.

Source: Intercontinental Exchange
ICE-CORP


Contacts

ICE Media Contact
Rebecca Mitchell
This email address is being protected from spambots. You need JavaScript enabled to view it.
+44 7951 057351

ICE Investor Contact
Mary Caroline O’Neal
This email address is being protected from spambots. You need JavaScript enabled to view it.
(770) 738-2151


Offshore Source Logo

Offshore Source keeps you updated with relevant information concerning the Offshore Energy Sector.

Any views or opinions represented on this website belong solely to the author and do not represent those of the people, institutions or organizations that Offshore Source or collaborators may or may not have been associated with in a professional or personal capacity, unless explicitly stated.

Corporate Offices

Technology Systems Corporation
8502 SW Kansas Ave
Stuart, FL 34997

info@tscpublishing.com