Business Wire News

DUBLIN--(BUSINESS WIRE)--The "Growth Opportunities In E-Bikes, Fleet Management, Traffic Management, LEDs, and AI-Based Solutions" report has been added to ResearchAndMarkets.com's offering.


The Mobility Technology Opportunity Engine (TOE) for 2022 covers innovations in E-bikes, fleet management, traffic management, LEDs and AI-based solutions. Some of the innovations profiled include E-bikes for ride-sharing services, Internet of Things (IoT)-based fleet management solution, AI-based AR solution, LEDs for automotive lighting, and AI-based eye tracking solutions for enhanced driver safety.

The purpose of the Mobility Technology TOE is to raise awareness of global technology innovations in self-propelled ground-based mobile platforms that are not only technically significant but potentially offer commercial value. Each monthly TOE provides subscribers with valuable descriptions and analyses of 10 noteworthy innovations. The main focus is on highway-licensed motor vehicles (light, medium, and heavy). Passenger cars, trucks, buses, motorcycles, scooters, and railway locomotives are within the product scope, energized by any fuel. Many of the innovations concern powertrains (internal combustion engines, turbines, battery electrics, fuel cell electrics, hybrid-electrics), as well as drivetrains (including transmissions), interiors--seating and displays, advanced materials--as for body/chassis, wireless connectivity, and self-driving technology that is currently receiving so much attention. The Mobility TOE outlines and evaluates each innovation, notes which organizations and developers are involved, projects the likely timing for commercialization, furnishes a patent analysis and provides valuable strategic insights for industry stakeholders.

The Advanced Manufacturing and Automation (AMA) Cluster covers technologies that enable clean, lean, and flexible manufacturing and industrial automation. Technologies such as three-dimensional (3D) and four-dimensional (4D) printing, wireless sensors and networks, information and communication technology, multimaterial joining, composites manufacturing, digital manufacturing, micro-and nano-manufacturing, lasers, advanced software, and printing techniques, are covered as part of this cluster. The technologies covered here impact a wide range of industries, such as the impact semiconductor, automotive and transportation, aerospace and defense, industrial, healthcare, logistics, and electronics industries.

Key Topics Covered:

1. Growth Opportunities In E-Bikes, Fleet Management, Traffic Management, LEDs, and AI-Based Solutions

  • Innovations In Mobility
  • E-Bikes Track Telematics and Rider Speed
  • Delfast's Value Proposition
  • Delfast - Investor Dashboard
  • E-Bikes Enable Ride-Sharing Services
  • Humanforest - Investor Dashboard
  • Humanforest's Value Proposition
  • Internet Of Things - Based Fleet Management Solution
  • Ridecell's Value Proposition
  • Ridecell - Investor Dashboard
  • Advanced Traffic Management Solution
  • Valerann's Value Proposition
  • Valerann - Investor Dashboard
  • AI-Based AR Solution for the Automotive Industry
  • Phiar Technologies' Value Proposition
  • Phiar Technologies - Investor Dashboard
  • Driver Monitoring and Alerting Solution for the Automotive Industry
  • Eyedentify's Value Proposition
  • Eyedentify - Investor Dashboard
  • Light-Emitting Diode Brightens Automotive Front Lighting
  • AMS OSRAM's Value Proposition Reduces Footprint and Thermal Management Problems
  • AMS OSRAM - Investor Dashboard
  • Luxurious 2-Seater Autonomous Electric Vehicle
  • Cadillac's Value Proposition Makes Drivers Tourists With Updatable Functionalities
  • Cadillac - Investor Dashboard
  • Swappable Battery Solves Battery Electric Vehicle Conundrum
  • CATL's Value Proposition Scales Energy Storage To Match Needed Mileage
  • CATL's -Investor Dashboard
  • AI-Based Eye-Tracking Solution Enhances Driver Safety
  • Smart Eye's Value Proposition Accurate In All Light Conditions
  • Smart Eye - Investor Dashboard

2. Industry Contacts

Companies Mentioned

  • AMS Osram
  • Cadillac
  • CATL
  • Eyedentify
  • HumanForest
  • Phiar Technologies
  • Ridecell
  • Smart Eye
  • Valerann

For more information about this report visit https://www.researchandmarkets.com/r/75fvpo

About ResearchAndMarkets.com

ResearchAndMarkets.com is the world's leading source for international market research reports and market data. We provide you with the latest data on international and regional markets, key industries, the top companies, new products and the latest trends.


Contacts

ResearchAndMarkets.com
Laura Wood, Senior Press Manager
This email address is being protected from spambots. You need JavaScript enabled to view it.
For E.S.T Office Hours Call 1-917-300-0470
For U.S./CAN Toll Free Call 1-800-526-8630
For GMT Office Hours Call +353-1-416-8900

Record fourth quarter propels company past its stated 2021 guidance of $45 million.

WILLISTON, Vt.--(BUSINESS WIRE)--$SIRC #benzinga--iSun, Inc. (NASDAQ: ISUN) (the “Company,” or “iSun a leading solar energy and clean mobility infrastructure company with 50-years of experience accelerating the adoption of innovative electrical technologies, today announced results for the fourth quarter and full-year 2021.


Highlights

  • Full year revenue of $45.3 million representing 115% growth over 2020.
  • Full year margin improved by 300 basis points from 2020.
  • Fourth quarter revenue of $27.0 million compared to $9.3 million in the fourth quarter of 2020, an increase of 190%.
  • Fourth quarter gross margin of 21%, an increase of 190 basis points over the same period 2020.
  • Total assets increased to $103.7 million in 2021 from $19.6 million in 2020.

Management Commentary

“2021 was a milestone year for iSun,” commented iSun CEO Jeff Peck. “We successfully built a solar service platform capable of addressing the generational opportunity presented by EV adoption and decarbonization. While doing so, we delivered on our promise to grow revenues by more than doubling our 2020 revenues, exceeding our revenue guidance, and increasing shareholder equity by 650%. The fourth quarter 2021 provided our newly assembled leadership team their first opportunity to collaborate, and we are thrilled with the results. We are excited to continue these synergies into 2022, and to seeing what we can accomplish with our platform across a full calendar year.”

Fourth Quarter and Full-Year Results

iSun reported fourth quarter 2021 revenue of $27 million representing a $17.7 million or 190% increase over the same period in the prior year. iSun reported full year 2021 revenue of $45.2 million, a $24.3 million or 115% increase over 2020. Revenue growth was driven by the continued execution of iSun’s Commercial and Industrial project backlog, the addition of a new Professional Services revenue stream and continued deployment of iSun’s EV Infrastructure.

Gross profit in the fourth quarter was $5.6 million compared to $1.8 million during the fourth quarter in the prior year, an increase of 214%. Gross margins for the fourth quarter were 21%, compared to 19.1% during the same period in the prior year. Gross profit for the year was $4.6 million, representing a $3.8 million or 214% increase over 2020. Gross Margin improvements were attributed to iSun’s diversification into new solar segments and services, and improved operating efficiencies.

EBITDA for the fourth quarter of 2021 was a loss of $0.5 million. When adjusted for one-time expenses related to M&A transactions, adjusted EBITDA was $0.9 million.

SunCommon - iSun’s residential division – has customer orders of $19.2 million expected to be completed in the next four to six months, their commercial division has a contracted backlog of approximately $9.3 million expected to be completed within six to eight months, and the industrial and municipal division a contracted backlog of $73.8 million expected to be completed within twelve to 18 months. iSun’s utility division has over 550 MW of projects currently under development. iSun expects the first of these projects to commence development late in the third quarter of 2022.

Total assets increased on December 31, 2021, to $103.7 million from $19.6 million at December 31, 2020. The increase is attributable to numerous strategic investments made throughout 2021 as well as the four acquisitions completed during 2021.

Stockholder equity increase to $60 million at December 31, 2021, compared to $8 million at December 2020.

Outlook

iSun currently remains optimistic about the long-term outlook for the solar industry and its ability to capitalize on such growth. By servicing every segment of the solar marketplace with a comprehensive suite of services and products, iSun is capable of quickly responding to demand fluctuations in any one sector, or supply chain disruptions affecting any one service. iSun continues to study the impacts of recent market developments on each of its divisions and will revise its guidance if it feels there is a need to do so.

Fourth Quarter and Full Year 2021 Conference Call Details

iSun will host a conference call on Monday at 4:30 PM EST to review the Company’s financial results, discuss recent events, and conduct a question-and-answer session. Participants can access the live conference call via telephone at 888-506-0062, using Conference ID #608529. An archived audio replay will be available through Monday, May 2, 2022, at 877-481-4010, Conference ID# 44808.

Interested parties may also listen to the live audio of the conference call via webcast. To listen to a live broadcast, go to the site at least 15 minutes prior to the scheduled start time to register, download, and install any necessary audio software.

iSun, Inc.

Condensed Consolidated Balance Sheets

December 31, 2021 and 2020


2021


2020


Assets


Current Assets:


Cash


$

2,242,083


$

699,154


Accounts receivable, net of allowance


14,337,310


6,215,957


Costs and estimated earnings in excess of billings


4,003,979


1,354,602


Inventory


2,479,874


-


Other current assets


1,070,632


214,963


Total current assets


24,133,878


8,484,676


Property and equipment:


Building and improvements


966,603


672,727


Vehicles


2,908,472


1,199,535


Tools and equipment


3,126,673


508,846


Software


234,246


-


Construction in process


3,291


-


Solar arrays


6,859,374


6,386,025


14,098,659


8,767,133


Less accumulated depreciation


(3,056,406

)


(2,647,333

)


11,042,253


6,119,800


Other Assets:


Captive insurance investment


270,430


198,105


Goodwill


36,907,437


-


Intangible assets


18,906,330


-


Investments


12,420,496


4,820,496


Other assets


47,065


-


68,551,758


5,018,601


Total assets


$

103,727,889


$

19,623,077


Liabilities and Stockholders’ Equity


Current Liabilities:


Accounts payable, includes book overdraft of $0 and $1.5 million at December 31, 2021 and 2020, respectively


$

13,187,456


$

4,086,173


Accrued expenses


7,628,212


172,021


Billings in excess of costs and estimated earnings on uncompleted contracts


2,388,501


1,140,125


Due to stockholders


-


24,315


Line of credit


4,468,298


2,482,127


Current portion of deferred compensation


31,000


28,656


Current portion of long-term debt


6,694,296


308,394


Total current liabilities


34,397,763


8,241,811


Long-term liabilities:


Deferred compensation, net of current portion


27,884


62,531


Deferred tax liability


771,656


610,558


Warrant liability


148,013


1,124,411


Other liabilities


3,375,427


-


Long-term debt, net of current portion


5,148,855


1,701,495


Total liabilities


43,869,598


11,740,806


Commitments and Contingencies (Note 9)


Stockholders’ equity:


Preferred stock – 0.0001 par value 200,000 shares authorized, 0 and 200,000 issued and outstanding at December 31, 2021 and December 31, 2020, respectively


-


20


Common stock – 0.0001 par value 49,000,000 shares authorized, 11,825,878 and 5,313,268 issued and outstanding as of December 31, 2021 and 2020, respectively


1,183


531


Additional paid-in capital


60,863,388


2,577,359


(Accumulated deficit)/Retained earnings


(1,006,280

)


5,304,361


Total Stockholders’ equity


59,858,291


7,882,271


Total liabilities and stockholders’ equity


$

103,727,889


$

19,623,077


iSun, Inc.

Condensed Consolidated Statements of Operations (Unaudited)

For the Years Ended December 31, 2021 and 2020


2021


2020


Earned revenue


$

45,311,660


$

21,052,211


Cost of earned revenue


38,920,493


18,709,074


Gross profit


6,391,167


2,343,137


Warehouse and other operating expenses


1,308,527


684,669


General and administrative expenses


13,382,014


3,343,895


Stock based compensation - general and administrative


2,315,125


-


Total operating expenses


17,005,666


4,028,564


Operating loss


(10,614,499

)


(1,685,427

)


Other expenses


Gain on forgiveness of PPP loan


2,000,000


1,496,468


Change in fair value of warrant liability


976,398


(975,728

)

Interest expense


(517,718

)


(302,542

)


Loss before income taxes


(8,155,819

)


(1,467,229

)

Benefit for income taxes


(1,914,841

)


(487,173

)


Net loss


(6,240,978

)


(980,056

)


Preferred stock dividend


(69,663

)


(275,556

)


Net loss available to shares of common stockholders


$

(6,310,641

)


$

(1,255,612

)

Weighted average shares of common stock outstanding


Basic and diluted


9,264,919


5,301,471


Basic and diluted


$

(0.67

)


$

(0.24

)

Non-GAAP Financial Measures

Included in this presentation are discussions and reconciliations of earnings before interest, income tax and depreciation and amortization (“EBITDA”) and EBITDA adjusted for certain non-cash, non-recurring or non-core expenses (“Adjusted EBITDA”) to net loss in accordance with GAAP. Adjusted EBITDA excludes certain non-cash and other expenses, certain legal services costs, professional and consulting fees and expenses, and one-time Reverse Merger and Recapitalization expenses and certain adjustments. We believe that these non-GAAP measures illustrate the underlying financial and business trends relating to our results of operations and comparability between current and prior periods. We also use these non-GAAP measures to establish and monitor operational goals.

These non-GAAP measures are not in accordance with, or an alternative to, GAAP and should be considered in addition to, and not as a substitute or superior to, the other measures of financial performance prepared in accordance with GAAP. Using only the non-GAAP financial measures, particularly Adjusted EBITDA, to analyze our performance would have material limitations because such calculations are based on a subjective determination regarding the nature and classification of events and circumstances that investors may find significant. We compensate for these limitations by presenting both the GAAP and non-GAAP measures of our operating results. Although other companies may report measures entitled “Adjusted EBITDA” or similar in nature, numerous methods may exist for calculating a company’s Adjusted EBITDA or similar measures. As a result, the methods that we use to calculate Adjusted EBITDA may differ from the methods used by other companies to calculate their non-GAAP measures.

The reconciliations of EBITDA and Adjusted EBITDA to net loss, the most directly comparable financial measure calculated and presented in accordance with GAAP, are shown in the table below:

Year ended
December 31,


2021


2020


Net loss

$

(6,240,978

)


$

(980,056

)

Depreciation and amortization


981,975


585,690


Interest expense


517,718


302,542


Stock compensation


2,315,125


-


Change in fair value of warrant liability


(976,398

)


975,728


Income tax (benefit)


(1,914,841

)


(487,173

)

EBITDA


(5,317,399

)


396,731


Other costs(1)


1,418,135


-


Adjusted EBITDA

$

(3,899,264

)


$

396,731


Weighted Average shares outstanding


9,264,919


5,301,471


Adjusted EPS

$

(0.42

)


$

0.07


About iSun Inc.

Since 1972, iSun has accelerated the adoption of proven, life-improving innovations in electrification technology. iSun has been the trusted service provider to Fortune 500 companies for decades and has installed clean rooms, fiber optic cables, flight simulators, and over 600 megawatts of solar systems. Today, iSun is focused on accelerating the adoption of solar energy. The Company provides a comprehensive suite of solar services for each stage of solar development across all segments of the solar marketplace - residential, commercial, industrial & municipal, and utility. Additionally, iSun designs and installs electric vehicle charging solutions for both grid-tied and battery backed solar EV charging systems. iSun believes that the transition to clean, renewable solar energy is the most important investment to make today and is focused on profitable growth opportunities. Please visit http://www.isunenergy.com for additional information.

Forward Looking Statements

This press release includes forward-looking statements within the meaning of Section 27A of the Securities Act of 1933 and Section 21E of the Securities Exchange Act of 1934, which are made pursuant to the safe harbor provisions of the Private Securities Litigation Reform Act of 1995, as amended. Words or phrases such as "may," "should," "expects," "could," "intends," "plans," "anticipates," "estimates," "believes," "forecasts," "predicts" or other similar expressions are intended to identify forward-looking statements, which include, without limitation, earnings forecasts, effective tax rate, statements relating to our business strategy and statements of expectations, beliefs, future plans and strategies and anticipated developments concerning our industry, business, operations and financial performance and condition.

The forward-looking statements included in this press release are based on our current expectations, projections, estimates and assumptions. These statements are only predictions, not guarantees. Such forward-looking statements are subject to numerous risks and uncertainties that are difficult to predict. These risks and uncertainties may cause actual results to differ materially from what is forecast in such forward-looking statements, and include, without limitation, the risk factors described from time to time in our filings with the Securities and Exchange Commission, including our Annual Report on Form 10-K.

All forward-looking statements included in this press release are based on information currently available to us, and we assume no obligation to update any forward-looking statement except as may be required by law.


Contacts

IR Contact:
Tyler Barnes
This email address is being protected from spambots. You need JavaScript enabled to view it.
802-289-8141

NEWBURY PARK, Calif.--(BUSINESS WIRE)--Kolibri Global Energy Inc. (the “Company” or “KEI”) (TSX: KEI, OTCQB: KGEIF) is pleased to announce that the Barnes 7-3H well (98.07% working interest) has averaged over 940 Barrels of oil equivalent per day (BOEPD), of which over 740 barrels are oil, for 30 days. The Company also announces that the Barnes 8-4H well (99.8% working interest) has been successfully completed and is now flowing back the stimulation fluids. Both wells are located in the Company’s Tishomingo field in Oklahoma.


Wolf Regener, President and CEO, commented. “I am thrilled that the Barnes 7-3H well continues to perform exceptionally well. This is the highest producing Caney well that we have ever had due to the knowledge we have gained in this field and a great job of execution by our team. To put the performance of this well in perspective, the 30-day proved forecast curve case initial production rate (IP30) utilized by our third-party engineering firm for our reserve report is 388 BOEPD or 41% of what the Barnes 7-3H IP30 rate is. The initial 30-day type curve utilized by the Company’s management assumes a 472 BOEPD IP30 rate, which is half of the Barnes 7-3H IP30 rate. The Glenn 16-2H well, which was previously our best performing Caney well, had a 630 BOEPD IP30 rate, and it is projected to produce 765,000 barrels of oil equivalents (BOEs) based on our third-party engineering firm estimates”.

“The Barnes 8-4H well completion went very well thanks to the performance of our team with 10.3 million pounds of proppant being placed using the same stimulation design as was used on the Barnes 7-3H. The well is now flowing back the stimulation fluids, and we will share production rates with the market over the coming weeks. While the Barnes 8-4H well completion design and execution has been similar to the Barnes 7-3H well, we do not need rates as high as the Barnes 7-3H to make excellent wells. For example, if the Barnes 8-4H well performance matches the type curve utilized by the Company’s management, the well would be projected to generate a 145% Internal Rate of Return at a $100 a barrel oil price.”

We look forward to bringing on the additional new unhedged production at the current $100 a barrel oil price, which would add significant additional cash flow assuming the type curve utilized by the Company’s management is achieved.”

About Kolibri Global Energy Inc.

Kolibri Global Energy Inc. is an international energy company focused on finding and exploiting energy projects in oil, gas, and clean and sustainable energy. Through various subsidiaries, the Company owns and operates energy properties in the United States. The Company continues to utilize its technical and operational expertise to identify and acquire additional projects. The Company's shares are traded on the Toronto Stock Exchange under the stock symbol KEI and on the OTCQB under the stock symbol KGEIF.

Cautionary Statements

In this news release and the Company’s other public disclosure: The references to barrels of oil equivalent ("Boes") reflect natural gas, natural gas liquids and oil. Boes may be misleading, particularly if used in isolation. A Boe conversion ratio of 6 Mcf:1 Bbl is based on an energy equivalency conversion method primarily applicable at the burner tip and does not represent a value equivalency at the wellhead. Given that the value ratio based on the current price of crude oil as compared to natural gas is significantly different from the energy equivalency of 6:1, utilizing a conversion on a 6:1 basis may be misleading as an indication of value. Possible reserves are those additional reserves that are less certain to be recovered than probable reserves. There is a 10% probability that the quantities actually recovered will equal or exceed the sum of proved plus probable plus possible reserves. The type curve utilized by the Company’s management is the average of the 7 Caney wells that are located in the Corridor (well names can be found on the Company’s Corporate presentation), with lateral lengths normalized to a 4,900 ft lateral length, the other assumptions are the same as in the Company’s December 31, 2021 independent reserves evaluation.

Readers should be aware that references to initial production rates and other short-term production rates are preliminary in nature and are not necessarily indicative of long-term performance or of ultimate recovery. Readers are referred to the full description of the results of the Company's December 31, 2021 independent reserves evaluation and other oil and gas information contained in its Form 51-101F1 Statement of Reserves Data and Other Oil and Gas Information for the year ended December 31, 2021, which the Company filed on SEDAR on March 8, 2022.

Caution Regarding Forward-Looking Information

Certain statements contained in this news release constitute "forward-looking information" as such term is used in applicable Canadian securities laws and “forward-looking statements” within the meaning of United States securities laws (collectively, “forward looking information”), including statements regarding the timing of and expected results from planned wells development, the expected timing to finish completion operations, the expected timing of stabilized production rates, a projected Internal Rate of Return, $100 a barrel oil price, and the Company bringing on additional new production with unhedged current pricing of over $100 per barrel. Forward-looking information is based on plans and estimates of management and interpretations of data by the Company's technical team at the date the data is provided and is subject to several factors and assumptions of management, including that that indications of early results are reasonably accurate predictors of the prospectiveness of the shale intervals, management’s assumption of a 472 BOEPD IP30 rate for the initial 30-day type curve, $100 a barrel oil price, that required regulatory approvals will be available when required, that no unforeseen delays, unexpected geological or other effects, including flooding and extended interruptions due to inclement or hazardous weather conditions, equipment failures, permitting delays or labor or contract disputes are encountered, that the necessary labor and equipment will be obtained, that the development plans of the Company and its co-venturers will not change, that the offset operator’s operations will proceed as expected by management, that the demand for oil and gas will be sustained, that the price of oil will be sustained or increase, that the Company will continue to be able to access sufficient capital through financings, farm-ins or other participation arrangements to maintain its projects, and that global economic conditions will not deteriorate in a manner that has an adverse impact on the Company's business, its ability to advance its business strategy and the industry as a whole. Forward-looking information is subject to a variety of risks and uncertainties and other factors that could cause plans, estimates and actual results to vary materially from those projected in such forward-looking information. Factors that could cause the forward-looking information in this news release to change or to be inaccurate include, but are not limited to, the risk that any of the assumptions on which such forward looking information is based vary or prove to be invalid, including that the Company or its subsidiaries is not able for any reason to obtain and provide the information necessary to secure required approvals or that required regulatory approvals are otherwise not available when required, that unexpected geological results are encountered, that equipment failures, permitting delays, labor or contract disputes or shortages of equipment or labor are encountered, the risks associated with the oil and gas industry (e.g. operational risks in development, exploration and production; delays or changes in plans with respect to exploration and development projects or capital expenditures; the uncertainty of reserve and resource estimates and projections relating to production, costs and expenses, and health, safety and environmental risks, including flooding and extended interruptions due to inclement or hazardous weather conditions), the risk of commodity price and foreign exchange rate fluctuations, that the offset operator’s operations have unexpected adverse effects on the Company’s operations, that completion techniques require further optimization, that production rates do not match the Company’s assumptions, that very low or no production rates are achieved, that the price of oil will decline, that the Company is unable to access required capital, that occurrences such as those that are assumed will not occur, do in fact occur, and those conditions that are assumed will continue or improve, do not continue or improve, and the other risks and uncertainties applicable to exploration and development activities and the Company's business as set forth in the Company's management discussion and analysis and its annual information form, both of which are available for viewing under the Company's profile at www.sedar.com, any of which could result in delays, cessation in planned work or loss of one or more concessions and have an adverse effect on the Company and its financial condition. The Company undertakes no obligation to update these forward-looking statements, other than as required by applicable law.


Contacts

Wolf E. Regener +1 (805) 484-3613
Email: This email address is being protected from spambots. You need JavaScript enabled to view it.
Website: www.kolibrienergy.com

Planned Meetings through May also listed

HOUSTON--(BUSINESS WIRE)--The Port Commission of the Port of Houston Authority will hold its regular monthly meeting on Tuesday, April 26, 2022. It will be conducted as a hybrid meeting and will start at 9:15 a.m. The Commissioners, executive leadership, and legal counsel will be present in the boardroom of the Port Authority Executive Office Building, located at 111 East Loop North, Houston, TX 77029.


The meeting is open to the public to attend. However, the meeting can also be accessed virtually via WebEx webinar.

The agenda and the instructions to access Port Houston public meetings are available at https://porthouston.com/leadership/public-meetings/.

Please note the following upcoming planned Port Houston public meetings (subject to change):

Apr 18

10:00 a.m.

Audit Committee meeting

Apr 19

11:00 a.m.

Business Equity Committee meeting

Apr 26

9:15 a.m.

Port Commission regular meeting

May 24

9:15 a.m.

Port Commission regular meeting

Sign up for public comment is available up to an hour before these meetings by contacting Erik Eriksson at This email address is being protected from spambots. You need JavaScript enabled to view it. or Liana Christian at This email address is being protected from spambots. You need JavaScript enabled to view it..

About Port Houston

For more than 100 years, Port Houston has owned and operated the public wharves and terminals along the Houston Ship Channel – the nation’s largest port for waterborne tonnage and an essential economic engine for the Houston region, the state of Texas, and the U.S. nation. The more than 200 private and eight public terminals along the federal waterway supports the creation of nearly 1.35 million jobs in Texas and 3.2 million jobs nationwide, and economic activity totaling $339 billion in Texas – 20.6% of Texas’ total gross domestic product (GDP) – and a total of $801.9 billion in economic impact across the nation. For more information, visit the website: https://porthouston.com/.


Contacts

Lisa Ashley-Daniels, Director, Media Relations, Port Houston
Office: 713-670-2644; Mobile: 832-247-8179; E-mail: This email address is being protected from spambots. You need JavaScript enabled to view it.

  • CEMEX has joined a consortium that will combine hydrogen and CO2 into sustainable fuel for the aviation industry.
  • CEMEX joins forces with Sasol and ENERTRAG in this milestone project.
  • The consortium is part of a series of efforts to turn CEMEX’s Rüdersdorf plant into the first-ever net-zero CO2 cement plant.

MONTERREY, Mexico--(BUSINESS WIRE)--CEMEX, S.A.B. de C.V. (“CEMEX”) continues its path to a net-zero future by joining forces with integrated chemicals and energy company Sasol ecoFT and renewable energy company ENERTRAG in a milestone project that will combine CO2 with hydrogen to produce sustainable aviation fuel. This project is part of CEMEX's Future in Action program to reduce its carbon footprint and contribute to a circular economy and an integral component of CEMEX’s master plan to develop a carbon neutral operation at its Rüdersdorf cement plant by 2030.


The consortium will source green hydrogen generated exclusively from wind and solar energy from ENERTRAG. The CO2 will come from CEMEX’s Rüdersdorf cement plant in Germany, which will provide 100 tons of CO2 per day in the project’s initial stages. Sasol ecoFT will then contribute its innovative technology to produce e-kerosene, which, once certified, can be blended to constitute up to 50% of jet fuel.

“We are excited to be part of this groundbreaking project that will contribute to the decarbonization of two of the world’s key industries,” said Fernando A. Gonzalez, CEO of CEMEX. “The path to carbon neutrality will be built with innovation, and we remain committed to being at the forefront in developing new circular technologies and processes.”

Sixty per cent of the carbon emissions in the cement production process come from the chemical reaction that occurs in cement kilns. To reach carbon neutrality, these emissions must be captured, stored, or repurposed in some way. CEMEX is leading the way in these technologies through partnerships with other industries, the work of its R&D center, and investments from its venture capital arm, CEMEX Ventures.

The Rüdersdorf carbon neutral alliance includes over 20 startups, universities, companies from other industries, and authorities working to develop industrial-scale solutions using leading-edge technologies to achieve the first carbon-neutral cement plant in the world.

About ENERTRAG
ENERTRAG is a renewable-energy company based in Brandenburg, Germany. ENERTRAG develops, builds, owns, and operates utility-scale integrated energy plants in ten countries globally. ENERTRAG’s plants produce reliable electricity and green hydrogen exclusively from wind and sun. This is also the company’s role in the Concrete Chemicals consortium.

About Sasol ecoFT
Sasol ecoFT is part of the Sasol Group and world-leader in the development and application of the Fischer-Tropsch (FT) technology with more than 70 years’ experience. Sasol ecoFT leverages it proprietary technology, know-how and expertise to produce sustainable fuels and chemicals from green hydrogen and sustainable carbon sources, via the Power-to-Liquids (PtL) process. By deploying sustainable FT solutions globally, the company contributes to a thriving planet, society, enterprise and innovate for a better world.

About CEMEX
CEMEX (NYSE: CX) is a global construction materials company that is building a better future through sustainable products and solutions. CEMEX is committed to achieving carbon neutrality through relentless innovation and industry-leading research and development. CEMEX is at the forefront of the circular economy in the construction value chain and is pioneering ways to increase the use of waste and residues as alternative raw materials and fuels in its operations with the use of new technologies. CEMEX offers cement, ready-mix concrete, aggregates, and urbanization solutions in growing markets around the world, powered by a multinational workforce focused on providing a superior customer experience, enabled by digital technologies. For more information, please visit: cemex.com

CEMEX assumes no obligation to update or correct the information contained in this press release. This press release contains forward-looking statements within the meaning of the U.S. federal securities laws. CEMEX intends these forward-looking statements to be covered by the safe harbor provisions for forward-looking statements in the U.S. federal securities laws. These forward-looking statements reflect CEMEX’s current expectations and projections about future events based on CEMEX’s knowledge of present facts and circumstances and assumptions about future events, as well as CEMEX’s current plans based on such facts and circumstances. These statements necessarily involve risks and uncertainties that could cause actual results to differ materially from CEMEX’s expectations. The content of this press release is for informational purposes only, and you should not construe any such information or other material as legal, tax, investment, financial, or other advice. CEMEX is not responsible for the content of any third-party website or webpage referenced to or accessible through this press release.


Contacts

Media Relations
Jorge Pérez
+52 (81) 8259-6666
This email address is being protected from spambots. You need JavaScript enabled to view it.

Analyst and Investor Relations
Alfredo Garza / Fabián Orta
+1 (212) 317-6011
+52 (81) 8888-4327
This email address is being protected from spambots. You need JavaScript enabled to view it.

SEATTLE--(BUSINESS WIRE)--Convoy, the nation’s leading digital freight network, today announced that Sonia Jain has been appointed Chief Financial Officer, effective April 25, 2022. Jain will assume the role from Convoy’s President & Chief Operating Officer, Mark Okerstrom, who has served as acting CFO since December 2020. In this role, Jain will leverage her 15+ years of experience in finance leadership and strategy roles to oversee Convoy’s finance function. Jain will report directly to Mark Okerstrom.


Jain joins Convoy from Cars.com (NYSE: CARS), where she has been Chief Financial Officer since 2020. Sonia has extensive expertise in accounting, finance & analytics, treasury, investor relations and strategic planning. Prior to joining Cars.com, Jain spent 10 years with Redbox/Outerwall and prior to that spent several years at both Morgan Stanley and McKinsey & Company. During her tenure as Redbox’s finance chief, Sonia was instrumental in the company’s acquisition by Apollo Global Management and played a critical leadership role in the successful launch of its Redbox On Demand online video store.

“We’re so excited to have Sonia join Convoy as our Chief Financial Officer,” said Mark Okerstrom, President & COO of Convoy. “Sonia’s hands-on, operational-finance capabilities together with her strategic finance leadership experience in both private and public company contexts make her the ideal choice to lead Convoy’s finance function through our next chapter of growth. I look forward to partnering with Sonia as Convoy continues to lead the digital transformation of freight.”

“Convoy has a massive market opportunity and a world-class team that I am excited and honored to be joining," said Sonia Jain, incoming Convoy Chief Financial Officer. “Convoy’s mission is big and never more important than it is today - to transport the world with endless capacity and zero waste. That mission combined with the company’s values, its incredible team and the opportunity to help Convoy achieve its enormous growth potential, drove me to jump at the opportunity to join the team.”

About Convoy
Convoy is the nation’s leading digital freight network. We move thousands of truckloads around the country each day through our optimized, connected network of carriers, saving money for shippers, increasing earnings for drivers, and eliminating carbon waste for our planet. We use technology and data to solve problems of waste and inefficiency in the $800B trucking industry, which generates over 87 million metric tons of wasted CO2 emissions from empty trucks. Fortune 500 shippers like Anheuser-Busch, P&G, Niagara, and Unilever trust Convoy to lower costs, increase logistics efficiency, and achieve environmental sustainability targets.


Contacts

Media Contact:
Sarah Bergstrom-Leach
425-381-0665

CALGARY, Alberta--(BUSINESS WIRE)--(TSE: IMO, NYSE American: IMO) Brad Corson, chairman, president and chief executive officer, and Dave Hughes, vice-president, investor relations, Imperial Oil Limited, will host a 2022 First Quarter Earnings Call on Friday, April 29, following the company’s first quarter earnings release that morning. The event begins at 9 a.m. MT and will be accessible by webcast.


During the call, Mr. Corson will offer brief remarks prior to taking questions from Imperial’s covering analysts.

Please click here [https://edge.media-server.com/mmc/p/2z9q5qtx] to register for the live webcast. The webcast will be available for one year on the company’s website at www.imperialoil.ca/en-ca/company/investors.

Source: Imperial

After more than a century, Imperial continues to be an industry leader in applying technology and innovation to responsibly develop Canada’s energy resources. As Canada’s largest petroleum refiner, a major producer of crude oil, a key petrochemical producer and a leading fuels marketer from coast to coast, our company remains committed to high standards across all areas of our business.


Contacts

Investor relations
(587) 476-4743

Media relations
(587) 476-7010

TAIPEI, Taiwan--(BUSINESS WIRE)--E.SUN FHC, taking the initiative to follow the international trend and achieve the goals of COP26, announced coal phase-out by 2035 on April 11. This policy applies to all E.SUN FHC subsidiaries and overseas locations and encompasses actively managing carbon emissions from financial assets, increasing green assets, reducing gray assets in investment and financing, and promoting social energy transformation and global climate goals through the allocation of financial resources.


E.SUN FHC addresses companies with more than 5% of their revenue from business activities in coal and unconventional oil & gas — the former includes coal-fired power, coal mining and infrastructure, coal trading, and coal transport; the latter includes tar sands, shale oil & gas, Arctic oil & gas, ultra-deep-water oil & gas, and liquefied natural gas from unconventional fossil fuels. Excluding the funds earmarked to assist these companies in carbon reduction, E.SUN FHC will have no exposure including investing and financing to coal and unconventional oil & gas industries by the end of 2035. Bonds sold to customers that involve companies related to coal and unconventional oil & gas will all be labeled by the end of 2030 and will cease to be sold by the end of 2035.

In a statement of Magi Chen (陳美滿), President and Chief Sustainability Officer of E.SUN FHC, the Company stopped financing coal-fired power plant projects in 2019 and is further committed to phase-out of coal and unconventional oil & gas industries. This is a significant milestone for the Company on the road to net zero. The Company hopes to leverage the influence of the financial sector to assist the global energy system with coal phase-out. E.SUN FHC obtained approved target notice from the Science Based Targets initiative (SBTi) this February, and is the first financial institution in Taiwan and the second in Asia to complete the SBTi target review. To achieve the SBTi targets, E.SUN FHC has not only gradually changed the policies and procedures of its investment and financing business, but also provides consulting services for companies it has dealing with on shift to sustainable development and carbon reduction. E.SUN FHC encourages companies to conduct carbon inventories and set carbon reduction targets. Companies that apply for sustainability linked loans and achieve their carbon reduction targets can also enjoy preferential loan rates.


Contacts

Public Relations, E.SUN FHC
Virginia Lin
This email address is being protected from spambots. You need JavaScript enabled to view it.
(+8862)2175-1335

PROVIDENCE, R.I.--(BUSINESS WIRE)--Textron Inc. (NYSE: TXT) today announced that it has closed its acquisition of PIPISTREL d.o.o., PIPISTREL VERTICAL SOLUTIONS d.o.o. and PIPISTREL ITALIA S.R.L., known collectively as Pipistrel, an award-winning pioneer and global leader in electrically powered aircraft.


Pipistrel’s Velis Electro is the world’s first, and currently only, electric aircraft to receive full type-certification from the European Union Aviation Safety Agency (EASA). The company, which offers a family of gliders and light aircraft with both electric and combustion engines, has delivered more than 2,500 light aircraft worldwide since its founding in 1989 and additionally has both hybrid and electric propulsion models under development.

As a Textron company, Pipistrel will have access to greater resources, technical and regulatory expertise and a global aircraft sales and support network, enabling it to accelerate its development and certification of electric and hybrid electric aircraft. Pipistrel is now part of Textron’s newest business segment, Textron eAviation, which will pursue Textron’s long-term strategy to offer a family of sustainable aircraft for urban air mobility, general aviation, cargo and special mission roles. Rob Scholl, who has been leading Textron’s eAviation initiatives to date, has been named president and CEO of the segment.

Pipistrel has already achieved what many other companies only aspire to – certifying and delivering highly regarded electric aircraft to customers around the world,” said Textron Chairman and CEO Scott Donnelly. “We are excited to accelerate Pipistrel’s development and to welcome its talented people into our organization, where we will pool expertise to make Textron a world leader in sustainable aircraft for a wide range of missions.”

Pipistrel will remain a distinct aviation brand within Textron, alongside the company’s already established Cessna, Beechcraft, and Bell brands. Its headquarters, research and development, and manufacturing will remain in Slovenia and Italy, where Textron plans to make additional investments to expand manufacturing and product development capabilities.

With Pipistrel, we have the opportunity to take an already great aircraft manufacturer and make it greater still,” said Textron eAviation CEO Rob Scholl. “We look forward to working with its remarkable team and helping the business achieve its full potential.”

Under the terms of the transaction, Textron purchased Pipistrel for a cash purchase price of approximately €218 million. Pipistrel’s founder and CEO, Ivo Boscarol, will remain a minority shareholder of Pipistrel with an approximately 10 percent interest for a two-year period, during which he will advise on future product plans and strategies. The cash purchase price includes the amount for which his minority interest will be purchased at the end of the two-year period.

About Textron Inc.

Textron Inc. is a multi-industry company that leverages its global network of aircraft, defense, industrial and finance businesses to provide customers with innovative solutions and services. Textron is known around the world for its powerful brands such as Bell, Cessna, Beechcraft, Pipistrel, Jacobsen, Kautex, Lycoming, E-Z-GO, Arctic Cat, and Textron Systems. For more information, visit: www.textron.com.

About Pipistrel

In 2020, Pipistrel’s Velis Electro became the world’s first, and currently only, electric aircraft to receive full type-certification from the European Union Aviation Safety Agency (EASA). This achievement followed a series of electric aircraft introductions since the company began research and development of electric propulsion in 2000. Pipistrel’s pioneering work has been recognized through awards from NASA, IDC, and other organizations. The company, which offers a family of gliders and light aircraft with both electric and combustion engines, has delivered more than 2,500 light aircraft worldwide since its founding in 1989 and additionally has both hybrid and electric propulsion models under development.

www.pipistrel-aircraft.com

About Textron eAviation

Headquartered in Wichita, Kansas, Textron eAviation is focused on sustainable flying, backed by Textron’s 100 years of expertise and the restless spirit for innovation that is embodied in our Pipistrel, Cessna, Beechcraft and Bell brands.

Taking the lead in Textron’s development of sustainably powered flight, Textron eAviation is leveraging the industry-leading product design, certification, manufacturing, and aftermarket solutions from across Textron’s businesses coupled with the newly acquired expertise of Pipistrel.

Certain statements in this press release are forward-looking statements which may project revenues or describe strategies, goals, outlook or other non-historical matters; these statements speak only as of the date on which they are made, and we undertake no obligation to update or revise any forward-looking statements. These statements are subject to known and unknown risks, uncertainties, and other factors that may cause our actual results to differ materially from those expressed or implied by such forward-looking statements, including, but not limited to, difficulty or unanticipated expenses in connection with integrating the acquired business; the risk that anticipated synergies and opportunities as a result of the acquisition will not be realized; the efficacy of research and development investments to develop and certify new electric and hybrid electric aircraft products; unanticipated expenses or delays in connection with the launching of such new products; and our ability to keep pace with our competitors in the introduction of such new products.


Contacts

Media:
Michael Maynard
This email address is being protected from spambots. You need JavaScript enabled to view it.
401-457-2362

Facility Provides Flexibility to Fuel Growth Strategy

JACKSONVILLE, Fla.--(BUSINESS WIRE)--$RDW--Redwire Corporation (NYSE: RDW; “Redwire” or “the Company”), a leader in mission critical space solutions and high reliability components for the next generation space economy, today announced that it has entered into an $80 million common stock purchase agreement with B. Riley Principal Capital, LLC (“B. Riley”) to further support its growth strategy through initiatives such as accretive acquisitions and internal investments, to bolster working capital, and/or for general corporate purposes. The agreement governs a committed equity facility that provides the Company with the right, without obligation, to sell and issue up to $80 million of its common stock over a period of 24 months to B. Riley at the Company’s sole discretion, subject to certain limitations and conditions.


“Redwire is a rapidly growing leader in space. Having financial flexibility is key to successfully executing our growth strategy,” said Peter Cannito, Chairman and CEO. “We have evaluated the capital markets and believe that this agreement is the most cost-effective option to provide incremental capital when needed to thoughtfully fuel growth. The agreement allows us the discretion to raise additional capital when market conditions are favorable and there is a specific need.”

This press release is for informational purposes only and it does not represent an offer to sell or the solicitation of an offer to buy any of the Company’s common stock. There will be no sale of common stock in any jurisdiction in which one would be unlawful.

Further details are contained in a Current Report on Form 8-K filed with the Securities and Exchange Commission on April 15, 2022.

About Redwire

Redwire Corporation (NYSE: RDW) is a leader in space infrastructure for the next generation space economy, with valuable IP for solar power generation and in-space 3D printing and manufacturing. With decades of flight heritage combined with the agile and innovative culture of a commercial space platform, Redwire is uniquely positioned to assist its customers in solving the complex challenges of future space missions. For more information, please visit www.redwirespace.com.

Forward Looking Statements

This press release may contain “forward-looking statements” about Redwire's future expectations, plans, outlook, projections and prospects. Such forward-looking statements can be identified by the use of words such as “should,” “may,” “intends,” “anticipates,” “believes,” “estimates,” “projects,” “forecasts,” “expects,” “plans,” “proposes” and similar expressions. Although Redwire believes that the expectations reflected in these forward-looking statements are based on reasonable assumptions, there are a number of risks and uncertainties that could cause actual results to differ materially from such forward-looking statements. You are urged to carefully review and consider any cautionary statements and other disclosures, including the statements made under the heading “Risk Factors” in our Annual Report on Form 10-K for the year ended December 31, 2021. Forward-looking statements speak only as of the date of the document in which they are contained, and Redwire does not undertake any duty to update any forward-looking statements except as may be required by law.


Contacts

Investor Contact:
Michael Shannon
This email address is being protected from spambots. You need JavaScript enabled to view it.
904-425-1413

Engages with WEX|EFS to Provide Expanded Purchase Options at Travel Centers

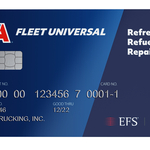
WESTLAKE, Ohio--(BUSINESS WIRE)--TravelCenters of America Inc. (Nasdaq: TA), nationwide operator and franchisor of the TA, Petro Stopping Centers and TA Express travel center network, announced today the launch of TA Fleet Universal, a new fleet card payment program, powered by WEX Inc.’s (NYSE: WEX) global commerce platform. The new TA Fleet Universal card can be used at all 275 TA, Petro or TA Express travel centers and at 16,000 truck stops and 95% of retail fueling stations nationwide where WEX network cards are accepted. Cardholders may benefit from fuel and product discounts and additional perks that will soon be available for TA’s UltraOne Loyalty Program members as well.


“The TA Fleet Universal Credit Card program increases driver convenience and supports our commitment to enhance the guest experience nationwide,” said Jon Pertchik, Chief Executive Officer of TravelCenters of America. “Engaging with WEX’s powerful global platform allows us to provide professional drivers a competitive, quality program with many benefits and purchasing options when visiting us.”

“We are excited to partner with TravelCenters of America and leverage our technology platform to bring this new program to the market,” said Tim Hampton, Senior Vice President, OTR Americas at WEX. “We have a nearly four-decade history of serving the transportation industry and are committed to working with industry leaders like TravelCenters of America to continue to bring new technologies to market that will help businesses and commercial fleets simplify their operations and run more efficiently.”

About TravelCenters of America

TravelCenters of America Inc. (Nasdaq: TA) is the nation's largest publicly traded full-service travel center network. Founded in 1972 and headquartered in Westlake, Ohio, its more than 18,000 team members serve guests in 275 locations in 44 states, principally under the TA®, Petro Stopping Centers® and TA Express® brands. Offerings include diesel and gasoline fuel, truck maintenance and repair, full-service and quick-service restaurants, travel stores, car and truck parking and other services dedicated to providing great experiences for its guests. TA is committed to sustainability, with its specialized business unit, eTA, focused on sustainable energy options for professional drivers and motorists, and leverages alternative energy to support its own operations. TA operates over 600 full-service and quick-service restaurants and nine proprietary brands, including Iron Skillet® and Country Pride®. For more information, visit www.ta-petro.com.

About WEX

WEX (NYSE: WEX) is the global commerce platform that simplifies the business of running a business. WEX has created a powerful ecosystem that offers seamlessly embedded, personalized solutions for its customers around the world. Through its rich data and specialized expertise in simplifying benefits, reimagining mobility and paying and getting paid, WEX aims to make it easy for companies to overcome complexity and reach their full potential. For more information, please visit www.wexinc.com.


Contacts

Media:

TravelCenters of America
Tina Arundel
This email address is being protected from spambots. You need JavaScript enabled to view it.

WEX
Kellie Jones
This email address is being protected from spambots. You need JavaScript enabled to view it.

CEO Steve Edwards to retire after 44 years with global infrastructure leader


OVERLAND PARK, Kan.--(BUSINESS WIRE)--The Black & Veatch Board of Directors today announces it has selected Mario Azar as the chairman and CEO for the company upon the decision of Steve Edwards to retire after 44 years of outstanding leadership, service and dedication. Azar, currently serving as president, Energy & Process Industries, becomes only the eighth senior leader in the founder, managing partner or chair role in Black & Veatch’s 107-year history.

“As global megatrends reshape the critical infrastructure markets we serve, the Black & Veatch Board of Directors is thrilled to select Mario based on his vast global experience, proven leadership capabilities, innovative and collaborative approach and strong focus on client relationships,” said Edwards. “Since joining the company in 2018, Mario has been the architect of an effort that is repowering the power industry; as well as in the strategic repositioning of our company to address the megatrends our clients and the world faces. This success, and Mario’s leadership throughout our company-wide transformation, highlight the unique skills and experience that make him the ideal choice to lead the company into the future.”

Azar’s global leadership experience spans more than 32 years in the energy and industrial fields, much of it in engineering and construction solutions. Prior to joining Black & Veatch in 2018 as the president of the global power business, Azar served in multiple executive roles and led large global businesses at Siemens, and previously Westinghouse, including as CEO of Siemens Oil & Gas and Marine, an engineered solutions and integration business unit operating globally in over 21 countries. He also founded a private consulting firm focused on energy and heavy industry.

“It is a true honor to be selected to lead Black & Veatch, a company with such deep history and a stellar reputation built by a world-class team of global professionals,” Azar said. “The portfolio of solutions Black & Veatch offers, coupled with our transformed business model aligning with the megatrends reshaping our world, positions us to continue fulfilling our mission of Building a World of Difference for generations to come. I am excited about the future of our company and growing partnerships with our clients as their business needs evolve.”

The company will name a successor to fill Azar’s current role in the near future.

Editor’s Notes:

  • Edwards was appointed to the Black & Veatch Board of Directors in 2012 and was named chief operating officer in March 2013 in a transition role before becoming chair, president and CEO in 2014. His career includes leadership of energy projects in North America, Southeast Asia, Australia, the GCC and India.
  • Azar earned a Bachelor of Science in electrical engineering from the University of North Carolina at Charlotte.
  • Please click here to download high-resolution images of Steve Edwards and Mario Azar and to access additional information.

About Black & Veatch

Black & Veatch is a 100-percent employee-owned global engineering, procurement, consulting and construction company with a more than 100-year track record of innovation in sustainable infrastructure. Since 1915, we have helped our clients improve the lives of people around the world by addressing the resilience and reliability of our most important infrastructure assets. Our revenues in 2020 exceeded US$3.0 billion. Follow us on www.bv.com and on social media.


Contacts

CARL PETZ | +1 913-458-4685 P | +1 913-484-9581 M | This email address is being protected from spambots. You need JavaScript enabled to view it.
24-HOUR MEDIA HOTLINE | +1 855-999-5991

WALTHAM, Mass.--(BUSINESS WIRE)--Global Partners LP (NYSE: GLP) (the “Partnership”) announced today that the Board of Directors (the “Board”) of its general partner, Global GP LLC, has declared a cash distribution of $0.609375 per unit ($2.4375 per unit on an annualized basis) on the Partnership’s Series A preferred units for the period from February 15, 2022 through May 14, 2022. This distribution will be payable on May 16, 2022 to holders of record as of the opening of business on May 2, 2022.


The Board also declared a cash distribution of $0.59375 per unit ($2.375 per unit on an annualized basis) on the Partnership’s Series B preferred units for the period from February 15, 2022 through May 14, 2022. This distribution will be payable on May 16, 2022 to holders of record as of the opening of business on May 2, 2022.

Non-U.S. Withholding Information

This press release is intended to be a qualified notice under Treasury Regulation Section 1.1446-4(b). Brokers and nominees should treat one hundred percent (100%) of GLP’s distributions to non-U.S. investors as being attributable to income that is effectively connected with a United States trade or business. Accordingly, GLP’s distributions to non-U.S. investors are subject to federal income tax withholding at the highest applicable effective tax rate.

About Global Partners LP

With approximately 1,700 locations primarily in the Northeast, Global Partners is one of the region’s largest independent owners, suppliers and operators of gasoline stations and convenience stores. Global also owns, controls or has access to one of the largest terminal networks in New England and New York, through which it distributes gasoline, distillates, residual oil and renewable fuels to wholesalers, retailers and commercial customers. In addition, Global engages in the transportation of petroleum products and renewable fuels by rail from the mid-continental U.S. and Canada. Global, a master limited partnership, trades on the New York Stock Exchange under the ticker symbol “GLP.” For additional information, visit www.globalp.com.

Forward-looking Statements

Certain statements and information in this press release may constitute “forward-looking statements.” The words “believe,” “expect,” “anticipate,” “plan,” “intend,” “foresee,” “should,” “would,” “could” or other similar expressions are intended to identify forward-looking statements, which are generally not historical in nature, although not all forward-looking statements contain such identifying words. These forward-looking statements are based on Global’s current expectations and beliefs concerning future developments and their potential effect on the Partnership. While management believes that these forward-looking statements are reasonable as and when made, there can be no assurance that future developments affecting the Partnership will be those that it anticipates. Forward-looking statements involve significant risks and uncertainties (some of which are beyond the Partnership’s control) including, without limitation, the impact and duration of the COVID-19 pandemic, uncertainty around the timing of an economic recovery in the United States which will impact the demand for the products we sell and the services that we provide, uncertainty around the impact of the COVID-19 pandemic to our counterparties and our customers and their corresponding ability to perform their obligations and/or utilize the products we sell and/or services we provide, uncertainty around the impact and duration of federal, state and municipal regulations related to the COVID-19 pandemic, and assumptions that could cause actual results to differ materially from the Partnership’s historical experience and present expectations or projections.

For additional information regarding known material factors that could cause actual results to differ from the Partnership’s projected results, please see Global’s filings with the SEC, including its Annual Report on Form 10-K, Quarterly Reports on Form 10-Q and Current Reports on Form 8-K.

Readers are cautioned not to place undue reliance on forward-looking statements, which speak only as of the date hereof. Global undertakes no obligation to publicly update or revise any forward-looking statements after the date they are made, whether as a result of new information, future events or otherwise.


Contacts

Gregory B. Hanson
Chief Financial Officer
Global Partners LP
(781) 894-8800

Sean T. Geary
Chief Legal Officer and Secretary
Global Partners LP
(781) 894-8800

TULSA, Okla.--(BUSINESS WIRE)--Today, Cypress Environmental Partners, L.P., (NYSE: CELP) (“Cypress”) reported its financial results for the three months and year ended December 31, 2021.


FINANCING

Cypress continues to work with Deutsche Bank AG, its credit facility Administrative Agent, Lead Arranger and Bookrunner, and the six other banks (“Lenders”) and their financial and legal advisors regarding the credit agreement that matures on May 31, 2022. Because the credit agreement matures within one year, the financial statements in Cypress’s Annual Report on Form 10-K disclose substantial doubt about its ability to continue as a going concern, as defined under U.S. Generally Accepted Accounting Principles. This condition resulted in the auditor’s report on the financial statements including a “going concern” uncertainty paragraph, which is an event of default of the credit agreement.

Cypress, with the support of the Lenders, has engaged Piper Sandler to solicit potential debt and equity investors to submit proposals to recapitalize Cypress and has received several proposals that are currently being evaluated by the board of directors and the Lenders.

Cypress also continues to negotiate with contingent fee plaintiffs’ lawyers to resolve litigation and arbitration exposure regarding Fair Labor Standards Act (“FLSA”) claims and associated indemnification demands from customers against whom some such claims have been asserted. Cypress has entered into a settlement covering more than 60 plaintiffs and resolving all of the claims asserted directly against the Company. The ability to resolve such exposure has been an important factor in Cypress’s ability to obtain a renewal from the current Lenders and remains an important element of successfully raising new capital without an in-court restructuring. Cypress and the Lenders may pursue a number of options, including but not limited to the possibility of i) a sale of the debt to a third party; ii) a sale of the debt to a related party; iii) entering into an agreement with a new investor for a stalking horse bid that would lead to an in-court restructuring and section 363 process; or some combination of these actions which may include a court-supervised restructuring. Cypress has incurred and expects to continue to incur significant legal and advisory fees in developing its financing plans. Under the current credit agreement Cypress is responsible for the Lender-mandated legal and financial advisor expenses, which have now exceeded $2.5 million dollars.

The New York Stock Exchange (the “NYSE”) continues to monitor trading in Cypress’s common units for compliance with the NYSE’s requirement of a $15 million market capitalization over 30 trading days; the failure to satisfy this requirement would result in immediate suspension and commencement of delisting procedures. It is likely that Cypress’s common units would be delisted from the NYSE in the event of any restructuring or liquidation proceeding. Such a proceeding would also likely lead to Cypress’s common and preferred equity (including accrued and unpaid distributions) having no value, given the amount of Cypress’s senior secured debt, which is currently $58.1 million.

Cypress believes that its Lenders are fully aligned on the importance of business continuity and normal operations to ensure ongoing reliable service to Cypress’s customers. Cypress and the Lenders intend to complete the process described above without disruption to customers, inspectors, and other employees.

FINANCIAL HIGHLIGHTS

  • Cash balance of $8.3 million at December 31, 2021.
  • Outstanding borrowings of $54.2 million on the credit facility at December 31, 2021.
  • Net loss attributable to common unitholders of $4.1 million for the three months ended December 31, 2021.
  • Adjusted EBITDA of $(0.3 million) for the three months ended December 31, 2021.
  • Distributable cash flow (“DCF”) of $(1.5 million) for the three months ended December 31, 2021.
  • Common unit and preferred unit distributions remain suspended.

FOURTH QUARTER 2021 SUMMARY FINANCIAL RESULTS


Three Months Ended


December 31,


2021

2020


(Unaudited)


(in thousands)


Net loss

$

(2,675)

$

(675)

Net loss attributable to common unitholders

$

(4,099)

$

(1,906)

Net loss per common limited partner unit – basic and diluted

$

(0.34)

$

(0.16)

Adjusted EBITDA (1)

$

(284)

$

1,469

Distributable cash flow (1)

$

(1,546)

$

(810)

(1)

This press release includes the following financial measures not presented in accordance with U.S. generally accepted accounting principles, or GAAP: adjusted EBITDA, adjusted EBITDA attributable to limited partners, and distributable cash flow. Each such non-GAAP financial measure is defined below under “Non-GAAP Financial Information”, and each is reconciled to its most directly comparable GAAP financial measure in schedules at the end of this press release.

CEO'S PERSPECTIVE

“2021 was another difficult year, however I am proud of how our employees navigated the second straight year of COVID-19. Despite over six months of negotiations, we regret that we have been unable to reach an agreement with our Lenders and therefore face the possibility of restructuring. Insiders (management, board, and individuals that control the general partner) own 76% of our equity (common and preferred units) and remain fully aligned with the minority unitholders. The FLSA wage litigation that swept through the inspection industry over the last several years has been expensive and time consuming for our customers, our competitors, and us. We were successful in negotiating a settlement covering over 60 cases; however, we have been unable to reach a global resolution despite months of negotiations. Regardless of the outcome of the negotiations with our Lenders and the FLSA plaintiffs’ lawyers, we are mutually aligned with our Lenders to avoid any adverse impact with operations so that we can continue to serve our customers and maintain our great employees,” said Peter C. Boylan III, Chairman, President, and CEO.

SEGMENT UPDATE

Inspection Services

  • During the fourth quarter Cypress had an average headcount of approximately 430 inspectors working throughout the United States. Headcount declined in early 2022 as the result of changes to inspector pay practices, which were driven in part by the need to mitigate the risk of needing to defend against future FLSA litigation. In early 2022 competitors offering more aggressive pay practices solicited and hired approximately 65 of Cypress’s inspectors as a result of these changes.
  • Cypress continues to pursue business development. In fourth quarter 2021 Cypress submitted over a dozen bids, and thus far in 2022 Cypress has submitted another 16 new bid proposals.
  • General and administrative expense in 4th quarter 2021 included a $0.7 million accrual related to a settlement Cypress reached in early 2022 with over 60 plaintiffs in FLSA litigation.
  • Other income in 4th quarter 2021 included a gain of $1.6 million upon receipt of proceeds from the settlement of a dispute with another party.

Pipeline & Process Services (“PPS”)

  • Cypress discontinued the operations of its 51%-owned subsidiary Brown Integrity, which provided hydrotesting services. Cypress recorded gains of $1.0 million in 4th quarter 2021 related to asset sales within net income (loss) from discontinued operations, net of tax.

Water & Environmental Services (“Environmental Services”)

  • Cypress’s water treatment facilities generally receive more water when its customers’ oil production increases from the completion of new oil wells in North Dakota. 23 drilling rigs are currently operating in North Dakota.
  • In December 2021, Cypress recorded an impairment of $0.9 million to the fixed assets and lease assets of one of its water treatment facilities.

COMMON UNIT & PREFERRED UNIT DISTRIBUTIONS

In July 2020, Cypress announced that it had suspended common unit distributions. Cypress’s credit facility continues to contain significant restrictions on the payment of distributions. Cypress expects to use available cash for working capital needs including restructuring expenses. Cypress continues the suspension of the distribution payments to an affiliate of the general partner to which he is entitled on his preferred units.

FOURTH QUARTER 2021 OPERATING RESULTS BY BUSINESS SEGMENT

Inspection Services

The Inspection Services segment’s results for the three months ended December 31, 2021 and 2020 were:

  • Revenue - $26.7 million and $32.4 million, respectively.
  • Gross Margin - $3.1 million and $3.9 million, respectively.

Water & Environmental Services (“Environmental Services”)

The Environmental Services segment’s results for the three months ended December 31, 2021 and 2020 were:

  • Revenue - $1.1 million and $1.4 million, respectively.
  • Gross Margin - $0.6 million and $0.9 million, respectively

CAPITAL EXPENDITURES

During the quarter, Cypress had less than $0.1 million in capital expenditures, which is reflective of an attractive business model that requires minimal capital expenditures.

ANNUAL REPORT

Cypress filed its annual report on Form 10-K for the year ended December 31, 2021 with the Securities and Exchange Commission today. Cypress will also post a copy of the Form 10-K on its website at www.cypressenvironmental.biz. Unitholders may request a printed copy of these reports free of charge by contacting Investor Relations at Cypress Environmental Partners, L.P., 5727 S. Lewis Ave., Suite 300, Tulsa, OK 74105 or by e-mailing This email address is being protected from spambots. You need JavaScript enabled to view it..

NON-GAAP FINANCIAL INFORMATION

This press release and the accompanying financial schedules include the following non-GAAP financial measures: adjusted EBITDA, adjusted EBITDA attributable to limited partners, and distributable cash flow. The accompanying schedules provide reconciliations of these non-GAAP financial measures to their most directly comparable GAAP financial measures. Cypress's non-GAAP financial measures should not be considered in isolation or as an alternative to its financial measures presented in accordance with GAAP, including revenues, net income or loss attributable to limited partners, net cash provided by or used in operating activities, or any other measure of liquidity or financial performance presented in accordance with GAAP as a measure of operating performance, liquidity, or ability to service debt obligations and make cash distributions to unitholders. The non-GAAP financial measures presented by Cypress may not be comparable to similarly-titled measures of other entities because other entities may not calculate their measures in the same manner.

Cypress defines adjusted EBITDA as net income or loss exclusive of (i) interest expense, (ii) depreciation, amortization, and accretion expense, (iii) income tax expense or benefit, (iv) equity-based compensation expense, (v) and certain other unusual or nonrecurring items. Cypress defines adjusted EBITDA attributable to limited partners as adjusted EBITDA exclusive of amounts attributable to the general partner and to noncontrolling interests. Cypress defines distributable cash flow as adjusted EBITDA attributable to limited partners less cash interest paid, cash income taxes paid, maintenance capital expenditures, and cash distributions paid or accrued on preferred equity. Management believes these measures provide investors meaningful insight into results from ongoing operations.

These non-GAAP financial measures are used as supplemental liquidity and performance measures by Cypress's management and by external users of its financial statements, such as investors, banks, and others to assess:

  • financial performance of Cypress without regard to financing methods, capital structure or historical cost basis of assets;
  • Cypress's operating performance and return on capital as compared to those of other companies, without regard to financing methods or capital structure;
  • viability and performance of acquisitions and capital expenditure projects and the overall rates of return on investment opportunities; and
  • the ability of Cypress's businesses to generate sufficient cash to pay interest costs, support its indebtedness, and make cash distributions to its unitholders.

ABOUT CYPRESS ENVIRONMENTAL PARTNERS, L.P.

Cypress Environmental Partners, L.P. is a master limited partnership that provides essential environmental services to the utility and energy industries, including pipeline & infrastructure inspection, NDE testing, and in-line integrity support services throughout the United States. Cypress also provides environmental services to upstream and midstream energy companies and their vendors in North Dakota, including water treatment, hydrocarbon recovery, and disposal into EPA Class II injection wells to protect our groundwater. Cypress works closely with its customers to help them protect people, property, and the environment, and to assist their compliance with increasingly complex and strict rules and regulations. Cypress is headquartered in Tulsa, Oklahoma.

CAUTIONARY STATEMENTS

This press release may contain or incorporate by reference forward-looking statements as defined under the federal securities laws regarding Cypress Environmental Partners, L.P., including projections, estimates, forecasts, plans and objectives. Although management believes that expectations reflected in such forward-looking statements are reasonable, no assurance can be given that such expectations will prove to be correct. In addition, these statements are subject to certain risks, uncertainties and other assumptions that are difficult to predict and may be beyond Cypress's control. If any of these risks or uncertainties materialize, or if underlying assumptions prove incorrect, Cypress's actual results may vary materially from what management forecasted, anticipated, estimated, projected or expected.

The key risk factors that may have a direct bearing on Cypress's results of operations and financial condition are described in detail in the "Risk Factors" section of Cypress's most recently filed annual report and subsequently filed quarterly reports with the Securities and Exchange Commission. Investors are encouraged to closely consider the disclosures and risk factors contained in Cypress's annual and quarterly reports filed from time to time with the Securities and Exchange Commission. The forward-looking statements contained herein speak as of the date of this announcement. Cypress undertakes no obligation to publicly update or revise any forward-looking statements, whether as a result of new information, future events or otherwise, except as required by applicable securities laws. Information contained in this press release is unaudited and subject to change.

CYPRESS ENVIRONMENTAL PARTNERS, L.P.

Consolidated Balance Sheets

As of December 31, 2021 and 2020

(in thousands)


December 31,

December 31,

2021

2020


ASSETS

Current assets:

Cash and cash equivalents

$

8,251


$

12,138


Trade accounts receivable, net


11,541


16,024


Assets of discontinued operations


3,176


8,182


Prepaid expenses and other


1,945


2,002


Debt issuance costs, net


444


-


Total current assets


25,357


38,346


Property and equipment:

Property and equipment, at cost


15,759


23,449


Less: Accumulated depreciation


9,622


14,059


Total property and equipment, net


6,137


9,390


Intangible assets, net


12,993


15,143


Goodwill


50,392


50,389


Finance lease right-of-use assets, net


60


112


Operating lease right-of-use assets


1,449


1,987


Debt issuance costs, net


-


242


Assets of discontinued operations


-


3,807


Other assets


590


570


Total assets

$

96,978


$

119,986


LIABILITIES AND OWNERS’ EQUITY

Current liabilities:

Accounts payable

$

771


$

855


Accounts payable – affiliates


99


58


Accrued payroll and other


5,350


4,768


Income taxes payable


55


268


Finance lease obligations


49


51


Operating lease obligations


429


439


Current portion of long-term debt


54,229


-


Liabilities of discontinued operations


36


1,582


Total current liabilities


61,018


8,021


Long-term debt


-


62,029


Finance lease obligations


4


55


Operating lease obligations


1,078


1,549


Liabilities of discontinued operations


-


245


Other noncurrent liabilities


318


182


Total liabilities


62,418


72,081


Owners’ equity:

Partners’ capital:

Common units (12,361 and 12,213 units outstanding at December 31, 2021 and December 31, 2020, respectively)


13,472


27,507


Preferred units (5,769 units outstanding at December 31, 2021 and December 31, 2020)


48,424


44,291


General partner


(25,876

)


(25,876

)

Accumulated other comprehensive loss


(2,636

)


(2,655

)

Total partners’ capital


33,384


43,267


Noncontrolling interests


1,176


4,638


Total owners’ equity


34,560


47,905


Total liabilities and owners’ equity

$

96,978


$

119,986


CYPRESS ENVIRONMENTAL PARTNERS, L.P.

Consolidated Statements of Operations

For the Three Months and Years Ended December 31, 2021 and 2020

(in thousands, except per unit data)


Three Months Ended
December 31,


Years Ended
December 31,

2021

2020

2021

2020

(unaudited)

Revenue

$

27,772


$

33,809


$

117,317


$

187,280


Costs of services


24,016


28,969


101,776


163,741


Gross margin


3,756


4,840


15,541


23,539


Operating costs and expense:

General and administrative


5,845


4,554


17,897


18,242


Depreciation, amortization and accretion


1,238


1,077


4,535


4,325


Impairments


881


-


881


-


Loss on asset disposals, net


23


-


32


5


Operating (loss) income


(4,231

)


(791

)


(7,804

)


967


Other (expense) income:

Interest expense


(949

)


(777

)


(3,601

)


(3,959

)

Foreign currency (losses) gains


(21

)


274


(16

)


107


Other, net


1,712


129


2,024


530


Net loss before income tax expense


(3,489

)


(1,165

)


(9,397

)


(2,355

)

Income tax expense (benefit)


10


(29

)


40


482


Net loss from continuing operations


(3,499

)


(1,136

)


(9,437

)


(2,837

)

Net income (loss) from discontinued operations, net of tax


824


461


(2,642

)


2,471


Net loss

$

(2,675

)

$

(675

)

$

(12,079

)

$

(366

)


Net loss from continuing operations

$

(3,499

)

$

(1,136

)

$

(9,437

)

$

(2,837

)

Net income attributable to noncontrolling interests – continuing operations


9


5


30


19


Net loss attributable to limited partners – continuing operations


(3,508

)


(1,141

)


(9,467

)


(2,856

)

Net income (loss) attributable to limited partners – discontinued operations


443


269


(1,132

)


1,441


Net loss attributable to limited partners

$

(3,065

)

$

(872

)

$

(10,599

)

$

(1,415

)


Net loss attributable to limited partners – continuing operations

$

(3,508

)

$

(1,141

)

$

(9,467

)

$

(2,856

)

Net income attributable to preferred unitholder


1,034


1,034


4,133


4,133


Net loss attributable to common unitholders – continuing operations


(4,542

)


(2,175

)


(13,600

)


(6,989

)

Net income (loss) attributable to common unitholders – discontinued operations


443


269


(1,132

)


1,441


Net loss attributable to common unitholders

$

(4,099

)

$

(1,906

)

$

(14,732

)

$

(5,548

)


Net (loss) income per common limited partner unit:

Basic and diluted – continuing operations

$

(0.37

)

$

(0.18

)

$

(1.11

)

$

(0.58

)

Basic and diluted - discontinued operations


0.04


0.02


(0.09

)


0.12


Basic and diluted

$

(0.33

)

$

(0.16

)

$

(1.20

)

$

(0.46

)


Weighted average common units outstanding:


Basic and diluted


12,350


12,211


12,318


12,181


Reconciliation of Net Loss to Adjusted EBITDA

and Distributable Cash Flow


Three Months Ended
December 31,


Years Ended December 31,


2021


2020


2021


2020


(in thousands)


Net loss


$

(2,675

)


$

(675

)


$

(12,079

)


$

(366

)

Add:


Interest expense


949


777


3,601


3,959


Depreciation, amortization and accretion


1,190


1,183


4,721


4,775


Income tax expense (benefit)


10


(29

)


40


482


Equity-based compensation


329


232


1,152


961


Impairments


881


-


881


-


Foreign currency losses


21


-


16


-


Discontinued operations (a)


(989

)


255


1,609


1,169


Less:


Foreign currency gains


-


274


-


107


Adjusted EBITDA


$

(284

)


$

1,469


$

(59

)


$

10,873


Adjusted EBITDA attributable to noncontrolling interests


(100

)


314


(715

)


1,588


Adjusted EBITDA attributable to limited partners


$

(184

)


$

1,155


$

656


$

9,285


Less:


Preferred unit distributions paid or accrued


1,034


1,034


4,133


4,133


Cash interest paid, cash taxes paid, and maintenance capital expenditures


328


931


3,863


5,394


Distributable cash flow


$

(1,546

)


$

(810

)


$

(7,340

)


$

(242

)

(a)

Amounts include net loss on asset disposals, depreciation, amortization, and accretion expense, interest expense, and income tax expenses that were previously reported within the Pipeline & Process Services segment, prior to that segment being reported as a discontinued operation.

Reconciliation of Net Loss Attributable to

Limited Partners to Adjusted EBITDA Attributable

to Limited Partners and Distributable Cash Flow


Three Months Ended December 31,


Years Ended December 31,


2021


2020


2021


2020


(in thousands)


Net loss attributable to limited partners


$

(3,065

)


$

(872

)


$

(10,599

)


$

(1,415

)

Add:


Interest expense


949


777


3,601


3,959


Depreciation, amortization and accretion


1,190


1,183


4,721


4,775


Income tax expense (benefit)


10


(29

)


40


482


Equity-based compensation


329


232


1,152


961


Impairments


881


-


881


-


Foreign currency losses


21


-


16


-


Discontinued operations (a)


(499

)


138


844


630


Less:


Foreign currency gains


-


274


-


107


Adjusted EBITDA attributable to limited partners


$

(184

)


$

1,155


$

656


$

9,285


Less:


Preferred unit distributions paid or accrued


1,034


1,034


4,133


4,133


Cash interest paid, cash taxes paid, and maintenance capital expenditures


328


931


3,863


5,394


Distributable cash flow


$

(1,546

)


$

(810

)


$

(7,340

)


$

(242

)

(a)

Amounts include net loss on asset disposals, depreciation, amortization, and accretion expense, interest expense, and income tax expenses attributable to limited partners that were previously reported within the Pipeline & Process Services segment, prior to that segment being reported as a discontinued operation.

Reconciliation of Net Cash Provided by Operating Activities to

Adjusted EBITDA and Distributable Cash Flow


Years Ended December 31,


2021


2020


(in thousands)


Cash flows provided by operating activities


$

3,317


$

27,922


Changes in trade accounts receivable, net


(4,512

)


(30,481

)

Changes in prepaid expenses and other


(409

)


897


Changes in accounts payable and accounts payable - affiliates


64


366


Changes in accrued payroll and other


(499

)


9,614


Change in income taxes payable


213


747


Interest expense (excluding non-cash interest)


2,646


3,379


Income tax expense (excluding deferred tax benefit)


40


482


Bad debt expense, net of recoveries


29


(470

)

Other


(14

)


(44

)

Discontinued operations (a)


(934

)


(1,539

)

Adjusted EBITDA


$

(59

)


$

10,873


Adjusted EBITDA attributable to noncontrolling interests


(715

)


1,588


Adjusted EBITDA attributable to limited partners


$

656


$

9,285


Less:


Preferred unit distributions paid or accrued


4,133


4,133


Cash interest paid, cash taxes paid, and maintenance capital expenditures


3,863


5,394


Distributable cash flow


$

(7,340

)


$

(242

)


Contacts

Investors:
Cypress Environmental Partners, L.P. - Jeff Herbers – Vice President & Chief Financial Officer
This email address is being protected from spambots. You need JavaScript enabled to view it. or 918-947-5730


Read full story here

SAN FRANCISCO--(BUSINESS WIRE)--Planet Labs PBC (NYSE: PL), a leading provider of daily data and insights about Earth, has partnered with SynMax, a Houston-based satellite analytics and intelligence company, to provide data-informed insights on the energy industry within the United States and monitor the movements of dark vessels around the globe.


With Planet’s daily PlanetScope imagery, SynMax monitors the location of hundreds of well pads for hydraulic fracturing and the ongoing activity at the sites by frac crews that maintain the operations and safety of the wells. These frac crews are responsible for the final steps in the development of oil and gas wells, and with Planet’s data, the status of the sites can be monitored in near real-time. By gaining intelligence on these operations, SynMax is able to inform energy-focused hedge funds, looking to accurately forecast the near-term supply of oil and gas.

After meeting Planet’s CEO and co-founder Will Marshall at his 2014 TED talk, Bill Perkins, founder of SynMax and owner of energy hedge fund Skylar Capital, came up with the idea of monitoring frac crew activity on a daily basis with Planet’s imagery. Planet’s approximately 200 satellites provide a line scanner of the Earth, imaging every terrestrial location every day. This unprecedented amount of data provides Planet’s customers with situational awareness and real-time insights about daily changes on the Earth.

“The problem of accurate near-term oil and gas supply forecasting has been a persistent issue for energy hedge funds, and I was immediately interested in how Planet’s satellite data could be used to reliably monitor frac crew activity,” states Perkins. “Supply is so critical to price that once this [frac crew] data becomes available to the market, we believe that hedge funds will be unable to trade without it.”

Perkins tasked then Quantitative Analyst, Eric Anderson, now SynMax CTO, with developing a model that incorporated Planet’s daily PlanetScope data into an analysis of frac crew activity. “We [Skylar Capital] have thoroughly explored the offerings of frac crew monitoring services from other companies and have been consistently frustrated at the poor quality of their data which relies on inconsistent and infrequent low resolution free satellite images,” recalled Anderson. Anderson and his team found that Planet data allowed them to track operating frac crews in near real-time.

Using their proprietary artificial intelligence combined with Planet’s satellite data, SynMax will provide maritime solutions for IUU fishing, illicit ship-to-ship transfers, and vessel spoofing. SynMax is now developing a first-of-its-kind dark vessel tracking product, entitled Project Theia. This project is targeting the commercial market and may make it possible for vessel operators, maritime insurance companies, and hedge funds interested in clandestine commodity flows, to discover, monitor, and investigate dark vessels operating all over the globe.

“SynMax has found that it can discover in-mass maritime vessels all over the world that are not transponding their locations using, in part, Planet’s daily imagery,” said SynMax CEO Brendan Moore, a former UK intelligence officer.

Together, these two companies could deliver unmatched data-informed intelligence for hedge funds invested in the energy industry and companies relying on transparent maritime commodity flows. Planet’s daily coverage of the globe could empower the financial industry to make better data-informed decisions, in part through innovative companies like SynMax.

About Planet

Planet is a leading provider of global, daily satellite imagery and geospatial solutions. Planet is driven by a mission to image the world every day, and make change visible, accessible and actionable. Founded in 2010 by three NASA scientists, Planet designs, builds, and operates the largest Earth observation fleet of imaging satellites, capturing over 30 TB of data per day. Planet provides mission-critical data, advanced insights, and software solutions to over 700 customers, comprising the world’s leading agriculture, forestry, intelligence, education and finance companies and government agencies, enabling users to simply and effectively derive unique value from satellite imagery. Planet is a Public Benefit Corporation trading on the New York Stock Exchange as PL. To learn more visit www.planet.com and follow us on Twitter.

About SynMax

SynMax is a data intelligence company. SynMax creates products that turn satellite images into actionable intelligence for investors, market participants and governments.

Forward-looking Statements

Except for the historical information contained herein, the matters set forth in this press release are forward-looking statements within the meaning of the "safe harbor" provisions of the Private Securities Litigation Reform Act of 1995, including, but not limited to, the Company’s ability to capture market opportunity and realize any of the potential benefits from strategic partnerships and customer collaborations. Forward-looking statements are based on the Company’s management’s beliefs, as well as assumptions made by, and information currently available to them. Because such statements are based on expectations as to future events and results and are not statements of fact, actual results may differ materially from those projected. Factors which may cause actual results to differ materially from current expectations include, but are not limited to, the risk factors and other disclosures about the Company and its business included in the Company's periodic reports, proxy statements, and other disclosure materials filed from time to time with the Securities and Exchange Commission (SEC) which are available online at www.sec.gov, and on the Company's website at www.planet.com. All forward-looking statements reflect the Company’s beliefs and assumptions only as of the date such statements are made. The Company undertakes no obligation to update forward-looking statements to reflect future events or circumstances.


Contacts

Planet Press
Claire Bentley
Planet Labs PBC
This email address is being protected from spambots. You need JavaScript enabled to view it.

Planet Investor Relations
Chris Genualdi, Cleo Palmer-Poroner
Planet Labs PBC
This email address is being protected from spambots. You need JavaScript enabled to view it.

DUBLIN--(BUSINESS WIRE)--The "Shipbuilding Market by Type and End Use: Global Opportunity Analysis and Industry Forecast, 2021-2030" report has been added to ResearchAndMarkets.com's offering.


Presently, the global shipbuilding industry is dominated by Asia-Pacific followed by Europe, North America, and LAMEA. Asia-Pacific is expected to maintain its dominance in the global market particularly in China, South Korea, and Japan due to some distinct advantages; such as cheaper wages, strong government backing, and strong forward & backward linkage industries. Shipbuilding is a highly capital-intensive industry, owing to which strong government support and political stability is prerequisite to survive this industry.

Prominent factors driving growth of the global shipbuilding market are GDP growth, improved economic growth, global seaborne trade, increase in demand for cargo transportation through ships, rise in trade-related agreements, technological advancements in marine vessel engines, and trend of automation in marine transportation. However, fluctuations in transportation and inventory costs, coupled with environmental concerns associated with marine vessels are some noteworthy trends that could hamper growth of the market.

The global shipbuilding market is segmented on the basis of type, end-use, and region. By type, the market is categorized into oil tankers, bulk carriers, general cargo ships, container ships, passenger ships, and others. On the basis of end-use, the global shipbuilding market is categorized into transport and military. Region wise, it is studied across North America, Europe, Asia-Pacific, and LAMEA.

The key players profiled in the global shipbuilding market includes companies such as BAE Systems PLC, Damen Shipyards group, Fincantieri group, General Dynamics corporation, Huntington Ingalls industries, Korea Shipbuilding & Offshore Engineering, Mitsubishi Heavy Industries, Oshima Shipbuilding co. ltd, Samsuung Heavy Industries, and Sumitomo Heavy Industries.

Market dynamics

Drivers

  • Gradual rise in international seaborne trade
  • Increase in demand for cargo transportation through ships
  • Rise in trade-related agreements
  • Technological advancements in marine vessel engines

Restraints

  • Fluctuations in transportation and inventory costs
  • Environmental concerns associated with marine vessels

Opportunities

  • Trend of automation in marine transportation
  • Increase in marine safety norms

Key Report Benefits:

  • This study presents analytical depiction of the global shipbuilding market analysis along with current the trends and future estimations to depict imminent investment pockets.
  • The overall shipbuilding market opportunity is determined by understanding profitable trends to gain a stronger foothold.
  • The report presents information related to the key drivers, restraints, and opportunities of the global shipbuilding market with a detailed impact analysis.
  • The current shipbuilding market is quantitatively analyzed from 2020 to 2030 to benchmark the financial competency.
  • Porter's five forces analysis illustrates the potency of the buyers and suppliers in the industry.

Key Market Segments:

By Type

  • Oil Tankers
  • Bulk Carriers
  • General Cargo Ships
  • Container Ships
  • Passenger Ships
  • Others

By End Use

  • Transport
  • Military

By Region

  • North America
  • US
  • Canada
  • Mexico
  • Europe
  • Germany
  • UK
  • France
  • Rest of Europe
  • Asia-Pacific
  • China
  • Japan
  • South Korea
  • Rest of Asia-Pacific
  • LAMEA
  • Latin America
  • Middle East
  • Africa

Key Topics Covered:

CHAPTER 1: INTRODUCTION

CHAPTER 2: EXECUTIVE SUMMARY

CHAPTER 3: MARKET OVERVIEW

3.1. Market definition and scope

3.2. Key findings

3.3. Porter's five forces analysis

3.4. Key player positioning (2020)

3.5. Market dynamics

3.6. Impact of COVID-19 on the market

CHAPTER 4: SHIPBUILDING MARKET, TYPE

CHAPTER 5: SHIPBUILDING MARKET, BY END-USE

CHAPTER 6: SHIPBUILDING MARKET, BY REGION

CHAPTER 7: COMPANY PROFILES

  • BAE Systems PLC
  • Damen Shipyards group
  • Fincantieri group
  • General Dynamics corporation
  • Huntington Ingalls industries
  • Korea Shipbuilding & Offshore Engineering
  • Mitsubishi Heavy Industries
  • Oshima Shipbuilding co. ltd
  • Samsuung Heavy Industries
  • Sumitomo Heavy Industries

For more information about this report visit https://www.researchandmarkets.com/r/vzh51a

About ResearchAndMarkets.com

ResearchAndMarkets.com is the world's leading source for international market research reports and market data. We provide you with the latest data on international and regional markets, key industries, the top companies, new products and the latest trends.


Contacts

ResearchAndMarkets.com
Laura Wood, Senior Press Manager
This email address is being protected from spambots. You need JavaScript enabled to view it.

For E.S.T Office Hours Call 1-917-300-0470
For U.S./CAN Toll Free Call 1-800-526-8630
For GMT Office Hours Call +353-1-416-8900

SINGAPORE--(BUSINESS WIRE)--Twenty20 Energy Systems today announced plans to design, build and maintain a 66MW, gas-fired power plant in Papua New Guinea’s Hela province on behalf of Dirio Gas & Power Company Ltd.


The Hela power plant is the newest investment project in the power generation business for Dirio Gas & Power, which is owned by 11 incorporated land groups and the provincial governments of Hela and Gulf.

The power plant will be located adjacent to and supplied from the Exxon Mobil Hides Gas Conditioning Plant and will provide power through an interconnect to the Ramu Grid which is currently being extended further into the Highlands.

Groundbreaking is expected in the third quarter of 2022, with an estimated completion in 2024. As part of the agreement with Dirio Gas & Power, Twenty20 will provide operations and maintenance services commencing on completion of the construction and commissioning works for 20 years.

“Working together with PNG government officials and local residents, we’ve been able to make great strides in transitioning regions of the country to cleaner, more reliable power supplies,” said Geoff Lawrence, CEO of Twenty20 Energy. “Creating the necessary infrastructure to a remote and geographically challenging area like Hela required a number of innovative approaches that will ultimately improve the economy and lives of those in the region.”

The Hela project follows Twenty20 Energy’s successful EPC delivery and long term operation and maintenance of the Dirio Central Province Power Station, which is delivering clean reliable power to the Port Moresby capital area of Papua New Guinea. Twenty20 Energy intends to participate in the Ownership and invest 20 percent of the required capital for construction of the project alongside Dirio. This approach demonstrates Twenty20’s strategy to take ownership positions in energy assets that deliver long-term returns for investors while also partnering with local communities to deliver tangible improvements in their quality of life and transition Papua to clean reliable power.

Hela Governor Philip Undialu said: “The PNG government has set 70 percent electrification as a goal for PNG by 2030. Our collaborative effort and partnership with Twenty20 Energy is another major step taken in accomplishing this goal, and will bring much-needed reliable power to Hela and the Southern Highlands.”

The new plant will provide a reliable electricity supply to the Hela region, which often suffers from rolling blackouts. Reliable power is a crucial pillar in supporting the ongoing development efforts in the region and improving the quality of life in the Hela province. Having local generation in the Highlands also provides greater grid stability and significantly reduces transmission losses on the Ramu grid, helping improve the performance of PNG Power, the national utility.

The power station will be comprised of 4 Solar Turbines Titan 130 Modular Power Plant Sets in Open Cycle configuration, each with a rated capacity of 16.5MW reaching the required 66MW in total. The modular plant design allows for further expansion at a later date, with additional turbines as well as the opportunity for Combined Cycle configuration to increase generation capabilities and enhance fuel efficiency.

About Twenty20 Energy

Twenty20 Energy delivers innovative energy solutions that enable clients, partners, and stakeholders to accelerate a transition to a cleaner energy future. From concept development to operations and maintenance, Twenty20 provides engineering, project execution and asset management, coupled with the capacity to provide funding or shared ownership positions. Uniquely positioned in the energy landscape, Twenty20 has a global reach with local sensitivity, developing projects that deliver cleaner energy while empowering economic growth for today and beyond.


Contacts

Bob Zeitlinger / Makovsky
This email address is being protected from spambots. You need JavaScript enabled to view it. / 551 427 7298

DUBLIN--(BUSINESS WIRE)--The "Global Subsea Power Grid System Market by Component (Cables, Variable Speed Drives, Transformers, Switchgears), Application (Captive Generation, Wind Power), Depth (Shallow Water and Deepwater) and Region - Forecast to 2027" report has been added to ResearchAndMarkets.com's offering.


The global subsea power grid system market is expected to grow from an estimated USD 9.1 billion in 2022 to USD 14.8 billion in 2027, at a CAGR of 10.2% during the forecast period. The subsea power grid comprises of several components such as cables, transformers, variable speed drives, switchgears, and others used for various applications such as captive generation, offshore wind power, and other applications.

Favourable government policies for offshore renewable power production, especially using wind energy along with urgent need to reduce carbon emissions and improve grid reliability and efficiency is expected to drive the demand for subsea power grid systems. The potential of tidal energy to meet subsea power requirements and easy access of wind turbine technology to offshore locations are expected to offer lucrative opportunities for the subsea power grid system market during the forecast period.

However, the shortage of technical professionals in subsea industry, low cost of onshore electricity generation, and climatic challenges pertaining to operations of offshore wind farms may act as challenges restraints for the subsea power grid system market.

The wind power segment, by application, is expected to record the highest CAGR from 2022 to 2027

The subsea power grid system market, by application, has been broadly classified into wind power, captive generation, and Others. The others segment includes solar power, tidal power and gas & diesel based floating power plants. The wind power segment is expected to record the highest CAGR from 2022 to 2027. The increase in the use of subsea power cables in long-distance HV power transmission applications propel the growth of the subsea power grid system market for wind power. Medium-voltage subsea power cables are often used to connect offshore wind platforms to distant onshore installations.

However, high-voltage subsea power cables are preferred for offshore wind power farms installed with many turbines. According to China's National Energy Administration (NEA), 16.9 GW of offshore wind power projects were commissioned in 2021 compared to 9.49 GW installed capacity in 2020.

Countries such as the UK, Germany, China, Japan, and Taiwan have plans to invest significantly to expand and develop their regional offshore wind energy industry. These factors are expected to fuel the demand for subsea power grid systems for offshore wind power generation during the forecast period.

Cables are expected to emerge as the largest segment based on component

The subsea power grid system market, on the basis of component, has been segmented into cables, transformers, switchgears, variable speed drives, and others. The others segment includes connectors, actuators, sensors, and penetrators. The cables segment, by component, is expected to dominate the subsea power grid system market during the forecast period. The adoption of subsea power cables has been mainly driven by the HV power transmission and offshore oil & gas industries. Subsea power cables are widely used to link shore-based power grids.

These cables carry power from one country to another, as well as from one offshore platform to another, and transfer power from offshore renewable energy generation plants, which use wind, wave, and tidal energy to generate electricity; regional electrical transmission networks; etc.

Europe: The largest power grid system market in subsea

The subsea power grid system market has been analyzed for 5 regions, namely Asia Pacific, North America, Europe, Middle East & Africa, South America. Europe is expected to dominate the global power grid system market in subsea between 2022-2027, followed by Asia Pacific and North America. Europe and Asia Pacific are the major contributors to the global power grid system market in subsea owing to the strong demand for renewable energy sources and favorable government policies in these regions.

Most countries in Europe are mainly focusing on renewable energy capacity addition. Countries such as Germany, the UK, the Netherlands, and Norway are leading the renewable energy capacity addition. The growth of the subsea power grid system market is supported by the European Wind Initiative (EWI), a wind energy R&D program developed to take the wind industry to the next level in Europe.

Market Dynamics

Drivers

  • Increased Deepwater Oil and Gas Exploration Activities due to Depleting Onshore Fossil Fuel Reserves
  • Favorable Government Policies for Offshore Renewable Power Production, Especially Using Wind Energy
  • Urgent Need to Reduce Carbon Emissions and Improve Grid Reliability and Efficiency

Restraints

  • High Operational and Technological Risks
  • Greater Energy Losses Witnessed During Long-Distance Power Transmission

Opportunities

  • Potential of Tidal Energy to Meet Subsea Power Requirements
  • Easy Access of Wind Turbine Technology to Offshore Locations

Challenges

  • Shortage of Technical Professionals in Subsea Industry
  • Low Cost of Onshore Electricity Generation
  • Climatic Challenges Pertaining to Operations of Offshore Wind Farms

Companies Mentioned

  • ABB
  • Aker Solutions Asa
  • Apar Industries Ltd.
  • Baker Hughes
  • General Electric
  • Hitachi Energy
  • Ls Cable & System Ltd.
  • Nexans
  • NKT
  • Oceaneering International
  • Prysmian Group
  • Schlumberger
  • Schneider Electric
  • Siemens Energy
  • Ssg Cable
  • Sumitomo Electric Industries, Ltd.
  • Te Connectivity
  • Technipfmc
  • Teledyne Marine
  • ZTT

For more information about this report visit https://www.researchandmarkets.com/r/yuj21q


Contacts

ResearchAndMarkets.com
Laura Wood, Senior Press Manager
This email address is being protected from spambots. You need JavaScript enabled to view it.
For E.S.T Office Hours Call 1-917-300-0470
For U.S./CAN Toll Free Call 1-800-526-8630
For GMT Office Hours Call +353-1-416-8900

DALLAS--(BUSINESS WIRE)--Texas Pacific Land Corporation (NYSE: TPL) (the “Company” or “TPL”) announced today that the Company will release first quarter 2022 financial results after the market closes on Wednesday, May 4, 2022. A conference call will be held on Thursday, May 5, 2022 at 8:30 a.m. Eastern Time.

Webcast:
A webcast of the conference call will be available on the Investors section of the Company’s website at www.texaspacific.com. To listen to the live broadcast, go to the site at least 15 minutes prior to the scheduled start time in order to register and install any necessary audio software.

To Participate in the Telephone Conference Call:
Dial in at least 15 minutes prior to start time:
Domestic: 1-877-407-4018
International: 1-201-689-8471

Conference Call Playback:
Domestic: 1-844-512-2921
International: 1-412-317-6671
Pass code: 13729211
The playback can be accessed through May 19, 2022.

About Texas Pacific Land Corporation

Texas Pacific Land Corporation is one of the largest landowners in the State of Texas with approximately 880,000 acres of land in West Texas, with the majority of its ownership concentrated in the Permian Basin. The Company is not an oil and gas producer, but its surface and royalty ownership allow revenue generation through the entire value chain of oil and gas development, including through fixed fee payments for use of our land, revenue for sales of materials (caliche) used in the construction of infrastructure, providing sourced water and treated produced water, revenue from our oil and gas royalty interests, and revenues related to saltwater disposal on our land. The Company also generates revenue from pipeline, power line and utility easements, commercial leases, and seismic and temporary permits related to a variety of land uses including midstream infrastructure projects and hydrocarbon processing facilities.

Visit TPL at texaspacific.com.


Contacts

Investor Relations
This email address is being protected from spambots. You need JavaScript enabled to view it.

DULUTH, Minn.--(BUSINESS WIRE)--ALLETE, Inc. (NYSE:ALE), today announced it has closed the previously announced acquisition of New Energy Equity, one of the nation’s top distributed solar developers, for approximately $165.5 million.


New Energy Equity, with headquarters in Annapolis, Maryland, has successfully completed more than 250 distributed solar projects across the nation totaling more than 330 megawatts. The company has a development pipeline of about 2 gigawatts across 26 states over the next three years.

An independent study recently ranked ALLETE the No. 1 investor in renewable energy, relative to market capitalization, among all U.S. investor-owned utilities. ALLETE Chair, President and CEO Bethany Owen said New Energy Equity is a complementary fit with the company’s sustainability-in-action strategy.

“We’ve been signaling our move into the solar industry for some time, and as we met with New Energy Equity’s leadership team we knew we had found the right company to position us well,” Owen said. “The team brings a depth of distributed and community solar expertise and experience to ALLETE, along with a proven track record of financial success. The addition of New Energy Equity enhances our strong portfolio of companies and capabilities and opens new growth opportunities as we lead the way to a sustainable energy future.”

New Energy Equity also has two wholly owned subsidiaries, Impact Power Solutions and Energy Support Services. New Energy Equity’s entire team, including management, will remain in place, as will the company's Maryland headquarters and offices in Roseville, Minnesota, and Boulder, Colorado.

ALLETE, Inc. is an energy company headquartered in Duluth, Minnesota. In addition to its electric utilities, Minnesota Power and Superior Water, Light and Power of Wisconsin, ALLETE owns ALLETE Clean Energy, based in Duluth; New Energy Equity, based in Annapolis, Maryland; and BNI Energy in Bismarck, N.D.; and has an 8% equity interest in the American Transmission Co. More information about ALLETE is available at www.allete.com.

ALE-CORP

The statements contained in this release and statements that ALLETE may make orally in connection with this release that are not historical facts, are forward-looking statements. Actual results may differ materially from those projected in the forward-looking statements. These forward-looking statements involve risks and uncertainties and investors are directed to the risks discussed in documents filed by ALLETE with the Securities and Exchange Commission.


Contacts

Vince Meyer
218-723-3952
This email address is being protected from spambots. You need JavaScript enabled to view it.

Offshore Source Logo

Offshore Source keeps you updated with relevant information concerning the Offshore Energy Sector.

Any views or opinions represented on this website belong solely to the author and do not represent those of the people, institutions or organizations that Offshore Source or collaborators may or may not have been associated with in a professional or personal capacity, unless explicitly stated.

Corporate Offices

Technology Systems Corporation
8502 SW Kansas Ave
Stuart, FL 34997

info@tscpublishing.com