Business Wire News

HOUSTON--(BUSINESS WIRE)--Sunnova Energy International Inc. (“Sunnova”) (NYSE: NOVA) today announced the pricing of its underwritten public offering (the “Offering”) of 7,000,000 shares of Sunnova’s common stock, par value $0.0001 per share (the “common stock”), which consists of 3,500,000 shares of common stock offered by Sunnova and 3,500,000 shares of common stock offered by a fund affiliated with Newlight Partners (the “Selling Stockholder”) at a price to the public of $37.00 per share. Sunnova has granted the underwriters a 30-day option to purchase an additional 525,000 shares of common stock, and the Selling Stockholder has granted the underwriters a 30-day option to purchase an additional 525,000 shares of common stock.

The Offering is expected to settle and close on December 3, 2020, subject to the satisfaction of customary closing conditions.

Sunnova estimates that the net proceeds from the sale of shares of the common stock in this Offering, after deducting estimated underwriting discounts and commissions and estimated offering expenses payable by Sunnova, will be approximately $123.9 million (or approximately $142.6 million if the underwriters exercise in full their option to purchase additional shares of our common stock). Sunnova will not receive any proceeds from the sale of the shares by the Selling Stockholder in the Offering. Sunnova intends to use the net proceeds from this Offering to acquire solar equipment, for the repayment of indebtedness, including to redeem approximately $39.0 million aggregate principal amount of the 9.75% convertible senior notes due 2025 (the “convertible senior notes”), excluding accrued and unpaid interest, and for working capital purposes.

Goldman Sachs & Co. LLC, BofA Securities, J.P. Morgan and Credit Suisse are acting as joint book-running managers of the Offering. Baird, Roth Capital Partners, Simmons Energy | A Division of Piper Sandler, B. Riley Securities, JMP Securities, KeyBanc Capital Markets and Raymond James are acting as co-managers.

Sunnova has filed a shelf registration statement on Form S-3 relating to the Offering (including a prospectus) with the Securities and Exchange Commission (the “SEC”) that has become effective. The shares will be issued and sold pursuant to such effective registration statement. A prospectus supplement relating to the Offering has also been filed with the SEC. Before you invest, you should read the prospectus, the prospectus supplement and other documents that Sunnova may file with the SEC for more complete information about Sunnova and this Offering. A copy of the prospectus supplement and accompanying prospectus relating to the Offering may be obtained from Goldman Sachs & Co. LLC, Prospectus Department, 200 West Street, New York, NY 10282, Telephone: 1-866-471-2526, Facsimile: 212-902-9316, Email: This email address is being protected from spambots. You need JavaScript enabled to view it.; BofA Securities, NC1-004-03-43, 200 North College Street, 3rd Floor, Charlotte, NC 28255-0001, Attention: Prospectus Department or by email at This email address is being protected from spambots. You need JavaScript enabled to view it.; J.P. Morgan Securities LLC, Attention: Broadridge Financial Solutions, 1155 Long Island Avenue, Edgewood, NY 11717, by telephone 1-866-803-9204 or by email at This email address is being protected from spambots. You need JavaScript enabled to view it.; and Credit Suisse Securities (USA) LLC, Attn: Prospectus Department, 6933 Louis Stephens Drive, Morrisville, NC 27560, by calling 1-800-221-1037, or by emailing This email address is being protected from spambots. You need JavaScript enabled to view it..

To obtain a copy of the prospectus supplement or prospectus, free of charge, visit the SEC’s website, www.sec.gov, and search under the registrant’s name “Sunnova Energy International Inc.”

This press release shall not constitute an offer to sell or the solicitation of an offer to buy these securities, nor shall there be any sale of these securities in any state or jurisdiction in which such offer, solicitation or sale would be unlawful prior to registration or qualification under the securities laws of any such state or jurisdiction. This press release shall also not constitute a notice of redemption with respect to the convertible senior notes.

ABOUT SUNNOVA

Sunnova Energy International Inc. (NYSE: NOVA) is a leading residential solar and energy storage service provider, with customers across the U.S. and its territories. Sunnova's goal is to be the source of clean, affordable and reliable energy, with a simple mission: to power energy independence so that homeowners have the freedom to live life uninterrupted™.

FORWARD LOOKING STATEMENTS

This press release contains forward-looking statements within the meaning of Section 27A of the Securities Act of 1933, as amended, and Section 21E of the Securities Exchange Act of 1934, as amended. Forward-looking statements generally relate to future events or Sunnova's future financial or operating performance. In some cases, you can identify forward-looking statements because they contain words such as "may," "will," "should," "expect," "plan," "anticipate," "going to," "could," "intend," "target," "project," "contemplates," "believe," "estimate," "predict," "potential" or "continue" or the negative of these words or other similar terms or expressions that concern Sunnova's expectations, strategy, priorities, plans or intentions. Forward-looking statements in this release include, but are not limited to, statements regarding the conduct of the Offering and the size and terms of the Offering and the use of proceeds from the Offering, including any redemption of the convertible senior notes. Sunnova's expectations and beliefs regarding these matters may not materialize, and actual results in future periods are subject to risks and uncertainties that could cause actual results to differ materially from those projected, including risks regarding our ability to forecast our business due to our limited operating history, the effects of the coronavirus pandemic on our business and operations, results of operations and financial position, our competition, fluctuations in the solar and home-building markets, availability of capital, our ability to attract and retain dealers and customers and our dealer and strategic partner relationships. The forward-looking statements contained in this release are also subject to other risks and uncertainties, including those more fully described in Sunnova's filings with the SEC, including our Annual Report on Form 10-K for the year ended December 31, 2019, our Quarterly Reports on Form 10-Q for the quarters ended March 31, June 30 and September 30, 2020 and in the registration statement on Form S-3 related to the Offering filed with the SEC. The forward-looking statements in this release are based on information available to Sunnova as of the date hereof, and Sunnova disclaims any obligation to update any forward-looking statements, except as required by law.


Contacts

INVESTOR AND ANALYST CONTACT

Rodney McMahan
Sunnova Energy International Inc.
This email address is being protected from spambots. You need JavaScript enabled to view it.
(281) 971-3323

PRESS AND MEDIA CONTACT

Kelsey Hultberg
Sunnova Energy International Inc.
This email address is being protected from spambots. You need JavaScript enabled to view it.

DUBLIN--(BUSINESS WIRE)--The "Global Geothermal Power Market - Forecasts from 2020 to 2025" report has been added to ResearchAndMarkets.com's offering.


Global geothermal power market was valued at US$1.403 billion in 2019 and is expected to grow at a CAGR of 2.72% over the forecast period to reach a total market size of US$1.649 billion in 2025.

According to latest statistics from the 2019 IRENA report (International Renewables Energy Agency), the contribution of geothermal energy to the global renewable capacity amounts to 13 GW. Mounting concerns among governments and international environmental agencies and organizations related to climate change across the globe have boosted the demand for various renewable energy sources to be used as a substitute of fossil fuels to generate electricity. Moreover, volatility of fossil fuel prices, their limited availability, and rise in greenhouse gas (GHGs) emissions are also shifting the demand for electricity generated from renewable energy sources such as solar, wind, and geothermal. All these factors are adding up to the growth of different renewable energy sectors including solar, wind, and geothermal.

High capacity of geothermal power coupled with its cost-effectiveness is significantly driving the demand for geothermal power across the globe which is bolstering the market growth. However, factors such as high investment required for geothermal power plants and negative impact of geothermal energy on the environment are hampering the growth of geothermal power market. The presence of other viable renewable energy alternatives, especially solar, is also hindering the use of geothermal power to generate electricity.

Rising investments in geothermal energy across different countries will also continue to propel the growth of geothermal power market during the forecast period. In March 2019, the investment firm- Breakthrough Energy Ventures- announced to invest $12.5 million in a geothermal project development company- Baseload Capital. It is a project investment firm which offers capital for the development of geothermal power plants with the use of the technology developed by Climeon, its Swedish parent company. The Philippines-based geothermal company EnergiMiinas has plans to set up two geothermal power plants into operation in Peru by 2026 or 2027 with the investment of US$1 billion in each project. Thrive Renewables has also recently announced its plans to invest around 6.5 million in the first geothermal power plant in the United Kingdom with an aim to supply approximately 3 MW of electricity to National Grid and upto 12 MW of electricity for local use.

Continuous development of technologies to increase the efficiency of geothermal power plants are expected to offer more lucrative opportunity for the market expansion over the next five years. Geothermal funding in the U.S. will increase from $84 million in FY2019 to $110 million in FY2020, representing an increase of 31 per cent. Out of this total funding, $20 million will be used by the Frontier Observatory for Research in Geothermal Energy (FORGE) project which aims to test and evaluate enhanced geothermal systems. Recently, UK Research & Innovation (UKRI) has announced an early-stage investment for seventeen new projects related to offshore and geothermal clean energy innovation. In February 2020, Turkish geothermal player MASPO Energy established a national geothermal research and development center aiming to increase the focus on equipment manufacturing in Turkey so as to reduce its dependency on international support and supply. Eavor Technologies, Inc., a Calgary-based company, is developing a ground-breaking prototype for a closed-loop geothermal system that will allow the generation of renewable energy using the earth's natural heat.

Companies Mentioned

  • Enel Spa
  • Fuji Electric Co., Ltd.
  • Aboitiz Power Corporation.
  • Calpine Corporation
  • Alterra Power Corp.
  • Ormat Technologies Inc.
  • U.S. Geothermal Inc.
  • Berkshire Hathaway Energy
  • EthosEnergy Group
  • ThermaSource LLC
  • Korea Electric Power Corporation
  • Contact Energy
  • MASPO Energy

Key Topics Covered:

1. Introduction

2. Research Methodology

3. Executive Summary

4. Market Dynamics

4.1. Market Drivers

4.2. Market Restraints

4.3. Market Opportunities

4.4. Porters Five Forces Analysis

4.5. Industry Value Chain Analysis

4.6. Market Attractiveness

5. Global Geothermal Power Market Analysis, By Power Station Type

5.1. Introduction

5.2. Dry Steam

5.3. Flash Steam

5.4. Binary Cycles

6. Global Geothermal Power Market Analysis, By End User

6.1. Introduction

6.2. Residential

6.3. Commercial

6.4. Industrial

7. Global Geothermal Power Market Analysis, By Geography

7.1. Introduction

7.2. North America

7.2.1. USA

7.2.2. Canada

7.2.3. Mexico

7.3. South America

7.3.1. Brazil

7.3.2. Argentina

7.3.3. Peru

7.3.4. Others

7.4. Europe

7.4.1. Germany

7.4.2. France

7.4.3. The United Kingdom

7.4.4. Italy

7.4.5. Iceland

7.4.6. Others

7.5. Middle East and Africa

7.5.1. Saudi Arabia

7.5.2. UAE

7.5.3. South Africa

7.5.4. Ethiopia

7.5.5. Others

7.6. Asia Pacific

7.6.1. Japan

7.6.2. China

7.6.3. India

7.6.4. Indonesia

7.6.5. Others

8. Competitive Environment and Analysis

8.1. Major Players and Strategy Analysis

8.2. Emerging Players and Market Lucrativeness

8.3. Mergers, Acquisitions, Agreements, and Collaborations

8.4. Vendor Competitiveness Matrix

9. Company Profiles

For more information about this report visit https://www.researchandmarkets.com/r/k8alcj


Contacts

ResearchAndMarkets.com
Laura Wood, Senior Press Manager
This email address is being protected from spambots. You need JavaScript enabled to view it.
For E.S.T Office Hours Call 1-917-300-0470
For U.S./CAN Toll Free Call 1-800-526-8630
For GMT Office Hours Call +353-1-416-8900

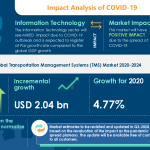
LONDON--(BUSINESS WIRE)--#GlobalTransportationManagementSystemsTMSMarket--Technavio has been monitoring the transportation management systems (TMS) market and it is poised to grow by USD 2.04 billion during 2020-2024, progressing at a CAGR of over over 8% during the forecast period. The report offers an up-to-date analysis regarding the current market scenario, latest trends and drivers, and the overall market environment.


Technavio suggests three forecast scenarios (optimistic, probable, and pessimistic) considering the impact of COVID-19. Please request Latest Free Sample Report on COVID-19 Impact

The market is fragmented, and the degree of fragmentation will accelerate during the forecast period. American Software Inc., Blue Yonder Group Inc., BluJay Solutions Inc., Continental Traffic Service Inc., Infor Inc., Manhattan Associates Inc., Oracle Corp., SAP SE, The Descartes Systems Group Inc., and Trimble Inc. are some of the major market participants. Although the adoption of technologically advanced devices will offer immense growth opportunities, data privacy concerns will challenge the growth of the market participants. To make the most of the opportunities, market vendors should focus more on the growth prospects in the fast-growing segments, while maintaining their positions in the slow-growing segments.

Transportation Management Systems (TMS) Market 2020-2024 : Segmentation

Transportation Management Systems (TMS) Market is segmented as below:

  • End-user
    • Large Enterprises
    • SMEs
    • Government Organizations
  • Geography
    • North America
    • Europe
    • APAC
    • MEA
    • South America
  • Solution
    • On-premise
    • Cloud-based

To learn more about the global trends impacting the future of market research, download a free sample: https://www.technavio.com/talk-to-us?report=IRTNTR43299

Related Reports on Information Technology Include:

Blockchain Technology Market in Transportation and Logistics Industry by Mode and Geography - Forecast and Analysis 2020-2024: The blockchain technology market size in transportation and logistics industry will decrease by USD 811.51 million during 2020-2024, and the market’s growth momentum will decelerate during the forecast period because of the decline in year-over-year growth.

Click and get a FREE sample report in minutes

Food Logistics Market by Transportation Mode and Geography - Forecast and Analysis 2020-2024: The food logistics market size has the potential to grow by USD 55.86 bn during 2020-2024, and the market’s growth momentum will accelerate during the forecast period. This report provides a detailed analysis of the market by transportation mode (roadways, railways, seaways, and airways) and geography (APAC, North America, Europe, MEA, and South America).

Click and get a FREE sample report in minutes

Transportation Management Systems (TMS) Market 2020-2024 : Scope

Technavio presents a detailed picture of the market by the way of study, synthesis, and summation of data from multiple sources. Our transportation management systems (TMS) market report covers the following areas:

  • Transportation Management Systems (TMS) Market size
  • Transportation Management Systems (TMS) Market trends
  • Transportation Management Systems (TMS) Market industry analysis

This study identifies advent of smart cities as one of the prime reasons driving the transportation management systems (TMS) market growth during the next few years.

Transportation Management Systems (TMS) Market 2020-2024 : Vendor Analysis

We provide a detailed analysis of around 25 vendors operating in the transportation management systems (TMS) market, including some vendors such as American Software Inc., Blue Yonder Group Inc., BluJay Solutions Inc., Continental Traffic Service Inc., Infor Inc., Manhattan Associates Inc., Oracle Corp., SAP SE, The Descartes Systems Group Inc., and Trimble Inc. Backed with competitive intelligence and benchmarking, our research reports on the transportation management systems (TMS) market are designed to provide entry support, customer profile and M&As as well as go-to-market strategy support.

Register for a free trial today and gain instant access to 17,000+ market research reports.

Technavio's SUBSCRIPTION platform

Transportation Management Systems (TMS) Market 2020-2024 : Key Highlights

  • CAGR of the market during the forecast period 2020-2024
  • Detailed information on factors that will assist transportation management systems (tms) market growth during the next five years
  • Estimation of the transportation management systems (TMS) market size and its contribution to the parent market
  • Predictions on upcoming trends and changes in consumer behavior
  • The growth of the transportation management systems (TMS) market
  • Analysis of the market’s competitive landscape and detailed information on vendors
  • Comprehensive details of factors that will challenge the growth of transportation management systems (TMS) market vendors

Table Of Contents :

Executive Summary

Market Landscape

  • Market ecosystem
  • Value chain analysis

Market Sizing

  • Market definition
  • Market segment analysis
  • Market size 2019
  • Market outlook: Forecast for 2019 - 2024

Five Forces Analysis

  • Five forces summary
  • Bargaining power of buyers
  • Bargaining power of suppliers
  • Threat of new entrants
  • Threat of substitutes
  • Threat of rivalry
  • Market condition

Market Segmentation by Solution

  • Market segments
  • Comparison by Solution
  • On-premise - Market size and forecast 2019-2024
  • Cloud-based - Market size and forecast 2019-2024
  • Market opportunity by Solution

Market Segmentation by End-user

  • Market segments

Customer Landscape

Geographic Landscape

  • Geographic segmentation
  • Geographic comparison
  • North America - Market size and forecast 2019-2024
  • Europe - Market size and forecast 2019-2024
  • APAC - Market size and forecast 2019-2024
  • MEA - Market size and forecast 2019-2024
  • South America - Market size and forecast 2019-2024
  • Key leading countries
  • Market opportunity by geography
  • Market drivers – Demand led growth
  • Market challenges
  • Market trends

Vendor Landscape

  • Vendor landscape
  • Landscape disruption

Vendor Analysis

  • Vendors covered
  • Market positioning of vendors
  • American Software Inc.
  • Blue Yonder Group Inc.
  • BluJay Solutions Inc.
  • Continental Traffic Service Inc.
  • Infor Inc.
  • Manhattan Associates Inc.
  • Oracle Corp.
  • SAP SE
  • The Descartes Systems Group Inc.
  • Trimble Inc.

Appendix

  • Scope of the report
  • Currency conversion rates for US$
  • Research methodology
  • List of abbreviations

About Us

Technavio is a leading global technology research and advisory company. Their research and analysis focuses on emerging market trends and provides actionable insights to help businesses identify market opportunities and develop effective strategies to optimize their market positions. With over 500 specialized analysts, Technavio’s report library consists of more than 17,000 reports and counting, covering 800 technologies, spanning across 50 countries. Their client base consists of enterprises of all sizes, including more than 100 Fortune 500 companies. This growing client base relies on Technavio’s comprehensive coverage, extensive research, and actionable market insights to identify opportunities in existing and potential markets and assess their competitive positions within changing market scenarios.


Contacts

Technavio Research
Jesse Maida
Media & Marketing Executive
US: +1 844 364 1100
UK: +44 203 893 3200
Email: This email address is being protected from spambots. You need JavaScript enabled to view it.
Website: www.technavio.com/

50 Remote Workers Will Be Accepted into the First Cohort of the Program and Receive a Free Round Trip Ticket to Hawai‘i

HONOLULU--(BUSINESS WIRE)--As winter approaches, the State of Hawai‘i announced Movers & Shakas, a new remote work program aimed at individuals – former Hawai‘i residents and those from out-of-state who want to work remotely from the islands. The program incorporates a unique “give and get” approach, seeking those who are passionate about the values of Hawai‘i and who have the skills and willingness to contribute to the local community.


Remote workers interested in joining the first cohort of the program are encouraged to fill out an online application by December 15, 2020; 50 applicants who meet the qualifications will be chosen for the first cohort and will receive a free round-trip ticket to O‘ahu. Subsequent applicants will be accepted to the program on a rolling basis. Hawai‘i currently has the lowest rate per capita of COVID infections in the country, also making it one of the safest places to live and work.

The program was launched through a partnership with the Hawai‘i state government, business leaders, alumni associations at schools and colleges, and founding organizations including the Central Pacific Bank Foundation, Hawai‘i Executive Collaborative, Island Holdings, Inkinen, and FCH Enterprises (parent company of Zippy’s restaurants). These partners developed Movers & Shakas to help provide some relief to Hawai‘i’s tourism industry, a main economic driver for the state that has been impacted due to the pandemic, while also creating a way to increase knowledge resources by connecting local and out-of-state professionals.

“We wanted to help fill the gap from the decrease we’ve experienced in the 7-day visitors to our state,” said Jason Higa, CEO of FCH Enterprises, parent company of Zippy’s, and leader who has spearheaded the program. “Now that many people have the choice to work remotely, there’s an opportunity for former local residents to return home and for out-of-state individuals and families to live and work from Hawai‘i for a longer period of time. We believe this program will attract many former Hawai‘i residents and professionals seeking a safe, warm environment to continue living their normal lives while contributing to the Hawai‘i community.”

About Movers & Shakas

The program will first launch on O‘ahu, with the first 50 qualified applicants receiving a free round-trip to the island. Future applicants will be accepted on a rolling basis and will eventually expand to neighboring islands at a later date. Program participants will receive access to promotions, special program benefits and opportunities to interact with the local community. Participants will also be asked to contribute their skill sets and knowledge to the community and businesses during their time in Hawai‘i.

“Give” Program Elements

Applicants to the program take a “Pledge to Our Keiki”, making a commitment to respect the culture and natural resources of Hawai‘i during their stay. The program also includes a skill match component, wherein Movers & Shakas participants commit several hours a week to a Hawai‘i nonprofit. The participants will apply their expertise to strengthen local communities.

“Get” Program Elements

In return for their volunteer work, Movers & Shakas program participants receive exclusive discounts on month-to-month accommodations, flights, restaurants, attractions and other services they need while living in Hawai‘i. Participants in the program also have access to networking opportunities with Hawai‘i business professionals and with other Movers & Shakas program participants.

Richard Matsui was both born and raised in Hawai‘i but lived away from the islands since graduating from high school. “The pandemic provided an unexpected opportunity for me to leave the San Francisco Bay Area and work remotely from Hawaii,” said Matsui, CEO and founder of kWh analytics, a data analytics and financial services firm for the solar energy industry. “I’m excited by the prospect of Movers & Shakas bringing even more people like me who can help to diversify our local economy.”

"As part of a Hawaii-based non-profit that is focused on getting people working, I am very excited about this program. It encourages people to come back to Hawaiʻi, not as spectators but actively supporting the growth of values rooted in the aloha spirit and making our state and communities stronger,” said John Leong, chief executive officer of KUPU. “By engaging with local non-profits, individuals gain a unique understanding of Hawaiʻi's values, while also adding their skills to positively impact people. Hawaiʻi is a place where those committed to sharing aloha and who have a vision for a better tomorrow can find fertile ground to plant seeds of hope that will make healthier communities and inspire our world in the process."

Other supporting members include Alohilani Resort, Outrigger Hotels and Prince Hotels.

For more information about the Movers & Shakas program, visit www.moversandshakas.org


Contacts

Media Contact:
Lynelle Marble
808-295-6162
This email address is being protected from spambots. You need JavaScript enabled to view it.

LONDON--(BUSINESS WIRE)--#GeneratorRentalMarketforOilandGasIndustry--The new generator rental market research for oil and gas industry from Technavio indicates neutral growth in the short term as the business impact of COVID-19 spreads.


Get detailed insights on the COVID-19 pandemic Crisis and Recovery analysis of the generator rental market for oil and gas industry.
Get FREE report sample within MINUTES

"One of the primary growth drivers for this market is the Constant Demand for Oil and Gas,” says a senior analyst for the Industrials industry at Technavio.

Despite the decrease in crude oil prices, there is a rise in demand for oil and gas around the world. This will increase the need for oil and gas production and exploration activities, in turn, boosting the demand for rental generators from the oil and gas industry. The decline of easy oil across the globe will lead to increased investments from the oil and gas companies towards enhancing the efficiency of their exploration activities, which will consequently drive the growth of the market.

As the markets recover Technavio expects the generator rental market size for oil and gas industry to grow by USD 153.87 million during the period 2020-2024.

Generator Rental Market for Oil and Gas Industry Segment Highlights for 2020

  • The generator rental market for oil and gas industry is expected to post a year-over-year growth rate of -2.57%.
  • Technologies such as enhanced oil recovery (EOR) and fracking vertical drilling consume more power than the regular processes.
  • With the industry adopting more of such technologies, the power consumption has increased. This has resulted in using multiple generators for supplying power to the equipment.
  • Therefore, power-intensive technologies and the easy availability of diesel is driving the use of diesel-powered generators in the oil and gas industry.
  • However, market growth in this segment will be slower than the growth of the market in the gas generator segment.

Regional Analysis

  • 33% of the growth will originate from the MEA region.
  • The increasing number of oil and gas activities will significantly drive generator rental market growth for oil and gas industry in this region over the forecast period.
  • Saudi Arabia and Iran (Islamic Republic of Iran) are the key markets for generator rental for oil and gas industry in MEA. Market growth in this region will be faster than the growth of the market in Europe and North America.

Click here to learn about report detailed analysis and insights on how you can leverage them to grow your business.

Related Reports on Industrials Include:

Global Low Voltage (LV) Diesel Generators Market: The global low voltage diesel generators (LVDGs) market has the potential to grow by USD 4.62 billion during 2020-2024, and the market’s growth momentum will accelerate throughout the forecast period because of the steady increase in year-over-year growth. To get extensive research insights: Click and Get FREE Sample Report in Minutes!

Global Mobile Power Generation Equipment Rentals Market: The mobile power generation equipment rentals market size has the potential to grow by $1.50 billion during 2020-2024, and the market’s growth momentum will accelerate during the forecast period because of the steady increase in year-over-year growth. To get extensive research insights: Click and Get FREE Sample Report in Minutes!

Notes:

  • The generator rental market for oil and gas industry size is expected to accelerate at a CAGR of almost 3% during the forecast period.
  • The generator rental market for oil and gas industry is segmented by Product (Diesel generator and Gas generator), Geography (MEA, North America, Europe, APAC, and South America), and Application (Onshore and Offshore).
  • The market is fragmented due to the presence of many established vendors holding significant market share.
  • The research report offers information on several market vendors, including Aggreko Plc, APR Energy, Ashtead Group Plc, Atlas Copco AB, Caterpillar Inc., Cummins Inc., Doosan Corp., Generac Power Systems Inc., Herc Holdings Inc., and United Rentals Inc.

Register for a free trial today to access 17,000+ market research reports using Technavio's SUBSCRIPTION platform

About Us
Technavio is a leading global technology research and advisory company. Their research and analysis focuses on emerging market trends and provides actionable insights to help businesses identify market opportunities and develop effective strategies to optimize their market positions. With over 500 specialized analysts, Technavio’s report library consists of more than 17,000 reports and counting, covering 800 technologies, spanning across 50 countries. Their client base consists of enterprises of all sizes, including more than 100 Fortune 500 companies. This growing client base relies on Technavio’s comprehensive coverage, extensive research, and actionable market insights to identify opportunities in existing and potential markets and assess their competitive positions within changing market scenarios.


Contacts

Technavio Research
Jesse Maida
Media & Marketing Executive
US: +1 844 364 1100
UK: +44 203 893 3200
Email: This email address is being protected from spambots. You need JavaScript enabled to view it.
Website: www.technavio.com/

Event to Feature a Range of Leading Private Sustainability Companies from Agtech, Energy, Environmental, Mobility, Transportation, and Water Verticals.

NEWPORT BEACH, Calif.--(BUSINESS WIRE)--#sustainprivatecapital--Sustain SoCal and ROTH Capital Partners have teamed up again, this time virtually, to present the 3rd annual Sustainability Private Capital Event on December 2-3, 2020.


This event will consist of virtual sector focus panels with ROTH Research Analysts and virtual 1-on-1 / small group meetings. This format will provide investors from venture capital, private equity, family offices, endowments, foundations, and angels the opportunity to meet with C-level executives with established private sustainability companies in the agtech, energy, environmental, mobility, transportation, and water verticals.

“We are excited to co-host our third annual sustainability investor event for private companies with Sustain SoCal. As the event continues to grow, we are bringing together a broader range of venture capital groups and strategic investors, from across the U.S. and beyond, to meet with early- and growth-stage sustainability companies,” said Brian Kremer, Managing Director of ROTH’s Cleantech investment banking team. “This event is another example of ROTH’s continued leadership in supporting the growth of sustainability companies, including capital formation and advisory services.”

Mr. Kremer continued, “As a founding member of Sustain SoCal, we are grateful for the organization’s continued commitment to accelerate economic growth and sustainability initiatives through innovation, collaboration, and education. This event is another example of Sustain SoCal’s position as an innovator in the sustainability community.”

Since 2014, ROTH has been involved in over 100 transactions for its Sustainability clients, with a total transaction value of over $6.9 billion. (Source: ROTH Capital Partners | 11/27/2020)

The 1-on-1 portion of this event is for institutional clients of ROTH and is by invitation only. For more information and panel registration, please see www.roth.com/sustainvirtual, or contact your ROTH event representative at 949-720-5700 or e-mail: This email address is being protected from spambots. You need JavaScript enabled to view it..

Event Agenda:

WEDNESDAY | DECEMBER 2, 2020

8:00am - 9:00am

Panel: Emerging Models in EV Charging

9:00am - 1:00pm

1-on-1 / Small Group Meetings

1:00pm - 2:00pm

Panel: Sustainability – Capital Markets are Open


THURSDAY | DECEMBER 3, 2020

8:00am - 9:00am

Panel: Data Opportunities in Water & HVAC

9:00am - 1:00pm

1-on-1 / Small Group Meetings

1:00pm - 2:00pm

Panel: Preparing for a Liquidity Event – SPAC vs IPO vs Venture

Participating Company List:

Company Name

Sub-Sector

Company Website (URL)

Aquacycl

Water

https://www.aquacycl.com/

Big Moon Power

Energy/Tidal

http://bigmoonpower.com/

BIOME

Environment/Air Quality

https://www.biome.us/

Blue Box Air

Energy/Efficiency

https://blueboxair.com/

Bluon

Energy/Efficiency

https://www.bluonenergy.com/

eCombustible

Energy/Hydrogen

https://www.ecombustible.com/

Electriphi

Mobility/EV Charging

https://www.electriphi.ai/

Energetic Insurance

Energy/Solar

https://www.energeticinsurance.com/

Enersponse

Energy/Water

https://enersponse.com/

EnviroPower

Energy/Power Gen

https://www.enviropowertec.com/

GBatteries

Energy/Storage

https://www.gbatteries.com/

In-Charge US

Mobility/EV Charging

https://www.inchargeus.com/

Inpipe Energy

Energy/Water

https://inpipeenergy.com/

IntelinAir

Agtech

https://www.intelinair.com/

Juice Bar

Mobility/EV Charging

https://www.juicebarev.com/

LogicalBuildings

Energy/Management

https://logicalbuildings.com

Loop Energy

Mobility/Hydrogen

https://loopenergy.com/

Lumin

Energy/Management

https://www.luminsmart.com/

Next Hydrogen

Energy/Hydrogen

https://nexthydrogen.com/

Ocean Aero

Mobility/Ocean Drone

https://www.oceanaero.com/

Peak Power

Energy/Management

http://www.peakpowerenergy.com

Pre-Switch

Energy/Power Conversion

https://www.pre-switch.com/

Sparkz Energy

Energy/Storage

http://www.sparkz.energy

Transcend Software, Inc.

Water

https://www.transcendh2o.com/

UrbE

Mobility/Last Mile

https://urb-e.com/

Veloce Energy

Mobility/EV Charging

https://www.veloceenergy.com/

Wynd

Environment/Air Quality

http://www.hellowynd.com

Xeal

Mobility/EV Charging

https://xealenergy.com/

Zero Energy Solutions

Energy/Management

https://www.zero.energy

Subject to Change | As of 11/27/2020

Event Sponsors:

Company Name

Company Website (URL)

Antenna

https://www.antennagroup.com/

LACI

https://laincubator.org/

MZ Group

https://mzgroup.us/esg-iq/

Silicon Valley Bank

https://www.svb.com/

Sustain SoCal

https://sustainsocal.org/

Toronto Stock Exchange

https://us.tsx.com/

About Sustain SoCal:

Sustain SoCal, a non-profit organization, accelerates sustainability and economic growth through innovation, collaboration, and education in Southern California. The organization has a ten-year history in exploring and implementing pragmatic, real-world solutions to the challenges created by growth, change, and inefficiency.

It conducts conferences, workshops, and networking events that lead to initiatives which positively impact our region's economic progress and sustainability. For more information, please visit www.sustainsocal.org.

About ROTH Capital Partners, LLC:

ROTH Capital Partners, LLC (ROTH), is a relationship-driven investment bank focused on serving emerging growth companies and their investors. As a full-service investment bank, ROTH provides capital raising, M&A advisory, analytical research, trading, market-making services, and corporate access. Headquartered in Newport Beach, CA, ROTH is privately held and employee owned, and maintains offices throughout the U.S. For more information on ROTH, please visit www.roth.com.


Contacts

Investor and Media Contact:
ROTH Capital Partners
Isabel Mattson-Pain
Director of Marketing & Corporate Access
This email address is being protected from spambots. You need JavaScript enabled to view it.
949-720-7117

DUBLIN--(BUSINESS WIRE)--The "Global Bunker Oil Market 2020-2024" report has been added to ResearchAndMarkets.com's offering.


The bunker oil market is poised to grow by 104.44 mn MT during 2020-2024, progressing at a CAGR of 4% during the forecast period.

This study identifies the rising global oil and gas consumption as one of the prime reasons driving the bunker oil market growth during the next few years. The market is driven by the increasing naval expenditure and an increase in global seaborne trade.

The reports on the bunker oil market provide a holistic analysis, market size and forecast, trends, growth drivers, and challenges, as well as vendor analysis covering around 25 vendors. The report offers an up-to-date analysis regarding the current global market scenario, latest trends and drivers, and the overall market environment.

The publisher presents a detailed picture of the market by the way of study, synthesis, and summation of data from multiple sources by an analysis of key parameters.

The robust vendor analysis is designed to help clients improve their market position, and in line with this, this report provides a detailed analysis of several leading bunker oil market vendors that include BP Plc, Chevron Corp., Exxon Mobil Corp., Hindustan Petroleum Corp. Ltd., Marquard & Bahls AG, PetroChina Co. Ltd., Public Joint Stock Company Gazprom, Royal Dutch Shell Plc, Total SA, and Toyota Tsusho Petroleum Pte. Ltd.

Also, the bunker oil market analysis report includes information on upcoming trends and challenges that will influence market growth. This is to help companies strategize and leverage on all forthcoming growth opportunities.

The study was conducted using an objective combination of primary and secondary information including inputs from key participants in the industry. The report contains a comprehensive market and vendor landscape in addition to an analysis of the key vendors.

Key Topics Covered:

Executive Summary

  • Market Overview

Market Landscape

  • Market ecosystem
  • Market characteristics
  • Value chain analysis

Market Sizing

  • Market definition
  • Market segment analysis
  • Market size 2019
  • Market outlook: Forecast for 2019 - 2024

Five Forces Analysis

  • Five forces summary
  • Bargaining power of buyers
  • Bargaining power of suppliers
  • Threat of new entrants
  • Threat of substitutes
  • Threat of rivalry
  • Market condition

Market Segmentation by Product

  • Market segments
  • Comparison by Product
  • Residual fuel - Market size and forecast 2019-2024
  • Distillate fuel - Market size and forecast 2019-2024
  • Market opportunity by Product

Customer landscape

Geographic Landscape

  • Geographic segmentation
  • Geographic comparison
  • APAC - Market size and forecast 2019-2024
  • Europe - Market size and forecast 2019-2024
  • North America - Market size and forecast 2019-2024
  • MEA - Market size and forecast 2019-2024
  • South America - Market size and forecast 2019-2024
  • Key leading countries
  • Market opportunity by geography
  • Market drivers
  • Market challenges
  • Market trends

Vendor Landscape

  • Vendor landscape
  • Landscape disruption
  • Competitive scenario

Vendor Analysis

  • Vendors covered
  • Market positioning of vendors
  • BP Plc
  • Chevron Corp.
  • Exxon Mobil Corp.
  • Hindustan Petroleum Corp. Ltd.
  • Marquard & Bahls AG
  • PetroChina Co. Ltd.
  • Public Joint Stock Company Gazprom
  • Royal Dutch Shell Plc
  • Total SA
  • Toyota Tsusho Petroleum Pte. Ltd.

Appendix

For more information about this report visit https://www.researchandmarkets.com/r/cqk76t


Contacts

ResearchAndMarkets.com
Laura Wood, Senior Press Manager
This email address is being protected from spambots. You need JavaScript enabled to view it.
For E.S.T Office Hours Call 1-917-300-0470
For U.S./CAN Toll Free Call 1-800-526-8630
For GMT Office Hours Call +353-1-416-8900

LONDON--(BUSINESS WIRE)--#apac--The Hydraulic Fracturing Market is poised to experience spend growth of more than USD 31 billion between 2020-2024 at a CAGR of over 7.25%. The report also provides the market impact and new opportunities created due to the COVID-19 pandemic. Request free sample pages


Read the 120-page research report with TOC and LOE on "Hydraulic Fracturing Market – Procurement Intelligence Report, Pricing Outlook in Geographies that include APAC, North America, South America, and MEA, and insights into best practices to optimize procurement spend."

SpendEdge's reports now include an in-depth complimentary analysis of the COVID-19 impact on procurement and the latest market data to help your company overcome sourcing challenges. Our Hydraulic Fracturing Market procurement intelligence report offers actionable procurement intelligence insights, sourcing strategies, and action plans to mitigate risks arising out of the current pandemic situation. The insights offered by our reports will help procurement professionals streamline supply chain operations and gain insights into the best procurement practices to mitigate losses.

Information on Latest Trends and Supply Chain Market Information Knowledge centre on COVID-19 impact assessment

Insights into the Market Price Trends

  • Suppliers in this market have moderate bargaining power owing to moderate pressure from substitutes and a moderate level of threat from new entrants.
  • Buyers can benchmark their preferred pricing models for hydraulic fracturing Market, Procurement, Management with the wider industry information and identify the cost-saving potential.

Insights to help buyers identify and shortlist the most suitable suppliers for their Hydraulic Fracturing Market requirements. This procurement report answers the following questions:

  • Am I engaging with the right suppliers?
  • Which KPIs should I use to evaluate my incumbent suppliers?
  • Which supplier selection criteria are relevant for?
  • What are the Hydraulic Fracturing Market category essentials in terms of SLAs and RFx?

To get instant access to over 1000 market-ready procurement intelligence reports without any additional costs or commitment, Subscribe Now for Free.

Insights into strategies that will help buyers optimize their category management practices. The report answers the following questions:

  • What should be my strategic procurement objectives, activities, and enablers for the Hydraulic Fracturing Market category?
  • What negotiation levers can I pull for cost-saving?
  • What are Hydraulic Fracturing Market procurement best practices I should be promoting in my supply chain?

Some of the top Hydraulic Fracturing Market suppliers enlisted in this report

This Hydraulic Fracturing Market procurement intelligence report has enlisted the top suppliers and their cost structures, SLA terms, best selection criteria, and negotiation strategies.

  • Schlumberger NV
  • Halliburton Co.
  • Baker Hughes Co.
  • FTS International Inc.
  • NexTier Oilfield Solutions Inc.
  • Superior Energy Services Inc.
  • RPC Inc.
  • Calfrac Well Services Ltd.
  • Trican Well Service Ltd.
  • Basic Energy Services Inc.

Get access to regular sourcing and procurement insights to our digital procurement platform- Contact Us.

Table of Content

Executive Summary

Market Insights

Category Pricing Insights

Cost-saving Opportunities

Best Practices

Category Ecosystem

Category Management Strategy

Category Management Enablers

Suppliers Selection

Suppliers under Coverage

US Market Insights

Category scope

Appendix

About SpendEdge:

SpendEdge shares your passion for driving sourcing and procurement excellence. We are the preferred procurement market intelligence partner for 120+ Fortune 500 firms and other leading companies across numerous industries. Our strength lies in delivering robust, real-time procurement market intelligence reports and solutions. To know more https://www.spendedge.com/request-for-demo


Contacts

SpendEdge
Anirban Choudhury
Marketing Manager
US: +1 630 984 7340
UK: +44 148 459 9299
https://www.spendedge.com/contact-us

LONDON & PARIS & HOUSTON--(BUSINESS WIRE)--TechnipFMC (NYSE:FTI) (PARIS:FTI) (ISIN:GB00BDSFG982) has successfully completed the remaining conditions required to enable work to commence on the Engineering, Procurement, and Construction (EPC) contract with Assiut National Oil Processing Company (ANOPC) for the construction of a new Hydrocracking Complex for the Assiut refinery in Egypt.


As previously announced, this major(1) EPC contract covers new process units such as a Vacuum Distillation Unit, a Diesel Hydrocracking Unit, a Delayed Coker Unit, a Distillate Hydrotreating Unit as well as a Hydrogen Production Facility Unit using TechnipFMC’s steam reforming proprietary technology. The project also includes other process units, interconnecting, offsites and utilities.

The project supports the Egyptian Government’s Energy Transition strategy and will reinforce the economic growth of rural areas while minimizing environmental emissions as well as reducing the government export bill. The complex will transform lower-value petroleum products from Assiut Oil Refining Company’s (ASORC) nearby refinery into approximately 2.8 million tons per year of cleaner products, such as Euro V diesel.

The contract award will be included in the Company’s fourth quarter 2020 inbound orders.

(1) For TechnipFMC, a “major” contract is over $1.0 billion.

Important Information for Investors and Securityholders

Forward-Looking Statement

This release contains "forward-looking statements" as defined in Section 27A of the United States Securities Act of 1933, as amended, and Section 21E of the United States Securities Exchange Act of 1934, as amended. The words “believe”, “estimated” and other similar expressions are intended to identify forward-looking statements, which are generally not historical in nature. Such forward-looking statements involve significant risks, uncertainties and assumptions that could cause actual results to differ materially from our historical experience and our present expectations or projections. For information regarding known material factors that could cause actual results to differ from projected results, please see our risk factors set forth in our filings with the United States Securities and Exchange Commission, which include our Annual Reports on Form 10-K, Quarterly Reports on Form 10-Q, and Current Reports on Form 8-K. We caution you not to place undue reliance on any forward-looking statements, which speak only as of the date hereof. We undertake no obligation to publicly update or revise any of our forward-looking statements after the date they are made, whether as a result of new information, future events or otherwise, except to the extent required by law.

About TechnipFMC

TechnipFMC is a global leader in the energy industry; delivering projects, products, technologies and services. With our proprietary technologies and production systems, integrated expertise, and comprehensive solutions, we are transforming our customers’ project economics.

Organized in three business segments — Subsea, Surface Technologies and Technip Energies — we are uniquely positioned to deliver greater efficiency across project lifecycles from concept to project delivery and beyond. Through innovative technologies and improved efficiencies, our offering unlocks new possibilities for our customers in developing their energy resources and in their positioning to meet the energy transition challenge.

Each of our approximately 37,000 employees is driven by a steady commitment to clients and a culture of project execution, purposeful innovation, challenging industry conventions, and rethinking how the best results are achieved.

TechnipFMC utilizes its website www.TechnipFMC.com as a channel of distribution of material company information. To learn more about us and how we are enhancing the performance of the world’s energy industry, go to www.TechnipFMC.com and follow us on Twitter @TechnipFMC.


Contacts

Investor relations
Matt Seinsheimer
Vice President Investor Relations
Tel: +1 281 260 3665
Email: This email address is being protected from spambots. You need JavaScript enabled to view it.

Phillip Lindsay
Director Investor Relations Europe
Tel: +44 203 429 3929
Email: This email address is being protected from spambots. You need JavaScript enabled to view it.

Media relations
Christophe Belorgeot
Senior Vice President Corporate Engagement
Tel: +33 1 47 78 39 92
Email: This email address is being protected from spambots. You need JavaScript enabled to view it.

Jason Hyonne
Public Relations Officer
Tel: +33 1 47 78 22 89
Email: This email address is being protected from spambots. You need JavaScript enabled to view it.

PRINCETON, N.J.--(BUSINESS WIRE)--$NRG--NRG Energy Inc. (NYSE:NRG) today announced that the Federal Energy Regulatory Commission (FERC) approved the previously announced acquisition of Direct Energy from Centrica PLC. The acquisition is expected to close in early January 2021, with a target date of January 5th.

Forward-Looking Statements

This news release contains forward-looking statements within the meaning of Section 27A of the Securities Act of 1933 and Section 21E of the Securities Exchange Act of 1934. Forward-looking statements are subject to certain risks, uncertainties and assumptions and typically can be identified by the use of words such as “expect,” “estimate,” “should,” “anticipate,” “forecast,” “plan,” “guidance,” “outlook,” “believe” and similar terms. Although NRG believes that the expectations are reasonable, it can give no assurance that these expectations will prove to be correct, and actual results may vary materially.

NRG undertakes no obligation to update or revise any forward-looking statements, whether as a result of new information, future events or otherwise, except as required by law. The foregoing review of factors that could cause NRG’s actual results to differ materially from those contemplated in the forward-looking statements included in this news release should be considered in connection with information regarding risks and uncertainties that may affect NRG’s future results included in NRG’s filings with the SEC at www.sec.gov.

About NRG

At NRG, we’re bringing the power of energy to people and organizations by putting customers at the center of everything we do. We generate electricity and provide energy solutions and natural gas to more than 3.7 million residential, small business, and commercial and industrial customers through our diverse portfolio of retail brands. A Fortune 500 company, operating in the United States and Canada, NRG delivers innovative solutions while advocating for competitive energy markets and customer choice, and by working towards a sustainable energy future. More information is available at www.nrg.com. Connect with NRG on Facebook, LinkedIn and follow us on Twitter @nrgenergy, @nrginsight.


Contacts

Investors:
Kevin L. Cole, CFA
Investor Relations
609.524.4526
This email address is being protected from spambots. You need JavaScript enabled to view it.

Media:
Candice Adams
Corporate Communications
NRG Energy
(609) 524-5428
This email address is being protected from spambots. You need JavaScript enabled to view it.

REDWOOD CITY, Calif.--(BUSINESS WIRE)--C3.ai, a leading enterprise AI software provider for accelerating digital transformation, today announced plans to commence the roadshow for its proposed initial public offering. C3.ai has filed a registration statement on Form S-1 with the Securities and Exchange Commission (“SEC”) to offer 15,500,000 shares of its Class A common stock to the public. C3.ai also intends to grant the underwriters a 30-day option to purchase up to an additional 2,325,000 shares of Class A common stock from C3.ai. The initial public offering price is expected to be between $31.00 and $34.00 per share. C3.ai’s Class A common stock has been approved for listing under the ticker symbol “AI” on the New York Stock Exchange.


Morgan Stanley, J.P. Morgan and BofA Securities are acting as lead book-running managers for the proposed offering. Deutsche Bank Securities is acting as a book-running manager for the proposed offering. Canaccord Genuity, JMP Securities, KeyBanc Capital Markets, Needham & Company, Piper Sandler and Wedbush Securities are acting as co-managers for the proposed offering.

The proposed offering will be made only by means of a prospectus. Copies of the preliminary prospectus relating to the offering may be obtained, when available, from:

  • Morgan Stanley & Co. LLC, 180 Varick Street, 2nd Floor, New York, New York 10014, Attn: Prospectus Department;
  • J.P. Morgan Securities LLC, c/o Broadridge Financial Solutions, 1155 Long Island Avenue, Edgewood, NY 11717, by telephone at 1-866-803-9204, or by email at This email address is being protected from spambots. You need JavaScript enabled to view it.; or
  • BofA Securities, NC1-004-03-43, 200 North College Street, 3rd floor, Charlotte, NC 28255-0001, Attn: Prospectus Department or by email at This email address is being protected from spambots. You need JavaScript enabled to view it..

A registration statement on Form S-1 relating to these securities has been filed with the SEC but has not yet become effective. These securities may not be sold, nor may offers to buy be accepted prior to the time the registration statement becomes effective.

This press release shall not constitute an offer to sell or the solicitation of an offer to buy these securities, nor shall there be any sale of these securities in any state or jurisdiction in which such offer, solicitation or sale would be unlawful prior to registration or qualification under the securities laws of any such state or jurisdiction.

About C3.ai

C3.ai is a leading enterprise AI software provider for accelerating digital transformation. C3.ai delivers the C3 AI Suite for developing, deploying, and operating large-scale AI, predictive analytics, and IoT applications in addition to an increasingly broad portfolio of turn-key AI applications. The core of the C3.ai offering is a proprietary, model-driven AI architecture that enhances data science and application development.


Contacts

Public Relations

Edelman for C3.ai
Julia Sahin
646-301-2968
This email address is being protected from spambots. You need JavaScript enabled to view it.

Lisa Kennedy
415-914-8336
This email address is being protected from spambots. You need JavaScript enabled to view it.

HOUSTON--(BUSINESS WIRE)--Tellurian Inc. (Tellurian) (NASDAQ: TELL) today named ­­Octávio Simões as President and Chief Executive Officer (CEO), and Jonathan Gross and Jean Abiteboul as new independent Board members, adding significant strength to an already experienced team.


Mr. Simões was President and CEO of Sempra LNG & Midstream where he was responsible for all liquefied natural gas (LNG) and natural gas midstream activities, including Cameron LNG, a 12 million tonnes per annum (mtpa) liquefaction facility that came onstream with first LNG exports in August 2019. Mr. Simões joined Tellurian as Executive Vice President, LNG Marketing and Business Development. He has engineering degrees from the Georgia Institute of Technology and from the University of Massachusetts – Dartmouth, and is a registered professional engineer.

As independent directors, Jonathan Gross and Jean Abiteboul bring vast upstream and LNG marketing experience to the Board.

Jonathan Gross is an oil and gas consultant and his company Jexco LLC provides upstream exploration and geological services. Formerly, he was a Senior Vice President of Energy Partners, Ltd., and also worked at Kuwait Energy Company and Cheniere Energy. He served on the Board of Directors for Cheniere Energy Holdings from 2014 to 2018. Mr. Gross is a Certified Geologist.

Jean Abiteboul is President of GIIGNL, the Paris- based International Group of LNG Importers founded in 1971. GIIGNL has 86 member companies headquartered in 27 countries, and GIIGNL members handle more than 90% of LNG imports worldwide. He is an engineer and was formerly President of Cheniere Marketing Ltd and an Executive Officer of Cheniere Energy, Inc. Mr. Abiteboul began and spent the majority of his career at Gaz de France (now Engie), serving in various executive capacities and on various boards.

Tellurian’s former President and CEO Meg Gentle is departing the company.

Executive Chairman Charif Souki said, “I watched Octávio put together a complex project at Cameron LNG with admiration. He and I together are responsible for 75 percent of the U.S. liquefaction capacity and I am delighted now to have the opportunity to work with him on Driftwood LNG, the next big milestone in U.S. liquefaction. With our Board of Director additions, Jean will bring a unique perspective on the global LNG market, and Jon has a deep understanding of the U.S. upstream industry. We stand at a critical inflection point in the energy sector. The fundamentals are now very supportive of our business model to launch an integrated American global natural gas company at Driftwood. Octávio, Jean and Jon will make a huge contribution to that effort. The Tellurian team thanks Meg for her hard work and significant contributions to the company over the past four years and we wish her all the best in the future.”

About Tellurian Inc.

Tellurian intends to create value for shareholders by building a low-cost, global natural gas business, profitably delivering natural gas to customers worldwide. Tellurian is developing a portfolio of natural gas production, LNG trading, and infrastructure that includes an ~ 27.6 mtpa LNG export facility and an associated pipeline. Tellurian is based in Houston, Texas, and its common stock is listed on the Nasdaq Capital Market under the symbol “TELL”.

For more information, please visit www.tellurianinc.com. Follow us on Twitter at twitter.com/TellurianLNG

CAUTIONARY INFORMATION ABOUT FORWARD-LOOKING STATEMENTS

This press release contains forward-looking statements within the meaning of U.S. federal securities laws. The words “anticipate,” “assume,” “believe,” “budget,” “estimate,” “expect,” “forecast,” “initial,” “intend,” “may,” “plan,” “potential,” “project,” “proposed,” “should,” “will,” “would,” and similar expressions are intended to identify forward-looking statements. Forward-looking statements herein relate to, among other things, benefits to be provided by the Company’s new directors and CEO and the prospects for the Driftwood project. These statements involve a number of known and unknown risks, which may cause actual results to differ materially from expectations expressed or implied in the forward-looking statements. These risks include the matters discussed in Item 1A of Part I of the Annual Report on Form 10-K of Tellurian for the fiscal year ended December 31, 2019, and other Tellurian filings with the Securities and Exchange Commission, all of which are incorporated by reference herein. The forward-looking statements in this press release speak as of the date of this release. Although Tellurian may from time to time voluntarily update its prior forward-looking statements, it disclaims any commitment to do so except as required by securities laws.


Contacts

Media:
Joi Lecznar
SVP Public Affairs and Communication
Phone +1.832.962.4044
This email address is being protected from spambots. You need JavaScript enabled to view it.

Investors:
Matt Phillips
Senior Manager, Investor Relations
Phone +1.832.320.9331
This email address is being protected from spambots. You need JavaScript enabled to view it.

  • The Lion Electric Company (“Lion” or the “Company”), a leading manufacturer of all-electric medium and heavy-duty urban vehicles, is combining with Northern Genesis Acquisition Corp. (“Northern Genesis”) (NYSE: NGA) and the combined entity is expected to be listed on the New York Stock Exchange (NYSE) under the new ticker symbol “LEV”.
  • Pro forma implied market capitalization of the combined company of $1.9 billion.
  • Transaction includes a $200 million fully committed private placement of common shares in Lion (PIPE).
  • Proceeds will be used to fund Lion’s growth strategy, including the planned expansion of the Company’s U.S. manufacturing capacity, continued development of advanced battery systems, the planned construction of a highly automated battery system assembly factory and other general corporate purposes.
  • Proposed transaction is expected to allow Lion to further solidify its current leadership in all-electric medium and heavy-duty urban vehicles.
  • CEO - Founder Marc Bedard and Chairman Pierre Larochelle will be joined by Northern Genesis’ Ian Robertson and Chris Jarratt on a newly formed board of directors.

KANSAS CITY, Mo. & SAINT-JÉRÔME, Québec--(BUSINESS WIRE)--The Lion Electric Company, a leading designer, manufacturer and distributor of all-electric medium and heavy-duty urban vehicles, announced today it intends to combine with Northern Genesis Acquisition Corp. (NYSE: NGA), a publicly traded special purpose acquisition company focused on a commitment to sustainability and strong alignment with environmental, social and governance principles. Upon closing of the transaction, a wholly-owned subsidiary of Lion will merge with and into Northern Genesis, and Lion is expected to be listed on the New York Stock Exchange (NYSE) under the new ticker symbol “LEV”.


The transaction is expected to bolster Lion’s market leading position in all-electric medium and heavy-duty urban vehicles by supporting the planned construction of a state-of-the-art vehicle manufacturing facility in the U.S., the continued development of advanced battery systems, the planned construction of a highly automated battery system assembly factory and other general corporate purposes.

“This transaction marks an important milestone in Lion’s continued emergence as a market leader in the design, manufacturing and distribution of purpose-built, all-electric medium and heavy-duty urban vehicles” said Marc Bedard, Lion’s CEO - Founder. “The business combination with Northern Genesis provides us with capital to fund Lion’s strategic initiatives, in addition to valuable expertise from Ian Robertson, Chris Jarratt and the Northern Genesis team.”

Founded in 2008, Lion is an established industry leader in all-electric medium and heavy-duty urban vehicles, with over 300 vehicles currently on the road and an impressive operational track record of over 6 million miles driven. Lion offers seven purpose-built electric truck and bus models available for purchase today and which are being delivered from its existing 2,500 vehicle per year manufacturing facility. With Lion buses on the road today and initial truck deliveries in process, Lion expects to quickly ramp up with 650 truck and bus deliveries planned for 2021. Over its coming four year planning horizon, Lion has identified 6,000 potential vehicle sales, approximately 2/3 trucks and 1/3 buses; the marketing plan is supported by over 300 purchase orders in hand and a growing sales pipeline.

“In forming Northern Genesis, we were focused on engaging with a business whose value proposition is proven by current customers, whose tangible growth prospects will be energized by exposure to the public markets and whose experienced management team fosters a winning culture,” said Ian Robertson, co-founder of Northern Genesis. “Lion surpasses our expectations on all these dimensions and we are confident that it has potential to be a great public company in the emerging decarbonized economy.”

Marc Bedard will continue as CEO - Founder of the combined company, overseeing the Company’s strategic growth initiatives and expansion. He is joined by Lion’s existing executive team which includes Nicolas Brunet, EVP & CFO and Yannick Poulin, COO. The combined company will have a board of directors consisting of nine directors, including Marc Bedard, CEO - Founder, Pierre Larochelle (from Power Sustainable) as Chairman, and five other existing Lion Board members, as well as Ian Robertson and Chris Jarratt, co-founders of Algonquin Power & Utilities Corp (NYSE: AQN), who will join the board effective as of closing.

Transaction Overview

The pro forma implied market capitalization of the combined company is $1.9 billion, at the $10.00 per share PIPE subscription price and assuming no public shareholders of Northern Genesis exercise their redemption rights. The company is expected to receive approximately $500 million of net cash proceeds in connection with the transaction, comprised of $200 million from a PIPE and approximately $320 million of cash held in trust by Northern Genesis assuming no public shareholders of Northern Genesis exercise their redemption rights at closing.

The combined net cash proceeds will be used to fund Lion’s growth strategy, including the planned construction of a state-of-the-art U.S. based vehicle manufacturing facility, the continued development of advanced battery systems, the planned construction of a highly automated battery factory and other general corporate purposes.

The existing shareholders of Lion will continue to hold their equity ownership in the combined company, and in some cases they will increase their equity ownership by participating, together with certain Northern Genesis officers and directors, in the PIPE. Following completion of the transaction, it is expected that Lion’s existing shareholders will hold approximately 70%1 of the combined company’s common equity assuming no redemptions from Northern Genesis’s public stockholders.

The board of directors of Northern Genesis, and the board of directors and the shareholders of Lion, unanimously approved the transaction. Completion of the proposed transaction is subject to customary closing conditions, including the approval of the stockholders of Northern Genesis and a post-closing minimum cash balance available to fund Lion’s growth program of $200 million (net of any redemptions), and is expected to occur in the first quarter of 2021.

National Bank Financial, BMO Capital Markets and Roth Capital Partners, LLC are serving as financial advisors, and Stikeman Elliott LLP and Vinson & Elkins L.L.P. are serving as legal advisors to Lion. Barclays Capital Inc. is serving as exclusive M&A and capital markets advisor, and Husch Blackwell and Borden Ladner Gervais LLP are serving as legal advisors to Northern Genesis. Barclays Capital Inc. is serving as lead placement agent and BMO Capital Markets and Roth Capital Partners, LLC are serving as placement agents. Mayer Brown LLP is serving as legal advisor to the lead placement agent.

Investor Conference Call Information

Lion and Northern Genesis will host a joint investor conference call to discuss the proposed transaction today, Monday, November 30, 2020 at 8:30 am ET.

To listen to the prepared remarks via telephone dial 1-877-407-4018 (U.S.) or 1-201-689-8471 (International) and an operator will assist you. A telephone replay will be available at 1-844-512-2921 (U.S.) or 1-412-317-6671 (International), passcode: 13713746 through December 14, 2020 at 11:59 pm ET.

About The Lion Electric Company

The Lion Electric Company is an innovative manufacturer of zero-emission vehicles. The company creates, designs, and manufactures all-electric class 5 to class 8 commercial urban trucks and all-electric buses and minibuses for the school, paratransit, and mass transit markets. Lion is a North American leader in electric transportation and designs, builds, and assembles all of its vehicles’ components, including, chassis, battery packs, truck cabins and bus bodies.

Always actively seeking new and reliable technologies, Lion vehicles have unique features that are specifically adapted to its users and their everyday needs. Lion believes that transitioning to all-electric vehicles will lead to major improvements in our society, environment, and overall quality of life.

Lion Electric, The Bright Move

For more information, visit thelionelectric.com

About Northern Genesis Acquisition Corp.

Northern Genesis Acquisition Corp. (NYSE: NGA) is a special purpose acquisition company formed for the purpose of effecting a merger, stock exchange, acquisition, reorganization or similar business combination with one or more businesses. The Northern Genesis management team brings a unique entrepreneurial owner-operator mindset and a proven history of creating shareholder value across the sustainable power and energy value chain. Northern Genesis is committed to helping the next great public company find its path to success; a path which will most certainly recognize the growing sensitivity of customers, employees and investors to alignment with the principles underlying sustainability.

About Power Sustainable

Power Sustainable is a global multi-platform alternative asset manager with investments in sustainable strategies and offices in Montréal, Toronto, and Shanghai. Power Sustainable is currently comprised of two platforms: the Pacific platform invests in the China equity markets, seeking high-quality, sustainable business models with a fundamentals based, research-driven investment process; and the Energy platform invests in the development, construction and operations of renewable energy infrastructure assets in North America. The Company leverages its investment capabilities and those of its partners to build projects of significance that benefit the planet, assure steady growth and create long-term value. Power Sustainable is a wholly owned subsidiary of Power Corporation of Canada. For more information, visit www.powersustainable.com

Important Information and Where to Find It

In connection with the transaction, Lion intends to file a registration statement on Form F-4, (the “Registration Statement”) with the U.S. Securities and Exchange Commission (the “SEC”), which will include a proxy statement of Northern Genesis in connection with Northern Genesis’ solicitation of proxies for the vote by its stockholders with respect to the transaction and other matters as described in the Registration Statement, as well as the prospectus relating to the registration of the securities to be issued by Lion to Northern Genesis’ stockholders in connection with the transaction. After the Registration Statement has been filed and declared effective, Northern Genesis will mail a definitive proxy statement, when available, to its stockholders. Investors and security holders of Northern Genesis and other interested parties are urged to read the Registration Statement, any amendments thereto and any other documents filed with the SEC carefully and in their entirety when they become available because they will contain important information about Northern Genesis, Lion and the transaction. Investors and security holders of Northern Genesis may obtain free copies of the preliminary proxy statement/prospectus and definitive proxy statement/prospectus (when available) and other documents filed with the SEC by Northern Genesis and Lion through the website maintained by the SEC at http://www.sec.gov.The information contained on, or that may be accessed through, the websites referenced in this press release is not incorporated by reference into, and is not a part of, this press release.

Participants in the Solicitation

Northern Genesis and its directors and executive officers and other persons may be deemed to be participants in the solicitations of proxies from Northern Genesis’ stockholders in respect of the proposed transaction. Lion and its officers and directors may also be deemed participants in such solicitation. Information regarding Northern Genesis’ directors and executive officers is available under the heading “Management” in its final prospectus dated August 17, 2020 filed with the SEC on August 18, 2020. Additional information regarding the participants in the proxy solicitation and a description of their direct and indirect interests, by security holdings or otherwise, which may, in some cases, be different than those of their stockholders generally, will be contained in the proxy statement/prospectus and other relevant materials to be filed with the SEC in connection with the transaction when they become available. Stockholders, potential investors and other interested persons should read the proxy statement/prospectus carefully when it becomes available before making any voting or investment decisions. When available, these documents can be obtained free of charge from the sources indicated above.

No Offer or Solicitation

This press release shall not constitute an offer to sell or the solicitation of an offer to buy any securities or constitute a solicitation of any vote or approval. No offer of securities, other than with respect to the PIPE, shall be made except by means of a prospectus meeting the requirements of Section 10 of the Securities Act of 1933, as amended (the “Securities Act”).

Currency

All amounts in this press release are indicated in US dollars unless indicated otherwise.

Forward-Looking Statement

All statements other than statements of historical facts contained in this press release constitute “forward-looking statements” (which shall include forward-looking information within the meaning of Canadian securities laws) within the meaning of Section 27A of the Securities Act. Forward-looking statements may generally be identified by the use of words such as “believe,” “may,” “will,” “continue,” “anticipate,” “intend,” “expect,” “should,” “would,” “could,” “plan,” “project,” “potential,” “seem,” “seek,” “future,” “target” or other similar expressions that predict or indicate future events or trends or that are not statements of historical matters, although not all forward-looking statements contain such identifying words. These forward-looking statements include, but are not limited to, statements regarding the transaction, including with respect to timing and closing thereof, the ability to consummate the transaction, the benefits of the transaction, the ability to satisfy the Cash Condition, the completion of the PIPE, estimates and forecasts of financial and other performance metrics, visibility on potential orders and business relationships, sufficiency and use of funds following completion of the proposed transaction, as well as the combined company’s strategy, future operations, estimated financial position, estimated revenues and losses, projected costs, prospects, plans and objectives of management. These statements are based on various assumptions, whether or not identified in this press release, and on the current expectations of Lion’s and Northern Genesis’ management and are not predictions of actual performance. These forward-looking statements are provided for the purpose of assisting readers in understanding certain key elements of the Company’s current objectives, goals, targets, strategic priorities, expectations and plans, and in obtaining a better understanding of the Company’s business and anticipated operating environment. Readers are cautioned that such information may not be appropriate for other purposes and is not intended to serve as, and must not be relied on by any investor as a guarantee, an assurance, a prediction or a definitive statement of fact or probability.

Forward-looking statements involve inherent risks and uncertainties, most of which are difficult to predict and many of which are beyond the control of Lion and Northern Genesis, and are based on a number of assumptions, as well as other factors that the Company and Northern Genesis believe are appropriate and reasonable in the circumstances, but there can be no assurance that such estimates and assumptions will prove to be correct or that the Company’s vision, business, objectives, plans and strategies will be achieved. Many risks and uncertainties could cause the Company’s actual results, performance or achievements or future events or developments to differ materially from those expressed or implied by the forward-looking statements, including any adverse changes in the U.S. and Canadian general economic, business, market, financial, political and legal conditions; the Company’s inability to successfully and economically manufacture and distribute its vehicles at scale and meet its customers’ business needs; the Company’s inability to execute its growth strategy; the Company’s inability to maintain its competitive position; the Company’s inability to reduce its costs of supply overtime; any inability to maintain and enhance the Company’s reputation and brand; any significant product repair and/or replacement due to product warranty claims or product recalls; any failure of information technology systems or any cybersecurity and data privacy breaches or incidents; natural disasters, epidemic or pandemic outbreaks, boycotts and geo-political events; the risk that a condition to closing of the transaction (including the obtention of Northern Genesis’ stockholders approval) may not be satisfied; the failure to realize the anticipated benefits of the proposed transaction; the amount of redemption requests made by Northern Genesis’ public stockholders; the risk that the proposed transaction disrupts Lion’s or Northern Genesis’ current plans and operations as a result of the announcement of the transaction; the outcome of any legal proceedings that may be instituted against Lion or Northern Genesis following announcement of the transaction; the inability of the parties to successfully or timely consummate the proposed transaction; and those factors discussed in Northern Genesis’ final prospectus dated August 17, 2020, and any subsequently filed Quarterly Report on Form 10‑Q, in each case, under the heading “Risk Factors,” and other documents of Northern Genesis filed, or to be filed, with the SEC, as well as any documents to be filed by Lion in accordance with applicable securities laws. These factors are not intended to represent a complete list of the factors that could affect the Company, and there may be additional risks that neither Northern Genesis nor Lion presently know or that Northern Genesis and Lion currently believe are immaterial that could also cause actual results to differ from those contained in the forward-looking statements. In addition, forward-looking statements reflect Northern Genesis’ and Lion’s expectations, plans or forecasts of future events and views as of the date of this press release. Northern Genesis and Lion anticipate that subsequent events and developments will cause Northern Genesis’ and Lion’s assessments to change. However, while Northern Genesis and Lion may elect to update these forward-looking statements at some point in the future, Northern Genesis and Lion have no intention and undertake no obligation to do so except as required by applicable law. These forward-looking statements should not be relied upon as representing Northern Genesis’ and Lion’s assessments as of any date subsequent to the date of this press release.


1 In addition to rolling its current interest, Power Sustainable Capital (a wholly owned subsidiary of Power Corporation of Canada) is subscribing to an incremental $17 million of equity ownership as part of the PIPE.


Contacts

The Lion Electric Company

For Investors:
This email address is being protected from spambots. You need JavaScript enabled to view it.

For Media:
Patrick Gervais
Vice-President, Marketing and Communications
Cell: 514-992-1060
This email address is being protected from spambots. You need JavaScript enabled to view it.

Northern Genesis Acquisition Corp.
Avi Das
Investor Relations
This email address is being protected from spambots. You need JavaScript enabled to view it.
Phone: 816-514-0324

DUBLIN--(BUSINESS WIRE)--The "Oil Refining Industry in Kuwait 2020" report has been added to ResearchAndMarkets.com's offering.


The downstream energy sector report is a complete source of information on Kuwait crude oil refining industry. It provides refinery level information relating to existing and planned (new build) refineries such as insights and forecasts of refinery capacities, refined petroleum products production and consumption, refinery complexity factor and comparison against peer group countries in the respective region. The report also covers complete details of major players operating in the refining sector in Kuwait and in depth analysis of the latest industry news and deals.

Report Scope

  • Outlook of Country Oil Refining Industry and refined petroleum products beyond 2020
  • Forecasts of refined products production and consumption along with major refining companies and operators.
  • Historic and Forecasted Refining capacity and secondary units capacities beyond 2020
  • Key Opportunities and Restraints in country Refinery market
  • Benchmark with five peer group countries on Nelson Complexity Factor.
  • Market structure of Country Refining Industry, companies, capacities and market share.
  • Information on planned refineries such as planned capacity, equity structure, Operator Company, expected commissioning date and project cost.
  • Refined petroleum products production and demand beyond 2020.
  • Refinery level information such as refinery name, commissioned year, primary and secondary units installed capacities along with future capacity expansions, refinery complexity factor, ownership and operator details.
  • Company profiles of major refining companies including SWOT Analysis.
  • Latest mergers, acquisitions, contract announcements and all related industry news and deals analysis.


Key Topics Covered:

1 Table of Contents

1.1 List of Figures

1.2 List of Tables

2 Introduction to Kuwait Refining Markets

3 Refining Industry in Kuwait

3.1 Kuwait Refining Market Snapshot, 2019

3.2 Role of Kuwait in Global and Regional Refining Markets

3.2.1 Contribution to the Middle East and Africa and Global Refining Capacity, 2019

3.2.2 Kuwait Average Nelson Complexity Factor (NCF) vs. Middle East and Africa and Global, 2019

4 Kuwait Refining Market- Drivers and Restraints

4.1 Kuwait Refining Industry: Trends and Issues

4.1.1 Kuwait Refining Industry: Major Trends

4.2 Major Restrains of Investing in Kuwait Refining Sector

5 Kuwait Oil Products Demand and Supply Forecast to 2025

5.1 Kuwait Refined Products Demand Forecast to 2025

5.1.1 Kuwait Gasoline Demand Forecast to 2025

5.1.2 Kuwait Diesel Oil Demand Forecast to 2025

5.1.3 Kuwait Kerosene Demand Forecast to 2025

5.1.4 Kuwait LPG Demand Forecast to 2025

5.2 Kuwait Refined Products Production Forecast to 2025

5.2.1 Kuwait Gasoline Production Forecast to 2025

5.2.2 Kuwait Diesel Oil Production Forecast to 2025

5.2.3 Kuwait Kerosene Production Forecast to 2025

5.2.4 Kuwait LPG Production Forecast to 2025

6 Kuwait Refinery Capacities Forecast to 2025

6.1 Location, Operator, Ownership, Startup Details of Operational Refineries in Kuwait

6.2 Kuwait Total Refining Capacity Historic and Forecast, 2012-2025

6.3 Kuwait Refining Capacity Historic and Forecast, 2012-2025

6.4 Kuwait Refinery wise Secondary Conversion Unit-1 Capacity, 2012-2025

6.5 Kuwait Refinery wise Secondary Conversion Unit-2 Capacity, 2012-2025

6.6 Kuwait Refinery wise Secondary Conversion Unit-3 Capacity, 2012-2025

7 Kuwait Refining Industry- Future Developments and Investment Opportunities

7.1 Capital Investment Details of All Upcoming Refineries

7.2 Location, Operator, Ownership, Start Up Details of Planned Refineries in Kuwait

7.2.1 Refinery Location, Operator, Ownership, Startup Details

7.3 Refinery Capacities of All Upcoming Refineries

8 Key Strategies Kuwait Refining Companies

8.1 Kuwait Company wise Refining Capacity Forecast, 2012-2025

9 Kuwait National Petroleum Company Profile

9.1 Kuwait National Petroleum Company Key Information

9.2 Kuwait National Petroleum Company Overview

9.3 Kuwait National Petroleum Company Business Description

9.4 Kuwait National Petroleum Company SWOT Analysis

9.5 Kuwait National Petroleum Company Financial Ratios - Capital Market Ratios

9.6 Kuwait National Petroleum Company Financial Ratios - Annual Ratios

9.7 Kuwait National Petroleum Company Financial Ratios - Interim Ratios

10 Kuwait Refining Industry Latest Tenders and Contracts

11 Kuwait Refining Industry Updates

12 Kuwait Refining Industry Deals

For more information about this report visit https://www.researchandmarkets.com/r/5ze0a0

About ResearchAndMarkets.com

ResearchAndMarkets.com is the world's leading source for international market research reports and market data. We provide you with the latest data on international and regional markets, key industries, the top companies, new products and the latest trends.


Contacts

ResearchAndMarkets.com
Laura Wood, Senior Press Manager
This email address is being protected from spambots. You need JavaScript enabled to view it.
For E.S.T Office Hours Call 1-917-300-0470
For U.S./CAN Toll Free Call 1-800-526-8630
For GMT Office Hours Call +353-1-416-8900

Favourability of marine shipping in Canada remains high, four-in-five view industry positively


VANCOUVER, British Columbia--(BUSINESS WIRE)--The invisible strings that tie the globe together have been more evident this year as the COVID-19 pandemic has strained trading networks and challenged the transport of goods. Indeed, seven-in-ten Canadians say they’ve learned more about the supply chain this year as they have dealt with shortages of medicines, personal protective equipment, hand sanitizer, and even household goods like toilet paper.

A new study from the Angus Reid Institute, in partnership with the Clear Seas Centre for Responsible Marine Shipping, casts its focus into the future and finds Canadians looking for the industry to play a major role in the post-pandemic economic recovery, while also continuing to make strides in environmental protection. Two-in-five Canadians say the economic side of this equation is paramount, while one-quarter (23%) say environmental aspects are key. In the middle are the largest number – 37 per cent – who feel that balancing both is the best way to proceed.

The shipping industry heads into another year of likely challenges with positive ratings from most Canadians. Building on what now is a five-year trend, four-in-five residents say they have a favourable view of marine shipping. Further, more than half (54%) say that the industry’s importance has grown over the past 15–20 years in their estimation.

Survey results and full report available here: https://bit.ly/3mecdjJ

More Key Findings:

  • An overwhelming majority of Canadians (92%) continue to view marine shipping as either “very safe” (25%) or “generally safe” (67%)
  • However, confidence in shipping of petroleum products appears to be declining with 45 per cent of Canadians voicing concern – up six points from 2018
  • Younger Canadians lean more heavily toward prioritizing environmental protection than economic growth when it comes to marine shipping. Canadians 35 years of age and older prefer an economic focus
  • When asked to estimate the proportion of goods in their day-to-day lives that rely on marine shipping, half of Canadians underestimate the total
  • Most Canadians remain confident in the rules and regulations governing marine shipping safety in Canada today. Seven-in-ten agree with this, a number that has stayed relatively consistent since 2016

Shipping Confidence Index

In order to better understand the numerous viewpoints on marine shipping in Canada, researchers at the Angus Reid Institute created an index based on variables associated with overall perceptions of the industry, and its role in the economy, international trade, and environmental protection. The Shipping Confidence Index is comprised of three groups: Shipping Supporters, Maritime Moderates, and Cautious Critics. Read the full report to learn how viewpoints vary according to age and region.

For detailed results by age, gender, region, education, and other demographics, click here. For detailed results by specific age groups, click here.

Register for Briefing

Details about the study’s findings will be provided at a press briefing on November 30, 2020 at 10:00 AM (PST)-1:00 PM (EST). To attend the briefing register here: https://bit.ly/2IVjje8

About the Angus Reid Institute

The Angus Reid Institute (ARI) was founded in October 2014 by pollster and sociologist, Dr. Angus Reid. ARI is a national, not-for-profit, non-partisan public opinion research foundation established to advance education by commissioning, conducting and disseminating to the public accessible and impartial statistical data, research and policy analysis on economics, political science, philanthropy, public administration, domestic and international affairs and other socio-economic issues of importance to Canada and its world.

About Clear Seas

Clear Seas is a not-for-profit independent research centre that provides impartial information on marine shipping in Canada to policy makers and the public. Its mandate is to initiate and interpret research, analyze policies, identify best practices, share information and facilitate dialogue. The organization’s research agenda is defined internally in response to current issues, reviewed by a research advisory committee, and approved by a board of directors. All reports are available at clearseas.org


Contacts

Edward Downing
Director of Communications
Tel.: (604) 408-1648 ext. 106 or cell (604) 817-3058
This email address is being protected from spambots. You need JavaScript enabled to view it.

DUBLIN--(BUSINESS WIRE)--The "European Wind Turbine Market Outlook Update Q3 2020" report has been added to ResearchAndMarkets.com's offering.


Following the easing of restrictions on wind turbine supply chain across Europe in Q3 2020, the outlook for the wind sector will depend on the effectiveness of national and EU recovery plans.

The European wind industry is the global leader in the wind turbine market, realising projects in more than 80 countries worldwide. As such, its companies rely on both European and global supply chains for raw materials and components. However, the outbreak of COVID-19 posed a risk to investments made in wind energy segment in Europe facing higher risk of delay or even cancellation. In 2019 the wind energy industry invested USD 59.3 bn in Europe, USD 21 bn of which was for the financing of new wind energy projects which are likely to be affected due to the crisis. Additionally, the uncertainty over the evolution of the COVID-19 crisis will also likely increase the cost of finance as banks will be less willing to lend as they are concerned about liquidity and corporate finance. In contrary, many European countries like Germany, Netherlands, Lithuania and Greece have confirmed they will stick exactly to their 2020 auction schedules. Also, France and Germany are setting out the Recovery Plan, made climate policy commitments such as: support for a higher 2030 emissions reduction target which shall put the wind turbine segment in Europe on track to bring in efficiency in supply chain.

Key Topics Covered:

  • This Quarter
  • Key Features
  • Leading Edge
  • Numbers to Learn
  • The Eighty - 20 of Industry - What Matters?
  • Key Signposts
  • Deployment Trends
  • Technology
  • Price Trends
  • Industry Activities & Corporate Strategies

Companies Mentioned

  • General Electric
  • Vestas
  • Suzlon
  • Inox Wind
  • Wind World
  • Indowind Energy Limited
  • Siemens Gamesa
  • Envision Energy
  • Acciona Nordex
  • ReNew Power
  • Enercon
  • Orient Green Power Ltd.
  • Enel Green Power India Pvt Ltd
  • Senvion India Pvt Ltd
  • Continuum Wind Energy India Pvt Ltd
  • Hero Future Energies Pvt Ltd
  • Indian Wind Turbine Manufacturers Association

For more information about this report visit https://www.researchandmarkets.com/r/p3in0c

About ResearchAndMarkets.com

ResearchAndMarkets.com is the world's leading source for international market research reports and market data. We provide you with the latest data on international and regional markets, key industries, the top companies, new products and the latest trends.


Contacts

ResearchAndMarkets.com
Laura Wood, Senior Press Manager
This email address is being protected from spambots. You need JavaScript enabled to view it.
For E.S.T Office Hours Call 1-917-300-0470
For U.S./CAN Toll Free Call 1-800-526-8630
For GMT Office Hours Call +353-1-416-8900

Company Separately Announced Fiscal 2021 Guidance and Long-Term NFEPS and Dividend Growth Rate

WALL, N.J.--(BUSINESS WIRE)--Today, New Jersey Resources (NYSE: NJR) reported results for the fourth quarter and fiscal 2020. Highlights included:


  • Consolidated net income of $193.9 million for fiscal 2020, compared with $169.5 million in fiscal 2019
  • Consolidated net financial earnings (NFE), a non-GAAP financial measure, of $196.2 million for fiscal 2020, or $2.07 per share, compared with $175.0 million, or $1.96 per share, in fiscal 2019
  • Increased annual dividend by 6.4 percent to $1.33 per share
  • NJNG filed a proposal with the BPU to significantly expand its energy efficiency offerings
  • NJR Clean Energy Ventures (CEV) placed eight commercial solar installations into service and acquired one operating asset, adding 60 megawatts (MW) of total installed capacity in fiscal 2020

Fiscal 2020 net income totaled $193.9 million, or $2.05 per share, compared with $169.5 million, or $1.90 per share, in fiscal 2019. Fourth-quarter net income totaled $43.3 million, or $0.45 per share, compared with $18.1 million, or $0.20 per share, during the same period last year.

Fiscal 2020 NFE totaled $196.2 million, or $2.07 per share, in-line with the previously announced guidance range, compared with $175.0 million, or $1.96 per share, in fiscal 2019. Fourth-quarter NFE totaled $54.7 million, or $0.57 per share, compared with $26.0 million, or $0.29 per share, during the same period last year.

"Thanks to the performance of our talented and dedicated team through an unprecedented global pandemic, we were able to deliver solid results and achieve NFE in-line with our guidance range for fiscal 2020," said Steve Westhoven, President and CEO of New Jersey Resources. "As reflected in our results, we are committed to serving our customers with safe, reliable, clean energy and reaching our sustainability goals through our diversified portfolio of energy infrastructure investments. With the new financial growth targets that we announced in connection with our Analyst Day today, including raising long-term NFEPS and dividend growth rates, our outlook for the future is strong."

Key Performance Metrics


Three Months Ended


Twelve Months Ended


September 30,


September 30,

($ in Thousands)

2020


2019


2020


2019

Net income

$

43,272


$

18,086


$

193,919


$

169,505


Basic EPS

$

0.45


$

0.20


$

2.05


$

1.90


Net financial earnings

$

54,721


$

25,956


$

196,245


$

174,960


Basic net financial earnings per share

$

0.57


$

0.29


$

2.07


$

1.96


A reconciliation of net income to NFE for the three and twelve months ended September 30, 2020, and 2019, is provided below.


Three Months Ended


Twelve Months Ended


September 30,


September 30,

(Thousands)

2020


2019


2020


2019

Net income

$

43,272


$

18,086


$

193,919


$

169,505


Add:


Unrealized loss (gain) on derivative instruments and related transactions

12,183


28,234


(9,644)


2,881


Tax effect

(2,893)


(6,745)


2,296


(711)


Effects of economic hedging related to natural gas inventory

2,216


(7,764)


12,690


4,309


Tax effect

(527)


1,845


(3,016)


(1,024)


Net income to NFE tax adjustment

470


(7,700)


Net financial earnings

$

54,721


$

25,956


$

196,245


$

174,960


Weighted Average Shares Outstanding


Basic

95,933


89,983


94,798


89,242


Diluted

96,259


90,366


95,107


89,616


Basic earnings per share

$

0.45


$

0.20


$

2.05


$

1.90


Add:


Unrealized loss (gain) on derivative instruments and related transactions

0.13


0.31


(0.10)


0.03


Tax effect

(0.02)


(0.06)


0.02


(0.01)


Effects of economic hedging related to natural gas inventory

0.02


(0.09)


0.13


0.05


Tax effect

(0.01)


0.02


(0.03)


(0.01)


Net income to NFE tax adjustment


(0.09)


Basic net financial earnings per share

$

0.57


$

0.29


$

2.07


$

1.96


NFE is a financial measure not calculated in accordance with Generally Accepted Accounting Principles (GAAP) of the United States. It is a measure of earnings based on eliminating timing differences surrounding the recognition of certain gains or losses, net of applicable tax adjustments, to effectively match the earnings effects of the economic hedges with the physical sale of natural gas, Solar Renewable Energy Certificates (SRECs) and foreign currency contracts. NFE/net financial loss eliminates the impact of volatility to GAAP earnings associated with unrealized gains and losses on derivative instruments in the current period. For further discussion of this financial measure, please see the explanation below under “Non-GAAP Financial Information.”

GAAP requires us, during the interim periods, to estimate our annual effective tax rate and use this rate to calculate the year-to-date tax provision. We also determine an annual estimated effective tax rate for NFE purposes and calculate a quarterly tax adjustment based on the differences between our forecasted net income and our forecasted NFE for the fiscal year.

A table detailing net financial (loss) earnings for the three and twelve months ended September 30, 2020, and 2019, is provided below.

Net Financial (Loss) Earnings by Business Unit


Three Months Ended


Twelve Months Ended


September 30,


September 30,

(Thousands)

2020


2019


2020


2019

New Jersey Natural Gas

$

(15,258)


$

(18,402)


$

126,902


$

78,062


Clean Energy Ventures

55,840


52,676


53,023


77,473


Storage and Transportation

7,434


3,488


18,311


14,689


Energy Services

1,638


(10,726)


(7,873)


2,918


Home Services and Other

5,109


(1,021)


5,784


1,911


Subtotal

54,763


26,015


196,147


175,053


Eliminations

(42)


(59)


98


(93)


Total

$

54,721


$

25,956


$

196,245


$

174,960


COVID-19 Impact Update:

NJR has not made any significant changes to capital programs due to COVID-19. NJNG operations and delivery of natural gas to its approximately 558,000 customers has largely been unaffected by the ongoing pandemic. NJR will continue to closely monitor the potential impacts of the pandemic and will adjust its plan accordingly to ensure the delivery of essential services to customers, while maintaining the safety and health of its employees, customers and communities.

Analyst Day Information:

In a separate announcement, the Company today provided its fiscal 2021 guidance and long-term financial targets. NJR will host a virtual Analyst Day today at 8:30 a.m. ET and the senior leadership team will discuss the Company's strategic value proposition and long-term financial growth targets, as well as its year-end fiscal 2020 earnings results. The video webcast of the virtual Analyst Day, including a copy of the presentation, and a question and answer session, will be broadcast over the internet and can be accessed at https://investor.njresources.com/events-and-presentations/default.aspx. For those unable to listen to the webcast, an archived version will be available at the same location.

Regulated Business Update:

New Jersey Natural Gas (NJNG)

NJNG reported fiscal 2020 NFE of $126.9 million, compared to NFE of $78.1 million during fiscal 2019. Fourth-quarter net financial loss was $15.3 million, compared with net financial loss of $18.4 million during the same period in fiscal 2019. The increase in both periods was due primarily to increased base rates from NJNG's rate case settlement in November 2019 and lower operating and maintenance (O&M) expenses.

Customer Growth:

  • NJNG added 8,349 new customers during fiscal 2020, compared with 9,711 in fiscal 2019. The lower customer growth was due to the effects of the COVID-19 pandemic.

Infrastructure Update:

  • NJNG's Infrastructure Investment Program (IIP) is a five-year, $150 million program approved by the New Jersey Board of Public Utilities (BPU) on October 28, 2020. The IIP consists of a series of infrastructure projects designed to support the enhanced safety and reliability of NJNG's natural gas distribution system. The original filing included an information technology (IT) upgrade component, which NJNG voluntarily withdrew and will seek to recover associated costs in future rate case proceedings.
  • The Southern Reliability Link (SRL) will diversify supply to our customers by providing a new intrastate feed into the southern end of NJNG’s distribution system. SRL began construction in the first quarter of fiscal 2019 and is projected to be placed in service in 2021. The total cost of SRL is expected to be in the range of $250 million to $270 million. Construction continues on SRL with over 80 percent of the project complete.
    • NJNG has submitted its response to the New Jersey Department of Environmental Protection (DEP) regarding the suspension of permits for certain sections of SRL's construction. Following a comprehensive review process of our drilling plans for the remainder of the project, the DEP reinstated our permits, allowing us to fully proceed with our construction plans.

  • Safety Acceleration and Facilities Enhancement (SAFE) II is the five-year, $158 million program approved by the BPU in September 2016 to replace the remaining unprotected bare steel main and associated services in NJNG’s distribution system. In fiscal 2020, NJNG invested $56.5 million to replace 70 miles of unprotected bare steel main and services.
  • The New Jersey Reinvestment in System Enhancement (NJ RISE) program is a $102.5 million investment program comprised of six projects related to storm hardening and mitigation. During the fourth-quarter of fiscal 2020, construction began on a new regulator station, the final portion of the North Seaside Reinforcement project. Construction is expected to be completed by the end of calendar year 2020.
  • The SAFE II and NJ RISE programs are eligible for annual rate increases. On March 31, 2020, NJNG filed its annual petition with the BPU, requesting a rate increase of approximately $7.4 million for the recovery of the related capital costs through June 30, 2020. NJNG updated the filing in July 2020 to reflect the actual results through June 30, 2020, reducing the rate increase to $7.1 million. The BPU approved the filing and the new rates became effective on October 1, 2020.

BGSS Incentive Programs:

BGSS incentive programs contributed $9.5 million to utility gross margin in fiscal 2020, compared with $8.4 million during the same period in fiscal 2019. The higher results were due to improved margins in off-system sales and storage incentive programs, which were partially offset by a decrease in capacity release volume.

Energy-Efficiency Programs:

The SAVEGREEN Project®, NJNG’s energy-efficiency program, invested $30.8 million during fiscal 2020 to help customers with energy-efficiency upgrades for their homes and businesses. NJNG recovered $10.3 million of its SAVEGREEN investment in fiscal 2020.

  • On September 25, 2020, NJNG filed a petition with the BPU for an additional three-year SAVEGREEN program consisting of approximately $127 million of direct investment, $113 million in financing options, and $23 million in O&M expenses, effective July 1, 2021.

Storage and Transportation

Storage and Transportation, formerly known as the Midstream reporting segment, reported fiscal 2020 NFE of $18.3 million, compared with $14.7 million during fiscal 2019. Fourth-quarter NFE were $7.4 million, compared with $3.5 million during the same period in fiscal 2019. The increase in NFE for both periods was due to incremental operating income from Leaf River and Adelphia Gateway, partially offset by increased O&M and interest expense related to the acquisition and operations of those assets.

Infrastructure Updates:

  • Adelphia Gateway - On October 5, 2020, Adelphia Gateway received a Partial Notice to Proceed from the Federal Energy Regulatory Commission (FERC) to begin construction. The construction includes the conversion of 50 miles of the existing 84-mile pipeline from oil to natural gas to bring much-needed supply to constrained markets in the Philadelphia region.
  • PennEast - On January 30, 2020, PennEast filed with FERC an abbreviated application for amendment of its Certificate of Public Convenience and Necessity, requesting a phased-in approach to the PennEast project. The first phase of the project would include construction of the pipeline in Pennsylvania with interconnections within the state. Also, on January 30, 2020, FERC issued a declaratory order related to the ruling by the Third Circuit, supporting PennEast.
    • On February 18, 2020, PennEast filed a petition for writ of certiorari with the U.S. Supreme Court seeking to overturn the September 10, 2019 Third Circuit decision vacating the New Jersey Federal District Court's December 13, 2018 condemnation order blocking pipeline construction.

    • On June 29, 2020, the U.S. Supreme Court invited the U.S. Solicitor General to express his views regarding the issues presented in the petition for writ of certiorari.

    • On August 3, 2020, FERC issued a positive environmental assessment for Phase I of the project, finding no significant environmental impact.

Unregulated Businesses Update:

Clean Energy Ventures (CEV)

CEV reported fiscal 2020 NFE of $53.0 million, compared with NFE of $77.5 million in fiscal 2019. The decrease in NFE was due to fewer Investment Tax Credits (ITCs) recognized on projects placed in service and the absence of contributions from the wind portfolio, which was sold during fiscal 2019. Fourth-quarter NFE were $55.8 million, compared with NFE of $52.7 million during the same period in fiscal 2019. The increase in NFE was due to higher SREC sales.

Solar Investment Update:

  • In fiscal 2020, CEV placed eight commercial solar projects into service and acquired one operational asset, adding 60 MWs, increasing CEV's total installed capacity to over 350 MW.
  • The Sunlight Advantage®, CEV's residential solar leasing program, added 481 customers in fiscal 2020 and now serves over 8,600 residential and small-midsize commercial customers in New Jersey.

Energy Services

Energy Services reported fiscal 2020 net financial loss of $(7.9) million, compared to NFE of $2.9 million for the same period last fiscal year. The decrease in NFE for fiscal 2020 was due primarily to challenging market conditions created by unusually warm weather on the U.S. east coast last winter compounded by operational issues on a key interstate pipeline. Fourth-quarter NFE was $1.6 million, compared with a net financial loss of $(10.7) million during the same period last year. The increase in NFE for the fourth quarter was due to lower demand charges and increased natural gas pricing volatility leading to more market opportunities compared to the same period last year.

Home Services and Other Operations

Home Services and Other Operations reported fiscal 2020 NFE of $5.8 million compared to NFE of $1.9 million for the same period in fiscal 2019. Fourth-quarter NFE were $5.1 million, compared with net financial loss of $1.0 million during the same period in fiscal 2019. The increase in both periods was due to lower O&M expenses and an income tax benefit associated with the revaluation of certain deferred state tax liabilities.

Effective Tax Rate:

NJR’s annual effective tax rate increased to (3.7) percent in fiscal 2020 from (28.7) percent in fiscal 2019. In the fourth quarter of fiscal 2020, NJR recognized $37.1 million related to tax credits, net of deferred taxes, compared with $56.8 million during the same period last year.

Capital Expenditures and Cash Flows:

NJR is committed to maintaining a strong financial profile, while continuing to invest capital in regulated and unregulated energy projects.

  • During fiscal 2020, capital expenditures were $499.1 million, of which $333.9 million were related to NJNG, compared with capital expenditures of $531.4 million, of which $372.1 million were related to NJNG, during the same period of fiscal 2019.
  • During fiscal 2020, cash flows from operations were $213.5 million, compared with $194.1 million during the same period of fiscal 2019. The increase was primarily due to increased margin at NJNG from increased base rates.

Forward-Looking Statements:

This earnings release contains forward-looking statements within the meaning of Section 27A of the Securities Act of 1933, as amended, Section 21E of the Securities Exchange Act of 1934, as amended, and the Private Securities Litigation Reform Act of 1995. New Jersey Resources Corporation (NJR) cautions readers that the assumptions forming the basis for forward-looking statements include many factors that are beyond NJR’s ability to control or estimate precisely, such as estimates of future market conditions and the behavior of other market participants. Words such as “anticipates,” “estimates,” “expects,” “projects,” “may,” “will,” “intends,” “plans,” “believes,” “should” and similar expressions may identify forward-looking statements and such forward-looking statements are made based upon management’s current expectations, assumptions and beliefs as of this date concerning future developments and their potential effect upon NJR. There can be no assurance that future developments will be in accordance with management’s expectations, assumptions and beliefs or that the effect of future developments on NJR will be those anticipated by management. Forward-looking statements in this earnings release include, but are not limited to, certain statements regarding NJR’s NFE guidance for fiscal 2021 through fiscal 2024, as well as NJR’s long-term NFEPS growth rate, dividend growth, forecasted contribution of business segments to NJR’s NFE from fiscal 2021 through fiscal 2024, customer growth at NJNG, future NJR and NJNG capital expenditures, infrastructure programs and investments such as SRL, NJ RISE II and SAFE II, CEV’s future capital investment target, NJR's environmental sustainability and clean energy goals, emissions reduction strategies, initiatives and targets and our investments in infrastructure, renewables and emerging technologies, the ability to construct and operate the Adelphia Gateway Pipeline project, and construct SRL and the PennEast pipeline project, as well as the ongoing COVID-19 pandemic and its impact on NJR's liquidity, business operations, financial condition, results of operations or cash flows.

Additional information and factors that could cause actual results to differ materially from NJR’s expectations are contained in NJR’s filings with the U.S. Securities and Exchange Commission (SEC), including NJR’s Annual Reports on Form 10-K and subsequent Quarterly Reports on Form 10-Q, recent Current Reports on Form 8-K, and other SEC filings, which are available at the SEC’s web site, http://www.sec.gov. Information included in this earnings release is representative as of today only and while NJR periodically reassesses material trends and uncertainties affecting NJR's results of operations and financial condition in connection with its preparation of management's discussion and analysis of results of operations and financial condition contained in its Quarterly and Annual Reports filed with the SEC, NJR does not, by including this statement, assume any obligation to review or revise any particular forward-looking statement referenced herein in light of future events.

Non-GAAP Financial Information:

This earnings release includes the non-GAAP financial measures NFE/net financial loss, NFE per basic share, financial margin and utility gross margin. A reconciliation of these non-GAAP financial measures to the most directly comparable financial measures calculated and reported in accordance with GAAP can be found below. As an indicator of NJR’s operating performance, these measures should not be considered an alternative to, or more meaningful than, net income or operating revenues as determined in accordance with GAAP. This information has been provided pursuant to the requirements of SEC Regulation G.

NFE/net financial loss and financial margin exclude unrealized gains or losses on derivative instruments related to the company’s unregulated subsidiaries and certain realized gains and losses on derivative instruments related to natural gas that has been placed into storage at Energy Services, net of applicable tax adjustments as described below. Volatility associated with the change in value of these financial instruments and physical commodity reported on the income statement in the current period. In order to manage its business, NJR views its results without the impacts of the unrealized gains and losses, and certain realized gains and losses, caused by changes in value of these financial instruments and physical commodity contracts prior to the completion of the planned transaction because it shows changes in value currently instead of when the planned transaction ultimately is settled. An annual estimated effective tax rate is calculated for NFE purposes and any necessary quarterly tax adjustment is applied to CEV, as such the adjustment is related to tax credits generated by CEV.

NJNG’s utility gross margin represents the results of revenues less natural gas costs, sales, expenses and other taxes and regulatory rider expenses, which are key components of NJR’s operations. Natural gas costs, sales, expenses and other taxes and regulatory rider expenses are passed through to customers and, therefore, have no effect on utility gross margin. Management uses these non-GAAP financial measures as supplemental measures to other GAAP results to provide a more complete understanding of NJR’s performance. Management believes these non-GAAP financial measures are more reflective of NJR’s business model, provide transparency to investors and enable period-to-period comparability of financial performance. A reconciliation of all non-GAAP financial measures to the most directly comparable financial measures calculated and reported in accordance with GAAP can be found below. For a full discussion of NJR’s non-GAAP financial measures, please see NJR’s 2020 Form 10-K, Item 7.

About New Jersey Resources

New Jersey Resources (NYSE: NJR) is a Fortune 1000 company that, through its subsidiaries, provides safe and reliable natural gas and clean energy services, including transportation, distribution, asset management and home services. NJR is composed of five primary businesses:

  • New Jersey Natural Gas, NJR’s principal subsidiary, operates and maintains over 7,500 miles of natural gas transportation and distribution infrastructure to serve over half a million customers in New Jersey’s Monmouth, Ocean, Morris, Middlesex and Burlington counties.
  • Clean Energy Ventures invests in, owns and operates solar projects with a total capacity of over 350 megawatts, providing residential and commercial customers with low-carbon solutions.
  • Energy Services manages a diversified portfolio of natural gas transportation and storage assets and provides physical natural gas services and customized energy solutions to its customers across North America.
  • Storage and Transportation serves customers from local distributors and producers to electric generators and wholesale marketers through its ownership of Leaf River and the Adelphia Gateway Pipeline Project, as well as our 50 percent equity ownership in the Steckman Ridge natural gas storage facility, and our 20 percent equity interest in the PennEast Pipeline Project.
  • Home Services provides service contracts as well as heating, central air conditioning, water heaters, standby generators, solar and other indoor and outdoor comfort products to residential homes throughout New Jersey.

Contacts

Media:
Michael Kinney
732-938-1031
This email address is being protected from spambots. You need JavaScript enabled to view it.

Investor:
Dennis Puma
732-938-1229
This email address is being protected from spambots. You need JavaScript enabled to view it.


Read full story here

DUBLIN--(BUSINESS WIRE)--The "World Oil Refining Industry 2020 - Oil Refining Market Trends, Challenges and Outlook to 2025" report has been added to ResearchAndMarkets.com's offering.


This downstream energy sector report is a complete source of information on the world crude oil refining industry. It provides Country, Refinery level information relating to existing and planned (new build) refineries such as insights and forecasts of refinery capacities. The report also covers complete details of major players operating in the refining sector in the World and provides in-depth analysis of the latest industry news and deals.

Report Scope

  • Outlook of Global Oil Refining Industry and refined petroleum products beyond 2019
  • Forecasts of refined products production and consumption along with major refining companies and operators.
  • Historic and Forecasted Refining capacity and secondary conversion units and capacities beyond 2019
  • Key Opportunities and Restraints in the Global Refinery market
  • Benchmark with regions on Nelson Complexity Factor.
  • Market structure of Region Refining Industry, companies, capacities and market share.
  • Information on all planned refineries such as planned capacity, equity structure, Operator Company, expected commissioning date and project cost.
  • Refined petroleum products production and demand beyond 2019.
  • Refinery level information such as refinery name, commissioned year, primary and secondary units installed capacities along with future capacity expansions, refinery complexity factor, ownership and operator details.
  • Company profiles of major refining companies including SWOT Analysis.
  • Latest mergers, acquisitions, contract announcements and all related industry news and deals analysis.


Key Topics Covered:

1. Table of Contents

2. Global Refining Markets Overview

3. Global Refining Industry

4. Global Refining Market- Drivers and Restraints

5. Global Oil Products Demand and Supply Forecast to 2025

6. Global Refinery Processing Capacities Forecast to 2025

7. Global Refining Industry- Future Developments and Investment Opportunities

8. Key Strategies Global Refining Companies

9. Global Refining Industry, Regional Comparisons

10. Refining Industry in Asia-Pacific

11. Refining Industry in Europe

12. Refining Industry in the Middle East and Africa

13. Refining Industry in North America

14. Refining Industry in South and Central America

15. Company Profiles

16. Global Refining Industry Updates

17. Global Industry Major Deals

18. Appendix

Companies Mentioned

  • ExxonMobil
  • Total SA
  • BP Plc
  • Rosneft
  • PTTEP

For more information about this report visit https://www.researchandmarkets.com/r/wi256u

About ResearchAndMarkets.com

ResearchAndMarkets.com is the world's leading source for international market research reports and market data. We provide you with the latest data on international and regional markets, key industries, the top companies, new products and the latest trends.


Contacts

ResearchAndMarkets.com
Laura Wood, Senior Press Manager
This email address is being protected from spambots. You need JavaScript enabled to view it.

For E.S.T Office Hours Call 1-917-300-0470
For U.S./CAN Toll Free Call 1-800-526-8630
For GMT Office Hours Call +353-1-416-8900

Outlines Valuable Infrastructure Investments Across Complementary Businesses Driving NJR’s Leadership in Clean Energy Future

Presents Financial Growth Targets, Including Higher Long-Term NFE Growth Rate from FY 2022, and Increased Dividend Growth Rate

Company Management to Discuss Further Details During Investor Webcast Today at 8:30 AM ET

WALL, N.J.--(BUSINESS WIRE)--New Jersey Resources (NYSE: NJR) (the “company” or “NJR”) today will host a virtual 2020 Analyst Day to provide an update on the Company’s strategic plan and financial growth targets, including:


  • 6-10% long-term annual growth in consolidated net financial earnings per share (NFEPS), a non-GAAP financial measure, beginning in fiscal 2022;
  • 6-10% long-term annual dividend growth;
  • Approximately 20% growth in annual Cash Flows from Operations (CFFO) from fiscal 2020 to fiscal 2024; and
  • Approximately 11% rate base Compounded Annual Growth Rate (CAGR) between fiscal 2019 and fiscal 2024 at New Jersey Natural Gas, the company’s regulated utility and largest business segment.

With our talented and capable team, disciplined execution and strong position in the clean energy transition, we are poised to drive long-term value for our shareowners,” said Steve Westhoven, President and CEO of New Jersey Resources. “As we move ahead, we will focus on growth at our regulated utility, NJNG, and Clean Energy Ventures, CEV. NJNG is as strong as it has ever been, with an approximately 11% rate base CAGR expected between fiscal 2019 and fiscal 2024. CEV will continue to drive growth as we expand and invest beyond New Jersey, action supported by an approximate doubling of our rate of investment in solar initiatives in four years. At the same time, we are taking a number of strategic steps to deliver more predictable and stable net financial earnings across our other complementary businesses. We remain committed to growing our dividend and, following a reset of NFE in fiscal 2021, are projecting an increase in our long-term NFEPS growth rate.”

Complementary Businesses Across NJR Platform

  • NJNG: Driving an approximately 11% rate base CAGR through strategic infrastructure investments and accelerated infrastructure recovery. NFE contributions from NJNG are expected to be in the 60-70% range on an ongoing basis.
  • CEV: Investing $850 million over four years to take advantage of the robust solar market. CEV will benefit from NJR’s expertise in public policy and its commitment to further climate goals in New Jersey. To better position CEV for accelerated growth, NJR is pursuing regional market opportunities in the Northeastern U.S., one of the fastest growing solar markets in the country, due to public policy mandates and aggressive clean energy targets.
  • Storage and Transportation (formerly known as Midstream): Generating stable, fee-based revenue through a portfolio of low-risk infrastructure investments and from long-term capacity commitments with high-quality customers. Storage and Transportation serves constrained or growing end-use markets and offers organic growth opportunities through optimization and expansion. While NJR remains committed to PennEast, any financial contributions from the project are not included in the Company’s long-term NFEPS targets.
  • Energy Services: Focusing on higher fee-based revenue and benefiting from strong customer relationships and a deep understanding of wholesale energy markets rooted in its natural gas supply management expertise. In years of strong performance, Energy Services has contributed excess cash flows as growth capital for NJR, strengthening the balance sheet and lessening the need for debt and equity issuances. There will be minimal reliance on Energy Services to achieve the Company’s NFEPS targets.

Fiscal 2021 NFE Guidance

Included in NJR’s release today is the Company’s NFE guidance for fiscal 2021. Beginning in fiscal 2021, NJR is adopting a change in the accounting policy for investment tax credits and the expected use of tax equity financing for its solar projects. Principally as a result of the accounting policy change, the Company anticipates fiscal 2021 NFE to be in the range of $1.55 to $1.65 per share. There will be no impact to CEV’s cash flows as a result of this accounting change.

Patrick Migliaccio, Senior Vice President and CFO, said, “Consistent with our strategic plan to generate sustainable growth across our businesses, going forward we will change the way NJR accounts for investment tax credits and we expect to implement tax equity financing for our solar projects. While this results in a short-term decline in net financial earnings in fiscal 2021, these changes provide the foundation for increasing our investment in solar and are expected to result in stable net financial earnings from our CEV business. Following the earnings reset in fiscal 2021, we expect approximately 30% year-over-year growth in NFE in fiscal 2022, with a 6-10% long-term growth rate thereafter. With ample liquidity to support our businesses, no meaningful refinancings in the near term and a strong capital structure, NJR is extremely well-positioned for the future.”

The following chart represents NJR’s current expected contributions from its subsidiaries for fiscal 2021:

Company

Expected Fiscal 2021
Net Financial Earnings
Contribution

New Jersey Natural Gas

65 to 72 percent

Clean Energy Ventures

15 to 20 percent

Storage and Transportation (formerly Midstream)

8 to 10 percent

Energy Services

3 to 4 percent

Home Services and Other

0 to 2 percent

In providing fiscal 2021 NFE guidance, management is aware there could be differences between reported GAAP earnings and NFE due to matters such as, but not limited to, the positions of our energy-related derivatives. Management is not able to reasonably estimate the aggregate impact or significance of these items on reported earnings and, therefore, is not able to provide a reconciliation to the corresponding GAAP equivalent for its operating earnings guidance without unreasonable efforts. For further discussion of NFE, please see the explanation below under “Non-GAAP Financial Information.”

Webcast Information

The video webcast of the virtual 2020 Analyst Day, including a copy of the presentation, and a question and answer session, will be broadcast via the internet today at 8:30 a.m. Eastern time and can be accessed at https://investor.njresources.com/events-and-presentations/default.aspx. For those unable to listen to the webcast, an archived version will be available at the same location.

Forward-Looking Statements

This release contains forward-looking statements within the meaning of Section 27A of the Securities Act of 1933, as amended, Section 21E of the Securities Exchange Act of 1934, as amended, and the Private Securities Litigation Reform Act of 1995. New Jersey Resources Corporation (NJR, or the Company) cautions readers that the assumptions forming the basis for forward-looking statements include many factors that are beyond NJR’s ability to control or estimate precisely, such as estimates of future market conditions and the behavior of other market participants. Words such as “anticipates,” “estimates,” “expects,” “projects,” “may,” “will,” “intends,” “plans,” “believes,” “should” and similar expressions may identify forward-looking statements and such forward-looking statements are made based upon management’s current expectations, assumptions and beliefs as of this date concerning future developments and their potential effect upon NJR. There can be no assurance that future developments will be in accordance with management’s expectations, assumptions and beliefs or that the effect of future developments on NJR will be those anticipated by management. Forward-looking statements in this release include, but are not limited to, certain statements regarding NJR’s net financial earnings (NFE) guidance for fiscal 2021 through fiscal 2024, as well as NJR’s long-term NFE growth rate, dividend growth, forecasted contribution of business segments to NJR’s NFE from fiscal 2021 through fiscal 2024, NJNG’s rate base compound annual growth rate (CAGR), NJR Clean Energy Ventures’ future capital investment target, the ability to pursue tax equity financing through sale leasebacks of our solar projects, and the impact of a change in accounting policy for investment tax credits (ITCs).

Additional information and factors that could cause actual results to differ materially from NJR’s expectations are contained in NJR’s filings with the U.S. Securities and Exchange Commission (SEC), including NJR’s Annual Reports on Form 10-K and subsequent Quarterly Reports on Form 10-Q, recent Current Reports on Form 8-K, and other SEC filings, which are available at the SEC’s web site, https://www.sec.gov. Information included in this release is representative as of today only and while NJR periodically reassesses material trends and uncertainties affecting NJR's results of operations and financial condition in connection with its preparation of management's discussion and analysis of results of operations and financial condition contained in its Quarterly and Annual Reports filed with the SEC, NJR does not, by including this statement, assume any obligation to review or revise any particular forward-looking statement referenced herein in light of future events.

Non-GAAP Financial Information

This release includes the non-GAAP financial measures NFE and NFE per basic share. A reconciliation of these non-GAAP financial measures to the most directly comparable financial measures calculated and reported in accordance with GAAP can be found in NJR’s 2020 Form 10-K, Item 7. As an indicator of NJR’s operating performance, these measures should not be considered an alternative to, or more meaningful than, net income or operating revenues as determined in accordance with GAAP. This information has been provided pursuant to the requirements of SEC Regulation G.

NFE/net financial loss excludes unrealized gains or losses on derivative instruments related to the company’s unregulated subsidiaries and certain realized gains and losses on derivative instruments related to natural gas that has been placed into storage at Energy Services, net of applicable tax adjustments as described below. Volatility associated with the change in value of these financial instruments and physical commodity reported on the income statement in the current period. In order to manage its business, NJR views its results without the impacts of the unrealized gains and losses, and certain realized gains and losses, caused by changes in value of these financial instruments and physical commodity contracts prior to the completion of the planned transaction because it shows changes in value currently instead of when the planned transaction ultimately is settled. An annual estimated effective tax rate is calculated for NFE purposes and any necessary quarterly tax adjustment is applied to CEV, as such the adjustment is related to tax credits generated by CEV.

Management uses these non-GAAP financial measures as supplemental measures to other GAAP results to provide a more complete understanding of NJR’s performance. Management believes these non-GAAP financial measures are more reflective of NJR’s business model, provide transparency to investors and enable period-to-period comparability of financial performance.

About New Jersey Resources

New Jersey Resources (NYSE: NJR) is a Fortune 1000 company that, through its subsidiaries, provides safe and reliable natural gas and clean energy services, including transportation, distribution, asset management and home services. NJR is composed of five primary businesses:

  • New Jersey Natural Gas, NJR’s principal subsidiary, operates and maintains over 7,500 miles of natural gas transportation and distribution infrastructure to serve over half a million customers in New Jersey’s Monmouth, Ocean, Morris, Middlesex and Burlington counties.
  • Clean Energy Ventures invests in, owns and operates solar projects with a total capacity of more than 350 megawatts, providing residential and commercial customers with low-carbon solutions.
  • Energy Services manages a diversified portfolio of natural gas transportation and storage assets and provides physical natural gas services and customized energy solutions to its customers across North America.
  • Storage and Transportation serves customers from local distributors and producers to electric generators and wholesale marketers through its ownership of Leaf River Energy Center and the Adelphia Gateway Pipeline Project, as well as our 50 percent equity ownership in the Steckman Ridge natural gas storage facility, and our 20 percent equity interest in the PennEast Pipeline Project.
  • Home Services provides service contracts as well as heating, central air conditioning, water heaters, standby generators, solar and other indoor and outdoor comfort products to residential homes throughout New Jersey.

NJR and its more than 1,100 employees are committed to helping customers save energy and money by promoting conservation and encouraging efficiency through Conserve to Preserve® and initiatives such as The SAVEGREEN Project® and The Sunlight Advantage®. For more information about NJR: www.njresources.com.

Follow us on Twitter @NJNaturalGas.
“Like” us on facebook.com/NewJerseyNaturalGas.
Download our free NJR investor relations app for iPad, iPhone and Android.


Contacts

Media:
Michael Kinney
732-938-1031
This email address is being protected from spambots. You need JavaScript enabled to view it.

Investor:
Dennis Puma
732-938-1229
This email address is being protected from spambots. You need JavaScript enabled to view it.

HOUSTON--(BUSINESS WIRE)--Enterprise Products Partners L.P. (NYSE: EPD) announced today that it will participate in a Fireside Chat and host virtual investor meetings at the Citi Basic Materials Virtual Conference Tuesday, December 1, 2020. The Fireside Chat is scheduled for 1:00 p.m. ET. A live webcast of the Fireside Chat will be available and may be accessed via Enterprise’s website at www.enterpriseproducts.com.


A copy of the slides to be used in the meetings will be available at 7:00 a.m. ET on Tuesday, December 1 and may be accessed under the Investors tab on the partnership’s website.

Enterprise Products Partners L.P. is one of the largest publicly traded partnerships and a leading North American provider of midstream energy services to producers and consumers of natural gas, NGLs, crude oil, refined products and petrochemicals. Our services include: natural gas gathering, treating, processing, transportation and storage; NGL transportation, fractionation, storage and export and import terminals; crude oil gathering, transportation, storage and export and import terminals; petrochemical and refined products transportation, storage, export and import terminals and related services; and a marine transportation business that operates primarily on the United States inland and Intracoastal Waterway systems. The partnership’s assets include approximately 50,000 miles of pipelines; 260 million barrels of storage capacity for NGLs, crude oil, refined products and petrochemicals; and 14 billion cubic feet of natural gas storage capacity.


Contacts

Randy Burkhalter, Investor Relations, (713) 381-6812 or (866) 230-0745
Rick Rainey, Media Relations, (713) 381-3635

Offshore Source Logo

Offshore Source keeps you updated with relevant information concerning the Offshore Energy Sector.

Any views or opinions represented on this website belong solely to the author and do not represent those of the people, institutions or organizations that Offshore Source or collaborators may or may not have been associated with in a professional or personal capacity, unless explicitly stated.

Corporate Offices

Technology Systems Corporation
8502 SW Kansas Ave
Stuart, FL 34997

info@tscpublishing.com