Business Wire News

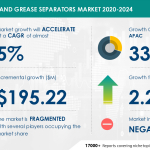
LONDON--(BUSINESS WIRE)--#FatOilandGreaseSeparatorsMarket--The fat, oil, and grease separators market is expected to grow by USD 195.22 million, progressing at a CAGR of almost 5% during the forecast period.


For a More Detailed Analysis, Get a Free Sample Report Delivered in a Minute

Growing applications of fat, oil, and grease separators across various industries is one of the major factors propelling the market growth. However, the high cost of purchase and maintenance will hamper growth.

More details: https://www.technavio.com/talk-to-us?report=IRTNTR44508

Fat, Oil, And Grease Separators Market: Type Landscape

Based on the type, the manual separators segment generated maximum revenue in 2019. Manual systems are available in a variety of sizes, ranging from 35 liters to few thousand liters. They are manufactured using concrete, stainless steel, enhanced polymers, and glass fiber plastics. These systems find increased use compared to automatic systems, owing to their low initial investment costs. All these factors are significantly contributing to the growth of the segment. The market growth in this segment will be significant during the forecast period.

Fat, Oil, And Grease Separators Market: Geographic Landscape

By geography, APAC is going to have a lucrative growth during the forecast period. About 33% of the market’s overall growth is expected to originate from APAC. Increasing incidences of sewer system blockage and the presence of stringent regulations are driving the demand for fat, oil, and grease separators in countries such as Japan and Australia. This is one of the key factors driving the growth of the fat, oil, and grease separators market in APAC.

China and Japan are the key markets for fat, oil, and grease separators in APAC. Market growth in this region will be faster than the growth of the market in other regions.

Give Your Business a Head Start for 2021: Download Our Free Sample Report

Related Reports on Energy Include:

Global Oil and Gas Separators Market - Global oil and gas separators market is segmented by type (horizontal, vertical, and spherical), application (onshore and offshore), and geography (MEA, North America, APAC, Europe, and South America). Click Here to Get an Exclusive Free Sample Report

Global High-Pressure Oil and Gas Separator Market - Global high-pressure oil and gas separator market is segmented by vessel type (horizontal, vertical, and spherical), application (onshore and offshore), and geography (APAC, Europe, MEA, North America, and South America). Click Here to Get an Exclusive Free Sample Report

Companies Covered:

  • ACO Severin Ahlmann GmbH & Co. KG
  • ALAR Engineering Corp.
  • Aqua Cure Ltd.
  • Cleveland Biotech Ltd.
  • Daiki Axis Co. Ltd.
  • GAEAU Group
  • Goslyn Environmental Systems
  • KESSEL AG
  • Roto Group LLC
  • Thermaco Inc.

What our reports offer:

  • Market share assessments for the regional and country-level segments
  • Strategic recommendations for the new entrants
  • Covers market data for 2019, 2020, until 2024
  • Market trends (drivers, opportunities, threats, challenges, investment opportunities, and recommendations)
  • Strategic recommendations in key business segments based on the market estimations
  • Competitive landscaping mapping the key common trends
  • Company profiling with detailed strategies, financials, and recent developments
  • Supply chain trends mapping the latest technological advancements

Technavio suggests three forecast scenarios (optimistic, probable, and pessimistic) considering the impact of COVID-19. Technavio’s in-depth research has direct and indirect COVID-19 impacted market research reports.

Subscribe to World-Class Market Intelligence and gain instant access to 17,000+ market research reports and connect with expert analysts

Key Topics Covered:

Executive Summary

Market Landscape

  • Market ecosystem
  • Value chain analysis

Market Sizing

  • Market definition
  • Market segment analysis
  • Market size 2019
  • Market outlook: Forecast for 2019 - 2024

Five Forces Analysis

  • Five forces summary
  • Bargaining power of buyers
  • Bargaining power of suppliers
  • Threat of new entrants
  • Threat of substitutes
  • Threat of rivalry
  • Market condition

Market Segmentation by Type

  • Market segments
  • Comparison by Type
  • Manual - Market size and forecast 2019-2024
  • Semi-automatic - Market size and forecast 2019-2024
  • Automatic - Market size and forecast 2019-2024
  • Market opportunity by Type

Customer Landscape

Geographic Landscape

  • Geographic segmentation
  • Geographic comparison
  • Europe - Market size and forecast 2019-2024
  • North America - Market size and forecast 2019-2024
  • APAC - Market size and forecast 2019-2024
  • South America - Market size and forecast 2019-2024
  • MEA - Market size and forecast 2019-2024
  • Key leading countries
  • Market opportunity by geography
  • Market drivers
  • Market challenges
  • Market trends

Vendor Landscape

  • Vendor landscape
  • Landscape disruption
  • Competitive Scenario

Vendor Analysis

  • Vendors covered
  • Market positioning of vendors
  • ACO Severin Ahlmann GmbH & Co. KG
  • ALAR Engineering Corp.
  • Aqua Cure Ltd.
  • Cleveland Biotech Ltd.
  • Daiki Axis Co. Ltd.
  • GAEAU Group
  • Goslyn Environmental Systems
  • KESSEL AG
  • Roto Group LLC
  • Thermaco Inc.

Appendix

  • Scope of the report
  • Currency conversion rates for US$
  • Research methodology
  • List of abbreviations

About Us

Technavio is a leading global technology research and advisory company. Their research and analysis focuses on emerging market trends and provides actionable insights to help businesses identify market opportunities and develop effective strategies to optimize their market positions. With over 500 specialized analysts, Technavio’s report library consists of more than 17,000 reports and counting, covering 800 technologies, spanning across 50 countries. Their client base consists of enterprises of all sizes, including more than 100 Fortune 500 companies. This growing client base relies on Technavio’s comprehensive coverage, extensive research, and actionable market insights to identify opportunities in existing and potential markets and assess their competitive positions within changing market scenarios.


Contacts

Technavio Research
Jesse Maida
Media & Marketing Executive
US: +1 844 364 1100
UK: +44 203 893 3200
Email: This email address is being protected from spambots. You need JavaScript enabled to view it.
Website: www.technavio.com/

For Notes to be Issued by Chevron U.S.A. Inc. and Guaranteed by Chevron Corporation

SAN RAMON, Calif.--(BUSINESS WIRE)--Chevron Corporation (“Chevron”) (NYSE:CVX) and Chevron U.S.A. Inc. (“CUSA”) today announced the commencement of offers to exchange (the “exchange offers”) any and all validly tendered (and not validly withdrawn) and accepted notes of the ten series of notes described in the table below (collectively, the “Old Notes”) issued by Noble Energy, Inc. (“Noble Energy”) for notes to be issued by CUSA and fully and unconditionally guaranteed by Chevron as described in the table below (collectively, the “CUSA Notes”). A registration statement on Form S-4 relating to the issuance of the CUSA Notes was filed with the Securities and Exchange Commission (“SEC”) on December 3, 2020 (the “Registration Statement”) but has not yet been declared effective. Copies of the Prospectus and the Letter of Transmittal (each as defined below) are available to holders through the exchange agent and information agent, D.F. King & Co., Inc., by calling (212) 269-5550 (toll-free) or emailing This email address is being protected from spambots. You need JavaScript enabled to view it.. More information is available online here.


Aggregate Principal Amount (mm)

Title of Series of Old Notes

Issuer

CUSIP No.

Title of Series of Notes to be Issued by CUSA and Guaranteed by Chevron

Exchange Consideration (1)

Early Participation Premium (1)

Total

Consideration (1)(2)

$100


7.250% Notes due 2023


Noble Energy, Inc.(3)


654894AE4


7.250% Notes due 2023


$970


$30


$1,000

$650


3.900% Notes due 2024


Noble Energy, Inc.


655044AH8


3.900% Notes due 2024


$970


$30


$1,000

$250


8.000% Senior Notes due 2027


Noble Energy, Inc.(3)


654894AF1


8.000% Notes due 2027


$970


$30


$1,000

$600


3.850% Notes due 2028


Noble Energy, Inc.


655044AP0


3.850% Notes due 2028


$970


$30


$1,000

$500


3.250% Notes due 2029


Noble Energy, Inc.


655044AQ8


3.250% Notes due 2029


$970


$30


$1,000

$850


6.000% Notes due 2041


Noble Energy, Inc.


655044AE5


6.000% Notes due 2041


$970


$30


$1,000

$1,000


5.250% Notes due 2043


Noble Energy, Inc.


655044AG0


5.250% Notes due 2043


$970


$30


$1,000

$850


5.050% Notes due 2044


Noble Energy, Inc.


655044AJ4


5.050% Notes due 2044


$970


$30


$1,000

$500


4.950% Notes due 2047


Noble Energy, Inc.


655044AN5


4.950% Notes due 2047


$970


$30


$1,000

$500


4.200% Notes due 2049


Noble Energy, Inc.


655044AR6


4.200% Notes due 2049


$970


$30


$1,000

(1)

Consideration in the form of principal amount of CUSA Notes (referring to the series of CUSA Notes corresponding to the series of Old Notes of like tenor and coupon) per $1,000 principal amount of Old Notes validly tendered and accepted for exchange, subject to any rounding as described herein.

(2)

Includes the Early Participation Premium (as defined below) for Old Notes validly tendered prior to the Early Participation Date described below and not validly withdrawn.

(3)

Formerly known as Noble Affiliates, Inc.

In connection with the exchange offers, Chevron and CUSA are also soliciting consents (the “consent solicitations”) from holders of the Old Notes (on behalf of Noble Energy) to certain proposed amendments to the corresponding indentures pursuant to which such Old Notes were issued (the “Noble Indentures”) which will modify or eliminate certain reporting requirements, restrictive covenants and Events of Default in the Noble Indentures and align such provisions with the terms of all the existing senior notes previously issued by CUSA and guaranteed by Chevron. If the proposed amendments become effective with respect to any series of Old Notes, the amendments will apply to all Old Notes of such series not tendered in the applicable exchange offer.

The exchange offers and consent solicitations commenced on December 3, 2020 and expire at 9:00 a.m., New York City time, on January 4, 2021, unless extended or earlier terminated (the “Expiration Date”). In exchange for each $1,000 principal amount of Old Notes that is validly tendered prior to 5:00 p.m., New York City time, on December 16, 2020, unless extended (such date and time, as it may be extended, the “Early Participation Date”), and not validly withdrawn, holders of such Old Notes will be eligible to receive the total consideration set out in the table above (the “Total Consideration”), which consists of $1,000 principal amount of the corresponding CUSA Notes. The Total Consideration includes an early participation premium set out in the table above (the “Early Participation Premium”), which consists of $30 principal amount of the corresponding series of CUSA Notes per $1,000 principal amount of Old Notes. In exchange for each $1,000 principal amount of Old Notes that is validly tendered after the Early Participation Date but prior to the Expiration Date and not validly withdrawn, holders of such Old Notes will be eligible to receive only the exchange consideration set out in the table above (the “Exchange Consideration”). The consummation of each exchange offer is subject to, and conditional upon, the satisfaction or, where permitted, waiver of the conditions in the Registration Statement. Chevron and CUSA may, at their option and in their sole discretion, waive any such conditions except for the condition that the registration statement of which this prospectus forms a part has been declared effective by the SEC. All conditions to the exchange offers must be satisfied or, where permitted, waived, at or by the Expiration Date.

The CUSA Notes will be unsecured and unsubordinated obligations of CUSA and will rank equally with all other unsecured and unsubordinated indebtedness of CUSA issued from time to time. Each CUSA note will be fully and unconditionally guaranteed by Chevron. Chevron’s guarantees will rank pari passu with Chevron’s other unsecured and unsubordinated indebtedness for borrowed money.

Each CUSA Note issued in exchange for an Old Note will have an interest rate and maturity that is identical to the interest rate and maturity of the tendered Old Note, as well as identical interest payment dates and optional redemption prices (subject to certain technical changes to ensure that calculations of the treasury rate are consistent with the method used in CUSA’s recent issuances of senior notes). No accrued but unpaid interest will be paid on the Old Notes in connection with the exchange offers. However, interest on the applicable CUSA Note will accrue from and including the most recent interest payment date of the tendered Old Note. Subject to the minimum denominations as described in the Registration Statement, the principal amount of each CUSA Note will be rounded down, if necessary, to the nearest whole multiple of $1,000, and CUSA will pay a cash rounding amount equal to the remaining portion, if any, of the exchange price of such Old Note, plus accrued and unpaid interest with respect to such portion of the Old Notes not exchanged.

Questions concerning the terms of the exchange offers or the consent solicitations for the Old Notes should be directed to the dealer manager and solicitation agent:

BofA Securities, Inc.
One Bryant Park
New York, NY 10036
Phone: (704) 999-4067
Email: This email address is being protected from spambots. You need JavaScript enabled to view it.

Questions concerning tender procedures for the Old Notes and requests for additional copies of the Prospectus and the Letter of Transmittal should be directed to the exchange agent and information agent:

D.F. King & Co., Inc.
48 Wall Street, 22nd Floor
New York, New York 10005
Phone: (212) 269-5550
Email: This email address is being protected from spambots. You need JavaScript enabled to view it.
https://www.dfking.com/chevron

The exchange offers and consent solicitations are being made pursuant to the terms and conditions set forth in CUSA and Chevron’s prospectus, dated December 3, 2020 (the “Prospectus), which forms a part of the Registration Statement, and the related Letter of Transmittal and Consent (the “Letter of Transmittal”). Tenders of Old Notes in connection with any of the Exchange Offers may be withdrawn at any time prior to the Expiration Date of the applicable Exchange Offer. Following the Expiration Date, tenders of Old Notes may not be validly withdrawn unless Chevron and CUSA are otherwise required by law to permit withdrawal. Consents to the proposed amendments may be revoked at any time prior to 5:00 p.m., New York City time, on December 16, 2020, unless extended (the “Consent Revocation Deadline”), but may not be revoked at any time thereafter. Consents may be revoked only by validly withdrawing the associated tendered Old Notes. A valid withdrawal of tendered Old Notes prior to the Consent Revocation Deadline will be deemed to be a concurrent revocation of the related consent to the proposed amendments to the relevant Noble Indenture.

Subject to applicable law, each exchange offer and each consent solicitation is being made independently of the other exchange offers and consent solicitations, and Chevron and CUSA reserve the right to terminate, withdraw or amend each exchange offer and each consent solicitation independently of the other exchange offers and consent solicitations at any time and from time to time, as described in the Registration Statement.

This press release is not an offer to sell or a solicitation of an offer to buy any of the securities described herein and is not a solicitation of the related consents. The exchange offers and consent solicitations may be made solely pursuant to the terms and conditions of the Prospectus, the Letter of Transmittal and the other related materials. The exchange offers and consent solicitations are not being made in any state or jurisdiction in which such offers would be unlawful prior to registration or qualification under the securities laws of any such state or jurisdiction.

The CUSA Notes are not intended to be offered, sold or otherwise made available to and should not be offered, sold or otherwise made available to any retail investor in the European Economic Area (“EEA”) or in the United Kingdom (“UK”). For these purposes, a retail investor means a person who is one (or more) of: (i) a retail client as defined in point (11) of Article 4(1) of Directive 2014/65/EU (as amended, “MiFID II”); or (ii) a customer within the meaning of Directive (EU) 2016/97, where that customer would not qualify as a professional client as defined in point (10) of Article 4(1) of MiFID II; or (iii) not a qualified investor as defined in Regulation (EU) 2017/1129. Consequently no key information document required by Regulation (EU) No 1286/2014 (as amended, the “PRIIPs Regulation”) for offering or selling the CUSA Notes or otherwise making them available to retail investors in the EEA or in the UK has been prepared and therefore offering or selling the CUSA Notes or otherwise making them available to any retail investor in the EEA or in the UK may be unlawful under the PRIIPs Regulation.

This communication is only being distributed to and is only directed at: (i) persons who are outside the United Kingdom; or (ii) investment professionals falling within Article 19(5) of the Financial Services and Markets Act 2000 (Financial Promotion) Order 2005 (the “FPO”); or (iii) high net worth companies, and other persons to whom it may lawfully be communicated, falling within Article 49(2)(a) to (d) of the FPO (all such persons together being referred to as “relevant persons”). The CUSA Notes are only available to, and any invitation, offer or agreement to subscribe, purchase or otherwise acquire such CUSA Notes will be engaged in only with, relevant persons. Any person who is not a relevant person should not act or rely on this document or any of its contents.

CAUTIONARY STATEMENTS RELEVANT TO FORWARD-LOOKING INFORMATION FOR THE PURPOSE OF “SAFE HARBOR” PROVISIONS OF THE PRIVATE SECURITIES LITIGATION REFORM ACT OF 1995

This news release contains certain forward-looking statements relating to the operations of Chevron and its consolidated subsidiaries, including CUSA (the “Company”) that are based on management's current expectations, estimates and projections about the petroleum, chemicals and other energy-related industries. Words or phrases such as “anticipates,” “expects,” “intends,” “plans,” “targets,” “forecasts,” “projects,” “believes,” “seeks,” “schedules,” “estimates,” “positions,” “pursues,” “may,” “could,” “should,” “will,” “budgets,” “outlook,” “trends,” “guidance,” “focus,” “on schedule,” “on track,” “is slated,” “goals,” “objectives,” “strategies,” “opportunities,” “poised,” “potential” and similar expressions are intended to identify such forward-looking statements. These statements are not guarantees of future performance and are subject to certain risks, uncertainties and other factors, many of which are beyond the Company’s control and are difficult to predict. Therefore, actual outcomes and results may differ materially from what is expressed or forecasted in such forward-looking statements. The reader should not place undue reliance on these forward-looking statements, which speak only as of the date of this news release. Unless legally required, the Company undertakes no obligation to update publicly any forward-looking statements, whether as a result of new information, future events or otherwise.

Among the important factors that could cause actual results to differ materially from those in the forward-looking statements are: changing crude oil and natural gas prices and demand for our products, and production curtailments due to market conditions; crude oil production quotas or other actions that might be imposed by the Organization of Petroleum Exporting Countries and other producing countries; public health crises, such as pandemics (including the novel coronavirus (“COVID-19”) pandemic) and epidemics, and any related government policies and actions; changing economic, regulatory and political environments in the various countries in which the Company operates; general domestic and international economic and political conditions; changing refining, marketing and chemicals margins; the Company’s ability to realize anticipated cost savings, expenditure reductions and efficiencies associated with enterprise transformation initiatives; actions of competitors or regulators; timing of exploration expenses; timing of crude oil liftings; the competitiveness of alternate-energy sources or product substitutes; technological developments; the results of operations and financial condition of the company’s suppliers, vendors, partners and equity affiliates, particularly during extended periods of low prices for crude oil and natural gas during the COVID-19 pandemic; the inability or failure of the Company’s joint-venture partners to fund their share of operations and development activities; the potential failure to achieve expected net production from existing and future crude oil and natural gas development projects; potential delays in the development, construction or start-up of planned projects; the potential disruption or interruption of the Company’s operations due to war, accidents, political events, civil unrest, severe weather, cyber threats, terrorist acts, or other natural or human causes beyond the Company’s control; the potential liability for remedial actions or assessments under existing or future environmental regulations and litigation; significant operational, investment or product changes required by existing or future environmental statutes and regulations, including international agreements and national or regional legislation and regulatory measures to limit or reduce greenhouse gas emissions; the potential liability resulting from pending or future litigation; the ability to successfully integrate the operations of the Company and Noble Energy and achieve the anticipated benefits from the transaction; the Company’s other future acquisitions or dispositions of assets or shares or the delay or failure of such transactions to close based on required closing conditions; the potential for gains and losses from asset dispositions or impairments; government mandated sales, divestitures, recapitalizations, industry-specific taxes, tariffs, sanctions, changes in fiscal terms or restrictions on scope of the Company’s operations; foreign currency movements compared with the U.S. dollar; material reductions in corporate liquidity and access to debt markets; the receipt of required board authorizations to pay future dividends; the effects of changed accounting rules under generally accepted accounting principles promulgated by rule-setting bodies; the Company’s ability to identify and mitigate the risks and hazards inherent in operating in the global energy industry; and the factors set forth under the heading “Risk Factors” on pages 18 through 21 of Chevron’s 2019 Annual Report on Form 10-K, in Chevron’s Quarterly Reports on Form 10-Q for the quarters ended September 30, 2020, June 30, 2020 and March 31, 2020, and in subsequent filings with the SEC. Other unpredictable or unknown factors not discussed in this news release could also have material adverse effects on forward-looking statements.


Contacts

Sean Comey, +1-925-842-5509


41% of the global population and 57% of the economy could be exposed to flooding by 2040 and over a third of today’s agricultural land will be under high water stress

LONDON--(BUSINESS WIRE)--Moody’s affiliate Four Twenty Seven today released a report analyzing the future exposure of the global population, the economy, and agriculture to a range of climate hazards, exploring both global trends and findings by country. Leveraging new analytics developed by Four Twenty Seven, the report assesses exposure to floods, heat stress, hurricanes and typhoons, rising sea levels, wildfires, and water stress and is based on the only known global dataset matching physical climate risk exposure to population location, GDP Purchasing Power Parity (PPP), and agricultural areas within countries.


“This novel dataset provides a detailed view of the exposure of key human and economic assets around the world. Understanding exposure is critical for investors and credit institutions to price climate risk, but also to help direct finance flows towards adaptation and resilience where they’re most needed,” says Emilie Mazzacurati, Global Head of Moody’s Climate Solutions in Moody’s ESG Solutions Group, and Four Twenty Seven’s Founder & CEO.

The findings of Measuring What Matters: A New Approach to Assessing Sovereign Climate Risk have significant implications for human health, food security and economic productivity.

Key findings include:

  • By 2040, the number of people exposed to damaging floods is predicted to rise from 2.2 billion to 3.6 billion people, or from 28% to 41% of the global population, with roughly $78 trillion, equivalent to about 57% of the world’s current GDP exposed to flooding.
  • Over 25% of the world’s population in 2040 could be in areas where the frequency and severity of hot days far exceeds local historical extremes, with negative implications for human health, labor productivity, and agriculture. In some areas of Latin America, climate change will expose 80-100% of agriculture to increased heat stress in 2040.
  • By 2040, over a third of today’s agricultural area will be subject to high water stress. In Africa, over 125 million people and over 35 million hectares of agriculture will be exposed to increased water stress in the future, threatening regional food security.
  • By 2040, nearly a third of the world’s population may live in areas where the meteorological conditions and vegetative fuel availability would allow wildfires to spread if ignited.
  • Over half of the population in small island developing nations are exposed to either hurricanes and typhoons or coastal flooding amplified by sea level rise. In the United States and China alone, over $10 Trillion worth of GDP (PPP) is exposed to hurricanes and typhoons.

A full copy of the report can be found here.

The full sovereign dataset is available from Moody’s ESG Solutions on request.

ABOUT MOODY’S ESG SOLUTIONS

Moody’s ESG Solutions Group is a business unit of Moody’s Corporation serving the growing global demand for ESG and climate insights. It houses Four Twenty Seven,  a leading publisher and provider of data, market intelligence and analysis related to physical climate and environmental risks. The group leverages Moody’s data and expertise across ESG, climate risk, and sustainable finance, and aligns with Moody's Investors Service (MIS) and Moody's Analytics (MA) to deliver a comprehensive, integrated suite of ESG and climate risk solutions including ESG scores, analytics, Sustainability Ratings and Sustainable Finance Reviewer/certifier services.

For more information visit Moody’s ESG & Climate Risk hub.


Contacts

MOODY’S ESG SOLUTIONS
Lisa Stanton
MD-Global Sales Lead/ESG
+1 415 874 6000
This email address is being protected from spambots. You need JavaScript enabled to view it.

MEDIA INQUIRIES
Julian Knapp
Moody’s ESG Communications
+44 207 772 1967
This email address is being protected from spambots. You need JavaScript enabled to view it.

Natalie Ambrosio Preudhomme
Four Twenty Seven
+1 707 338 7508
This email address is being protected from spambots. You need JavaScript enabled to view it.

moodys.com/esg
@MoodysESG
linkedin.com/company/moodys-corporation

DUBLIN--(BUSINESS WIRE)--The "European Active Insulation Market 2020-2026" report has been added to ResearchAndMarkets.com's offering.


The European active insulation market is estimated to grow at a CAGR of 4.8% during the forecast period.

The major factors driving the market growth include stringent building emission regulations and increasing launches of insulation materials in the region.

In July 2018, under the Clean Energy for All Europeans package, new rules for energy performance in buildings came into effect (Directive (2018/844/EU, amending existing Directive 2010/31/EU). Such new provisions are intended to make future buildings more comfortable and greener, which makes them consume less energy. In the EU, buildings account for nearly 40% of energy consumption and 36% of carbon dioxide (CO2) emissions.

In the EU, nearly 35% of the buildings are more than 50 years old and nearly 75% of the building stock is energy inefficient. Additionally, 0.4-1.2% of the building stock is renovated annually (depends on the country). Thus, existing building renovation has the potential for significant energy savings. This, in turn, will potentially lower CO2 emissions by about 5% and decrease the EU's total energy consumption by 5-6%. This, in turn, will drive the demand for active insulation products in the EU buildings and the construction sector to reduce energy consumption and greenhouse gas emissions.

The market is segmented into product and application, which is classified based on its applications, such as building and construction and textile. Based on product, building and construction insulation materials include mineral wool, EPS, glass wool, and others. Textile insulation materials include polyester, cotton, nylon, and wool. Based on application, active insulation material applications in the building and construction industry include commercial and residential. Its applications in the textile industry include sportswear, activewear, and others. The demand for sportswear has increased significantly in Western European countries including UK, Germany, France, and Switzerland, owing to the increasing shift towards a healthy lifestyle and participation in sports activities. Adidas AG and PUMA SE are the major international sportswear brands with headquarter in the region. This results in the demand for polyester for sportswear as it is a suitable fabric option for manufacturing sports clothing, owing to durability, superior elasticity, lightweight, and non-absorbent fabric.

Companies Mentioned

  • ACTIS Insulation Ltd.
  • Armacell International S.A.
  • Freudenberg SE
  • H.Dawson Sons and Company (HDWool) Ltd.
  • Knauf Gips KG
  • MITI Spa
  • Remmers (UK) Ltd.
  • Rockwool International A/S
  • Saint-Gobain Group
  • UdiDAMMSYSTEME GmbH
  • Wacker Chemie AG

The Report covers:

  • Comprehensive research methodology of the European active insulation market.
  • This report also includes a detailed and extensive market overview with key analyst insights.
  • Exhaustive analysis of macro and micro factors influencing the market guided by key recommendations.
  • Analysis of regional regulations and other government policies impacting the European active insulation market.
  • Insights about market determinants which are stimulating the European active insulation market.
  • Detailed and extensive market segments with regional distribution of forecast revenues.
  • Extensive profiles and recent developments of market players.

Key Topics Covered:

1. Report Summary

1.1. Research Methods and Tools

1.2. Market Breakdown

1.2.1. By Segments

1.2.2. By Country

2. Market Overview and Insights

2.1. Scope of the Report

2.2. Analyst Insight & Current Market Trends

2.2.1. Key Findings

2.2.2. Recommendations

2.2.3. Conclusion

3. Competitive Landscape

3.1. Company Share Analysis

3.2. Key Strategy Analysis

3.3. Key Company Analysis

3.3.1. Overview

3.3.2. Financial Analysis

3.3.3. SWOT Analysis

3.3.4. Recent Developments

4. Market Determinants

4.1. Motivators

4.2. Restraints

4.3. Opportunities

5. Market Segmentation

5.1. Active Insulation Market by Product

5.1.1. Building and Construction

5.1.1.1. Mineral Wool

5.1.1.2. Expanded Polystyrene (EPS)

5.1.1.3. Glass Wool

5.1.1.4. Others

5.1.2. Textile

5.1.2.1. Polyester

5.1.2.2. Cotton

5.1.2.3. Nylon

5.1.2.4. Wool

5.2. European Active Insulation Market by Application

5.2.1. Building and Construction

5.2.1.1. Commercial

5.2.1.2. Residential

5.2.2. Textile

5.2.2.1. Activewear

5.2.2.2. Sportswear

5.2.2.3. Others

6. Regional Analysis

6.1. UK

6.2. Germany

6.3. France

6.4. Spain

6.5. Italy

6.6. Rest of European

7. Company Profiles

For more information about this report visit https://www.researchandmarkets.com/r/ch34yy


Contacts

ResearchAndMarkets.com
Laura Wood, Senior Press Manager
This email address is being protected from spambots. You need JavaScript enabled to view it.
For E.S.T Office Hours Call 1-917-300-0470
For U.S./CAN Toll Free Call 1-800-526-8630
For GMT Office Hours Call +353-1-416-8900

~Greenlane to supply biogas upgrading system for new RNG project for injection into the local gas grid~

VANCOUVER, British Columbia--(BUSINESS WIRE)--$GRN #RNG--Greenlane Renewables Inc. (“Greenlane”) (TSXV:GRN / FSE:52G) today announced that its wholly-owned subsidiary, Greenlane Biogas North America Ltd., has signed a $10 million (US$7.7 million) contract for a new renewable natural gas (“RNG”) project in the United States owned by an international energy company. This project will utilize Greenlane’s membrane separation biogas upgrading system. The project owner and location have been withheld at this time. Order fulfilment by Greenlane will start immediately.


“Greenlane continues to gain traction with global energy companies as they seek to diversify their energy portfolios and introduce low carbon intensity fuel options to their customer base,” said Brad Douville, President & CEO of Greenlane. “To be selected for this exciting new project showcases again our unique ability to provide the best solution from our portfolio of multiple upgrading technologies. This is becoming increasingly important as our customers originate, develop and finance a wide range of projects within their respective portfolios each with unique requirements. This ability, combined with our decades of experience and proven track record, makes Greenlane the ideal partner to help all of our customers scale up rapidly.”

Greenlane’s sales pipeline, as announced with its Q3 financial results for the period ending September 30, 2020, and which feeds into the sales order backlog, was in excess of $690 million. The sales pipeline continues to expand and is reflective of the growing global focus on the low-carbon energy transition. The sales order backlog, which refers to unrecognized revenue from contracted projects, was $43.8 million at September 30, 2020, which represents an annual increase of over 350% compared to September 30, 2019.

While uncertainty remains with respect to the COVID-19 pandemic and its ongoing impact on global economies, the Company believes that the energy transition is here to stay. Furthermore, the Company believes that RNG will play a meaningful and growing part in countries’ efforts to stimulate their economies while tackling climate change and moving toward a decarbonized future, in which Greenlane will play an important role.

International energy companies are rapidly moving to adopt decarbonization strategies and increase renewable and low carbon energy sources within their respective portfolios, including RNG. Earlier in 2020, several leading international energy companies announced their respective net zero carbon ambitions by 2050, and subsequently announced specific actions to advance their respective plans such as RNG offtake and project financing.

About Greenlane Renewables
Greenlane Renewables is a leading global provider of biogas upgrading systems that are helping decarbonize natural gas. Our systems produce clean, low-carbon renewable natural gas from organic waste sources including landfills, wastewater treatment plants, dairy farms, and food waste, suitable for either injection into the natural gas grid or for direct use as vehicle fuel. Greenlane is the only biogas upgrading company offering the three main technologies: water wash, pressure swing adsorption, and membrane separation. With over 30 years industry experience, patented proprietary technology, and over 110 biogas upgrading systems supplied into 18 countries worldwide, including the world’s largest biogas upgrading facility, Greenlane is inspired by a commitment to helping waste producers, gas utilities or project developers turn a low-value product into a high-value low-carbon renewable resource. For further information, please visit www.greenlanerenewables.com.

FORWARD-LOOKING INFORMATION – This news release contains “forward-looking information” within the meaning of applicable securities laws. All statements contained herein that are not historical in nature contain forward-looking information. Forward-looking information can be identified by words or phrases such as “may”, “expect”, “likely”, “should”, “would”, “plan”, “anticipate”, “intend”, “potential”, “proposed”, “estimate”, “believe” or the negative of these terms, or other similar words, expressions and grammatical variations thereof, or statements that certain events or conditions "may" or "will" happen. The forward-looking information contained in this press release, includes, but is not limited to, Greenlane supplying a membrane separation biogas upgrading system for the RNG project in the US for a leading global energy company; the RNG industry will scale rapidly and Greenlane will be a preferred supplier to the RNG industry; utilizing Greenlane’s membrane separation technology for the RNG Project in the US; order fulfilment starting immediately; and RNG will play an important role in global decarbonization and companies’ decarbonization strategies. The forward-looking information contained herein is made as of the date of this press release and is based on assumptions management believed to be reasonable at the time such statements were made, including management's perceptions of future growth, results of operations, operational matters, historical trends, current conditions and expected future developments, as well as other considerations that are believed to be appropriate in the circumstances. While we consider these assumptions to be reasonable based on information currently available to management, there is no assurance that such expectations will prove to be correct. By their nature, forward-looking information is subject to inherent risks and uncertainties that may be general or specific and which give rise to the possibility that expectations, forecasts, predictions, projections or conclusions will not prove to be accurate, that assumptions may not be correct and that objectives, strategic goals and priorities will not be achieved. A variety of factors, including known and unknown risks, many of which are beyond our control, could cause actual results to differ materially from the forward-looking information in this press release. Such factors include, without limitation, the risks that Greenlane will not be able to supply to the RNG project the biogas upgrading systems as contemplated; Greenlane is not the preferred supplier to the RNG industry; the biogas upgrading system does not perform as expected;the project may not be a success or as expected; order fulfilment may not occur as contemplated or at all; and RNG will not have the impact on global decarbonization or companies’ decarbonization strategies as contemplated or at all. Additional risk factors can also be found in the Company's annual information form, which has been filed under the Company's SEDAR profile at www.sedar.com. Readers are cautioned not to put undue reliance on forward-looking information. The Company undertakes no obligation to update or revise any forward-looking information, whether as a result of new information, future events or otherwise, except as required by applicable law. Forward-looking statements contained in this news release are expressly qualified by this cautionary statement.

Neither the TSX Venture Exchange nor its Regulation Services Provider (as that term is defined in the policies of the TSX Venture Exchange) accepts responsibility for the adequacy or accuracy of this release or has in any way approved or disapproved of the contents of this press release.


Contacts

Incite Capital Markets
Eric Negraeff / Darren Seed
604.493.2004
Brad Douville, President & CEO, Greenlane Renewables
This email address is being protected from spambots. You need JavaScript enabled to view it.

DAYTON, Ohio--(BUSINESS WIRE)--REX American Resources Corporation (NYSE: REX) (“REX” or “the Company”) today reported financial results for its fiscal 2020 third quarter (“Q3 ‘20”) ended October 31, 2020. REX management will host a conference call and webcast today at 11:00 a.m. ET.


Conference Call:

212/231-2912

Webcast / Replay URL:

www.rexamerican.com/Corp/Page4.aspx


The webcast will be available for replay for 30 days.

REX American Resources’ Q3 ‘20 results principally reflect its interests in six ethanol production facilities and its refined coal operation. The One Earth Energy, LLC (“One Earth”) and NuGen Energy, LLC (“NuGen”) ethanol production facilities are consolidated, as is the refined coal entity, while those of its four other ethanol plants are reported as equity in income of unconsolidated ethanol affiliates. The Company reports results for its two business segments as ethanol and by-products, and refined coal.

REX’s Q3 ‘20 net sales and revenue rose 43.4% to $124.3 million, compared with $86.7 million in Q3 ‘19. The year-over-year net sales and revenue increase was primarily due to higher ethanol production levels, which led to a 56.7% increase in ethanol gallons sold and more than offset a small year-over-year decline in the average selling price per gallon of ethanol. Primarily reflecting these factors and an improved crush spread, Q3 ‘20 gross profit for the Company’s ethanol and by-products segment rose to $18.9 million, from $0.03 million in Q3 ‘19. As a result, the ethanol and by-products segment generated a profit before income taxes of $17.0 million in Q3 ‘20, compared to a loss of $2.8 million in Q3 ‘19. The Company’s refined coal operation incurred a $1.3 million gross loss and a $1.3 million loss before income taxes in Q3 ‘20, compared to a $1.8 million gross loss and a loss before income taxes of $1.6 million in Q3 ‘19. REX reported a Q3 ‘20 profit before income taxes and non-controlling interests of $15.1 million, compared with a loss before income taxes and non-controlling interests of $4.9 million in the comparable year ago period. While the refined coal operation negatively impacted gross profit and income before income taxes, it contributed a tax benefit of $1.0 million and $2.2 million for Q3 ‘20 and Q3 ‘19, respectively.

Net income attributable to REX shareholders in Q3 ‘20 was $8.8 million, compared to a net loss of $2.1 million in Q3 ‘19. Q3 ‘20 basic and diluted net income per share attributable to REX common shareholders was $1.44, compared to a net loss per share of $0.32 in Q3 ‘19. Per share results in Q3 ‘20 and Q3 ‘19 are based on 6,143,000 and 6,319,000 diluted weighted average shares outstanding, respectively.

Segment Income Statement Data:


Three Months
Ended


Nine Months
Ended

($ in thousands)

October 31,


October 31,


2020


2019


2020


2019

Net sales and revenue:


Ethanol & By-Products (1)

$

124,217


$

86,603


$

246,694


$

296,826

Refined coal (2) (3)


34


68


134


288

Total net sales and revenue

$

124,251


$

86,671


$

246,828


$

297,114


Gross profit (loss):


Ethanol & By-Products (1)

$

18,929


$

28


$

11,259


$

12,312

Refined coal (2)


(1,250)


(1,786)


(4,241)


(6,420)

Total gross profit (loss)

$

17,679


$

(1,758)


$

7,018


$

5,892


Income (loss) before income taxes:


Ethanol & By-Products (1)

$

17,007


$

(2,822)


$

1,397


$

3,491

Refined coal (2)


(1,270)


(1,648)


(4,235)


(6,351)

Corporate and other


(626)


(434)


(1,873)


(1,146)

Total income (loss) before income taxes

$

15,111


$

(4,904)


$

(4,711)


$

(4,006)


(Provision) benefit for income taxes:


Ethanol & By-Products

$

(5,071)


$

945


$

(17)


$

(160)

Refined coal


985


2,181


4,863


9,282

Corporate and other


34


105


461


279

Total (provision) benefit for income taxes

$

(4,052)


$

3,231


$

5,307


$

9,401


Segment profit (loss):


Ethanol & By-Products

$

9,660


$

(2,330)


$

49


$

684

Refined coal


(227)


607


821


3,209

Corporate and other


(592)


(329)


(1,412)


(868)

Net income (loss) attributable to REX common shareholders

$

8,841


$

(2,052)


$

(542)


$

3,025

(1)

Includes results attributable to non-controlling interests of approximately 25% for One Earth and approximately 1% for NuGen.

(2)

Includes results attributable to non-controlling interests of approximately 5%.

(3)

Refined coal sales are reported net of the cost of coal.

REX American Resources’ Chief Executive Officer, Zafar Rizvi, commented, “The strength of our third quarter results highlight the resiliency and adaptability of our teams and the efficiency of our plants as our two consolidated plants returned to production during the second quarter.

“Reflecting our solid balance sheet and long-term commitment to enhance shareholder value, during the quarter we repurchased 198,173 REX shares and in fiscal 2020 to date, we have returned over $19 million to shareholders through the repurchase of 316,349 shares. We ended the fiscal 2020 third quarter in a strong financial and liquidity position with cash and cash equivalents and short-term investments in excess of $202 million and working capital of $226 million and no bank debt.”

Balance Sheet

At October 31, 2020, REX had cash, cash equivalents and short-term investments of $202.3 million, $42.4 million of which was at the parent company, and $159.9 million of which was at its consolidated production facilities. This compares with cash, cash equivalents and short-term investments at January 31, 2020, of $205.7 million, $62.3 million of which was at the parent company, and $143.4 million of which was at its consolidated ethanol production facilities.

During the fiscal third quarter ended October 31, 2020 the Company repurchased 198,173 shares of its common stock at a cost $13.3 million, and subsequent to the end of the third quarter the Company purchased an additional 9,500 shares. As a result, the Company can repurchase approximately 33,512 additional shares under its current repurchase authorization. Reflecting all purchases to date, REX presently has approximately 5,992,002 shares of common stock outstanding.

The following table summarizes select data related to REX’s
consolidated alternative energy interests:


Three Months
Ended


Nine Months
Ended


October 31,


October 31,


2020


2019


2020


2019

Average selling price per gallon of ethanol

$

1.31

$

1.39

$

1.28

$

1.34

Average selling price per ton of dried distillers grains

$

129.38

$

134.57

$

136.49

$

137.48

Average selling price per pound of non-food grade corn oil

$

0.24

$

0.26

$

0.25

$

0.25

Average selling price per ton of modified distillers grains

$

56.68

$

56.56

$

52.44

$

59.67

Average cost per bushel of grain

$

3.28

$

4.15

$

3.57

$

3.79

Average cost of natural gas (per MmBtu)

$

2.09

$

2.51

$

2.87

$

2.98

Supplemental data related to REX’s alternative energy interests:

REX American Resources Corporation
Ethanol Ownership Interests/Effective Annual Gallons Shipped as of October 31, 2020
(gallons in millions)


Entity

Trailing
Twelve
Months
Gallons
Shipped

Current
REX
Ownership
Interest

REX’s Current Effective
Ownership of Trailing Twelve
Month Gallons Shipped

One Earth Energy, LLC
Gibson City, IL

119.5

75.3%

90.0

NuGen Energy, LLC
Marion, SD

95.9

99.5%

95.4

Big River Resources West Burlington, LLC
West Burlington, IA

103.1

10.3%

10.6

Big River Resources Galva, LLC
Galva, IL

113.7

10.3%

11.7

Big River United Energy, LLC
Dyersville, IA

117.9

5.7%

6.7

Big River Resources Boyceville, LLC
Boyceville, WI

55.2

10.3%

5.7

 Total

605.3

n/a

220.1

Third Quarter Conference Call

REX will host a conference call at 11:00 a.m. ET today. Senior management will discuss the quarterly financial results and host a question and answer session. The dial in number for the audio conference call is 212/231-2912 (domestic and international callers).

Participants can also listen to a live webcast of the call on the Company’s website, www.rexamerican.com/Corp/Page4.aspx. A webcast replay will be available for 30 days following the live event at www.rexamerican.com/Corp/Page4.aspx.

About REX American Resources Corporation

REX American Resources has interests in six ethanol production facilities, which in aggregate shipped approximately 605 million gallons of ethanol over the twelve-month period ended October 31, 2020. REX’s effective ownership of the trailing twelve-month gallons shipped (for the twelve months ended October 31, 2020) by the ethanol production facilities in which it has ownership interests was approximately 220 million gallons. In addition, the Company acquired a refined coal operation in August 2017. Further information about REX is available at www.rexamerican.com.

This news announcement contains or may contain forward-looking statements within the meaning of the Private Securities Litigation Reform Act of 1995. Such statements can be identified by use of forward-looking terminology such as “may,” “expect,” “believe,” “estimate,” “anticipate” or “continue” or the negative thereof or other variations thereon or comparable terminology. Readers are cautioned that there are risks and uncertainties that could cause actual events or results to differ materially from those referred to in such forward-looking statements. These risks and uncertainties include the risk factors set forth from time to time in the Company’s filings with the Securities and Exchange Commission and include among other things: the effect of pandemics such as COVID-19 on the Company’s business operations, including impacts on supplies, demand, personnel and other factors, the impact of legislative and regulatory changes, the price volatility and availability of corn, distillers grains, ethanol, non-food grade corn oil, gasoline and natural gas, ethanol and refined coal plants operating efficiently and according to forecasts and projections, changes in the international, national or regional economies, weather, results of income tax audits, changes in income tax laws or regulations, the impact of U.S. foreign trade policy, changes in foreign currency exchange rates and the effects of terrorism or acts of war. The Company does not intend to update publicly any forward-looking statements except as required by law.

- statements of operations follow -


REX AMERICAN RESOURCES CORPORATION AND SUBSIDIARIES

Consolidated Statements of Operations

(in thousands, except per share amounts)

Unaudited


Three Months
Ended

Nine Months
Ended


October 31,

October 31,


2020


2019


2020


2019

Net sales and revenue

$

124,251

$

86,671

$

246,828

$

297,114

Cost of sales


106,572


88,429


239,810


291,222

Gross profit (loss)


17,679


(1,758)


7,018


5,892

Selling, general and administrative expenses


(4,257)


(4,133)


(13,300)


(13,629)

Equity in income (loss) of unconsolidated ethanol affiliates


1,152


(15)


168


350

Interest and other income, net


537


1,002


1,403


3,381

Income (loss) before income taxes and

non-controlling interests


15,111


(4,904)


(4,711)


(4,006)

(Provision) benefit for income taxes


(4,052)


3,231


5,307


9,401

Net income (loss) including non-controlling interests


11,059


(1,673)


596


5,395

Net income attributable to non-controlling interests


(2,218)


(379)


(1,138)


(2,370)

Net income (loss) attributable to REX common shareholders

$

8,841

$

(2,052)

$

(542)

$

3,025


Weighted average shares outstanding – basic and diluted


6,143


6,319


6,221


6,318


Basic and diluted net income (loss) per share attributable to REX common shareholders

$

1.44

($

0.32)

($

0.09)

$

0.48


- balance sheets follow -


REX AMERICAN RESOURCES CORPORATION AND SUBSIDIARIES

Consolidated Balance Sheets

(in thousands)

Unaudited


October 31,


January 31,

ASSETS

2020


2020

CURRENT ASSETS:


Cash and cash equivalents

$

173,075


$

179,658

Short-term investments


29,216


26,073

Restricted cash


884


1,113

Accounts receivable


12,496


12,969

Inventory


21,616


35,634

Refundable income taxes


5,947


6,029

Prepaid expenses and other


9,771


9,659

Total current assets


253,005


271,135

Property and equipment-net


154,401


163,327

Operating lease right-of-use assets


14,054


16,173

Deferred taxes


22,297


17,061

Other assets


1,278


342

Equity method investment


30,126


32,464

TOTAL ASSETS

$

475,161


$

500,502

LIABILITIES AND EQUITY


CURRENT LIABILITIES:


Accounts payable – trade

$

15,588


$

18,900

Current operating lease liabilities


5,105


4,935

Accrued expenses and other current liabilities


6,049


7,764

Total current liabilities


26,742


31,599

LONG TERM LIABILITIES:


Deferred taxes


4,138


4,334

Long-term operating lease liabilities


8,548


10,688

Other long-term liabilities


282


275

Total long-term liabilities


12,968


15,297

COMMITMENTS AND CONTINGENCIES


EQUITY:


REX shareholders’ equity:


Common stock, 45,000 shares authorized, 29,853 shares issued at par


299


299

Paid in capital


149,077


148,789

Retained earnings


586,443


586,985

Treasury stock, 23,852 and 23,561 shares, respectively


(353,910)


(335,066)

Total REX shareholders’ equity


381,909


401,007

Non-controlling interests


53,542


52,599

Total equity


435,451


453,606

TOTAL LIABILITIES AND EQUITY

$

475,161


$

500,502


- statements of cash flows follow -


REX AMERICAN RESOURCES CORPORATION AND SUBSIDIARIES

Consolidated Statements of Cash Flows

(in thousands)

Unaudited


Nine Months Ended

October 31,


2020


2019

CASH FLOWS FROM OPERATING ACTIVITIES:


Net income

$

596

$

5,395

Adjustments to reconcile net income to net cash


provided by (used in) operating activities:


Depreciation


15,697


17,682

Amortization of operating lease right-of-use assets


3,982


4,648

Income from equity method investments


(168)


(350)

Dividends received from equity method investments


2,506


1,003

Interest income from investments


(200)


(25)

Deferred income tax


(5,431)


(9,828)

Stock based compensation expense


122


215

Gain on disposal of property and equipment


(58)


-

Changes in assets and liabilities:


Accounts receivable


473


(5,013)

Inventory


14,018


(12,561)

Refundable income taxes


82


473

Prepaid expenses and other assets


(517)


(583)

Accounts payable-trade


(4,302)


5,618

Other liabilities


(5,301)


(9,010)

Net cash provided by (used in) operating activities


21,499


(2,336)

CASH FLOWS FROM INVESTING ACTIVITIES:


Capital expenditures


(6,610)


(2,643)

Purchases of short-term investments


(68,225)


-

Sales of short-term investments


65,282


15,000

Other


(474)


369

Net cash (used in) provided by investing activities


(10,027)


12,726

CASH FLOWS FROM FINANCING ACTIVITIES:


Treasury stock acquired


(18,089)


-

Payments to noncontrolling interests holders


(283)


(2,598)

Capital contributions from minority investor


88


258

Net cash used in financing activities


(18,284)


(2,340)

NET (DECREASE) INCREASE IN CASH, CASH EQUIVALENTS


AND RESTRICTED CASH


(6,812)


8,050

CASH, CASH EQUIVALENTS AND RESTRICTED CASH-Beginning of period


180,771


188,812

CASH, CASH EQUIVALENTS AND RESTRICTED CASH-End of period

$

173,959

$

196,862

Non cash investing activities – Accrued capital expenditures

$

198

$

272

Non cash financing activities – Stock awards accrued

$

-

$

99

Non cash financing activities – Stock awards issued

$

240

$

487


Initial operating lease right-of-use assets and liabilities recorded


upon adoption of ASC 842

$

-

$

20,918

Operating lease right-of-use assets acquired and liabilities assumed


upon lease execution

$

1,863

$

432


Contacts

Douglas Bruggeman
Chief Financial Officer
(937) 276-3931

Joseph Jaffoni, Norberto Aja
JCIR
(212) 835-8500
This email address is being protected from spambots. You need JavaScript enabled to view it.

DUBLIN--(BUSINESS WIRE)--The "Australia Oil and Gas Midstream Market - Growth, Trends, and Forecasts (2020 - 2025)" report has been added to ResearchAndMarkets.com's offering.


The market for the Australian oil and gas midstream is expected to register a CAGR of more than 2.4% during the forecast period of 2020-2025.

Factors, such as increasing investment in the sector and increasing production and consumption of oil and gas, are expected to boost the demand for the Australian oil and gas midstream market during the forecast period. However, the low price of natural gas coupled with the high volatility of crude oil prices is making the industry unprofitable and thereby impeding the growth of the market.

Australia has an extensive pipeline network all over the country. The gas pipeline capacity in the country dominates the landscape relative to the oil pipelines. New pipelines are in the proposal stage and are expected to be completed during the forecast period.

Exploration and production of oil and gas fields in the region are expected to become an opportunity for the companies working in the oil and gas midstream industry as more pipeline and storage infrastructure may be required in the near future.

A significant increase in the production of gas is expected to be the most prominent driver of the market. Investment in the sector and increase in production of oil and gas is also likely to contribute to the rise in the growth of the industry.

Key Market Trends

Pipeline Sector to Witness Growth

In 2019, the Queensland Hunter Gas Pipeline was a proposed natural gas pipeline. The proposed pipeline would run from the Wallumbilla gas hub in Queensland to Newcastle, New South Wales. The pipeline is expected to have a length of, approximately, 825 kilometers (513 Miles) and a capacity of 416.1 million cubic feet per day.

Increase in Production of Natural Gas to Drive the Market

Production of natural gas increased in the country, by 15.3%, year on year, from 97.0, million metric ton oil equivalent in 2017 to 111.9 million metric ton oil equivalent, in 2018. Consumption of gas in Australia increased by 0.4%, from 35.5 Million tonnes oil equivalent (mtoe), in 2017 to 35.6 mtoe, in 2018. The increase in production is expected to boost the growth in the pipeline infrastructure.

Competitive Landscape

The Australian oil and gas midstream market is partially fragmented. The major companies include APA Group, SGSP (Australia) Assets Pty Ltd (SGSPAA), Exxon Mobil Corporation, Royal Dutch Shell PLC, and Chevron Corporation.

Key Topics Covered:

1 INTRODUCTION

2 RESEARCH METHODOLOGY

3 EXECUTIVE SUMMARY

4 MARKET OVERVIEW

4.1 Introduction

4.2 Market Size and Demand Forecast in USD million, until 2025

4.3 Recent Trends and Developments

4.4 Government Policies and Regulations

4.5 Market Dynamics

4.5.1 Drivers

4.5.2 Restraint

4.6 Supply Chain Analysis

4.7 PESTLE ANALYSIS

5 MARKET SEGMENTATION

5.1 Sector

5.1.1 Transportation

5.1.1.1 Overview

5.1.1.1.1 Existing Infrastructure

5.1.1.1.2 Projects in Pipeline

5.1.1.1.3 Upcoming Projects

5.1.2 Storage

5.1.2.1 Overview

5.1.2.1.1 Existing Infrastructure

5.1.2.1.2 Projects in Pipeline

5.1.2.1.3 Upcoming Projects

5.1.3 LNG Terminals

5.1.3.1 Overview

5.1.3.1.1 Existing Infrastructure

5.1.3.1.2 Projects in Pipeline

5.1.3.1.3 Upcoming Projects

6 COMPETITIVE LANDSCAPE

6.1 Mergers and Acquisitions, Joint Ventures, Collaborations, and Agreements

6.2 Strategies Adopted by Leading Players

6.3 Company Profiles

6.3.1 APA Group

6.3.2 SGSP (Australia) Assets Pty Ltd (SGSPAA)

6.3.3 Exxon Mobil Corporation

6.3.4 Royal Dutch Shell PLC

6.3.5 Chevron Corporation

7 MARKET OPPORTUNITIES AND FUTURE TRENDS

For more information about this report visit https://www.researchandmarkets.com/r/18hjqd


Contacts

ResearchAndMarkets.com
Laura Wood, Senior Press Manager
This email address is being protected from spambots. You need JavaScript enabled to view it.
For E.S.T Office Hours Call 1-917-300-0470
For U.S./CAN Toll Free Call 1-800-526-8630
For GMT Office Hours Call +353-1-416-8900

  • Demonstrates continued capital discipline
  • Lowers 2022 to 2025 annual capital guidance to $14-$16 billion
  • Focus on generating higher returns and driving long-term value


SAN RAMON, Calif.--(BUSINESS WIRE)--Chevron Corporation today announced a 2021 organic capital and exploratory spending program of $14 billion and lowered its longer-term guidance to $14 to $16 billion annually through 2025. This capital outlook will continue to prioritize investments that are expected to grow long-term value and deliver higher returns and lower carbon, including over $300 million in 2021 for investments to advance the energy transition.

“Chevron remains committed to capital discipline with a 2021 capital budget and longer-term capital outlook that are well below our prior guidance,” said Chevron Chairman and CEO Michael Wirth. “With our major restructuring behind us and Noble Energy integration on track, we’re prepared to execute this program with discipline.”

Chevron’s capital guidance of $14 to $16 billion annually from 2022 to 2025 is significantly lower than its previous guidance of $19 to $22 billion, which excluded Noble Energy. During this time period, as capital is expected to decrease for a major expansion in Kazakhstan, the company expects to increase investments in a number of Chevron’s advantaged assets, including its world class position in the Permian, other unconventional basins, and the Gulf of Mexico.

“Chevron is in a different place than others in our industry,” Wirth said. “We’ve maintained consistent financial priorities starting with our firm commitment to the dividend. We took early and swift action at the beginning of the pandemic to prudently allocate capital, reduce costs and protect our industry-leading balance sheet. And we’ve completed a major acquisition and restructuring that positions our company to deliver higher returns and grow long-term value.”

Details of the 2021 Capital and Exploratory Investment Program include:

Chevron 2021 Planned Capital & Exploratory Expenditures1


$ Billions

U.S. Upstream

5.0

International Upstream

6.5

Total Upstream


11.5

U.S. Downstream

1.2

International Downstream

0.9

Total Downstream


2.1

Other

0.4

TOTAL (Including Chevron’s Share of Expenditures by Affiliated Companies)


13.9

Expenditures by Affiliated Companies

(4.2)

Cash Expenditures by Chevron Consolidated Companies


9.7

(1) Numbers may not sum due to rounding

In the upstream business, approximately $6.5 billion is allocated to currently producing assets, including about $2 billion for Permian unconventional development. Approximately $3.5 billion of the upstream program is planned for major capital projects underway, of which about 75 percent is associated with the Future Growth Project and Wellhead Pressure Management Project (FGP / WPMP) at the Tengiz field in Kazakhstan. The remaining $1.5 billion is allocated to exploration, early stage development projects, and midstream activities.

Chevron Corporation is one of the world's leading integrated energy companies. Through its subsidiaries that conduct business worldwide, the company is involved in virtually every facet of the energy industry. Chevron explores for, produces and transports crude oil and natural gas; refines, markets and distributes transportation fuels and lubricants; manufactures and sells petrochemicals and additives; generates power; and develops and deploys technologies that enhance business value in every aspect of the company's operations. Chevron is based in San Ramon, California. More information about Chevron is available at www.chevron.com.

As used in this news release, the term “Chevron” and such terms as “the company,” “the corporation,” “our,” “we,” “us” and “its” may refer to Chevron Corporation, one or more of its consolidated subsidiaries, or to all of them taken as a whole. All of these terms are used for convenience only and are not intended as a precise description of any of the separate companies, each of which manages its own affairs.

Please visit Chevron’s website and Investor Relations page at www.chevron.com and www.chevron.com/investors, LinkedIn: www.linkedin.com/company/chevron, Twitter: @Chevron, Facebook: www.facebook.com/chevron, and Instagram: www.instagram.com/chevron, where Chevron often discloses important information about the company, its business, and its results of operations.

CAUTIONARY STATEMENTS RELEVANT TO FORWARD-LOOKING INFORMATION FOR THE PURPOSE OF “SAFE HARBOR” PROVISIONS OF THE PRIVATE SECURITIES LITIGATION REFORM ACT OF 1995

This news release contains forward-looking statements relating to Chevron’s operations that are based on management's current expectations, estimates and projections about the petroleum, chemicals and other energy-related industries. Words or phrases such as “anticipates,” “expects,” “intends,” “plans,” “targets,” “forecasts,” “projects,” “believes,” “seeks,” “schedules,” “estimates,” “positions,” “pursues,” “may,” “could,” “should,” “will,” “budgets,” “outlook,” “trends,” “guidance,” “focus,” “on schedule,” “on track,” “is slated,” “goals,” “objectives,” “strategies,” “opportunities,” “poised,” “potential” and similar expressions are intended to identify such forward-looking statements. These statements are not guarantees of future performance and are subject to certain risks, uncertainties and other factors, many of which are beyond the company’s control and are difficult to predict. Therefore, actual outcomes and results may differ materially from what is expressed or forecasted in such forward-looking statements. The reader should not place undue reliance on these forward-looking statements, which speak only as of the date of this news release. Unless legally required, Chevron undertakes no obligation to update publicly any forward-looking statements, whether as a result of new information, future events or otherwise.

Among the important factors that could cause actual results to differ materially from those in the forward-looking statements are: changing crude oil and natural gas prices and demand for our products, and production curtailments due to market conditions; crude oil production quotas or other actions that might be imposed by the Organization of Petroleum Exporting Countries and other producing countries; public health crises, such as pandemics (including coronavirus (COVID-19)) and epidemics, and any related government policies and actions; changing economic, regulatory and political environments in the various countries in which the company operates; general domestic and international economic and political conditions; changing refining, marketing and chemicals margins; the company’s ability to realize anticipated cost savings, expenditure reductions and efficiencies associated with enterprise transformation initiatives; actions of competitors or regulators; timing of exploration expenses; timing of crude oil liftings; the competitiveness of alternate-energy sources or product substitutes; technological developments; the results of operations and financial condition of the company’s suppliers, vendors, partners and equity affiliates, particularly during extended periods of low prices for crude oil and natural gas during the COVID-19 pandemic; the inability or failure of the company’s joint-venture partners to fund their share of operations and development activities; the potential failure to achieve expected net production from existing and future crude oil and natural gas development projects; potential delays in the development, construction or start-up of planned projects; the potential disruption or interruption of the company’s operations due to war, accidents, political events, civil unrest, severe weather, cyber threats, terrorist acts, or other natural or human causes beyond the company’s control; the potential liability for remedial actions or assessments under existing or future environmental regulations and litigation; significant operational, investment or product changes required by existing or future environmental statutes and regulations, including international agreements and national or regional legislation and regulatory measures to limit or reduce greenhouse gas emissions; the potential liability resulting from pending or future litigation; the company's ability to successfully integrate the operations of Chevron and Noble Energy and achieve the anticipated benefits from the acquisition of Noble Energy; the company’s future acquisitions or dispositions of assets or shares or the delay or failure of such transactions to close based on required closing conditions; the potential for gains and losses from asset dispositions or impairments; government mandated sales, divestitures, recapitalizations, industry-specific taxes, tariffs, sanctions, changes in fiscal terms or restrictions on scope of company operations; foreign currency movements compared with the U.S. dollar; material reductions in corporate liquidity and access to debt markets; the receipt of required Board authorizations to pay future dividends; the effects of changed accounting rules under generally accepted accounting principles promulgated by rule-setting bodies; the company’s ability to identify and mitigate the risks and hazards inherent in operating in the global energy industry; and the factors set forth under the heading “Risk Factors” on pages 18 through 21 of the company's 2019 Annual Report on Form 10-K, as updated by Part II, Item 1A, "Risk Factors" in the company's subsequently filed Quarterly Reports on Form 10-Q, and in other subsequent filings with the U.S. Securities and Exchange Commission. Other unpredictable or unknown factors not discussed in this news release could also have material adverse effects on forward-looking statements.


Contacts

Sean Comey, Chevron, 925-842-5509

With faster speeds, improved security, and the ability to connect more end devices, Wi-Fi 6 can support the Industrial Internet of Things in a variety of environments


BOULDER, Colo.--(BUSINESS WIRE)--#IIoT--A new report from Guidehouse Insights examines the Industrial Internet of Things (IIoT) and how Wi-Fi 6 technology could be used in industrial environments.

Wi-Fi has long been pervasive in residential and enterprise settings as an affordable broadband wireless network capable of supporting a multitude of users with Internet connectivity and low-cost communications. Until now, however, Wi-Fi has not had the capacity, latency, reliability, or security necessary for many machine-to-machine applications in industrial environments. With the advent of Wi-Fi 6, that is changing. Click to tweet: According to a new report from @WeAreGHInsights, global investment in Wi-Fi 6 infrastructure in the industrial segments for factory, warehouse, transport, power plant, network operating center, mine, refinery, and oil well sites is expected to grow from $1.7 billion in 2021 to $6.9 billion in 2030 at a compound annual growth rate of 16.8%.

“The latest generation of Wi-Fi protocols, formerly known as 802.11ax but more simply called Wi-Fi 6, has a variety of technical upgrades supporting faster download and upload speeds, longer battery life, the ability to connect many more end devices, and improved security,” says Richelle Elberg, principal research analyst with Guidehouse Insights. “As such, it has the potential to support the IIoT in a variety of harsh environments where Wi-Fi has historically been considered unsuitable.”

North America and Europe, which have higher square footage and numbers of sites in many of the industrial segments as well as greater investment in IIoT technologies more broadly, are expected to lead the market, particularly in the early years of the forecast. Notably, lower labor and equipment costs in Asia Pacific are expected to depress major investments in that region relative to North America and Europe in the early years of the forecast. Asia Pacific and Latin America are expected to show the highest growth rates.

The report, Wi-Fi 6 and the IIoT, provides an overview of the IIoT and how Wi-Fi 6 technology may be used in industrial environments. It covers legacy and emerging use cases for connectivity in factories, warehouses, network operating centers (NOCs), power plants, refineries, oil & gas well pads, and mines. It describes the technical upgrades made in the latest Wi-Fi networking protocol and how it can affordably support digitalization in industrial settings. An overview of Wi-Fi 6 service and infrastructure providers is included, and market forecasts for industrial investment in Wi-Fi 6 networking infrastructure is provided by industrial segment and by global region through 2030. An executive summary of the report is available for free download on the Guidehouse Insights website.

About Guidehouse Insights

Guidehouse Insights, the dedicated market intelligence arm of Guidehouse, provides research, data, and benchmarking services for today’s rapidly changing and highly regulated industries. Our insights are built on in-depth analysis of global clean technology markets. The team’s research methodology combines supply-side industry analysis, end-user primary research, and demand assessment, paired with a deep examination of technology trends, to provide a comprehensive view of emerging resilient infrastructure systems. Additional information about Guidehouse Insights can be found at www.guidehouseinsights.com.

About Guidehouse

Guidehouse is a leading global provider of consulting services to the public and commercial markets with broad capabilities in management, technology, and risk consulting. We help clients address their toughest challenges with a focus on markets and clients facing transformational change, technology-driven innovation and significant regulatory pressure. Across a range of advisory, consulting, outsourcing, and technology/analytics services, we help clients create scalable, innovative solutions that prepare them for future growth and success. Headquartered in Washington DC, the company has more than 7,000 professionals in more than 50 locations. Guidehouse is led by seasoned professionals with proven and diverse expertise in traditional and emerging technologies, markets and agenda-setting issues driving national and global economies. For more information, please visit: www.guidehouse.com.

* The information contained in this press release concerning the report, Wi-Fi 6 and the IIoT, is a summary and reflects the current expectations of Guidehouse Insights based on market data and trend analysis. Market predictions and expectations are inherently uncertain and actual results may differ materially from those contained in this press release or the report. Please refer to the full report for a complete understanding of the assumptions underlying the report’s conclusions and the methodologies used to create the report. Neither Guidehouse Insights nor Guidehouse undertakes any obligation to update any of the information contained in this press release or the report.


Contacts

Lindsay Funicello-Paul
+1.781.270.8456
This email address is being protected from spambots. You need JavaScript enabled to view it.

Collaboration integrates Semtech’s LoRa® devices with Ripl Networks’ IP mesh, 3D location tracking software to help secure naval ports

CAMARILLO, Calif.--(BUSINESS WIRE)--Semtech Corporation (Nasdaq: SMTC), a leading supplier of high performance analog and mixed-signal semiconductors and advanced algorithms, announced Ripl Networks, the leader in IP networking for low power devices, has been selected by the U.S. Department of Defense (DoD) to deploy an IP mesh, 3D tracking solution for foreign guest and fleet assets at naval ports.


Semtech’s LoRa® devices provide the long range, low-bandwidth connectivity for Ripl’s IP over low power devices messaging system called MLMesh™. Ripl’s software enables Tiny Edge computing where low cost, machine learning emitters can live inside the Enterprise IP network. The combined technology enables low power devices to talk Internet Protocol (IP) at long distances while accurately tracking 3D locations without GPS or cellular towers.

“Ripl lets Tiny-Edge computers talk IP creating a long distance, wire-free extension of the IP WAN,” said Kerry Shih, CEO of Ripl Networks. “LoRa devices’ proven distance and low power enables Ripl to offer an IP fabric up to 20km from node to node with a battery life up to 10 years.”

The DoD was searching for 3D tracking of assets in a private, IP network that would support low power sensors. “After what we’ve seen demonstrated around the Port of Hueneme, I trust we’ll continue to see investment in progressive technologies like Tiny Edge computing and Ripl MLMesh,” said Alan Jaeger, Director of NavalX Ventura TechBridge at the Department of Navy. “Ripl and LoRa combine to secure this new class of networked computers using IP infrastructure versus creating a second data network just for IoT.”

The Port of Hueneme, the only deep-water harbor between Los Angeles and the San Francisco Bay area, will be the first DoD deployment of the asset tracking solution. Port of Hueneme CEO & Port Director Kristin Decas said, “We are proud of our long history of vigilance when it comes to security on the port. Ripl will help further that mission with real-time, 3D location tracking of assets for which we are responsible.”

Ripl Networks will act as the systems integrator with other key technologies, including Avnet’s IoT Connect platform, which will serve as the backend system for data storage and monitoring.

“Semtech’s LoRa platform enables the rapid and scalable deployment of military-grade applications, such as Ripl Networks’ asset tracking solution,” said Marc Pegulu, Vice President of IoT Product Marketing for Semtech’s Wireless and Sensing Products Group. “We are pleased to assist the U.S. Department of Defense in its efforts to monitor and secure critical American assets.”

About Semtech’s LoRa® Platform

Semtech’s LoRa device-to-Cloud platform is a globally adopted long range, low power solution for IoT applications, enabling the rapid development and deployment of ultra-low power, cost efficient and long range IoT networks, gateways, sensors, module products, and IoT services worldwide. Semtech’s LoRa devices provide the communication layer for the LoRaWAN® protocol, which is maintained by the LoRa Alliance®, an open IoT alliance for Low Power Wide Area Network (LPWAN) applications that has been used to deploy IoT networks in over 100 countries. Semtech is a founding member of the LoRa Alliance. To learn more about how LoRa enables IoT, visit Semtech’s LoRa site.

About Semtech

Semtech Corporation is a leading supplier of high performance analog and mixed-signal semiconductors and advanced algorithms for infrastructure, high-end consumer and industrial equipment. Products are designed to benefit the engineering community as well as the global community. The Company is dedicated to reducing the impact it, and its products, have on the environment. Internal green programs seek to reduce waste through material and manufacturing control, use of green technology and designing for resource reduction. Publicly traded since 1967, Semtech is listed on the Nasdaq Global Select Market under the symbol SMTC. For more information, visit www.semtech.com.

About Ripl Networks

Ripl Networks accelerates IoT adoption by economically bringing sensors into the Enterprise’s IP realm. The Ripl Networks MLMesh system reduces the cost of implementing, administering and maintaining IoT projects and leverages the Enterprise’s existing investment in IP knowledge and networks to do so. Ripl software, devices and reference designs remove threats to the industry achieving its vast potential by slashing dependencies on specialized expertise and extending the obvious and solid momentum of IPv6 for IoT.

Forward-Looking and Cautionary Statements

All statements contained herein that are not statements of historical fact, including statements that use the words “to deploy,” “can,” “enables,” “to offer,” “will,” “efforts to,” “designed to” or other similar words or expressions, that describe Semtech Corporation’s or its management’s future plans, objectives or goals are “forward-looking statements” and are made pursuant to the Safe-Harbor provisions of the Private Securities Litigation Reform Act of 1995, as amended. Such forward-looking statements involve known and unknown risks, uncertainties and other factors that could cause the actual results of Semtech Corporation to be materially different from the historical results and/or from any future results or outcomes expressed or implied by such forward-looking statements. Such factors are further addressed in Semtech Corporation’s annual and quarterly reports, and in other documents or reports, filed with the Securities and Exchange Commission (www.sec.gov) including, without limitation, information under the captions “Management’s Discussion and Analysis of Financial Condition and Results of Operations” and “Risk Factors.” Semtech Corporation assumes no obligation to update any forward-looking statements in order to reflect events or circumstances that may arise after the date of this release, except as required by law.

Semtech, the Semtech logo and LoRa are registered trademarks or service marks of Semtech Corporation or its affiliates.

SMTC-P


Contacts

Ronda Grech
Semtech Corporation
(805) 250-1263
This email address is being protected from spambots. You need JavaScript enabled to view it.

DUBLIN--(BUSINESS WIRE)--The "Norway Oil and Gas Market - Growth, Trends, and Forecast (2020 - 2025)" report has been added to ResearchAndMarkets.com's offering.


The Norwegian oil and gas market is expected to register a CAGR more significant than 7.5%

Factors, such as huge investment and government policies, are likely to drive the oil and gas market in Norway, during the forecast period. Oil companies increased their spending for the first time in 2018, since 2014. This is expected to propel the Norwegian oil and gas market. However, the Government of Norway is expected to divest investments from the oil and gas sector and increase the investments in alternative energy, which may hinder the growth of Norway's oil and gas market during the forecast period.

The oil and gas upstream sector is expected to dominate the Norwegian oil and gas market, owing to discoveries in the North Sea.

The increasing demand for LNG in the country leads to the integration of smart technologies in the existing LNG infrastructure, which may create an ample amount of opportunities for the market in the coming years.

Lower breakeven prices are expected to drive the Norwegian oil and gas market, mainly achieved by project re-engineering, efficiency gains, better expense management, and drop in oilfield services cost, due to lack in demand for services.

Key Market Trends

Upstream Sector to Dominate the Market

The upstream oil and gas investment in Norway has witnessed significant changes since 2014. Though oil production increased during 2014-2016, the operating cost declined during the same period.

  • However, the oil production of Norway has declined significantly. During 2016-2018, the oil production of the country declined by about 8%, and it is expected to further decline by another 4.7% by the end of 2020. However, the production is expected to witness a boom from 2021, as major fields begin production.
  • In order to offset the decline in production from mature oilfields, the upstream oil and gas companies are investing heavily in developing new oilfields. Moreover, the drop in breakeven prices has turned many oil and gas projects in the country profitable, which were first considered economically unviable due to low oil prices.
  • Moreover, in 2019, the investment in the Norwegian offshore oil and gas industry (excluding exploration) increased by 13%, to more than NOK 140 billion. A number of small projects received FIDs in 2017, 2018, and 2019, and they are expected to come online in 2020 and 2021.
  • Hence, investments and policies for new oilfields are expected to be the biggest and the most dominating drivers for the Norwegian oil and gas upstream market, during the forecast period.

Lower Breakeven Prices are Expected to Drive the Market

The oil and gas industry, especially the upstream sector, is dependent on the price of crude oil. Prior to 2014, one of the major problems faced by the Norwegian petroleum industry was the high breakeven prices.

  • Some of the major companies, such as Statoil, now Equinor, registered a negative cash flow for some of its fields in 2013, despite the high oil price of USD 112 per barrel. After the steep oil price drop, which started in late-2014, almost every oilfield in the country became unprofitable.
  • However, during 2014-2017, many oilfields registered a drop in breakeven oil prices. As of 2018, Equinor's breakeven oil price for its entire upstream portfolio was about USD 27 per barrel. The drop in breakeven prices was mainly achieved by project re-engineering, efficiency gains, better expense management, and drop in oilfield services cost, due to lack in demand for services.
  • This drop-in breakeven price has turned many projects profitable, which were first considered economically unviable due to low oil prices, for example, Johan Sverdrup and Johan Carstberg, which are expected to account for a significant share in Norway's oil and gas industry investments.
  • Hence, by making some of the major projects economically viable, the drop in breakeven prices is expected to drive the Norwegian oil and gas market during the forecast period.

Competitive Landscape

The Norwegian oil and gas market is moderately fragmented due to many companies operating in the industry. The key players in this market include Equinor ASA, Aker BP ASA, Total SA, Royal Dutch Shell PLC, and Exxon Mobil Corporation.

Key Topics Covered:

1 INTRODUCTION

2 EXECUTIVE SUMMARY

3 RESEARCH METHODOLOGY

4 MARKET OVERVIEW

4.1 Introduction

4.2 Oil and Gas Proven Reserves in Norway

4.3 Crude Oil and Natural Gas Production and Consumption Forecast in thousand barrels per day, until 2025

4.4 Refining Capacity and Forecast, until 2025

4.5 Refined Product Consumption Forecast, until 2025

4.6 LNG and Pipeline Export Capacity Forecast, until 2025

4.7 Average Onshore and Offshore Rigs, until 2019

4.8 Total Wells Drilled in Norway, by Type, 2018

4.9 List of Oil Fields in Norway, 2018

4.10 List of Gas Fields in Norway, 2018

4.11 Total Exploration Wells Drilled in Norway, 2018

4.12 Total Development Wells Drilled in Norway, 2018

4.13 Oil Production Market Share for Major Companies, 2018

4.14 Gas Production Market Share for Major Companies, 2018

4.15 Oil and Gas Industry Investment Trend

4.16 Recent Trends and Developments

4.17 Government Policies and Regulations

4.18 Market Dynamics

4.18.1 Drivers

4.18.2 Restraints

4.19 Supply-Chain Analysis

4.20 PESTLE Analysis

5 MARKET SEGMENTATION

5.1 Upstream

5.1.1 Onshore Exploration and Production Scenario

5.1.2 Offshore Exploration and Production Scenario

5.1.3 Petroleum Liquids Production in million bbl, until 2018

5.1.4 Annual Exploration Well Activity, until 2018

5.1.5 List of Key Projects

5.1.5.1 Existing Projects

5.1.5.2 Upcoming and Planned Projects

5.2 Midstream

5.2.1 Transportation Scenario

5.2.2 LNG Terminals, Processing Stations, and Storage

5.2.3 LNG Export and Import Statistics, until 2018

5.2.4 List of Key projects

5.2.4.1 Existing Projects

5.2.4.2 Upcoming and Planned Projects

5.3 Downstream

5.3.1 Refinery Sector Scenario

5.3.2 Norway Refinery Throughput Capacity in thousand barrels per day, until 2018

5.3.3 Petrochemical Plants

5.3.4 List of Key projects

5.3.4.1 Existing Projects

5.3.4.2 Upcoming and Planned Projects

6 COMPETITIVE LANDSCAPE

6.1 Mergers and Acquisitions, Joint Ventures, Collaborations, and Agreements

6.2 Strategies Adopted by Leading Players

6.3 Company Profiles

6.3.1 Equinor ASA

6.3.2 Aker BP ASA

6.3.3 Total SA

6.3.4 Royal Dutch Shell PLC

6.3.5 Exxon Mobil Corporation

6.3.6 DNO Norge AS

6.3.7 Petoro AS

6.3.8 Baker Hughes Company

6.3.9 Schlumberger Limited

6.3.10 Chevron Corporation

6.3.11 Vr Energi AS

7 MARKET OPPORTUNITIES AND FUTURE TRENDS

For more information about this report visit https://www.researchandmarkets.com/r/4f6bir


Contacts

ResearchAndMarkets.com
Laura Wood, Senior Press Manager
This email address is being protected from spambots. You need JavaScript enabled to view it.
For E.S.T Office Hours Call 1-917-300-0470
For U.S./CAN Toll Free Call 1-800-526-8630
For GMT Office Hours Call +353-1-416-8900

DALLAS--(BUSINESS WIRE)--Pioneer Natural Resources Company (NYSE:PXD) (“Pioneer“ or “the Company“) today announced that the special meeting of stockholders of the Company (the “Pioneer special meeting”) to approve the issuance of Pioneer common stock pursuant to the merger agreement among the Company, Parsley Energy, Inc. (“Parsley”) and certain subsidiaries of the Company and Parsley, and other shares of common stock of the Company reserved for issuance in connection with the transactions contemplated by the merger agreement, is scheduled to take place on January 12, 2021 at 9:00 am Central Time. The record date for Pioneer stockholders entitled to vote at the Pioneer special meeting is the close of business on December 7, 2020.


Pioneer expects to file a definitive joint proxy statement/prospectus with the U.S. Securities and Exchange Commission relating to the proposed acquisition by Pioneer of Parsley and begin mailing the definitive joint proxy statement/prospectus to the Company’s stockholders in early December 2020. The definitive joint proxy statement/prospectus will be available on the “Investors” section of the Company’s website, as well as www.sec.gov.

As announced on October 20, 2020, Pioneer and Parsley have entered into a definitive merger agreement under which Pioneer will acquire all of the outstanding shares of Parsley in an all-stock transaction. Under the terms of the agreement, Parsley stockholders will receive a fixed exchange ratio of 0.1252 shares of Pioneer common stock for each share of Parsley common stock owned. The Pioneer board unanimously recommends that Pioneer stockholders vote “FOR” the Pioneer stock issuance proposal.

Pioneer stockholders who need assistance in completing the proxy card, require additional copies of the proxy materials, or have questions regarding the Pioneer special meeting may contact Pioneer’s proxy solicitor, D.F. King & Co., Inc., 48 Wall Street, 22nd Floor, New York, NY 10005. Banks and brokers can call collect at (212) 269-5550, and all others call toll-free at (800) 859-8509. Additionally, requests can be submitted by email at This email address is being protected from spambots. You need JavaScript enabled to view it..

Pioneer is a large independent oil and gas exploration and production company, headquartered in Dallas, Texas, with operations in the United States. For more information, visit Pioneer’s website at www.pxd.com.

Additional Information and Where to Find It

This communication may be deemed to be solicitation material in respect of the proposed transaction between Pioneer and Parsley. The proposed transaction will be submitted to Pioneer’s stockholders and Parsley’s stockholders for their consideration. Pioneer and Parsley have filed a joint proxy statement/prospectus (the “Joint Proxy Statement/Prospectus”) with the Securities and Exchange Commission (the “SEC”) in connection with the solicitation of proxies by Pioneer and Parsley in connection with the proposed transaction. Pioneer has filed a registration statement on Form S-4 (the “Form S-4”) with the SEC, in which the Joint Proxy Statement/Prospectus was included. The information in the Form S-4 is not complete and may be changed. Pioneer and Parsley also intend to file other relevant documents with the SEC regarding the proposed transaction. After the Form S-4 is declared effective by the SEC, the definitive Joint Proxy Statement/Prospectus will be mailed to Pioneer’s stockholders and Parsley’s stockholders. BEFORE MAKING ANY VOTING OR INVESTMENT DECISION WITH RESPECT TO THE PROPOSED TRANSACTION, INVESTORS AND STOCKHOLDERS OF PIONEER AND INVESTORS AND STOCKHOLDERS OF PARSLEY ARE URGED TO READ THE DEFINITIVE JOINT PROXY STATEMENT/PROSPECTUS REGARDING THE PROPOSED TRANSACTION (INCLUDING ANY AMENDMENTS OR SUPPLEMENTS THERETO) AND OTHER RELEVANT MATERIALS CAREFULLY AND IN THEIR ENTIRETY WHEN THEY BECOME AVAILABLE BECAUSE THEY DO AND WILL CONTAIN IMPORTANT INFORMATION ABOUT THE PROPOSED TRANSACTION.

The Joint Proxy Statement/Prospectus, any amendments or supplements thereto and other relevant materials, and any other documents filed by Pioneer or Parsley with the SEC, may be obtained once such documents are filed with the SEC free of charge at the SEC’s website at www.sec.gov or free of charge from Pioneer at www.pxd.com or by directing a request to Pioneer’s Investor Relations Department at This email address is being protected from spambots. You need JavaScript enabled to view it. or free of charge from Parsley at www.parsleyenergy.com or by directing a request to Parsley’s Investor Relations Department at This email address is being protected from spambots. You need JavaScript enabled to view it..

No Offer or Solicitation

This communication does not constitute an offer to sell or the solicitation of an offer to buy any securities, or a solicitation of any vote or approval, nor shall there be any sale of securities in any jurisdiction in which such offer, solicitation or sale would be unlawful prior to registration or qualification under the securities laws of any such jurisdiction. No offering of securities shall be made except by means of a prospectus meeting the requirements of Section 10 of the Securities Act.

Participants in the Solicitation

Pioneer, Parsley and certain of their respective executive officers, directors, other members of management and employees may, under the rules of the SEC, be deemed to be “participants” in the solicitation of proxies in connection with the proposed transaction. Information regarding Pioneer’s directors and executive officers is available in its Proxy Statement on Schedule 14A for its 2020 Annual Meeting of Stockholders, filed with the SEC on April 9, 2020 and in its Annual Report on Form 10-K for the year ended December 31, 2019, filed with the SEC on February 24, 2020. Information regarding Parsley’s directors and executive officers is available in its Proxy Statement on Schedule 14A for its 2020 Annual Meeting of Stockholders, filed with the SEC on April 6, 2020 and in its Annual Report on Form 10-K for the year ended December 31, 2019, filed with the SEC on February 21, 2020. These documents may be obtained free of charge from the sources indicated above. Other information regarding the participants in the proxy solicitation and a description of their direct and indirect interests, by security holdings or otherwise, is and will be contained in the Form S-4, the Joint Proxy Statement/Prospectus and other relevant materials relating to the proposed transaction to be filed with the SEC. Stockholders and other investors should read the Joint Proxy Statement/Prospectus carefully before making any voting or investment decisions.

Cautionary Statement Regarding Forward-Looking Information

Except for historical information contained herein, the statements in this news release are forward-looking statements that are made pursuant to the Safe Harbor Provisions of the Private Securities Litigation Reform Act of 1995. Forward-looking statements and the business prospects of Pioneer are subject to a number of risks and uncertainties that may cause Pioneer’s actual results in future periods to differ materially from the forward-looking statements. These risks and uncertainties include, among other things, volatility of commodity prices, product supply and demand; the impact of a widespread outbreak of an illness, such as the COVID-19 pandemic, on global and U.S. economic activity; competition; the ability to obtain environmental and other permits and the timing thereof; other government regulation or action; the ability to obtain approvals from third parties and negotiate agreements with third parties on mutually acceptable terms; litigation; the costs and results of drilling and operations; availability of equipment, services, resources and personnel required to perform the Company’s drilling and operating activities; access to and availability of transportation, processing, fractionation, refining, storage and export facilities; Pioneer's ability to replace reserves; implement its business plans or complete its development activities as scheduled; access to and cost of capital; the financial strength of counterparties to Pioneer's credit facility, investment instruments and derivative contracts and purchasers of Pioneer's oil, natural gas liquids and gas production; uncertainties about estimates of reserves and resource potential; identification of drilling locations and the ability to add proved reserves in the future; the assumptions underlying forecasts, including forecasts of production, cash flow, well costs, capital expenditures, rates of return, expenses, and cash flow from purchases and sales of oil and gas, net of firm transportation commitments; sources of funding; tax rates; quality of technical data; environmental and weather risks, including the possible impacts of climate change; cybersecurity risks; ability to implement stock repurchases; the risks associated with the ownership and operation of the Company's oilfield services businesses and acts of war or terrorism. These and other risks are described in Pioneer's Annual Report on Form 10-K for the year ended December 31, 2019, Quarterly Reports on Form 10-Q filed thereafter and other filings with the United States Securities and Exchange Commission. In addition, the Company may be subject to currently unforeseen risks that may have a materially adverse effect on it.

Additionally, the information in this news release contains forward-looking statements related to the recently announced merger transaction between the Company and Parsley. Such forward-looking statements are subject to risks and uncertainties that are difficult to predict and, in many cases, beyond the Company's control. These risks and uncertainties include, among other things, the risk that the businesses of Pioneer and Parsley will not be integrated successfully; the cost savings, synergies and growth from the proposed transaction may not be fully realized or may take longer to realize than expected; management time may be diverted on transaction-related issues; the potential adverse effect of future regulatory or legislative actions on Pioneer and Parsley or the industries in which they operate, including the risk of new restrictions with respect to development activities on Pioneer's or Parsley's assets; the credit ratings of the combined company or its subsidiaries may be different from what Pioneer expects; Pioneer or Parsley may be unable to obtain governmental and regulatory approvals required for the proposed transaction, or that required governmental and regulatory approvals may delay the proposed transaction or result in the imposition of conditions that could reduce the anticipated benefits from the proposed transaction or cause the parties to abandon the proposed transaction; a condition to closing of the proposed transaction may not be satisfied; the length of time necessary to consummate the proposed transaction may be longer than anticipated for various reasons; potential liability resulting from pending or future litigation related to the proposed transaction; the potential impact of the announcement or consummation of the proposed transaction on relationships with customers, suppliers, and competitors; and transaction costs may be higher than anticipated.

Accordingly, no assurances can be given that the actual events and results will not be materially different than the anticipated results described in the forward-looking statements. Pioneer undertakes no duty to publicly update these statements except as required by law.


Contacts

Pioneer Natural Resources Company Contacts:
Investors
Neal Shah - 972-969-3900
Tom Fitter - 972-969-1821
Michael McNamara - 972-969-3592
Greg Wright – 972-969-1770

Media and Public Affairs
Tadd Owens - 972-969-5760
Christina Voss – 972-969-5706

DUBLIN--(BUSINESS WIRE)--The "Nigeria Oil & Gas Downstream Market - Growth, Trends, and Forecasts (2020 - 2025)" report has been added to ResearchAndMarkets.com's offering.


The Nigerian oil refining capacity has increased by 63% between 2010 and 2018. The Nigerian oil & gas downstream sector is driven by the development of large and modular refineries. However, the market is restrained by poor maintenance and supply disruption resulting in a low utilization rate.

The increasing refining capacity is expected to drive the demand in the market during the forecast period. Digitalization and modernization of the refining and petrochemical sector are expected to reduce the refining costs and process losses. This, in turn, is expected to create an opportunity for the market during the forecast period. Improving the existing downstream infrastructure and encouraging private sector investment for the refineries and petrochemical plants in is expected to drive the studied market during the forecast period.

Key Market Trends

Refinery Segment Dominate the Market

Nigeria is the second biggest oil-rich country in Africa, after Libya. The country is estimated to hold 37 billion barrels of proven oil reserves. However, despite its rich resources, at present Nigeria's state-dominated oil industry is declining, afflicted by systemic corruption, starved for international investment, and hit hard by weak oil prices. Despite that malaise, oil remains the country's chief source of income.

Improving the Infrastructure and Encouraging Private Sector Investment to Drive the Market

Nigeria ranked as the 13th largest crude oil producer in the world with an average daily output of about 2 million barrels per day. Such high production country should have proper downstream infrastructure.

Competitive Landscape

The market for Nigeria oil & gas downstream remains concentrated. Some of the key players are Nigerian National Petroleum Corporation (NNPC), KBR Inc., NDEP plc, Indorama Group, and Midoil Refining & Petrochemicals Company Limited.

Key Topics Covered:

1 INTRODUCTION

2 EXECUTIVE SUMMARY

3 RESEARCH METHODOLOGY

4 MARKET OVERVIEW

4.1 Introduction

4.2 Refining Capacity and Forecast, in million ton, till 2025

4.3 Key Projects Information

4.4 Recent Trends and Developments

4.5 Government Policies and Regulations

4.6 Market Dynamics

4.6.1 Drivers

4.6.2 Restraints

4.7 PESTLE Analysis

5 COMPETITIVE LANDSCAPE

5.1 Mergers & Acquisitions, Joint Ventures, Collaborations, and Agreements

5.2 Strategies Adopted by Leading Players

5.3 Company Profiles

5.3.1 Nigeria National Petroleum Corporation

5.3.2 Niger Delta Exploration & Production Plc

5.3.3 KBR Inc.

5.3.4 Indorama Group

5.3.5 Midoil Refining & Petrochemicals Company Limited

6 MARKET OPPORTUNITIES AND FUTURE TRENDS

For more information about this report visit https://www.researchandmarkets.com/r/2ttxmk


Contacts

ResearchAndMarkets.com
Laura Wood, Senior Press Manager
This email address is being protected from spambots. You need JavaScript enabled to view it.
For E.S.T Office Hours Call 1-917-300-0470
For U.S./CAN Toll Free Call 1-800-526-8630
For GMT Office Hours Call +353-1-416-8900


ST. PAUL, Minn.--(BUSINESS WIRE)--Securian Financial’s downtown St. Paul headquarters has been certified as energy-efficient by ENERGY STAR and supportive of healthy lifestyles by Fitwel.

ENERGY STAR certified buildings save energy and money and help protect the environment. To be certified, a building must meet strict energy performance standards set by the U.S. Environmental Protection Agency (EPA). Specifically, a building must earn an ENERGY STAR score of 75 or higher, indicating that it performs better than at least 75% of similar buildings nationwide.

Compared with their peers, ENERGY STAR certified buildings, on average, use 35% less energy, generate 35% fewer greenhouse gas emissions and cost $0.54 less per square foot to operate.

Both buildings on Securian Financial’s headquarters campus, located at 400 and 401 Robert Street North, earned ENERGY STAR certification this year.

In 2019, Securian Financial’s 400 Robert Street North location was the first building in Minnesota to be certified by Fitwel as supporting healthier lifestyles, earning a 1-star rating. This year, Securian Financial’s 401 Robert Street North location joins its sibling building across the street in earning Fitwel certification and raising the bar with a 2-star rating.

Developed by the U.S. Centers for Disease Control and Prevention and run by the Center for Active Design, the Fitwel certification recognizes work communities, inside and outside buildings, that support employees’ physical, mental and social health. Securian Financial earned certification after robust examination of its buildings, employee resources and the company’s participation in its downtown St. Paul neighborhood. Fitwel certifications are valid for three years.

We are proud to continue to be recognized for having a healthy workplace for both our employees and the environment,” said Julio Fesser, Securian Financial’s vice president of facilities services. “As downtown St. Paul’s largest private employer, we are committed to being a good neighbor in our community and setting examples for others to emulate.”

ABOUT SECURIAN FINANCIAL

At Securian Financial, we’re here for family. And we’re here because of it. We’re guided by our purpose: helping customers build secure tomorrows. Since 1880, we’ve been building a uniquely diversified company that has outlasted economic ups and downs while staying true to our customers. We’re committed to the markets we serve, providing insurance, investment and retirement solutions that give families the confidence to focus on what’s truly valuable: banking memories with those who matter most.

Securian Financial is the marketing name for Securian Financial Group, Inc. and affiliates.

DOFU 11-2020

1426660


Contacts

Securian Financial
Jeff Bakken, Media Relations
651-665-7558
This email address is being protected from spambots. You need JavaScript enabled to view it.

DUBLIN--(BUSINESS WIRE)--The "West Africa Oil and Gas Midstream Market - Growth, Trends, and Forecasts (2020-2025)" report has been added to ResearchAndMarkets.com's offering.


The market for the West Africa oil and gas midstream market is expected to register a CAGR of more than 1.54% during the forecast period of 2020-2025.

Factors, such as increasing investment in the sector and increasing production and consumption of oil and gas, are expected to boost the demand for the West African oil and gas midstream market during the forecast period. However, political instability in countries is expected to impede growth in the region.

Increasing consumption in the region is expected to increase the growth in the sector with new pipelines and LNG Terminals being expected to be constructed over the forecast period.

Exploration and production of oil and gas fields in the region are expected to become an opportunity for the companies working in the oil and gas midstream industry as more pipeline and storage infrastructure may be required.

Nigeria, which produces most of oil and gas in the region, has relatively better midstream infrastructure than the other countries. Massive investment in the pipelines and LNG terminals are expected to increase the growth in the industry.

Key Market Trends

Pipeline Sector to Witness Growth

The pipeline infrastructure in the region, except Nigeria, is scarce in quantity. Much lower relative to the population. It is expected that the oil and gas market could develop as the countries prosper.

  • The East-West Pipeline is a proposed natural gas pipeline, running from the Obiafu-Obrikom gas plant to the Oben node in Nigeria. The length of the pipeline is expected to be approximately 127 kilometers, with a capacity of 2,000 million cubic feet per day. The pipeline is expected to start by 2020.
  • Petroci Foxtrot Gas Pipeline is an existing natural gas pipeline, running from Foxtrot offshore platform to Abidjan, Cote d'Ivoire. The length of the pipeline is approximately 80 kilometers, with a capacity of 154 million cubic feet per day. The pipeline is one of the main pipelines in the region.
  • Consumption of oil in West Africa increased by 3.9%, from 30.9 million metric ton oil equivalent (mtoe), in 2017 to 32.1 mtoe, in 2018. The increase in consumption incentivizes the investors for the required increase in capacity and increases the investments in the future, thereby boosting growth in the industry.
  • Hence, pipeline capacity is expected to increase slightly during the forecast period due to an increase in the consumption of oil and gas and rising investment in the sector.

Nigeria Oil and Gas Midstream Sector to Witness Growth

The country has abundant supplies of gas but lacks the required infrastructure to move the feedstock to where it could be used. The investment into the midstream infrastructure is expected to reap beneficial outcomes during the forecast period.

  • The West African Gas pipeline is an operating pipeline that delivers gas from Nigeria's Niger Delta to West African nations, such as Benin, Togo, and Ghana. The length of the pipeline is approximately 677 kilometers (421 miles), with a capacity of 200 million cubic feet per day. The pipeline is one of the main pipelines in the region because it connects many countries together.
  • The oil production increased in the country, by 3.0%, from 95.5 million metric ton in 2017 to 98.4 million metric ton in 2018. An increase in oil production is expected to incentivize the investors to invest in the sector, thereby increasing the growth of the industry.
  • The Nigerian oil and gas midstream industry is expected to grow slightly over the forecast period due to the expected increase in the production and consumption of gas and an increase in the investment into the pipeline infrastructure of the country.

Competitive Landscape

The West African oil and gas midstream market is consolidated. Some of the major companies include Nigerian National Petroleum Corporation, Royal Dutch Shell PLC, Eni SPA, Societe Nationale d'Operations Petrolieres de la Cote d'Ivoire (Petroci), and Chevron Corporation.

Key Topics Covered:

1 INTRODUCTION

2 RESEARCH METHODOLOGY

3 EXECUTIVE SUMMARY

4 MARKET OVERVIEW

4.1 Introduction

4.2 Market Size and Demand Forecast in USD million, until 2025

4.3 Recent Trends and Developments

4.4 Government Policies and Regulations

4.5 Market Dynamics

4.5.1 Drivers

4.5.2 Restraint

4.6 Supply Chain Analysis

4.7 PESTLE ANALYSIS

5 MARKET SEGMENTATION

5.1 Type

5.1.1 Transportation

5.1.1.1 Overview

5.1.1.1.1 Existing Infrastructure

5.1.1.1.2 Projects in Pipeline

5.1.1.1.3 Upcoming Projects

5.1.2 Storage

5.1.2.1 Overview

5.1.2.1.1 Existing Infrastructure

5.1.2.1.2 Projects in Pipeline

5.1.2.1.3 Upcoming Projects

5.1.3 LNG Terminals

5.1.3.1 Overview

5.1.3.1.1 Existing Infrastructure

5.1.3.1.2 Projects in Pipeline

5.1.3.1.3 Upcoming Projects

5.2 Geography

5.2.1 Nigeria

5.2.2 Ghana

5.2.3 Rest of West Africa

6 COMPETITIVE LANDSCAPE

6.1 Mergers and Acquisitions, Joint Ventures, Collaborations, and Agreements

6.2 Strategies Adopted by Leading Players

6.3 Company Profiles

6.3.1 Nigerian National Petroleum Corporation

6.3.2 Royal Dutch Shell PLC

6.3.3 Eni SPA

6.3.4 Societe Nationale d'Operations Petrolieres de la Cote d'Ivoire (Petroci)

6.3.5 Chevron Corporation

7 MARKET OPPORTUNITIES AND FUTURE TRENDS

For more information about this report visit https://www.researchandmarkets.com/r/xkcsxi


Contacts

ResearchAndMarkets.com
Laura Wood, Senior Press Manager
This email address is being protected from spambots. You need JavaScript enabled to view it.

For E.S.T Office Hours Call 1-917-300-0470
For U.S./CAN Toll Free Call 1-800-526-8630
For GMT Office Hours Call +353-1-416-8900

SAN JOSE, Calif.--(BUSINESS WIRE)--QuantumScape Corporation (“QuantumScape”), a leader in the development of next generation solid-state lithium-metal batteries for use in electric vehicles (EVs), announced today that it will be providing a first look at its solid-state electric vehicle battery technology at its “Solid-State Battery Showcase” on December 8, 2020, at 11am ET. The event can be accessed via the following link: quantumscape.com/livestream.


Jagdeep Singh, Founder and Chief Executive Officer of QuantumScape, will unveil new performance data on QuantumScape’s unique solid-state battery technology, demonstrating how the company has addressed some of the fundamental issues that are holding back widespread adoption of solid-state batteries. The innovation in QuantumScape’s technology is designed to enable the EV industry to move beyond the performance and physical limits of the current lithium-ion design, which should facilitate more widespread electrification of the transportation sector and enable a lower-carbon future.

The event will also feature an all-star panel of battery scientists and automotive experts who will discuss their views on solid-state batteries and QuantumScape’s technology, and what this technological advancement could mean for the EV industry. The panel will include Prof. Stan Whittingham, co-inventor of the lithium-ion battery and winner of the 2019 Nobel prize in chemistry; Prof. Paul Albertus, former head of the US DOE ARPA-E IONCS solid-state battery program and professor of chemical engineering at the University of Maryland; Prof. Venkat Vishwanathan, battery expert, former lithium-air researcher, and professor of mechanical engineering at Carnegie-Mellon University; Prof. Juergen Leohold, former head of group research at Volkswagen; JB Straubel, co-founder and former CTO of Tesla, and co-founder and CEO of Redwood Materials. The panel will be moderated by Dr. Dave Danielson, first employee at ARPA-E, former head of the US DOE’s EERE program, Precourt scholar at Stanford University, and managing director at Breakthrough Energy Ventures.

About QuantumScape Corporation

QuantumScape is a leader in the development of next generation solid-state lithium-metal batteries for use in electric vehicles. The company's mission is to revolutionize energy storage to enable a sustainable future.

For additional information, please visit www.quantumscape.com

Forward Looking Statements

The information in this press release includes “forward-looking statements” within the meaning of Section 27A of the Securities Act and Section 21E of the Securities Exchange Act of 1934, as amended. All statements, other than statements of present or historical fact included in this press release, including, without limitation, regarding the development, timeline and performance of QuantumScape’s products and technology are forward-looking statements. When used in this press release, the words “is designed to,” “could,” “should,” “enables,” “will,” “may,” “believe,” “anticipate,” “intend,” “estimate,” “expect,” “project,” the negative of such terms and other similar expressions are intended to identify forward-looking statements, although not all forward-looking statements contain such identifying words. These forward-looking statements, including statements about other solid-state battery systems and their limitations, and our belief that our battery solution opens the industry up to the next generation of EVs, are based on management’s current expectations and assumptions about future events and are based on currently available information as to the outcome and timing of future events.

These forward-looking statements involve significant risks and uncertainties that could cause the actual results to differ materially from the expected results. Most of these factors are outside QS’s control and are difficult to predict. Factors that may cause such differences include, but are not limited to: (i) QS faces significant barriers in its attempts to scale from a single layer pouch cell and complete development of its solid-state battery cell and related manufacturing processes, and development may not be successful, (ii) QS may encounter substantial delays in the development, manufacture, regulatory approval, and launch of QS solid-state battery cells, which could prevent QS from commercializing products on a timely basis, if at all, (iii) QS may be unable to adequately control the costs of manufacturing its solid-state separator and battery cells, and (iv) QS may not be successful in competing in the battery market. QS cautions that the foregoing list of factors is not exclusive. Additional information about factors that could materially affect QS is set forth under the “Risk Factors” section in the proxy statement/prospectus/information statement filed by Kensington Capital Acquisition Corp. with the SEC on November 12, 2020 and available on the SEC’s website at www.sec.gov.

Except as otherwise required by applicable law, QuantumScape disclaims any duty to update any forward-looking statements, all of which are expressly qualified by the statements in this section, to reflect events or circumstances after the date of this press release. Should underlying assumptions prove incorrect, actual results and projections could different materially from those expressed in any forward-looking statements.


Contacts

For Investors
This email address is being protected from spambots. You need JavaScript enabled to view it.

For Media
This email address is being protected from spambots. You need JavaScript enabled to view it.

DUBLIN--(BUSINESS WIRE)--The "Russia Oil and Gas EPC Market - Growth, Trends, and Forecasts (2020-2025)" report has been added to ResearchAndMarkets.com's offering.


The Russian oil and gas EPC market is expected to grow at a CAGR of less than 1% during 2020-2025.

Factors such as IMO regulation and global efforts to reduce the use of coal for power generation, the demand for natural gas and low sulfur fuel is expected to increase. This factor, in turn, is expected to promulgate the increasing EPC contracts across the midstream and the downstream sectors. However, United States sanctions and restrictions on collaboration with Russia is likely to affect the country's oil and gas EPC market.

The midstream segment dominated the market during 2019, due to heavy investments in building LNG infrastructure and gas transport pipelines.

Shift of the E&P sector toward offshore deep and ultradeep areas is expected to be the major opportunity for the Russian oil and gas EPC market. Russia has been actively producing oil and gas from the Arctic shelf for quite some time, but with a decline in onshore hydrocarbon production, the national oil companies have no choice but to shift to complex and technologically challenging offshore deep-water and ultradeep water fields.

Increasing investments in the petrochemical industry is expected to drive the market. Russia is planning to launch a raft of new projects over the next few years, aiming to utilize the potentials of the downstream sector and its rapid growth.

Key Market Trends

Midstream Segment to Dominate the Market

Oil and gas pipelines, storage, and LNG and RLNG facilities are the major midstream infrastructures that require EPC services. The growing oil and gas production and export, and aging pipeline infrastructure drive the demand for new midstream infrastructure.

  • Gas movement from Russia to Europe was estimated at around 193.8 billion cubic meter and 223 billion cubic meters total in 2018. This figure is estimated to rise, owing to factors, like an increase in the demand for energy in Europe and the subsequent increase of pipeline network by Russia.
  • The country witnessed an increase in its LNG exports in the past few years, with a growth of about 266% from 6.8 billion cubic meters in 2009 to 24.9 billion cubic meters in 2018. The country currently has two LNG plants, Gazprom-led Sakhalin-2 on the Far East and Novatek's Yamal LNG, on the Arctic Yamal peninsula.
  • The "Power of Siberia" pipeline started operation in December 2019. The pipeline has a length of 8,100 km across Russia and China, aimed at supplying China a cleaner source of energy and make Russia independent of Europe for income from gas exports.
  • Hence, the aforementioned factors are expected to contribute to the growth of the market during the forecast period.

Increasing Investments in Petrochemical Industry to Drive the Market

In the latest world energy outlook, BP forecasted that the global crude oil and condensate demand may rise by less than 3 million barrel per day between 2019 and 2040, due to the increasing growth rate in the use of electric vehicles, among other factors. Hence, like other hydrocarbon-focused economies, Russia is also looking to push into petrochemical amid uncertain prospects for global crude oil demand.

  • Moscow, the capital city of Russia, is also planning to take new measures to spur the petrochemical industry development, with a target of doubling production to around 20 million metric ton per year by 2030.
  • ZapSibNefteKhim's entry into the market announced the beginning of rapid expansion in the Russian petrochemical industry. Further, several projects are already greenlit, which include a 420,000 ton per year ethylene plant in Novy Urengoy in western Siberia, which state-controlled gas firm Gazprom aims to commission in 2020.
  • The Russian energy ministry, in March 2019, approved a new roadmap for developing petrochemical up until 2025, aimed at unlocking an extra USD 40 billion in investments and creating some 18,000 jobs. Hence, the increasing petrochemical infrastructure is expected to drive the Russian oil and gas EPC market during the forecast period.

Competitive Landscape

The Russian oil and gas EPC market is fragmented, and it is dominated by companies, such as Technip FMC, Hyundai Heavy Industries Co. Ltd, Saipem SpA, and McDermott International Inc., among others.

Key Topics Covered:

1 INTRODUCTION

2 RESEARCH METHODOLOGY

3 EXECUTIVE SUMMARY

4 MARKET OVERVIEW

4.1 Introduction

4.2 Market Size and Demand Forecast in USD billion, till 2025

4.3 Recent Trends and Developments

4.4 Government Policies and Regulations

4.5 Market Dynamics

4.5.1 Drivers

4.5.2 Restraints

4.6 Supply Chain Analysis

4.7 PESTLE Analysis

5 MARKET SEGMENTATION

5.1 Sector

5.1.1 Upstream

5.1.2 Midstream

5.1.3 Downstream

6 COMPETITIVE LANDSCAPE

6.1 Mergers and Acquisitions, Joint Ventures, Collaborations, and Agreements

6.2 Strategies Adopted by Leading Players

6.3 Company Profiles

6.3.1 Saipem SpA

6.3.2 McDermott International Inc.

6.3.3 TechnipFMC PLC

6.3.4 Petrofac Limited

7 MARKET OPPORTUNITIES AND FUTURE TRENDS

For more information about this report visit https://www.researchandmarkets.com/r/cdw8zq


Contacts

ResearchAndMarkets.com
Laura Wood, Senior Press Manager
This email address is being protected from spambots. You need JavaScript enabled to view it.
For E.S.T Office Hours Call 1-917-300-0470
For U.S./CAN Toll Free Call 1-800-526-8630
For GMT Office Hours Call +353-1-416-8900

Former Deepwater Wind Executive to Lead Maryland Developer

BALTIMORE--(BUSINESS WIRE)--Today, US Wind Inc. (“US Wind”) announced that it has named Jeffrey Grybowski as Chief Executive Officer. Grybowski will lead US Wind as the company embarks on development of a major offshore wind project off the coast of Maryland. In August, funds managed by affiliates of Apollo Global Management, Inc. (NYSE: APO) (together with its consolidated subsidiaries, “Apollo”) committed to invest up to $265 million in convertible debt and equity to acquire an equity stake in US Wind and fund development and construction costs for its offshore wind project.

Grybowski is the former Chief Executive Officer of Deepwater Wind, the pioneering American offshore wind company. Under Grybowski’s leadership over nearly a decade, the company developed and constructed the Block Island Wind Farm, the first offshore wind farm in the United States, and secured a portfolio of offshore wind power contracts across multiple US East Coast states.

“We are very excited to have Jeff lead our team at US Wind,” said Riccardo Toto, Managing Director of Renexia SpA, the principal owner of US Wind. “His experience in navigating the complex development system in the United States is unmatched. We are building an innovative company at US Wind, and Jeff is the perfect person to lead it.”

Apollo’s Brad Fierstein, a member of US Wind’s board of directors, added, “Jeff is a proven leader in US offshore wind, and an excellent addition to the US Wind platform as we execute on our mission to bring clean energy and new jobs to Maryland.”

“I’m thrilled to be joining the US Wind team. We have big plans to deliver offshore wind to the state of Maryland,” said Grybowski. “This company had a strategic vision for offshore wind in the US long before others in Europe made the jump to this market. We will build on that vision and together with strong financial backing from Apollo Funds, we will make US Wind a major player in the offshore wind space, as a nimble and entrepreneurial company that knows how to execute complex projects in the US.”

US Wind was an early mover in the offshore wind sector in the United States by acquiring the 80,000-acre federal lease area off of the coast of Maryland in 2014. In 2017, the Company was awarded Offshore Renewable Energy Credits (ORECs) from the State of Maryland for the first phase of its MarWin project. In total, the Company’s lease area can support approximately 1,500 MW of offshore wind capacity. In 2019, Maryland passed the Clean Energy Jobs Act, which increased the state’s offshore wind requirements, calling for an additional 1,200 MW to be procured from developers with projects near Maryland.

About US Wind

US Wind was founded in 2011 and has established its position as a premier offshore wind energy development company in the United States. In 2014, US Wind obtained a federal lease for site control to develop approximately 1.5 GW of offshore wind power generation off the coast of Maryland. US Wind is majority owned by Renexia SpA, a leader in renewable energy development in Italy and a subsidiary of Toto Holding SpA. Toto Holding SpA has more than 40 years of experience specializing in large construction and infrastructure projects, primarily in the energy, transportation, and aviation sectors.

About Apollo

Apollo is a leading global alternative investment manager with offices in New York, Los Angeles, San Diego, Houston, Bethesda, London, Frankfurt, Madrid, Luxembourg, Mumbai, Delhi, Singapore, Hong Kong, Shanghai and Tokyo. Apollo had assets under management of approximately $433 billion as of September 30, 2020 in credit, private equity and real assets funds invested across a core group of nine industries where Apollo has considerable knowledge and resources. For more information about Apollo, please visit www.apollo.com.


Contacts

Paula Hose, This email address is being protected from spambots. You need JavaScript enabled to view it.

Richard H. Fearon to retire


DUBLIN--(BUSINESS WIRE)--Power management company Eaton (NYSE:ETN) today announced that Thomas B. Okray has been named executive vice president and chief financial officer effective April 1, 2021. He succeeds Richard H. Fearon, vice chairman and chief financial and planning officer, who will be retiring on March 31, 2021. In this role, Okray will report to Craig Arnold, Eaton’s chairman and chief executive officer.

Okray joins Eaton from W.W. Grainger where he was senior vice president and chief financial officer. Throughout his career, Okray has held various leadership roles including executive vice president and chief financial officer for Advance Auto Parts; vice president, Finance, Global Customer Fulfillment at Amazon; and chief financial officer, Global Product Development, Purchasing and Supply Chain at General Motors.

Okray holds a bachelor’s degree in chemical engineering from Michigan State University and an MBA from the University of Chicago.

Okray and his family will relocate to Cleveland, Ohio.

“I’d like to extend a sincere thank you to Rick for his 18 years of service to Eaton,” said Arnold. “Over the years, Rick has been an instrumental figure in shaping Eaton into the company it is today. He is highly respected in the investment community and has been a trusted partner to our senior leadership team, our board, and to me. We wish him and his family the best for the future.”

Over the next few months, Okray and Fearon will be working together to ensure a smooth leadership transition.

Eaton’s mission is to improve the quality of life and the environment through the use of power management technologies and services. We provide sustainable solutions that help our customers effectively manage electrical, hydraulic, and mechanical power – more safely, more efficiently, and more reliably. Eaton’s 2019 revenues were $21.4 billion, and we sell products to customers in more than 175 countries. We have approximately 92,000 employees. For more information, visit Eaton.com.


Contacts

Margaret Hagan, 440-523-4343
This email address is being protected from spambots. You need JavaScript enabled to view it.

DUBLIN--(BUSINESS WIRE)--The "Fitment Indexation for Value Chain Players and Opportunity Breakup Analysis of Setting EV Charging Stations in India" report has been added to ResearchAndMarkets.com's offering.


To give push to clean mobility in India, Department of Heavy Industries (DHI) has sanctioned 2636 charging stations to get installed in 62 cities across 24 states under phase II of FAME scheme.

The Indian automotive industry has been slowing since the last quarter of calendar year 2018. Some of the key reasons responsible for this downturn were crunch in liquidity, increasing acquisition costs and weakening consumer sentiments. The outbreak of COVID-19 in 2020 has further led to fall in the sales of automobiles in India.

It is pertinent to note that the sales of passenger vehicles and two wheelers fall by 18% in 2020 as compared to last year, while sales of commercial vehicles declined by 29%. Amidst this economic fallout of automobile industry in India, a ray a hope lies with the Indian government pushing clean mobility in public transportation and taking significant initiatives for promoting electric vehicles and establishing efficient charging infra for the same.

The GoI intends to develop such a robust EV charging network that have at least one charging station will be available in most of the selected cities in a grid of 4 Km X 4 km which shall boost the confidence of EV users and will also lift the business sentiments of OEMs and other value chain players. During October 2020 Department of Heavy Industries (DHI) invited EoI for setting and availing incentives for deployment of EV charging infrastructure within the Indian cities. Of the received proposal, 2636 charging stations were sanctioned by the GoI. Of the approved charging stations, 1633 stations will be fast charging and 1003 shall be the slow charging stations.

Key Topics Covered:

  • This Quarter
  • Key Features
  • Leading Edge
  • Numbers to Learn
  • The Eighty - 20 of Industry - What Matters?
  • Key Signposts
  • Deployment Trends
  • Technology
  • Price Trends
  • Industry Activities & Corporate Strategies

Companies Mentioned

  • BHEL
  • Siemens
  • GE
  • Tata Projects
  • L&T
  • NTPC
  • Adani
  • Greenko
  • Renew Power
  • SB Energy
  • NHPC
  • Kalpataru
  • KEC
  • Sterlite
  • Torrent Power
  • BEML
  • EIL
  • GAIL
  • BPCL
  • IOCL
  • Reliance
  • Essar Oil

For more information about this report visit https://www.researchandmarkets.com/r/bj42cg


Contacts

ResearchAndMarkets.com
Laura Wood, Senior Press Manager
This email address is being protected from spambots. You need JavaScript enabled to view it.
For E.S.T Office Hours Call 1-917-300-0470
For U.S./CAN Toll Free Call 1-800-526-8630
For GMT Office Hours Call +353-1-416-8900

Offshore Source Logo

Offshore Source keeps you updated with relevant information concerning the Offshore Energy Sector.

Any views or opinions represented on this website belong solely to the author and do not represent those of the people, institutions or organizations that Offshore Source or collaborators may or may not have been associated with in a professional or personal capacity, unless explicitly stated.

Corporate Offices

Technology Systems Corporation
8502 SW Kansas Ave
Stuart, FL 34997

info@tscpublishing.com