Business Wire News

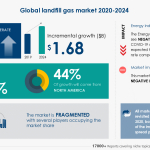
LONDON--(BUSINESS WIRE)--#Globallandfillgasmarket--The global landfill gas market is poised to grow by $ 1.68 bn during 2020-2024, progressing at a CAGR of about 4% during the forecast period. Technavio suggests three forecast scenarios (optimistic, probable, and pessimistic) considering the impact of COVID-19. Download Free Sample Report on COVID-19 Recovery Analysis


The report on the landfill gas market provides a holistic update, market size and forecast, trends, growth drivers, and challenges, as well as vendor analysis.

The report offers an up-to-date analysis regarding the current global market scenario and the overall market environment. The market is driven by the growing demand for energy worldwide.

The landfill gas market analysis includes technology segment, subjects segment, price range segment, and geography landscape. This study identifies the emergence of smart landfills as one of the prime reasons driving the landfill gas market growth during the next few years.

This report presents a detailed picture of the market by the way of study, synthesis, and summation of data from multiple sources by an analysis of key parameters.

The landfill gas market covers the following areas:

Landfill Gas Market Sizing
Landfill Gas Market Forecast
Landfill Gas Market Analysis

Companies Mentioned

  • Advanced Disposal Services Inc.
  • Ameresco Inc.
  • Aria Energy
  • Biffa Group Ltd.
  • Covanta Holding Corp.
  • Energy Developments Pty. Ltd.
  • General Electric Co.
  • Infinis Energy Plc
  • VEOLIA ENVIRONNEMENT SA
  • Waste Management Inc.

Key Topics Covered:

Executive Summary

  • Market Overview

Market Landscape

  • Market ecosystem
  • Value chain analysis

Market Sizing

  • Market definition
  • Market segment analysis
  • Market size 2019
  • Market outlook: Forecast for 2019 - 2024

Five Forces Analysis

  • Five Forces Summary
  • Bargaining power of buyers
  • Bargaining power of suppliers
  • Threat of new entrants
  • Threat of substitutes
  • Threat of rivalry
  • Market condition

Market Segmentation by Technology

  • Market segments
  • Comparison by Technology placement
  • CE - Market size and forecast 2019-2024
  • Turbines - Market size and forecast 2019-2024
  • Others - Market size and forecast 2019-2024
  • Market opportunity by Technology

Customer landscape

  • Overview

Geographic Landscape

  • Geographic segmentation
  • Geographic comparison
  • North America - Market size and forecast 2019-2024
  • Europe - Market size and forecast 2019-2024
  • APAC - Market size and forecast 2019-2024
  • South America - Market size and forecast 2019-2024
  • MEA - Market size and forecast 2019-2024
  • Key leading countries
  • Market opportunity by geography

Drivers, Challenges, and Trends

  • Market drivers
  • Volume driver - Demand led growth
  • Volume driver - Supply led growth
  • Volume driver - External factors
  • Volume driver - Demand shift in adjacent markets
  • Price driver - Inflation
  • Price driver - Shift from lower to higher-priced units
  • Market challenges
  • Market trends

Vendor Landscape

  • Overview
  • Vendor landscape
  • Landscape disruption

Vendor Analysis

  • Vendors covered
  • Market positioning of vendors
  • Advanced Disposal Services Inc.
  • Ameresco Inc.
  • Aria Energy
  • Biffa Group Ltd.
  • Covanta Holding Corp.
  • Energy Developments Pty. Ltd.
  • General Electric Co.
  • Infinis Energy Plc
  • VEOLIA ENVIRONNEMENT SA
  • Waste Management Inc.

Appendix

  • Scope of the report
  • Currency conversion rates for US$
  • Research methodology
  • List of abbreviations


About Us

Technavio is a leading global technology research and advisory company. Their research and analysis focuses on emerging market trends and provides actionable insights to help businesses identify market opportunities and develop effective strategies to optimize their market positions. With over 500 specialized analysts, Technavio’s report library consists of more than 17,000 reports and counting, covering 800 technologies, spanning across 50 countries. Their client base consists of enterprises of all sizes, including more than 100 Fortune 500 companies. This growing client base relies on Technavio’s comprehensive coverage, extensive research, and actionable market insights to identify opportunities in existing and potential markets and assess their competitive positions within changing market scenarios.


Contacts

Technavio Research
Jesse Maida
Media & Marketing Executive
US: +1 844 364 1100
UK: +44 203 893 3200
Email: This email address is being protected from spambots. You need JavaScript enabled to view it.
Website: www.technavio.com/

DUBLIN--(BUSINESS WIRE)--The "Oil Refining Industry in Russia 2020" report has been added to ResearchAndMarkets.com's offering.


The downstream energy sector report, "Oil Refining Industry in Russia" is a complete source of information on Russia crude oil refining industry.

It provides refinery level information relating to existing and planned (new build) refineries such as insights and forecasts of refinery capacities, refined petroleum products production and consumption, refinery complexity factor and comparison against peer group countries in the respective region. The report also covers complete details of major players operating in the refining sector in Russia and in depth analysis of the latest industry news and deals.

Report Scope

  • Outlook of Country Oil Refining Industry and refined petroleum products beyond 2020
  • Forecasts of refined products production and consumption along with major refining companies and operators.
  • Historic and Forecasted Refining capacity and secondary units capacities beyond 2020
  • Key Opportunities and Restraints in country Refinery market
  • Benchmark with five peer group countries on Nelson Complexity Factor.
  • Market structure of Country Refining Industry, companies, capacities and market share.
  • Information on planned refineries such as planned capacity, equity structure, Operator Company, expected commissioning date and project cost.
  • Refined petroleum products production and demand beyond 2020.
  • Refinery level information such as refinery name, commissioned year, primary and secondary units installed capacities along with future capacity expansions, refinery complexity factor, ownership and operator details.
  • Company profiles of major refining companies including SWOT Analysis.
  • Latest mergers, acquisitions, contract announcements and all related industry news and deals analysis.

Key Topics Covered:

1 Table of Contents

1.1 List of Figures

1.2 List of Tables

2 Introduction to Russia Refining Markets

2.1 What is This Report About?

2.2 Market Definition

3 Refining Industry in Russia

3.1 Russia Refining Market Snapshot, 2019

3.2 Role of Russia in Global and Regional Refining Markets

3.2.1 Contribution to Europe and Global Refining Capacity, 2019

3.2.2 Russia Average Nelson Complexity Factor (NCF) vs. Europe and Global, 2019

4 Russia Refining Market- Drivers and Restraints

4.1 Russia Refining Industry: Trends and Issues

4.1.1 Russia Refining Industry: Major Trends

4.2 Major Restrains of Investing in Russia Refining Sector

5 Russia Oil Products Demand and Supply Forecast to 2025

5.1 Russia Refined Products Demand Forecast to 2025

5.1.1 Russia Gasoline Demand Forecast to 2025

5.1.2 Russia Diesel Oil Demand Forecast to 2025

5.1.3 Russia Kerosene Demand Forecast to 2025

5.1.4 Russia LPG Demand Forecast to 2025

5.2 Russia Refined Products Production Forecast to 2025

5.2.1 Russia Gasoline Production Forecast to 2025

5.2.2 Russia Diesel Oil Production Forecast to 2025

5.2.3 Russia Kerosene Production Forecast to 2025

5.2.4 Russia LPG Production Forecast to 2025

6 Russia Refinery Capacities Forecast to 2025

6.1 Location, Operator, Ownership, Startup Details of Operational Refineries in Russia

6.1.1 Refinery Location, Operator, Ownership, Startup Details

6.2 Russia Total Refining Capacity Historic and Forecast, 2012-2025

6.3 Russia Refining Capacity Historic and Forecast, 2012-2025

6.4 Russia Refinery wise Secondary Conversion Unit-1 Capacity, 2012-2025

6.5 Russia Refinery wise Secondary Conversion Unit-2 Capacity, 2012-2025

6.6 Russia Refinery wise Secondary Conversion Unit-3 Capacity, 2012-2025

7 Russia Refining Industry- Future Developments and Investment Opportunities

7.1 Capital Investment Details of All Upcoming Refineries

7.2 Location, Operator, Ownership, Start Up Details of Planned Refineries in Russia

7.2.1 Refinery Location, Operator, Ownership, Startup Details

7.3 Refinery Capacities of All Upcoming Refineries

8 Key Strategies Russia Refining Companies

8.1 Russia Company wise Refining Capacity Forecast, 2012-2025

9 Gazprom Company Profile

9.1 Gazprom Key Information

9.2 Gazprom Company Overview

9.3 Gazprom Business Description

9.4 Gazprom SWOT Analysis

9.4.1 Overview

9.4.2 Strengths

9.4.3 Weaknesses

9.4.4 Opportunities

9.4.5 Threats

9.5 Gazprom Financial Ratios - Capital Market Ratios

9.6 Gazprom Financial Ratios - Annual Ratios

9.7 Gazprom Financial Ratios - Interim Ratios

10 Russia Refining Industry Latest Tenders and Contracts

11 Russia Refining Industry Updates

12 Russia Refining Industry Deals

For more information about this report visit https://www.researchandmarkets.com/r/nqberg


Contacts

ResearchAndMarkets.com
Laura Wood, Senior Press Manager
This email address is being protected from spambots. You need JavaScript enabled to view it.
For E.S.T Office Hours Call 1-917-300-0470
For U.S./CAN Toll Free Call 1-800-526-8630
For GMT Office Hours Call +353-1-416-8900

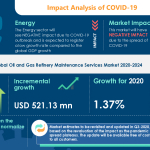
LONDON--(BUSINESS WIRE)--#GlobalOilandGasRefineryMaintenanceServicesMarket--Technavio has been monitoring the oil and gas refinery maintenance services market and it is poised to grow by USD 521.13 mn during 2020-2024, progressing at a CAGR of almost 3% during the forecast period. The report offers an up-to-date analysis regarding the current market scenario, latest trends and drivers, and the overall market environment. Download a Free Sample Report on COVID-19


Impact of COVID-19

The COVID-19 pandemic continues to transform the growth of various industries, however, the immediate impact of the outbreak is varied. While a few industries will register a drop in demand, numerous others will continue to remain unscathed and show promising growth opportunities. COVID-19 will have a low impact on the oil and gas refinery maintenance services market. The market growth in 2020 is likely to increase compared to the market growth in 2019.

Frequently Asked Questions:

  • Based on segmentation by Type, which is the leading segment in the market?
    The turnaround segment will be leading the market during the forecast period.
  • What are the major trends in the market?
    Adoption of modular mini refineries.
  • At what rate is the market projected to grow?
    The market is projected to grow at a CAGR of almost 3% during 2020-2024.
  • Who are the top players in the market?
    Aegion Corp., Aptim Corp., Chiyoda Corp., Envent Corp., Fluor Corp., John Wood Group Plc, KBR Inc., Saipem Spa, Sunergon, and Turner Industries Group are the top players in the market.
  • What are the key market drivers and challenges?
    The market is driven by the surging demand for refined fuel. However, fluctuations in crude oil prices might hamper growth.

Buy 1 Technavio report and get the second for 50% off. Buy 2 Technavio reports and get the third for free.

View market snapshot before purchasing

The market is fragmented, and the degree of fragmentation will accelerate during the forecast period. Aegion Corp., Aptim Corp., Chiyoda Corp., Envent Corp., Fluor Corp., John Wood Group Plc, KBR Inc., Saipem Spa, Sunergon, and Turner Industries Group are some of the major market participants. Although the surging demand for refined fuel will offer immense growth opportunities, fluctuations in crude oil prices are likely to pose a challenge for the market vendors. In a bid to help players strengthen their market foothold, this oil and gas refinery maintenance services market forecast report provides a detailed analysis of the leading market vendors. The report also empowers industry honchos with information on the competitive landscape and insights into the different product offerings offered by various companies.

Technavio's custom research reports offer detailed insights on the impact of COVID-19 at an industry level, a regional level, and subsequent supply chain operations. This customized report will also help clients keep up with new product launches in direct & indirect COVID-19 related markets, upcoming vaccines and pipeline analysis, and significant developments in vendor operations and government regulations.

Oil and Gas Refinery Maintenance Services Market 2020-2024: Segmentation

Oil and Gas Refinery Maintenance Services Market is segmented as below:

  • Type
    • Turnaround
    • Maintenance And Repair
  • Geography
    • APAC
    • Europe
    • North America
    • MEA
    • South America

To learn more about the global trends impacting the future of market research, download a free sample: https://www.technavio.com/talk-to-us?report=IRTNTR44762

Oil and Gas Refinery Maintenance Services Market 2020-2024: Scope

Technavio presents a detailed picture of the market by the way of study, synthesis, and summation of data from multiple sources. The oil and gas refinery maintenance services market report covers the following areas:

  • Oil and Gas Refinery Maintenance Services Market Size
  • Oil and Gas Refinery Maintenance Services Market Trends
  • Oil and Gas Refinery Maintenance Services Market Industry Analysis

This study identifies the adoption of modular mini refineries as one of the prime reasons driving the Oil and Gas Refinery Maintenance Services Market growth during the next few years.

Technavio suggests three forecast scenarios (optimistic, probable, and pessimistic) considering the impact of COVID-19. Technavio’s in-depth research has direct and indirect COVID-19 impacted market research reports.

Register for a free trial today and gain instant access to 17,000+ market research reports.

Technavio's SUBSCRIPTION platform

Oil and Gas Refinery Maintenance Services Market 2020-2024: Key Highlights

  • CAGR of the market during the forecast period 2020-2024
  • Detailed information on factors that will assist oil and gas refinery maintenance services market growth during the next five years
  • Estimation of the oil and gas refinery maintenance services market size and its contribution to the parent market
  • Predictions on upcoming trends and changes in consumer behavior
  • The growth of the oil and gas refinery maintenance services market
  • Analysis of the market’s competitive landscape and detailed information on vendors
  • Comprehensive details of factors that will challenge the growth of oil and gas refinery maintenance services market vendors

Table of Contents:

Executive Summary

Market Landscape

Market Sizing

Five Forces Analysis

Market Segmentation by Product

Customer Landscape

Geographic Landscape

Vendor Landscape

Vendor Analysis

Appendix

Explore Technavio

About Us

Technavio is a leading global technology research and advisory company. Their research and analysis focuses on emerging market trends and provides actionable insights to help businesses identify market opportunities and develop effective strategies to optimize their market positions. With over 500 specialized analysts, Technavio’s report library consists of more than 17,000 reports and counting, covering 800 technologies, spanning across 50 countries. Their client base consists of enterprises of all sizes, including more than 100 Fortune 500 companies. This growing client base relies on Technavio’s comprehensive coverage, extensive research, and actionable market insights to identify opportunities in existing and potential markets and assess their competitive positions within changing market scenarios.


Contacts

Technavio Research
Jesse Maida
Media & Marketing Executive
US: +1 844 364 1100
UK: +44 203 893 3200
Email: This email address is being protected from spambots. You need JavaScript enabled to view it.
Website: www.technavio.com/


HOUSTON--(BUSINESS WIRE)--National Oilwell Varco, Inc. (NYSE: NOV) will hold a conference call to discuss its fourth quarter and full year 2020 results on Friday, February 5, 2021 at 10 a.m. (Central Time). NOV will issue a press release with the Company’s results after the market closes for trading on Thursday, February 4, 2021. The call will be webcast live on www.nov.com/investors.


About NOV

National Oilwell Varco (NYSE: NOV) is a leading provider of technology, equipment, and services to the global oil and gas industry that supports customers’ full-field drilling, completion, and production needs. Since 1862, NOV has pioneered innovations that improve the cost-effectiveness, efficiency, safety, and environmental impact of oil and gas operations. NOV powers the industry that powers the world.

Visit www.nov.com for more information.


Contacts

Blake McCarthy
(713) 815-3535

  • Pilot testwork will be completed on a 50t sample of ore collected from Piedmont’s Core Property
  • SGS Canada will complete dense medium and flotation pilot work over the coming weeks
  • Concentrate produced will be used in internal and third-party lithium hydroxide pilot programs
  • Results will be used to support definitive feasibility and detailed design engineering

NEW YORK--(BUSINESS WIRE)--$PLL #Lithium--Piedmont Lithium Limited (“Piedmont” or “Company”) is pleased to announce that it will partner with SGS Canada, Inc. (“SGS”) in Lakefield, Ontario to complete a pilot-scale spodumene concentrator testwork program using a bulk sample collected from the Piedmont Lithium Project in North Carolina.


The Company collected over 50 tonnes of mineralized pegmatite from 17 locations across the Company’s Core Property in February 2020. Samples were collected from near surface pegmatites located in areas of early, middle, and late year production.

The pilot plant design will be based on the results of prior testwork programs and will be used to support both definitive feasibility study of the Company’s planned concentrate operations as well as detailed design engineering of the full-scale operations.

The pilot program will target production of a large sample of spodumene concentrate with at least 6.0% Li2O and less than 1.0% Fe2O3 for use in future pilot-scale lithium hydroxide testwork programs that Piedmont will complete as part of Definitive Feasibility Study of the Company’s planned integrated lithium chemical plant.

Pilot Plant Setup at SGS Canada

The pilot scale testwork is viewed by the Company as a critical step in ensuring future commissioning and ramp-up success. Additionally, the bulk sample collected targeted a range of potential concentrator feed conditions, including low-grade zones and diluted feed. Testing variable conditions rather than an optimized feed will help inform engineering design and eliminate potential operational bottlenecks during the project design phase.

Keith D. Phillips, President and Chief Executive Officer, commented: “We are pleased to continue our partnership with SGS Canada on this important pilot-scale testwork program, which will underpin our upcoming definitive feasibility study as well as future detailed design engineering of our spodumene concentrator. The program will enable Piedmont to complete future lithium hydroxide testwork programs and also supply large samples of spodumene concentrate to our key customer, Tesla, for their own testing purposes.”


Contacts

Keith Phillips
President & CEO
T: +1 973 809 0505
E: This email address is being protected from spambots. You need JavaScript enabled to view it.

Tim McKenna
Investor and Government Relations
T: +1 732 331 6457
E: This email address is being protected from spambots. You need JavaScript enabled to view it.

DUBLIN--(BUSINESS WIRE)--The "Oil Refining Industry in Saudi Arabia 2020" report has been added to ResearchAndMarkets.com's offering.


"Oil Refining Industry in Saudi Arabia" is a complete source of information on Saudi Arabia crude oil refining industry. It provides refinery level information relating to existing and planned (new build) refineries such as insights and forecasts of refinery capacities, refined petroleum products production and consumption, refinery complexity factor and comparison against peer group countries in the respective region.

The report also covers complete details of major players operating in the refining sector in Saudi Arabia and in depth analysis of the latest industry news and deals.

Report Scope

  • Outlook of Country Oil Refining Industry and refined petroleum products beyond 2020
  • Forecasts of refined products production and consumption along with major refining companies and operators.
  • Historic and Forecasted Refining capacity and secondary units capacities beyond 2020
  • Key Opportunities and Restraints in country Refinery market
  • Benchmark with five peer group countries on Nelson Complexity Factor.
  • Market structure of Country Refining Industry, companies, capacities and market share.
  • Information on planned refineries such as planned capacity, equity structure, Operator Company, expected commissioning date and project cost.
  • Refined petroleum products production and demand beyond 2020.
  • Refinery level information such as refinery name, commissioned year, primary and secondary units installed capacities along with future capacity expansions, refinery complexity factor, ownership and operator details.
  • Company profiles of major refining companies including SWOT Analysis.
  • Latest mergers, acquisitions, contract announcements and all related industry news and deals analysis.

Key Topics Covered:

1 Table of Contents

1.1 List of Figures

1.2 List of Tables

2 Introduction to Saudi Arabia Refining Markets

2.1 What is This Report About?

2.2 Market Definition

3 Refining Industry in Saudi Arabia

3.1 Saudi Arabia Refining Market Snapshot, 2019

3.2 Role of Saudi Arabia in Global and Regional Refining Markets

3.2.1 Contribution to Middle East and Africa and Global Refining Capacity, 2019

3.2.2 Saudi Arabia Average Nelson Complexity Factor (NCF) vs. Middle East and Africa and Global, 2019

4 Saudi Arabia Refining Market- Drivers and Restraints

4.1 Saudi Arabia Refining Industry: Trends and Issues

4.1.1 Saudi Arabia Refining Industry: Major Trends

4.2 Major Restrains of Investing in Saudi Arabia Refining Sector

5 Saudi Arabia Oil Products Demand and Supply Forecast to 2025

5.1 Saudi Arabia Refined Products Demand Forecast to 2025

5.1.1 Saudi Arabia Gasoline Demand Forecast to 2025

5.1.2 Saudi Arabia Diesel Oil Demand Forecast to 2025

5.1.3 Saudi Arabia Kerosene Demand Forecast to 2025

5.1.4 Saudi Arabia LPG Demand Forecast to 2025

5.2 Saudi Arabia Refined Products Production Forecast to 2025

6 Saudi Arabia Refinery Capacities Forecast to 2025

6.1 Location, Operator, Ownership, Startup Details of Operational Refineries in Saudi Arabia

6.1.1 Refinery Location, Operator, Ownership, Startup Details

6.2 Saudi Arabia Total Refining Capacity Historic and Forecast, 2012-2025

6.3 Saudi Arabia Refining Capacity Historic and Forecast, 2012-2025

6.4 Saudi Arabia Refinery wise Secondary Conversion Unit-1 Capacity, 2012-2025

6.5 Saudi Arabia Refinery wise Secondary Conversion Unit-2 Capacity, 2012-2025

6.6 Saudi Arabia Refinery wise Secondary Conversion Unit-3 Capacity, 2012-2025

7 Saudi Arabia Refining Industry- Future Developments and Investment Opportunities

7.1 Capital Investment Details of All Upcoming Refineries

7.2 Location, Operator, Ownership, Start Up Details of Planned Refineries in Saudi Arabia

7.2.1 Refinery Location, Operator, Ownership, Startup Details

7.3 Refinery Capacities of All Upcoming Refineries

8 Key Strategies Saudi Arabia Refining Companies

8.1 Saudi Arabia Company wise Refining Capacity Forecast, 2012-2025

9 Saudi Arabian Oil Company Company Profile

9.1 Saudi Arabian Oil Company Key Information

9.2 Saudi Arabian Oil Company Company Overview

9.3 Saudi Arabian Oil Company Business Description

9.4 Saudi Arabian Oil Company SWOT Analysis

9.4.1 Overview

9.4.2 Strengths

9.4.3 Weaknesses

9.4.4 Opportunities

9.4.5 Threats

9.5 Saudi Arabian Oil Company Financial Ratios - Capital Market Ratios

9.6 Saudi Arabian Oil Company Financial Ratios - Annual Ratios

9.7 Saudi Arabian Oil Company Financial Ratios - Interim Ratios

10 Saudi Arabia Refining Industry Latest Tenders and Contracts

11 Saudi Arabia Refining Industry Updates

12 Saudi Arabia Refining Industry Deals

For more information about this report visit https://www.researchandmarkets.com/r/pbnsnn


Contacts

ResearchAndMarkets.com
Laura Wood, Senior Press Manager
This email address is being protected from spambots. You need JavaScript enabled to view it.
For E.S.T Office Hours Call 1-917-300-0470
For U.S./CAN Toll Free Call 1-800-526-8630
For GMT Office Hours Call +353-1-416-8900

LONDON--(BUSINESS WIRE)--#GlobalMaritimeInformationMarket--The maritime information market is expected to grow by $ 736.98 mn, progressing at a CAGR of over 8% during the forecast period. Download Free Sample Report


The rising demand for operational efficiency enhancement by machine learning and data science is one of the major factors propelling market growth. However, factors such as high cost of implementation will hamper the market growth.

More details: https://www.technavio.com/report/maritime-information-market-industry-analysis

Maritime Information Market: Application Landscape

Based on the application, the MIA segment is expected to witness lucrative growth during the forecast period.

Maritime Information Market: Geographic Landscape

By geography, Europe is going to have a lucrative growth during the forecast period. About 45% of the market’s overall growth is expected to originate from Europe. Germany and Greece are the key markets for maritime information in Europe.

Buy 1 Technavio report and get the second for 50% off. Buy 2 Technavio reports and get the third for free.

View market snapshot before purchasing

Companies Covered:

  • FLIR Systems Inc.
  • Garmin Ltd.
  • Inmarsat Group Ltd.
  • Kongsberg Gruppen ASA
  • L3Harris Technologies Inc.
  • Maxar Technologies Inc.
  • ORBCOMM Inc.
  • Raytheon Co.
  • Saab AB
  • Thales Group

What our reports offer:

  • Market share assessments for the regional and country-level segments
  • Strategic recommendations for the new entrants
  • Covers market data for 2019, 2020, until 2024
  • Market trends (drivers, opportunities, threats, challenges, investment opportunities, and recommendations)
  • Strategic recommendations in key business segments based on the market estimations
  • Competitive landscaping mapping the key common trends
  • Company profiling with detailed strategies, financials, and recent developments
  • Supply chain trends mapping the latest technological advancements

Technavio suggests three forecast scenarios (optimistic, probable, and pessimistic) considering the impact of COVID-19. Technavio’s in-depth research has direct and indirect COVID-19 impacted market research reports.

Register for a free trial today and gain instant access to 17,000+ market research reports.

Technavio's SUBSCRIPTION platform

Key Topics Covered:

Executive Summary

Market Landscape

  • Market ecosystem
  • Value chain analysis

Market Sizing

  • Market definition
  • Market segment analysis
  • Market size 2019
  • Market outlook: Forecast for 2019 - 2024

Five Forces Analysis

  • Five force summary
  • Bargaining power of buyers
  • Bargaining power of suppliers
  • Threat of new entrants
  • Threat of substitutes
  • Threat of rivalry
  • Market condition

Market Segmentation by Application

  • Market segments
  • Comparison by Application
  • MIA - Market size and forecast 2019-2024
  • MIP - Market size and forecast 2019-2024
  • VT - Market size and forecast 2019-2024
  • AIS - Market size and forecast 2019-2024
  • Market opportunity by Application

Market Segmentation by End-user

  • Market segments
  • Comparison by End user
  • Commercial - Market size and forecast 2019-2024
  • Government - Market size and forecast 2019-2024
  • Market opportunity by End user

Customer landscape

Geographic Landscape

  • Geographic segmentation
  • Geographic comparison
  • Europe - Market size and forecast 2019-2024
  • North America - Market size and forecast 2019-2024
  • APAC - Market size and forecast 2019-2024
  • MEA - Market size and forecast 2019-2024
  • South America - Market size and forecast 2019-2024
  • Key leading countries
  • Market opportunity by geography
  • Market drivers
  • Market challenges
  • Market trends

Vendor Landscape

  • Vendor landscape
  • Landscape disruption

Vendor Analysis

  • Vendors covered
  • Market positioning of vendors
  • FLIR Systems Inc.
  • Garmin Ltd.
  • Inmarsat Group Ltd.
  • Kongsberg Gruppen ASA
  • L3Harris Technologies Inc.
  • Maxar Technologies Inc.
  • ORBCOMM Inc.
  • Raytheon Co.
  • Saab AB
  • Thales Group

Appendix

  • Scope of the report
  • Currency conversion rates for US$
  • Research methodology
  • List of abbreviations

About Us

Technavio is a leading global technology research and advisory company. Their research and analysis focuses on emerging market trends and provides actionable insights to help businesses identify market opportunities and develop effective strategies to optimize their market positions. With over 500 specialized analysts, Technavio’s report library consists of more than 17,000 reports and counting, covering 800 technologies, spanning across 50 countries. Their client base consists of enterprises of all sizes, including more than 100 Fortune 500 companies. This growing client base relies on Technavio’s comprehensive coverage, extensive research, and actionable market insights to identify opportunities in existing and potential markets and assess their competitive positions within changing market scenarios.


Contacts

Technavio Research
Jesse Maida
Media & Marketing Executive
US: +1 844 364 1100
UK: +44 203 893 3200
Email: This email address is being protected from spambots. You need JavaScript enabled to view it.
Website: www.technavio.com/

LUXEMBOURG--(BUSINESS WIRE)--Pacific Drilling S.A. (OTC: PACDQ) announced today that it is commencing solicitation of votes on its proposed prearranged chapter 11 plan of reorganization. On November 10, the United States Bankruptcy Court for the Southern District of Texas—Houston Division (the “Bankruptcy Court”) entered an order, among other things, (i) conditionally approving the Disclosure Statement for the First Amended Joint Plan of Reorganization of Pacific Drilling S.A. and its Debtor Affiliates Pursuant to Chapter 11 of the Bankruptcy Code (the “Disclosure Statement”) and (ii) scheduling a combined hearing on December 21, 2020 to consider (a) final approval of the Disclosure Statement and (b) confirmation of the First Amended Joint Plan of Reorganization of Pacific Drilling S.A. and its Debtor Affiliates Pursuant to Chapter 11 of the Bankruptcy Code (the “Plan”). The voting deadline is December 14, 2020 at 5:00 p.m. (prevailing Central Time).

The Plan is subject to Bankruptcy Court approval and, thus, final terms of any restructuring transaction may differ. If approved, the Plan provides for the following:

  • Conversion of approximately $750 million of the Company’s outstanding 8.375% First Lien Notes due 2023 to 91.5% of the equity in the reorganized Company, subject to dilution;
  • Conversion of approximately $326 million of the Company’s outstanding 11.000% / 12.000% Second Lien PIK Notes due 2024 in exchange for 8.5% of the equity in the reorganized Company, subject to dilution, and new warrants for equity in the reorganized Company;
  • Access to new capital in the form of a new senior secured delayed draw term loan credit facility in the aggregate principal amount of up to $80 million; and
  • Elimination of the Company’s entire prepetition cash interest burden to enable the Company to obtain positive free cash flow as the market for high-specification drillships improves.

This description of the Plan is qualified in its entirety by the terms of the Plan, which can be found at http://cases.primeclerk.com/PacificDrilling2020. The Bankruptcy Court has scheduled a hearing for December 21, 2020 to consider approval of the Disclosure Statement on a final basis and whether to confirm the Plan pursuant to 11 U.S.C. § 1129. If the Plan is confirmed, the Company estimates that the Effective Date of the Plan will be on or before December 31, 2020.

With approximately $120 million of cash and cash equivalents as of October 30, 2020, and seven of the most advanced high-specification drillships in the world, Pacific Drilling intends to continue its world-wide operations as usual, deliver services for existing and prospective clients and, subject to court approval, pay all obligations incurred during the Chapter 11 proceedings in full. The Company expects to emerge by year-end with access to new capital in the form of an undrawn $80 million exit facility and with over $100 million of cash and cash equivalents on hand.

Additional information regarding the restructuring and Chapter 11 proceedings, including the Plan and the Disclosure Statement can be found (i) on our website at www.pacificdrilling.com/restructuring, (ii) on a website administered by our claims, noticing, and solicitation agent, Prime Clerk LLC, at http://cases.primeclerk.com/PacificDrilling2020, or (iii) via our dedicated restructuring information line at: +1 877-930-4314 (toll free) or +1 347-897-4073 (international).

Advisors

Greenhill & Co. is acting as financial advisor, Latham & Watkins LLP and Jones Walker LLP are serving as legal counsel, and AlixPartners is acting as restructuring advisor to Pacific Drilling in connection with the restructuring. Houlihan Lokey is acting as financial advisor and Akin Gump Strauss Hauer & Feld LLP is acting as legal advisor to an ad hoc group of noteholders.

About Pacific Drilling

With our best-in-class drillships and highly experienced team, Pacific Drilling is committed to exceeding our customers’ expectations by delivering the safest, most efficient and reliable deepwater drilling services in the industry. Pacific Drilling’s fleet of seven drillships represents one of the youngest and most technologically advanced fleets in the world. For more information about Pacific Drilling, including the Chapter 11 proceedings and the Plan of Reorganization, please visit our website at www.pacificdrilling.com/Restructuring.

Forward-Looking Statements

Certain statements and information contained in this press release constitute “forward-looking statements” within the meaning of the safe harbor provisions of the Private Securities Litigation Reform Act of 1995, and are generally identifiable by their use of words such as “anticipate,” “believe,” “could,” “estimate,” “expect,” “forecast,” “intend,” “our ability to,” “may,” “plan,” “potential,” “predict,” “project,” “projected,” “should,” “will,” “would”, or other similar words which are not generally historical in nature. The forward-looking statements speak only as of the date hereof, and we undertake no obligation to publicly update or revise any forward-looking statements after the date they are made, whether as a result of new information, future events or otherwise.

Our forward-looking statements express our current expectations or forecasts of possible future results or events, including the potential outcome of the Chapter 11 proceedings; the future impact of the COVID-19 pandemic on our business, future financial and operational performance and cash balances; our future liquidity position and future efforts to improve our liquidity position; revenue efficiency levels; market outlook; forecasts of trends; future client contract opportunities; future contract dayrates; our business strategies and plans or objectives of management; estimated duration of client contracts; backlog; expected capital expenditures; projected costs and savings; expectations regarding the outcome of the ongoing bankruptcy proceedings of our two subsidiaries against whom the arbitration award related to the drillship known as the Pacific Zonda in favor of Samsung Heavy Industries Co. Ltd. (“SHI”) was rendered and the potential impact of the arbitration tribunal’s decision on our future operations, financial position, results of operations and liquidity.

Although we believe that the assumptions and expectations reflected in our forward-looking statements are reasonable and made in good faith, these statements are not guarantees, and actual future results may differ materially due to a variety of factors. These statements are subject to a number of risks and uncertainties and are based on a number of judgments and assumptions as of the date such statements are made about future events, many of which are beyond our control. Actual events and results may differ materially from those anticipated, estimated, projected or implied by us in such statements due to a variety of factors, including if one or more of these risks or uncertainties materialize, or if our underlying assumptions prove incorrect.

Important factors that could cause actual results to differ materially from our expectations include: the potential outcome of our Chapter 11 proceedings; evolving risks from the COVID-19 outbreak and resulting significant disruption in international economies, and international financial and oil markets, including a substantial decline in the price of oil during 2020, which if sustained would continue to have a material adverse effect on our financial condition, results of operations and cash flow; changes in actual and forecasted worldwide oil and gas supply and demand and prices, and the related impact on demand for our services; the offshore drilling market, including changes in capital expenditures by our clients; rig availability and supply of, and demand for, high-specification drillships and other drilling rigs competing with our fleet; our ability to enter into and negotiate favorable terms for new drilling contracts or extensions of existing drilling contracts; our ability to successfully negotiate and consummate definitive contracts and satisfy other customary conditions with respect to letters of intent and letters of award that the Company receives for our drillships; actual contract commencement dates; possible cancellation, renegotiation, termination or suspension of drilling contracts as a result of mechanical difficulties, performance, market changes or other reasons; costs related to stacking of rigs and costs to reactivate a stacked rig; downtime and other risks associated with offshore rig operations, including unscheduled repairs or maintenance, relocations, severe weather or hurricanes or accidents; our small fleet and reliance on a limited number of clients; the outcome of our subsidiaries’ bankruptcy proceedings and any actions that SHI or others may take in the bankruptcy or other proceedings against the Company and our subsidiaries; our ability to continue as a going concern; our ability to obtain Bankruptcy Court approval with respect to motions or other requests made to the Bankruptcy Court in the Chapter 11 proceedings; our ability to confirm and consummate the prearranged Plan; the effects of the Chapter 11 proceedings on our operations and agreements, including our relationships with employees, regulatory authorities, customers, suppliers, banks and other financing sources, insurance companies and other third parties; the length of time that the Company will operate under Chapter 11 protection and the continued availability of operating capital during the pendency of the Chapter 11 proceedings; risks associated with third-party motions in the Chapter 11 proceedings, which may interfere with our ability to confirm and consummate the prearranged Plan; increased advisory costs to execute the prearranged Plan; the potential adverse effects of the Chapter 11 proceedings on our liquidity, results of operations, or business prospects; increased administrative and legal costs related to the Chapter 11 proceedings and other litigation and the inherent risks involved in a bankruptcy process; the potential effects of the delisting of our common shares from trading on the New York Stock Exchange, including how long our common shares will trade on the over-the-counter market; the potential effects of the anticipated suspension by the Company of its reporting obligations to the Securities and Exchange Commission (“SEC”); and the other risk factors described in our 2019 Annual Report on Form 10-K filed with the SEC on March 12, 2020, as updated by our Quarterly Reports on Form 10-Q as filed with the SEC on May 8, August 7, and November 6, 2020 and subsequent filings with the SEC. These documents are available through our website at www.pacificdrilling.com or through the SEC’s website at www.sec.gov.


Contacts

Investor Contact:
James Harris
Pacific Drilling S.A.
+713 334 6662
This email address is being protected from spambots. You need JavaScript enabled to view it.

Media Contact:
Amy L. Roddy
Pacific Drilling S.A.
+713 334 6662
This email address is being protected from spambots. You need JavaScript enabled to view it.

DUBLIN--(BUSINESS WIRE)--The "Europe Fuel Additives Market - Growth, Trends, and Forecast (2020 - 2025)" report has been added to ResearchAndMarkets.com's offering.


The Europe fuel additives market is estimated to witness a significant growth, at an estimated CAGR of around 4%, over the forecast period. Major factors driving the market studied are the enactment of stringent environmental regulations.

  • Increasing demand and penetration of battery electric vehicles (BEVs) are projected to hinder the market growth in the coming years.
  • Accelerating demand for ultra-low-sulfur diesel (ULSD) is likely to create opportunities to the market in the future.
  • Germany accounted for the largest market share and is expected to continue domination during the forecast period.

Key Market Trends

Gasoline to Dominate the Market

  • Gasoline is the major application of fuel additives in terms of market share. Gasoline engine technologies and fuels are constantly evolving and providing new challenges. The growth in the consumption of gasoline additive largely reflects the requirements of engine design and developments in refinery operations. Also, the additive cost is less than 0.3% of the average retail gasoline price.
  • The increasing popularity of new age fuel delivery systems, like gasoline direct injection (GDI) system, is likely to boost the demand for fuel additives.
  • Port injection fuel delivery systems used to be the norm. However, new gasoline direct injection or GDI technology is becoming standard equipment on many new cars, especially in high-performance vehicles. In this innovative fuel delivery system, the injector is placed inside the combustion chamber yielding improved combustion to produce better performance, improved gas mileage, and fewer emissions. Deposits in GDI systems are extremely hard to remove and require more fuel additives.
  • The market penetration of gasoline direct injection (GDI) engines is growing rapidly, which is quite instrumental in propelling the market demand for gasoline fuel additives, in significant amount.
  • Hence, owing to the above-mentioned reasons, the gasoline-related applications of fuel additives are likely to account for the highest market share, during the forecast period.

Germany to Dominate the Market

  • Germany leads Europe's automotive market with 41 assembly and engine production plants that contribute to one third of the total automobile production in Europe.
  • Germany, being one of the leading manufacturing bases for the aircraft industry, is the home to manufacturers from different segments, such as equipment manufacturers, material and component suppliers, engine producers, and whole system integrators.
  • The German aerospace industry comprises more than 2,300 firms located all around the country, with northern Germany being the area with a higher concentration of firms.
  • The country hosts a large number of production bases for aircraft interior components, MRO (maintenance, repair, and overhaul), and lightweight construction and materials, largely in Bavaria, Bremen, Baden-Wurttemberg, and Mecklenburg-Vorpommern.
  • It has been estimated that over 30 to 35 thousand new aircraft will be operational by the next 20 years, in order to meet the rising aviation demand. Thus, with the increase in production of aircraft, the consumption of fuel additives will increase during the forecast period.
  • Due to all such factors, the market for fuel additives in the country is expected to have a steady growth during the forecast period.

Key Topics Covered:

1 INTRODUCTION

2 RESEARCH METHODOLOGY

3 EXECUTIVE SUMMARY

4 MARKET DYNAMICS

4.1 Drivers

4.1.1 Enactment of Stringent Environmental Regulations

4.1.2 Other Drivers

4.2 Restraints

4.2.1 Increasing Demand and Penetration of Battery Electric Vehicles (BEVs)

4.2.2 High Costs of R&D Activities

4.3 Industry Value-Chain Analysis

4.4 Porter's Five Forces Analysis

5 MARKET SEGMENTATION

5.1 Product Type

5.2 Application

5.3 Geography

6 COMPETITIVE LANDSCAPE

6.1 Mergers & Acquisitions, Joint Ventures, Collaborations, and Agreements

6.2 Market Share Analysis

6.3 Strategies Adopted by Leading Players

6.4 Company Profiles

6.4.1 Afton Chemical

6.4.2 Baker Hughes, a GE Company LLC

6.4.3 BASF SE

6.4.4 Chevron Corporation

6.4.5 Clariant

6.4.6 Croda International Plc

6.4.7 Eni SpA

6.4.8 Evonik Industries AG

6.4.9 Exxon Mobil Corporation

6.4.10 LANXESS

6.4.11 Royal Dutch Shell plc

6.4.12 The Lubrizol Corporation

6.4.13 Total

6.4.14 VeryOne SaS (EURENCO)

7 MARKET OPPORTUNITIES AND FUTURE TRENDS

7.1 Accelerating Demand for Ultra-low-sulfur Diesel (ULSD)

For more information about this report visit https://www.researchandmarkets.com/r/kgfqzu

About ResearchAndMarkets.com

ResearchAndMarkets.com is the world's leading source for international market research reports and market data. We provide you with the latest data on international and regional markets, key industries, the top companies, new products and the latest trends.


Contacts

ResearchAndMarkets.com
Laura Wood, Senior Press Manager
This email address is being protected from spambots. You need JavaScript enabled to view it.
For E.S.T Office Hours Call 1-917-300-0470
For U.S./CAN Toll Free Call 1-800-526-8630
For GMT Office Hours Call +353-1-416-8900

Climate change analytics and advice helps prepare institutional portfolios to adapt to a net zero economy

SYDNEY & LONDON & NEW YORK--(BUSINESS WIRE)--Mercer, a global leader in redefining the world of work, reshaping retirement and investment outcomes, and unlocking real health and well-being, today announced the launch of climate transition analytics and advice for institutional investors who want to transition to a 1.5°C scenario of global warming as outlined in the Paris Agreement. Climate change science has shown that to halt climate change, carbon emissions have to stop completely. ‘Net zero’ means that any emissions are balanced by absorbing an equivalent amount from the atmosphere.

The solution, called Analytics for Climate Transition (“ACT”) will help investors construct climate resilient portfolios on a multi-year timeframe, as 1.5°C requires a 45% emissions reduction by 2030. ACT is now being offered to Mercer’s investment consulting clients worldwide and will be leveraged to support climate transition strategies across its $304.5 billion USD global assets under management1 on behalf of its Investment Solutions clients.

“Many investors are not yet equipped to invest in a decarbonizing economy, and some don’t know where to start. Our analytics and advice will help investors transition their portfolios to take on the challenges of managing climate risk, in their endeavor to meet return objectives while staying on target for a net-zero outcome,” said Helga Birgden, Global Business Leader, Responsible Investment, Mercer.

ACT was developed because institutional investors are seeking ways to assess the companies they are invested in with respect to their commitment and ability to, transition to a net zero economy by 2050, with an important milestone of 45% emissions reduction by 2030. Through ACT, Mercer can help investors set portfolio investment baselines; assess portfolio opportunities; establish targets and produce implementation plans that can be integrated with strategy and portfolio construction decisions.

“Mercer was a pioneer in developing climate scenario analyses to help investors set strategies for diversified portfolios. The climate transition advice and analytics is a natural next step for us and supports our clients to address climate change. Importantly, when working with clients to position their portfolios for transition we leverage our global investment research, our capabilities and our knowledge,” said Jillian Reid, Senior Responsible Investment Specialist, Mercer.

Mercer’s framework and analytics draw on multiple data providers and metrics to assess portfolios across a spectrum of carbon risk, with portfolios ranked from low transition capacity (gray investments) to investments that are low carbon risk/zero carbon already, or are providing climate solutions (green investments). The majority of companies in investor portfolios fall somewhere in between the two sides.

Mercer’s climate change research and guidance is an Mercer-wide collaboration and spans Research, Advice and Investment Solutions. Mercer’s Responsible Investing Pathway maps out the full scope of the responsible investment advisory services Mercer offers, structured around integrating ESG and climate change into the core stages of investment: beliefs, policy and process, and portfolio implementation.

About Mercer

Mercer believes in building brighter futures by redefining the world of work, reshaping retirement and investment outcomes, and unlocking real health and well-being. Mercer’s more than 25,000 employees are based in 44 countries and the firm operates in over 130 countries. Mercer is a business of Marsh & McLennan (NYSE: MMC), the world’s leading professional services firm in the areas of risk, strategy and people, with 76,000 colleagues and annual revenue of $17 billion. Through its market-leading businesses including Marsh, Guy Carpenter and Oliver Wyman, Marsh & McLennan helps clients navigate an increasingly dynamic and complex environment. For more information, visit www.mercer.com. Follow Mercer on Twitter @Mercer.

_____________________

1 As of 30 November, 2019: Please see Important Notices for information about Assets under Management.

Important Notices

References to Mercer shall be construed to include Mercer LLC and/or its associated companies.

© 2020 Mercer LLC. All rights reserved.

This contains confidential and proprietary information of Mercer and is intended for the exclusive use of the parties to whom it was provided by Mercer. Its content may not be modified, sold or otherwise provided, in whole or in part, to any other person or en.tity without Mercer's prior written permission.

Mercer does not provide tax or legal advice. You should contact your tax advisor, accountant and/or attorney before making any decisions with tax or legal implications.

This does not constitute an offer to purchase or sell any securities.

The findings, ratings and/or opinions expressed herein are the intellectual property of Mercer and are subject to change without notice. They are not intended to convey any guarantees as to the future performance of the investment products, asset classes or capital markets discussed.

For Mercer’s conflict of interest disclosures, contact your Mercer representative or see http://www.mercer.com/conflictsofinterest.

This does not contain investment advice relating to your particular circumstances. No investment decision should be made based on this information without first obtaining appropriate professional advice and considering your circumstances. Mercer provides recommendations based on the particular client's circumstances, investment objectives and needs. As such, investment results will vary and actual results may differ materially.

The assets under management data (the AUM Data) reported here include aggregated assets for which Mercer Investments LLC (Mercer Investments) and their global affiliates provide discretionary investment management services as of the dates indicated. The AUM Data reported here may differ from regulatory assets under management reported in the Form ADV for Mercer Investments. For regulatory assets under management, please see the Form ADV for Mercer Investments which is available upon request by contacting Compliance Department, Mercer Investments, 99 High Street, Boston, MA 02110.

Information contained herein may have been obtained from a range of third party sources. While the information is believed to be reliable, Mercer has not sought to verify it independently. As such, Mercer makes no representations or warranties as to the accuracy of the information presented and takes no responsibility or liability (including for indirect, consequential, or incidental damages) for any error, omission or inaccuracy in the data supplied by any third party.

Not all services mentioned are available in all jurisdictions. Please contact your Mercer representative for more information.

Investment management and advisory services for U.S. clients are provided by Mercer Investments LLC (Mercer Investments). Mercer Investments LLC is registered to do business as “Mercer Investment Advisers LLC” in the following states: Arizona, California, Florida, Illinois, Kentucky, New Jersey, North Carolina, Oklahoma, Pennsylvania, Texas, and West Virginia; as “Mercer Investments LLC (Delaware)” in Georgia; as “Mercer Investments LLC of Delaware” in Louisiana; and “Mercer Investments LLC, a limited liability company of Delaware” in Oregon. Mercer Investments LLC is a federally registered investment adviser under the Investment Advisers Act of 1940, as amended. Registration as an investment adviser does not imply a certain level of skill or training. The oral and written communications of an adviser provide you with information about which you determine to hire or retain an adviser. Mercer Investments’ Form ADV Part 2A & 2B can be obtained by written request directed to: Compliance Department, Mercer Investments, 99 High Street, Boston, MA 02110.

Certain regulated services in Europe are provided by Mercer Global Investments Europe Limited and Mercer Limited.

Mercer Global Investments Europe Limited and Mercer Limited are regulated by the Central Bank of Ireland under the European Union (Markets in Financial Instruments) Regulation 2017, as an investment firm. Registered officer: Charlotte House, Charlemont Street, Dublin 2, Ireland. Registered in Ireland No. 416688. Directors: Sylvia Cronin, Michael Dempsey, Tom Geraghty, Abhishek Krishan, Deborah Mintern, Bruce Rigby (British) and Vincent Sheridan. Mercer Limited is authorized and regulated by the Financial Conduct Authority. Registered in England and Wales No. 984275. Registered Office: 1 Tower Place West, Tower Place, London EC3R 5BU.

Investment management services for Canadian investors are provided by Mercer Global Investments Canada Limited. Investment consulting services for Canadian investors are provided by Mercer (Canada) Limited.


Contacts

Alayna Francis
+44 207 178 3378
This email address is being protected from spambots. You need JavaScript enabled to view it.

Four inverter models are certified as PV Rapid Shutdown Systems with Tigo’s rapid shutdown devices


CAMPBELL, Calif.--(BUSINESS WIRE)--#rapidshutdown--Yaskawa Solectria Solar has joined the Tigo Enhanced initiative, aimed at providing customers with simple and reliable rapid shutdown solutions that meet all safety and code requirements. All Solectria inverters that are Tigo Enhanced are plug and play out of the box with Tigo’s latest generation rapid shutdown devices.

“We are excited to join the Tigo Enhanced program to generate more awareness about our solutions and make fulfilling safety and certification requirements as easy as possible for our customers,” said Mark Goodreau, General Manager of Yaskawa Solectria Solar.

Solectria’s Tigo Enhanced inverters have integrated Tigo’s RSS transmitter – which communicates with Tigo’s rapid shutdown devices – and completed UL PV Rapid Shutdown System (PVRSS) certification. The following inverters are part of the program:

  • Solectria PVI 60TL (3 phase, 60kW, 480Vac)
  • Solectria PVI 50TL (3 phase, 50kW, 480Vac)
  • Solectria PVI 25TL-208 (3 phase, 25kW, 208Vac)
  • Solectria PVI 25TL-480-R (3 phase, 25kW, 480Vac)

Customers can now look for the Tigo Enhanced logo on one of Solectria’s inverters and know that they are getting a product that seamlessly works with Tigo’s rapid shutdown devices.

“We have worked with Yaskawa Solectria Solar for a long time and are honored to have them as a partner in the Tigo Enhanced program,” said Dru Sutton, VP of Sales for North America at Tigo Energy. “Ultimately, this is about providing assurance to customers that when they choose a Solectria inverter that is Tigo Enhanced, they know they’re getting a reliable, proven, certified rapid shutdown solution.”

Yaskawa Solectria Solar and Tigo received UL PVRSS certification after testing the inverter and rapid shutdown devices for compatibility and safety. The certification fulfills a necessary safety requirement for PV Rapid Shutdown in the National Electrical Code. Rapid shutdown devices are now required with rooftop PV installations across the vast majority of the United States.

The companies are hosting a live webinar on Thursday, November 12 at 10am PT (1pm ET) to highlight their combined rapid shutdown solutions for commercial PV customers. Interested parties can register here.

The Solectria inverters and Tigo rapid shutdown devices can be purchased at leading distributors throughout the United States. For more information, contact: https://www.solectria.com/company/contact/ or This email address is being protected from spambots. You need JavaScript enabled to view it.
About Yaskawa Solectria Solar

Yaskawa Solectria Solar, a wholly-owned subsidiary of Yaskawa America, Inc., is the largest commercial inverter manufacturer in the U.S. Solectria’s products include 14kW to 750kW inverters, string combiners and web-based monitoring for all size solar systems. Solectria is backed by over 100 years of power electronics and inverter experience. All of Solectria’s three-phase central inverters are made in the USA. PV System owners, developers and EPCs rely on the high performance, reliability and bankability of Yaskawa Solectria Solar. To learn more please visit www.solectria.com.

About Tigo

Tigo is the worldwide leader in flexible module level power electronics (MLPE) with innovative solutions that significantly enhance safety, increase energy production, and decrease operating costs of photovoltaic (PV) systems. Tigo’s TS4 platform maximizes the benefit of PV systems and provides customers with the most scalable, versatile, and reliable MLPE solution available. Tigo was founded in Silicon Valley in 2007 to accelerate the adoption of solar energy worldwide. Tigo systems operate on 7 continents and produce gigawatt hours of reliable, clean, affordable and safe solar energy daily. Tigo's global team is dedicated to making the best MLPE on earth so more people can enjoy the benefits of solar. Visit us at www.tigoenergy.com.


Contacts

Media Contact for Tigo
John Lerch
408.402.0802 x430
This email address is being protected from spambots. You need JavaScript enabled to view it.

DUBLIN--(BUSINESS WIRE)--The "Global Surface Warships - Market and Technology Forecast to 2028" report has been added to ResearchAndMarkets.com's offering.


The Global Surface Combatants Market is expected to reach a value of USD 37 Billion by the year 2028. The market accounted for a value of roughly USD 32 Billion in the year 2019.

The growth in the number of fleet replacement programs to modernize existing naval vessels has governed the expansion of this market.

Countries across the globe are focused on developing programs to increase their sea-based tactical advantage. Countries like the United States and China are some of the major examples of the same.

This report studies the intensifying growth dynamics for the surface warships sector. The industrial support units and their impact on increasing employment have also been studied in this report. On a global scale, the number of indigenous programs has been increasing. The domestic shipbuilding programs add to the GDP of the respective countries through increased employment generation.

These industrial units also boost the direct, induced as well as indirect spending of the people situated in the supply chain as well as the value chain for a particular vertical. The number of end-users and consumers for the Surface Warships market is reliant on the amount of procurement. Therefore, the economies of scale is a highly influential factor across this pipeline industry. Moreover, as the GDP of a nation increases, so does the defense budget allocation.

On a regional basis, APAC is expected to emerge as the largest market by the year 2028. In the year 2019, the APAC market had a revenue of USD 11 Billion approximately. The second and third largest growth segments on a regional basis include North America and Europe. The overall growth dynamics associated with the surface warships market is estimated to be 2% during the forecast period.

Key Topics Covered:

1. Introduction

1.1. Objective

1.2. Market Introduction

1.3. Market Scope

1.4. Methodology

1.5. Scenario-based Forecast

1.6. Who will benefit from this report?

2. Executive Summary

2.1. Global Surface Ships Market Trends and Insights

2.2. Top Five Major Findings

2.3. Major Conclusion

2.4. Important Tables and Graphs

3. Current Market Overview of the Global Surface Warships Market

3.1. Introduction

3.2. Evolution of Naval Warship Design

3.3. Global Naval Fleet

3.3.1. Destroyer

3.3.2. Corvette

3.3.3. Frigate

3.3.4. Aircraft Carrier

3.3.5. Cruisers

3.3.6. Support Vessels

4. Current Market Trends of the Global Surface Warships Market

4.1. US Fleet Expansion Plans

4.1.1. Fleet expansion plan

4.1.2. US Navy's Estimate for the cost of New Ship Construction 2020-2029

4.1.3. Annual Ship Purchase Plans and Fleet design

4.1.4. Fleet breakdown by type

4.2. Expansion of Chinese Naval Fleet

4.2.1. Chinese shipbuilding market

4.3. Growth of Unmanned Naval Systems

4.3.1. Opportunities within the USVs sector

4.3.2. USV comparison to other platforms

4.3.3. USV Manufacturers

4.3.4. Types of Naval Missions

5. Market Technologies in Global Surface Warship Market

5.1. Unmanned Surface Vehicle

5.2. Stealth Technology

5.3. Active Protection System

5.4. Composites

5.5. Fuel Sources

5.6. 3D Printing

5.7. Directed Energy Weapons

5.8. Unmanned Mine Detection

5.9. Ballast Free Ship Designs

5.10. Anti-Piracy Robots

6. Market Dynamics

6.1. Drivers

6.1.1. Increasing Maritime Threats

6.1.2. Indigenous Programs in Surface Warships

6.1.3. Nuclear Powered Ships

6.1.4. Fleet Replacement

6.2. Restraints

6.2.1. Coastline

6.2.2. Cost of Ship Building

6.3. Challenges

6.3.1. Defense Budget Allocation

6.3.2. Unmanned Program

6.4. PEST Analysis

6.5. Porter's Five Forces Analysis

7. Country Analysis

8. Global Surface Warships Market to 2028 by Region

9. Global Surface Warships Market to 2028 by Type

9.1. Market Introduction

9.2. Total Global Market by Type (By Component) to 2028

9.2.1. Aircraft Carrier

9.2.2. Destroyers

9.2.3. Frigates

9.2.4. Corvettes

9.2.5. Miscellaneous

9.3. Total Global Market by Type (By End-User) to 2028

9.3.1. Aircraft Carrier

9.3.2. Destroyers

9.3.3. Frigates

9.3.4. Corvettes

9.3.5. Miscellaneous

10. Global Surface Warships Market to 2028 by Component

10.1. Market Introduction

10.2. Total Global Market by Component (By Fitment) to 2028

10.2.1. Hull & Equipment

10.2.2. Propulsion / Power Transmission

10.2.3. Electronics

10.2.4. Weapon Systems

10.2.5. Other Systems

11. Opportunity Analysis

11.1. By Region

11.2. By Type

11.3. By Component

12. Scenario Analysis

13. Corona Impact on Global Surface Warships Market

14. Company Profiles

  • BAE Systems
  • Fincantieri S.p.A
  • General Dynamics
  • Huntington Ingalls Industries
  • Hyundai Heavy Industries
  • Lockheed Martin
  • Naval Group
  • Navantia SA
  • Thales Group
  • The Damen Group

For more information about this report visit https://www.researchandmarkets.com/r/hcxv6o


Contacts

ResearchAndMarkets.com
Laura Wood, Senior Press Manager
This email address is being protected from spambots. You need JavaScript enabled to view it.
For E.S.T Office Hours Call 1-917-300-0470
For U.S./CAN Toll Free Call 1-800-526-8630
For GMT Office Hours Call +353-1-416-8900

AMSTERDAM & LOS ANGELES--(BUSINESS WIRE)--Netherlands-based International Airport operator, Royal Schiphol Group (via its subsidiary Schiphol International B.V.), and U.S. based, global alternative investment manager, Oaktree Capital Management L.P.’s Transportation Infrastructure Investing Group (“Oaktree”), announced today that they have entered into an alliance to pursue airport investment and management opportunities within the North American market, focusing on the U.S. The alliance will concentrate on building public-private partnerships, driving infrastructure investment, implementing operational and sustainability best practices, and improving the overall level of customer experience at U.S. Airports.

The alliance plans to work alongside innovative and forward-thinking airports with an interest in accessing the expertise of Schiphol’s world-class aviation franchise and Oaktree’s public-private airport experience and value-added, long-dated, stable infrastructure capital. “Our partnership with Schiphol will increase our ability to access the FAA’s Airport Investment Partnership Program (AIPP) and to invest alongside existing airport management teams as we help U.S. airports modernize their infrastructure” said Emmett McCann, Managing Director and Co-Portfolio Manager of Oaktree’s Transportation Infrastructure Investing strategy.

We are thrilled to work alongside the Oaktree team to combine our joint expertise in the U.S. market. We believe that the AIPP creates interesting opportunities to expand our presence in the U.S., including the ability to partner with existing airport operators. We believe that these types of partnerships give airport managers and local municipalities the ability to expand their depth and expertise of airport management, create new and broader access to capital, while also allowing operators to continue to hold an important role in the direction and management of their airport,” stated Kjell Kloosterziel, Director of Schiphol International. “This type of transaction is aimed at benefiting local communities and other local stakeholders, while also giving the airport sponsor the benefits of the AIPP program – creating true long-term partnerships that align with our corporate culture and strategy seeking to create long-term value for all stakeholders.”

About Royal Schiphol Group

Royal Schiphol Group is an enterprise that operates airports in the Netherlands, conducts international activities and participates in airports abroad. Operating Amsterdam Airport Schiphol, in 2019 the third airport in Europe in passenger volumes and number two for direct connectivity, is the Group's largest activity.

Royal Schiphol Group's mission is 'Connecting your world'. Schiphol Group’s domestic and international activities strengthen its role as a world-leading airport operator. Schiphol Group pursues partnership opportunities that are financially attractive and offer scope for reciprocal knowledge sharing, innovation and inspiration and offer opportunities to test new technologies and concepts. More information about Schiphol International can be found at our website: https://www.schiphol.nl/en/schiphol-group/page/schiphol-international/.

About Oaktree

Oaktree is a leader among global investment managers specializing in alternative investments, with $140 billion in assets under management as of September 30, 2020. Oaktree’s Transportation Infrastructure Investing Group seeks to make investments in North American transportation assets, businesses and infrastructure, including airports, seaports and railroads, where it can pursue value-creation strategies geared towards sustainable growth. Oaktree has over 1,000 employees and offices in 19 cities worldwide. For additional information, please visit Oaktree’s website at http://www.oaktreecapital.com/.


Contacts

Suzanne Byowitz
Sard Verbinnen and Co
Email: This email address is being protected from spambots. You need JavaScript enabled to view it.
DUBLIN--(BUSINESS WIRE)--The "Oil Refining Industry in Qatar 2020" report has been added to ResearchAndMarkets.com's offering.


"Oil Refining Industry in Qatar" is a complete source of information on Qatar crude oil refining industry.

It provides refinery level information relating to existing and planned (new build) refineries such as insights and forecasts of refinery capacities, refined petroleum products production and consumption, refinery complexity factor and comparison against peer group countries in the respective region.

The report also covers complete details of major players operating in the refining sector in Qatar and in depth analysis of the latest industry news and deals.

Report Scope

  • Outlook of Country Oil Refining Industry and refined petroleum products beyond 2020
  • Forecasts of refined products production and consumption along with major refining companies and operators.
  • Historic and Forecasted Refining capacity and secondary units capacities beyond 2020
  • Key Opportunities and Restraints in country Refinery market
  • Benchmark with five peer group countries on Nelson Complexity Factor.
  • Market structure of Country Refining Industry, companies, capacities and market share.
  • Information on planned refineries such as planned capacity, equity structure, Operator Company, expected commissioning date and project cost.
  • Refined petroleum products production and demand beyond 2020.
  • Refinery level information such as refinery name, commissioned year, primary and secondary units installed capacities along with future capacity expansions, refinery complexity factor, ownership and operator details.
  • Company profiles of major refining companies including SWOT Analysis.
  • Latest mergers, acquisitions, contract announcements and all related industry news and deals analysis.

Key Topics Covered:

1 Table of Contents

1.1 List of Figures

1.2 List of Tables

2 Introduction to Qatar Refining Markets

2.1 What is This Report About?

2.2 Market Definition

3 Refining Industry in Qatar

3.1 Qatar Refining Market Snapshot, 2019

3.2 Role of Qatar in Global and Regional Refining Markets

3.2.1 Contribution to Middle East and Africa and Global Refining Capacity, 2019

3.2.2 Qatar Average Nelson Complexity Factor (NCF) vs. Middle East and Africa and Global, 2019

4 Qatar Refining Market- Drivers and Restraints

4.1 Qatar Refining Industry: Trends and Issues

4.1.1 Qatar Refining Industry: Major Trends

4.2 Major Restrains of Investing in Qatar Refining Sector

5 Qatar Oil Products Demand and Supply Forecast to 2025

5.1 Qatar Refined Products Demand Forecast to 2025

5.1.1 Qatar Gasoline Demand Forecast to 2025

5.1.2 Qatar Diesel Oil Demand Forecast to 2025

5.1.3 Qatar Kerosene Demand Forecast to 2025

5.1.4 Qatar LPG Demand Forecast to 2025

5.2 Qatar Refined Products Production Forecast to 2025

5.2.1 Qatar Gasoline Production Forecast to 2025

5.2.2 Qatar Diesel Oil Production Forecast to 2025

5.2.3 Qatar Kerosene Production Forecast to 2025

5.2.4 Qatar LPG Production Forecast to 2025

6 Qatar Refinery Capacities Forecast to 2025

6.1 Location, Operator, Ownership, Startup Details of Operational Refineries in Qatar

6.1.1 Refinery Location, Operator, Ownership, Startup Details

6.2 Qatar Total Refining Capacity Historic and Forecast, 2012-2025

6.3 Qatar Refining Capacity Historic and Forecast, 2012-2025

6.4 Qatar Refinery wise Secondary Conversion Unit-1 Capacity, 2012-2025

6.5 Qatar Refinery wise Secondary Conversion Unit-2 Capacity, 2012-2025

6.6 Qatar Refinery wise Secondary Conversion Unit-3 Capacity, 2012-2025

7 Qatar Refining Industry- Future Developments and Investment Opportunities

7.1 Capital Investment Details of All Upcoming Refineries

7.2 Location, Operator, Ownership, Start Up Details of Planned Refineries in Qatar

7.2.1 Refinery Location, Operator, Ownership, Startup Details

7.3 Refinery Capacities of All Upcoming Refineries

8 Key Strategies Qatar Refining Companies

8.1 Qatar Company wise Refining Capacity Forecast, 2012-2025

9 Company Profiles

10 Qatar Refining Industry Latest Tenders and Contracts

11 Qatar Refining Industry Updates

12 Qatar Refining Industry Deals

For more information about this report visit https://www.researchandmarkets.com/r/qx06ju


Contacts

ResearchAndMarkets.com
Laura Wood, Senior Press Manager
This email address is being protected from spambots. You need JavaScript enabled to view it.
For E.S.T Office Hours Call 1-917-300-0470
For U.S./CAN Toll Free Call 1-800-526-8630
For GMT Office Hours Call +353-1-416-8900

Accelerating the Path to Meeting New York’s Nation-Leading Energy Storage Target

ALBANY, N.Y.--(BUSINESS WIRE)--#NewYork--Key Capture Energy (KCE) today announced that its bulk energy storage project, KCE NY 1, is the first project of its kind in the state to pass a Quality Assurance Inspection, a requirement of the New York State Energy Research and Development Authority’s (NYSERDA) Bulk Energy Storage Incentive Program.


Continuing a history of “firsts” in New York State, KCE NY 1 has demonstrated that the system is in compliance with the standards in NYSERDA’s Battery Energy Storage Guidebook as well as with all applicable laws, regulations, and rules of the authority having jurisdiction. The 20-megawatt (MW) project, currently in operation in the Capital region, is the largest lithium-ion battery installation in the northeastern United States and was the first to receive an incentive award through NYSERDA since Governor Andrew M. Cuomo announced the state’s Market Acceleration Bridge Incentive Program in April 2019.

In addition to KCE NY 1, three of KCE’s other New York State-based projects have received an award from NYSERDA to date: KCE NY 2 (200 MW), KCE NY 6 (20 MW), and KCE NY 11 (20 MW), all of which are in various stages of development. All four projects will serve New York State’s electrical system while simultaneously advancing the states’ climate change initiatives by reducing greenhouse gas emissions.

Dan Fitzgerald, Co-founder and COO of Key Capture Energy said, “New York is setting the bar for state-led climate initiatives, and we are pleased to be a part of the state’s commitment to a clean energy economy. Not only do we own and operate New York’s largest energy storage project, we are currently constructing a project for Orange & Rockland and have 700 MW of projects under development in New York, all of which further the state’s commitment to a carbon-free electric system by 2040. We look forward to continuing to work collaboratively with NYSERDA to better understand the best way to implement energy storage in New York State in a way that is the most beneficial to residents.”

About Key Capture Energy

As more large-scale renewable energy projects come online and intermittent resources are added to the energy mix, it is becoming increasingly important to keep the electrical grid stable. Headquartered in Albany, New York, Key Capture Energy is meeting this need by identifying, developing, constructing and operating energy storage solutions to foster greater deployment of renewable energy, create a more stable electric grid, and provide value to all ratepayers.

Key Capture Energy operates the largest battery storage project in New York State. Additionally, the company is the largest owner of batteries in Texas, with 50 MW in operating projects, 204 MW in construction and over 1,500 MW of battery storage projects in its development pipeline, ranging from 5 to 200 MW. In the last year, Key Capture Energy has more than tripled the size of its team to advance the company’s growing portfolio of utility-scale battery storage projects.

Learn more at keycaptureenergy.com.


Contacts

Erin Szalkowski
Innovant Public Relations
This email address is being protected from spambots. You need JavaScript enabled to view it.

713.412.6436

DUBLIN--(BUSINESS WIRE)--The "Oil Refining Industry in Australia 2020" report has been added to ResearchAndMarkets.com's offering.


The downstream energy sector report, "Oil Refining Industry in Australia" is a complete source of information on Australia crude oil refining industry.

It provides refinery level information relating to existing and planned (new build) refineries such as insights and forecasts of refinery capacities, refined petroleum products production and consumption, refinery complexity factor and comparison against peer group countries in the respective region. The report also covers complete details of major players operating in the refining sector in Australia and in depth analysis of the latest industry news and deals.

Report Scope

  • Outlook of Country Oil Refining Industry and refined petroleum products beyond 2020.
  • Forecasts of refined products production and consumption along with major refining companies and operators.
  • Historic and Forecasted Refining capacity and secondary units capacities beyond 2020.
  • Key Opportunities and Restraints in country Refinery market.
  • Benchmark with five peer group countries on Nelson Complexity Factor.
  • Market structure of Country Refining Industry, companies, capacities and market share.
  • Information on planned refineries such as planned capacity, equity structure, Operator Company, expected commissioning date and project cost.
  • Refined petroleum products production and demand beyond 2020.
  • Refinery level information such as refinery name, commissioned year, primary and secondary units installed capacities along with future capacity expansions, refinery complexity factor, ownership and operator details.
  • Company profiles of major refining companies including SWOT Analysis.
  • Latest mergers, acquisitions, contract announcements and all related industry news and deals analysis.

Key Topics Covered:

1 Table of Contents

1.1 List of Figures

1.2 List of Tables

2 Introduction to Australia Refining Markets

2.1 What is This Report About?

2.2 Market Definition

3 Refining Industry in Australia

3.1 Australia Refining Market Snapshot, 2019

3.2 Role of Australia in Global and Regional Refining Markets

3.2.1 Contribution to Asia Pacific and Global Refining Capacity, 2019

3.2.2 Australia Average Nelson Complexity Factor (NCF) vs. Asia Pacific and Global, 2019

4 Australia Refining Market- Drivers and Restraints

4.1 Australia Refining Industry: Trends and Issues

4.1.1 Australia Refining Industry: Major Trends

4.2 Major Restrains of Investing in Australia Refining Sector

5 Australia Oil Products Demand and Supply Forecast to 2025

5.1 Australia Refined Products Demand Forecast to 2025

5.1.1 Australia Gasoline Demand Forecast to 2025

5.1.2 Australia Diesel Oil Demand Forecast to 2025

5.1.3 Australia Kerosene Demand Forecast to 2025

5.1.4 Australia LPG Demand Forecast to 2025

5.2 Australia Refined Products Production Forecast to 2025

5.2.1 Australia Gasoline Production Forecast to 2025

5.2.2 Australia Diesel Oil Production Forecast to 2025

5.2.3 Australia Kerosene Production Forecast to 2025

5.2.4 Australia LPG Production Forecast to 2025

6 Australia Refinery Capacities Forecast to 2025

6.1 Location, Operator, Ownership, Startup Details of Operational Refineries in Australia

6.1.1 Refinery Location, Operator, Ownership, Startup Details

6.2 Australia Total Refining Capacity Historic and Forecast, 2012-2025

6.3 Australia Refining Capacity Historic and Forecast, 2012-2025

6.4 Australia Refinery wise Secondary Conversion Unit-1 Capacity, 2012-2025

6.5 Australia Refinery wise Secondary Conversion Unit-2 Capacity, 2012-2025

6.6 Australia Refinery wise Secondary Conversion Unit-3 Capacity, 2012-2025

7 Australia Refining Industry- Future Developments and Investment Opportunities

7.1 Capital Investment Details of All Upcoming Refineries

7.2 Location, Operator, Ownership, Start Up Details of Planned Refineries in Australia

7.2.1 Refinery Location, Operator, Ownership, Startup Details

7.3 Refinery Capacities of All Upcoming Refineries

8 Key Strategies Australia Refining Companies

8.1 Australia Company wise Refining Capacity Forecast, 2012-2025

9 BP PLC Company Profile

9.1 BP PLC Key Information

9.2 BP PLC Company Overview

9.3 BP PLC Business Description

9.4 BP PLC SWOT Analysis

9.4.1 Overview

9.4.2 Strengths

9.4.3 Weaknesses

9.4.4 Opportunities

9.4.5 Threats

9.5 BP PLC Financial Ratios - Capital Market Ratios

9.6 BP PLC Financial Ratios - Annual Ratios

9.7 BP PLC Financial Ratios - Interim Ratios

10 Australia Refining Industry Latest Tenders and Contracts

11 Australia Refining Industry Updates

12 Australia Refining Industry Deals

Companies Mentioned

  • British Petroleum Limited
  • Chevron

For more information about this report visit https://www.researchandmarkets.com/r/sickg1


Contacts

ResearchAndMarkets.com
Laura Wood, Senior Press Manager
This email address is being protected from spambots. You need JavaScript enabled to view it.
For E.S.T Office Hours Call 1-917-300-0470
For U.S./CAN Toll Free Call 1-800-526-8630
For GMT Office Hours Call +353-1-416-8900

SCOTTSDALE, Ariz.--(BUSINESS WIRE)--Arevon Energy Management (AEM) is pleased to announce that Tiago Sabino Dias will be leading the organization as President and CEO. AEM is a newly formed organization focused on innovation of power products through the integration of renewable energy, storage solutions, distributed generation, and power marketing services. AEM has an exclusive partnership with Capital Dynamics’ Clean Energy and Infrastructure (CEI) platform supporting the origination of renewable based structured energy contracts in the US.


Tiago has been instrumental in launching the AEM concept off the ground this year. He also played an integral role in the investment of over 1.5 GW of solar projects and 1,000 MWhs of battery storage projects in the US by the CEI platform.

“AEM is a key partner to CEI, supporting the origination and design of complex renewable energy products. The AEM team has already proven their capabilities, and I’m confident on the leadership of Tiago,” said Benoit Allehaut, Managing Director with Capital Dynamics.

Tiago brings more than a decade of experience in multiple renewable technologies and markets, both domestic and abroad. Most recently, he has been leading CEI’s efforts in the Midwest in collaboration with Tenaska Power.

Tiago received a Bachelor of Science in Industrial and Civil Engineering at Universidade Federal de Santa Catarina. He started his professional career as an engineer in hydropower project design. Tiago then joined ContourGlobal where he was a member of the Development and Sustainability committees and later named Vice President, Renewables. Tiago joined Capital Dynamics in 2018 as Vice President before being promoted in 2019 to Executive Vice President, Development.

AEM is thrilled to see the direction the renewable market is going and believe that this team is well positioned to lead the charge.

About Arevon Energy Management

Arevon Energy Management is an independent company with an exclusive partnership with the Capital Dynamics’ Clean Energy Infrastructure platform. Our team of experts work directly with utilities, municipalities, cooperatives, and large corporations to jointly develop clean energy strategies that exceed their economic and sustainability objectives. We are a one-stop shop for holistic solutions you can count on for the coming decades.


Contacts

Mercom Communications
Wendy Prabhu
1-512-215-4452
This email address is being protected from spambots. You need JavaScript enabled to view it.

DUBLIN--(BUSINESS WIRE)--The "India Marine Engines Market, By Fuel Type (Diesel, Petrol, Gas), By Power (5 - 75 HP, 76 - 350 HP, 351 - 750 HP, and Above 751 HP), By End Use (Auxiliary & Propulsion), By Region, Competition, Forecast & Opportunities, 2026" report has been added to ResearchAndMarkets.com's offering.


The Indian Marine Engines Market size stood at more than 13 thousand units in volume terms in 2019 and is forecast to continue growing over the next five years on account of increasing production and repair work of ships as well as growing export with foreign countries.

Moreover, presence of reputed marine engine manufacturers and merchant shipping companies in India is also fueling the demand for marine engines in the country.

The Indian Marine Engines Market can be segmented based on fuel type, power, end-use and region. Based on end-use, the Indian Marine Engines Market can be segmented into auxiliary and propulsion engines. Among these, in 2019, propulsion type acquired the largest market share in volume terms on account of increasing sales of ships, growing demand from crude oil industry and rising international seaborne trade.

Moreover, increasing seaborne trade activities and governments initiatives towards revival of inland water transportation system, etc., are expected to fuel the market for marine engines in India in the coming years. Based on fuel type, the market can be segmented into diesel, petrol and gas. Out of these, diesel engines accounted for the largest market share in volume terms in 2019 on account of higher efficiency in terms of fuel economy and lesser cost than petrol engines.

In terms of regional analysis, the market has been segmented into North, East, West and South region. Among these, West region accounted for the highest share in the Indian Marine Engines Market due to existence of a large number of active operational seaports in the country. However, due to the current economic slowdown and lockdown in entire country due to the spread of Coronavirus, Indian marine machinery and equipment industry is experiencing a degrowth at present, which has also directly affected India marine engines market.

Major players operating in the Indian Marine Engines Market include Yanmar Holdings Co., Ltd., John Deere India Private Limited, Mahindra & Mahindra Ltd, Simpson & Co. Ltd. and others which include Wartsila India Private Limited, Cummins India Ltd, Mitsubishi Heavy Industries, Hyundai Heavy Industries, etc.

Years considered for this report:

  • Historical Years: 2015-2019
  • Base Year: 2020
  • Estimated Year: 2021
  • Forecast Period: 2022-2025

Key Topics Covered:

1. Product Overview

2. Research Methodology

3. Impact of COVID-19 on India Marine Engines Market

4. Executive Summary

5. Voice of Customer

5.1. Brand Awareness

5.2. Brand Recall

5.3. Overall Brand Satisfaction

5.3.1. Product Quality

5.3.2. Pricing

5.3.3. Product Availability

5.3.4. After-Sales Support

5.4. Challenges/Unmet Needs

6. India Marine Engines Market Outlook

6.1. Market Size & Forecast

6.1.1. By Value

6.1.2. By Volume

6.2. Market Share & Forecast (Volume)

6.2.1. By Fuel Type (Diesel, Petrol, Gas)

6.2.2. By Power (5 - 75 HP, 76 - 350 HP, 351 - 750 HP, and Above 751 HP)

6.2.3. By End Use (Propulsion vs Auxiliary)

6.2.4. By Region (North, East, West, South)

6.2.5. By Company (2019)

6.3. Product Market Map

7. India Propulsion Marine Engines Market Outlook (Volume)

8. India Auxiliary Marine Engines Market Outlook (Volume)

9. Market Dynamics

9.1. Drivers

9.2. Challenges

10. Market Trends & Developments

11. Policy & Regulatory Landscape

12. Import-Export Analysis

13. Pricing Analysis

14. India Economic Profile

15. Competitive Landscape

15.1. Competition Outlook

15.2. Company Profiles

15.2.1. Yanmar Holdings Co., Ltd.

15.2.2. John Deere India Private Limited

15.2.3. Mahindra & Mahindra Ltd

15.2.4. Simpson & Co. Ltd.

15.2.5. Wartsila India Private Limited

15.2.6. Scania CV India Pvt Ltd

15.2.7. Volvo Group

15.2.8. Cummins India Ltd

15.2.9. Hyundai Heavy Industries

15.2.10. Mitsubishi Heavy Industries

16. Strategic Recommendations

For more information about this report visit https://www.researchandmarkets.com/r/5qjmm2


Contacts

ResearchAndMarkets.com
Laura Wood, Senior Press Manager
This email address is being protected from spambots. You need JavaScript enabled to view it.
For E.S.T Office Hours Call 1-917-300-0470
For U.S./CAN Toll Free Call 1-800-526-8630
For GMT Office Hours Call +353-1-416-8900

HOUSTON--(BUSINESS WIRE)--ConocoPhillips (NYSE: COP) today announced a new gas condensate discovery in production license 1009 located 22 miles northwest of the Heidrun Field and 150 miles from the coast of Norway in the Norwegian Sea. ConocoPhillips Skandinavia AS is operator of the license with 65 percent working interest. PGNiG Upstream Norway AS holds 35 percent working interest.


The discovery well, 6507/4-1 (Warka), was drilled in 1,312 feet of water to a total depth of 16,355 feet. Preliminary estimates place the size of the discovery between 50 and 190 million barrels of recoverable oil equivalent. Further appraisal will be conducted to determine potential flow rates, the reservoir’s ultimate resource recovery and plans for development.

“We have built a strong position on the Norwegian shelf since the discovery of the Ekofisk Field in 1969 and we are a very active industry operator and partner across the North Sea and the Norwegian Sea,” said Matt Fox, executive vice president and chief operating officer. “This discovery, potentially the largest on the Norwegian Continental shelf this year, bolsters our position in the Norwegian Sea and the Heidrun area. The Warka discovery and potential future opportunities represent very low cost of supply resource additions that can extend our multi-decade success on the Norwegian Continental Shelf.”

The Warka well was drilled by the Leiv Eiriksson drilling rig, which upon completion of the well will proceed to drill exploration well 6507/5-10 S (Slagugle) in production license 891, which is located 14 miles north-northeast of the Heidrun Field. ConocoPhillips Skandinavia AS is operator of production license 891 with 80 percent working interest and Pandion Energy AS holds 20 percent working interest.

--- # # # ---

About ConocoPhillips

Headquartered in Houston, Texas, ConocoPhillips had operations and activities in 15 countries, $63 billion of total assets, and approximately 9,800 employees at Sept. 30, 2020. Production excluding Libya averaged 1,108 MBOED for the nine months ended Sept. 30, 2020, and proved reserves were 5.3 BBOE as of Dec. 31, 2019. For more information, go to www.conocophillips.com.

CAUTIONARY STATEMENT FOR THE PURPOSES OF THE "SAFE HARBOR" PROVISIONS OF THE PRIVATE SECURITIES LITIGATION REFORM ACT OF 1995

This news release contains forward-looking statements as defined under the federal securities laws. Forward-looking statements relate to future events and anticipated results of operations, business strategies, and other aspects of our operations or operating results. Words and phrases such as "anticipate," "estimate," "believe," “budget,” "continue," "could," "intend," "may," "plan," "potential," "predict," “seek,” "should," "will," “would,” "expect," "objective," "projection," "forecast," "goal," "guidance," "outlook," "effort," "target" and other similar words can be used to identify forward-looking statements. However, the absence of these words does not mean that the statements are not forward-looking. Where, in any forward-looking statement, the company expresses an expectation or belief as to future results, such expectation or belief is expressed in good faith and believed to be reasonable at the time such forward-looking statement is made. However, these statements are not guarantees of future performance and involve certain risks, uncertainties and other factors beyond our control. Therefore, actual outcomes and results may differ materially from what is expressed or forecast in the forward-looking statements. Factors that could cause actual results or events to differ materially from what is presented include the impact of public health crises, such as pandemics (including coronavirus (COVID-19)) and epidemics and any related company or government policies and actions to protect the health and safety of individuals or government policies or actions to maintain the functioning of national or global economies and markets; global and regional changes in the demand, supply, prices, differentials or other market conditions affecting oil and gas and the resulting company actions in response to such changes, including changes resulting from the imposition or lifting of crude oil production quotas or other actions that might be imposed by the Organization of Petroleum Exporting Countries and other producing countries; changes in commodity prices; changes in expected levels of oil and gas reserves or production; operating hazards, drilling risks, unsuccessful exploratory activities; unexpected cost increases or technical difficulties in constructing, maintaining, or modifying company facilities; legislative and regulatory initiatives addressing global climate change or other environmental concerns; investment in and development of competing or alternative energy sources; disruptions or interruptions impacting the transportation for our oil and gas production; international monetary conditions and exchange rate fluctuations; changes in international trade relationships, including the imposition of trade restrictions or tariffs on any materials or products (such as aluminum and steel) used in the operation of our business; our ability to collect payments when due under our settlement agreement with PDVSA; our ability to collect payments from the government of Venezuela as ordered by the ICSID; our ability to liquidate the common stock issued to us by Cenovus Energy Inc. at prices we deem acceptable, or at all; our ability to complete our announced dispositions or acquisitions on the timeline currently anticipated, if at all; the possibility that regulatory approvals for our announced dispositions or acquisitions will not be received on a timely basis, if at all, or that such approvals may require modification to the terms of our announced dispositions, acquisitions or our remaining business; business disruptions during or following our announced dispositions or acquisitions, including the diversion of management time and attention; the ability to deploy net proceeds from our announced dispositions in the manner and timeframe we currently anticipate, if at all; potential liability for remedial actions under existing or future environmental regulations; potential liability resulting from pending or future litigation; the impact of competition and consolidation in the oil and gas industry; limited access to capital or significantly higher cost of capital related to illiquidity or uncertainty in the domestic or international financial markets; general domestic and international economic and political conditions; the ability to successfully receive the requisite approvals and consummate the proposed acquisition of Concho resources; the ability to successfully integrate the operations of Concho Resources with our operations and achieve the anticipated benefits from the transaction; changes in fiscal regime or tax, environmental and other laws applicable to our business; and disruptions resulting from extraordinary weather events, civil unrest, war, terrorism or a cyber attack; and other economic, business, competitive and/or regulatory factors affecting our business generally as set forth in our filings with the Securities and Exchange Commission. Unless legally required, ConocoPhillips expressly disclaims any obligation to update any forward-looking statements, whether as a result of new information, future events or otherwise.


Contacts

John C. Roper (media)
281-293-1451
This email address is being protected from spambots. You need JavaScript enabled to view it.
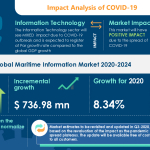
Investor Relations
281-293-5000
This email address is being protected from spambots. You need JavaScript enabled to view it.

DUBLIN--(BUSINESS WIRE)--The "Malaysia Residential Electric Water Pump Market, by Well Type, by Pump Type, by Function Type, by Power Rating, by Price Range, by Region, Competition, Forecast & Opportunities, 2025" report has been added to ResearchAndMarkets.com's offering.


The Malaysian Residential Electric Water Pump Market is projected to cross USD 54 million by 2025

The country's residential electric water pump market is driven by rise in residential construction coupled with increase in water management activities in domestic households. Moreover, rise in the demand for residential electric water pumps is anticipated because of expanding population and increase in shift of population from rural to urban cities in the country.

The demand for residential water pump is expected to decline in 2020 compared to what it was in 2019 by almost 15% owing to decline in construction activities and lock down due to COVID-19 outbreak.

However, the market is expected to recover in the coming years because of various government initiatives to provide affordable housing to its people under several policies such as 1Malaysia Housing Program (PR1MA), Federal Territories Affordable Housing Project (RUMAWIP), MyHome (Private Affordable Ownership Housing Scheme), etc. Moreover, the government is aiming to build 1 million affordable houses across the country in the coming years. All these factors are anticipated to boost the demand for residential electric water pumps over the coming years.

The Malaysian Residential Electric Water Pump Market is segmented based on well type, function type, pump type, power rating base, price range and region. Based on well type, the market can be segmented into shallow well and deep well. Among these, the shallow well segment is expected to hold the largest market share during forecast period, but the deep well segment is expected to witness faster growth rate during the forecast period.

Regionally, the Malaysian Residential Electric Water Pump Market has been segmented into West Malaysia and East Malaysia, out of which, West Malaysia would continue to hold more than 75% of the market share owing to the growing population and rising demand for clean and drinkable water in the region.

Major players operating in the Malaysian Residential Electric Water Pump Market include Panasonic Malaysia Sdn Bhd, Hitachi Sales (Malaysia) Sdn, Mitsubishi Electric Corporation, Grundfos Pumps Sdn Bhd, Joven Electric Co. Sdn. Bhd, CSP Advance Sdn Bhd., Leo Group Pump (Zhejiang) Co., Ltd and others.

Years considered for this report:

  • Historical Years: 2015-2018
  • Base Year: 2019
  • Estimated Year: 2020
  • Forecast Period: 2021-2025

Report Scope:

In this report, the Malaysian Residential Electric Water Pump Market has been segmented into following categories, in addition to the industry trends which have also been detailed below:

Market, By Well Type:

  • Shallow Well
  • Deep Well

Market, By Pump Type:

  • Cascade Pump
  • Turbine Pump
  • Centrifugal Pump
  • Submersible Pump
  • Turbine Pump with Jet

Market, By Function Type:

  • Automatic
  • Non- Automatic

Market, By Power Rating:

  • Up to 0.25 HP
  • 0.25-0.5 HP
  • 0.5 HP-1 HP
  • 1 HP-1.5 HP
  • Above 1.5 HP

Market, By Price Range:

  • Economy
  • Medium
  • High
  • Premium

Market, By Region:

  • West
  • East

Companies Mentioned

  • Mitsubishi Electric Corporation
  • Grundfos Pumps Sdn Bhd
  • Hitachi Sales (Malaysia) Sdn
  • Panasonic Malaysia Sdn Bhd
  • Joven Electric Co. Sdn. Bhd
  • CSP Advance Sdn Bhd
  • Leo Group Pump (Zhejiang) Co., Ltd
  • Ebara Pumps Malaysia Sdn. Bhd.
  • Multipump Sdn. Bhd.
  • Clazzen Malaysia Sdn. Bhd.

For more information about this report visit https://www.researchandmarkets.com/r/4578pv


Contacts

ResearchAndMarkets.com
Laura Wood, Senior Press Manager
This email address is being protected from spambots. You need JavaScript enabled to view it.
For E.S.T Office Hours Call 1-917-300-0470
For U.S./CAN Toll Free Call 1-800-526-8630
For GMT Office Hours Call +353-1-416-8900

Offshore Source Logo

Offshore Source keeps you updated with relevant information concerning the Offshore Energy Sector.

Any views or opinions represented on this website belong solely to the author and do not represent those of the people, institutions or organizations that Offshore Source or collaborators may or may not have been associated with in a professional or personal capacity, unless explicitly stated.

Corporate Offices

Technology Systems Corporation
8502 SW Kansas Ave
Stuart, FL 34997

info@tscpublishing.com