Business Wire News

PASADENA, Calif.--(BUSINESS WIRE)--Tetra Tech, Inc. (NASDAQ: TTEK), a leading provider of high-end consulting and engineering services, announced today that the United States Agency for International Development (USAID) awarded the Company a five-year, $25 million single-award contract to increase renewable energy consumption and reduce deforestation in Zambia. The Alternatives to Charcoal Activity represents the flagship investment from the USAID/Zambia Mission to counter climate change and contribute towards poverty reduction through the sustainable management of forest resources.


Tetra Tech’s research scientists and analysts will use advanced data analytics to conduct market research on available technologies, collect baseline data on barriers to alternative energy use, and facilitate the adoption of renewable fuel technologies in Zambia. Through policy and regulatory framework reform, the project will strengthen the ability of the private sector to increase availability of and access to renewable energy sources for urban Zambian households.

“Tetra Tech has supported USAID to promote renewable energy and manage natural resources in Africa for 40 years,” said Dan Batrack, Tetra Tech Chairman and CEO. “We are pleased to continue using our Leading with Science® approach to promote alternative technology solutions to address the impacts of climate change in developing countries.”

About Tetra Tech

Tetra Tech is a leading provider of high-end consulting and engineering services for projects worldwide. With 20,000 associates working together, Tetra Tech provides clear solutions to complex problems in water, environment, sustainable infrastructure, and renewable energy. We are Leading with Science® to provide sustainable and resilient solutions for our clients. For more information about Tetra Tech, please visit tetratech.com or follow us on LinkedIn, Twitter, and Facebook.

Any statements made in this release that are not based on historical fact are forward-looking statements. Any forward-looking statements made in this release represent management’s best judgment as to what may occur in the future. However, Tetra Tech’s actual outcome and results are not guaranteed and are subject to certain risks, uncertainties and assumptions ("Future Factors"), and may differ materially from what is expressed. For a description of Future Factors that could cause actual results to differ materially from such forward-looking statements, see the discussion under the section "Risk Factors" included in the Company’s Form 10-K and Form 10-Q filings with the Securities and Exchange Commission.


Contacts

Jim Wu, Investor Relations
Charlie MacPherson, Media & Public Relations
(626) 470-2844


LONDON--(BUSINESS WIRE)--#SolarThermalMarketinEurope--The new solar thermal market in Europe research from Technavio indicates growth in the short term as the business impact of COVID-19 spreads.


Get detailed insights on the COVID-19 pandemic crisis and recovery analysis of the solar thermal market in Europe.

Get FREE report sample within MINUTES

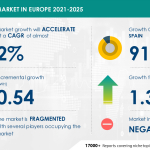
"One of the primary growth drivers for this market is the increasing demand for CSP,” says a senior analyst for the utilities industry at Technavio. As the markets recover, Technavio expects the solar thermal market in Europe size to grow by 0.54 Terawatt-hour during the period 2021-2025.

Solar Thermal Market in Europe Segment Highlights for 2020

  • The solar thermal market in Europe is expected to post a year-over-year growth rate of 1.3%.
  • Based on the technology, the low and medium temperature segment saw maximum growth in 2020. The low and medium temperature segment primarily includes the small- and medium-scale solar water heating systems for residential and commercial buildings. The segment is facing severe competition from the PV systems and the heat pumps.
  • The growth of the market segment will be significant during the forecast period.

Regional Analysis

  • 91% of the growth will originate from the Spain region.
  • The decrease in the prices of CSP with thermal energy storage will facilitate the solar thermal market growth in Spain over the forecast period.
  • The market growth in Spain will be slower than the growth of the market in the rest of Europe.

Click here to learn about report detailed analysis and insights on how you can leverage them to grow your business.

Related Reports on Utilities Include:

Global Automotive Fog Lights Market- The automotive fog lights market is segmented by end-user (OEM and aftermarket), geography (APAC, Europe, MEA, North America, and South America), and key vendors. Click Here to Get an Exclusive Free Sample Report

Global Automotive Active Safety System Market- The automotive active safety system market is segmented by safety features (ABS, LDWS, ESC, ACC, and others), geography (APAC, Europe, MEA, North America, and South America), and key vendors. Click Here to Get an Exclusive Free Sample Report

Notes:

  • The solar thermal market in Europe size is expected to accelerate at a CAGR of 2% during the forecast period.
  • The solar thermal market in Europe is segmented by technology (Low and medium temperature and High temperature) and geography (Spain and Rest of Europe).
  • The market is fragmented due to the presence of many established vendors holding significant market share.
  • The research report offers information on several market vendors, including Aalborg CSP AS, Abengoa SA, Acciona SA, Bosch Thermotechnik GmbH, BrightSource Energy Inc., Cosmosolar, DEL PASO SOLAR SL, GREENoneTEC Solarindustrie GmbH, SENER group, and Vaillant GmbH.

Register for a free trial today to access 17,000+ market research reports using Technavio's SUBSCRIPTION platform

About Us

Technavio is a leading global technology research and advisory company. Their research and analysis focuses on emerging market trends and provides actionable insights to help businesses identify market opportunities and develop effective strategies to optimize their market positions. With over 500 specialized analysts, Technavio’s report library consists of more than 17,000 reports and counting, covering 800 technologies, spanning across 50 countries. Their client base consists of enterprises of all sizes, including more than 100 Fortune 500 companies. This growing client base relies on Technavio’s comprehensive coverage, extensive research, and actionable market insights to identify opportunities in existing and potential markets and assess their competitive positions within changing market scenarios.


Contacts

Technavio Research
Jesse Maida
Media & Marketing Executive
US: +1 844 364 1100
UK: +44 203 893 3200
Email: This email address is being protected from spambots. You need JavaScript enabled to view it.
Website: www.technavio.com/

HOUSTON--(BUSINESS WIRE)--Phillips 66 (NYSE: PSX) today announced it has received a $3 million grant from the U.S. Department of Energy to advance the development of high-performance reversible solid oxide fuel cells.


Phillips 66 will collaborate with the Georgia Institute of Technology (Georgia Tech) to demonstrate the commercial feasibility of a low-cost and highly efficient reversible solid oxide fuel cell (RSOFC) system for hydrogen and electricity generation. The technology is one of many Phillips 66 is pursuing as part of its commitment to a sustainable, lower-carbon energy future.

“Our scientists and engineers are at the forefront of solid oxide fuel cell technology,” said Ann Oglesby, VP, Energy Research & Innovation at Phillips 66. “We are pleased to partner with Georgia Tech to demonstrate the commercial feasibility of this innovative reversible system.”

SOFCs are ceramic devices that generate electricity efficiently, with low emissions and at a competitive cost by oxidizing a fuel, such as hydrogen or natural gas, through electrochemical reactions rather than combustion. They have a lower carbon footprint compared with conventional power plants and are an ideal technology for the capture of carbon dioxide.

Reversible SOFCs allow for the fuel cells to operate in either power generation mode, as a solid oxide fuel cell, or reverse mode, as a solid oxide electrolysis cell. In the latter, electricity is applied to the cells to produce hydrogen, a low-emission fuel, through electrolysis.

Phillips 66 has made significant technical progress in the area of solid oxide fuel cells and holds eight U.S. granted patents and 22 pending U.S. patent applications in its SOFC intellectual property portfolio.

The grant was awarded by the Department of Energy’s Office of Fossil Energy. Phillips 66 will be the research lead on the grant, with Georgia Tech as a collaborative partner.

About Phillips 66

Phillips 66 is a diversified energy manufacturing and logistics company. With a portfolio of Midstream, Chemicals, Refining, and Marketing and Specialties businesses, the company processes, transports, stores and markets fuels and products globally. Phillips 66 Partners, the company’s master limited partnership, is integral to the portfolio. Headquartered in Houston, the company has 14,500 employees committed to safety and operating excellence. Phillips 66 had $54 billion of assets as of Sept. 30, 2020. For more information, visit www.phillips66.com or follow us on Twitter @Phillips66Co.


Contacts

Jeff Dietert, 832-765-2297 (investors)
This email address is being protected from spambots. You need JavaScript enabled to view it.

Shannon Holy, 832-765-2297 (investors)
This email address is being protected from spambots. You need JavaScript enabled to view it.

Thaddeus Herrick, 855-841-2368 (media)
This email address is being protected from spambots. You need JavaScript enabled to view it.

Shape strategic responses through the phases of industry recovery

ABB Ltd., Canadian Solar Inc., and Hanwha Corp. will emerge as major residential solar PV systems market participants during 2021-2025

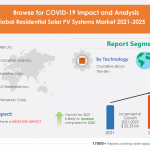
LONDON--(BUSINESS WIRE)--#GlobalResidentialSolarPVSystemsMarket--The residential solar PV systems market is expected to grow by USD 52.23 billion during 2021-2025, according to Technavio. The report offers a detailed analysis of the impact of the COVID-19 pandemic on the residential solar PV systems market in optimistic, probable, and pessimistic forecast scenarios.


Enterprises will go through the Response, Recovery, and Renew phases. Download a Free Sample Report on COVID-19

The residential solar PV systems market will witness a negative impact during the forecast period owing to the widespread growth of the COVID-19 pandemic. As per Technavio’s pandemic-focused market research, market growth is likely to increase as compared to 2019.

With the continuing spread of the novel coronavirus pandemic, organizations across the globe are gradually flattening their recessionary curve by leveraging technology. Many businesses will go through response, recovery, and renewal phases. Building business resilience and enabling agility will aid organizations to move forward in their journey out of the COVID-19 crisis towards the next normal.

This post-pandemic business planning research will aid clients to:

  • Adjust their strategic planning to move ahead once business stability kicks in.
  • Build resilience by making effective resource and investment choices for individual business units, products, and service lines.
  • Conceptualize scenario-based planning to mitigate future crisis situations.

Download the Post-Pandemic Business Planning Structure. Click here

Key Considerations for Market Forecast:

  • Impact of lockdowns, supply chain disruptions, demand destruction, and change in customer behavior
  • Optimistic, probable, and pessimistic scenarios for all markets as the impact of pandemic unfolds
  • Pre- as well as post-COVID-19 market estimates
  • Quarterly impact analysis and updates on market estimates

Gain instant access to 17,000+ market research reports by using

Technavio's SUBSCRIPTION platform

Related Report on Utilities Industries:

Global Rooftop Solar Market- The rooftop solar market is segmented by application (non-residential and residential), geography (APAC, Europe, North America, MEA, and South America), and key vendors. Click Here to Get an Exclusive Free Sample Report

Global Fuel Cell Market- The fuel cell market is segmented by product (PEMFC, PAFC, SOFC, and others), application (transport, stationary, and portable), and geography (APAC, Americas, and EMEA). Click Here to Get an Exclusive Free Sample Report

Major Three Residential Solar PV Systems Market Participants:

ABB Ltd.

ABB Ltd. operates the business through various segments such as Electrification, Industrial Automation, Motion, Robotics & Discrete Automation, and Corporate and Other. The company offers transmission and distribution of residential solar PV systems for both on-grid and off-grid applications.

Canadian Solar Inc.

Canadian Solar Inc. operates the business through various segments such as MSS, and Energy. The company offers solar panels and modules and residential solar power kits.

Hanwha Corp.

Hanwha Corp. operates the business through various segments such as Aerospace and mechatronics, Chemicals and materials, Solar energy, Financial services, Construction, and Leisure and lifestyle. The company offers Q cells such as.PLUS, Q.PEAK, Q.HOME, Q.HOME+, Q.POWER, Q.PRIME, and EPC.

If you purchase a report that is updated in the next 60 days, we will send you the new edition and data extract FREE! Get report snapshot here to get detailed market share analysis of market participants during COVID-19 lockdown: https://www.technavio.com/report/residential-solar-pv-systems-market-industry-analysis

Residential Solar PV Systems Market 2021-2025: Segmentation

The residential solar PV systems market is segmented as below:

  • Technology
    • Crystalline-silicon
    • Thin-film
  • Geography
    • APAC
    • Europe
    • North America
    • MEA
    • South America

The residential solar PV systems market is driven by increasing investments in renewable energy. In addition, other factors such as increasing adoption of microgrids are expected to trigger the residential solar PV systems market toward witnessing a CAGR of over 8% during the forecast period.

Get more insights about the global trends impacting the future of the residential solar PV systems market, Request Free Sample @ https://www.technavio.com/talk-to-us?report=IRTNTR46617

Market Drivers

Market Challenges

Market Trends

Vendor Landscape

  • Vendors covered
  • Vendor classification
  • Market positioning of vendors
  • Competitive scenario

About Us

Technavio is a leading global technology research and advisory company. Their research and analysis focuses on emerging market trends and provides actionable insights to help businesses identify market opportunities and develop effective strategies to optimize their market positions. With over 500 specialized analysts, Technavio’s report library consists of more than 17,000 reports and counting, covering 800 technologies, spanning across 50 countries. Their client base consists of enterprises of all sizes, including more than 100 Fortune 500 companies. This growing client base relies on Technavio’s comprehensive coverage, extensive research, and actionable market insights to identify opportunities in existing and potential markets and assess their competitive positions within changing market scenarios.


Contacts

Technavio Research
Jesse Maida
Media & Marketing Executive
US: +1 844 364 1100
UK: +44 203 893 3200
Email: This email address is being protected from spambots. You need JavaScript enabled to view it.
Website: www.technavio.com/

DALLAS--(BUSINESS WIRE)--Energy Transfer Operating, L.P. today announced the quarterly cash distribution of $0.4609375 per Series C Preferred Unit (NYSE: ETPprC), the quarterly cash distribution of $0.4765625 per Series D Preferred Unit (NYSE: ETPprD), and the quarterly cash distribution of $0.4750000 per Series E Preferred Unit (NYSE: ETPprE). These cash distributions will be paid on February 16, 2021 to Series C, Series D and Series E unitholders of record as of the close of business on February 1, 2021.


About Energy Transfer

Energy Transfer Operating, L.P. owns and operates one of the largest and most diversified portfolios of energy assets in the United States. Strategically positioned in all of the major U.S. production basins, its core operations include complementary natural gas midstream, intrastate and interstate transportation and storage assets; crude oil, natural gas liquids (NGL) and refined product transportation and terminalling assets; NGL fractionation; and various acquisition and marketing assets. Energy Transfer Operating, L.P. also owns Lake Charles LNG Company, as well as the general partner interests, the incentive distribution rights and 28.5 million common units of Sunoco LP (NYSE: SUN), and the general partner interest and 46.1 million common units of USA Compression Partners, LP (NYSE: USAC). Energy Transfer Operating, L.P.’s general partner is owned by Energy Transfer LP (NYSE: ET). For more information, visit the Energy Transfer website at www.energytransfer.com.

Forward Looking Statements

This press release may include certain statements concerning expectations for the future that are forward-looking statements as defined by federal law. Such forward-looking statements are subject to a variety of known and unknown risks, uncertainties, and other factors that are difficult to predict and many of which are beyond management’s control. An extensive list of factors that can affect future results are discussed in Energy Transfer Operating, L.P.’s Annual Report on Form 10-K and other documents filed from time to time with the Securities and Exchange Commission. In addition to the risks and uncertainties previously disclosed, the Partnership has also been, or may in the future be, impacted by new or heightened risks related to the COVID-19 pandemic and the recent decline in commodity prices, and we cannot predict the length and ultimate impact of those risks. Energy Transfer Operating, L.P. undertakes no obligation to update or revise any forward-looking statement to reflect new information or events.

This release serves as qualified notice to nominees as provided for under Treasury Regulation section 1.1446-4(b)(4) and (d). Please note that 100 percent of Energy Transfer Operating, L.P.’s distributions to foreign investors are attributable to income that is effectively connected with a United States trade or business. Accordingly, all of Energy Transfer Operating, L.P.’s distributions to foreign investors are subject to federal tax withholding at the highest applicable effective tax rate. Nominees, and not Energy Transfer Operating, L.P., are treated as withholding agents responsible for withholding distributions received by them on behalf of foreign investors.

The information contained in this press release is available on our website at energytransfer.com.


Contacts

Energy Transfer
Investor Relations:
Lyndsay Hannah, William Baerg, Brent Ratliff, 214-981-0795
or
Media Relations:
Vicki Granado, 214-840-5820


DUBLIN--(BUSINESS WIRE)--The "United Arab Emirates Midstream Oil and Gas Industry Outlook to 2025" report has been added to ResearchAndMarkets.com's offering.


United Arab Emirates Midstream Oil and Gas Industry Outlook to 2025 - Market Outlook for Liquefied Natural Gas (LNG), Liquids Storage, Pipelines and Gas Processing is a comprehensive report on midstream oil and gas industry in United Arab Emirates. The report provides details such as name, type, operational status and operator for all active and planned (new build) LNG terminals, liquids storage terminals major trunk pipelines and gas processing plants in United Arab Emirates till 2025. Further, the report also offers recent developments and latest contracts awarded in the country's midstream sector, wherever available.

Scope

  • Updated information related to all active, planned and announced LNG terminals, oil storage terminals, trunk pipelines and gas processing plants in the country, including operator and equity details
  • Key mergers and acquisitions and asset transactions in the country's midstream oil and gas industry, where available
  • Latest developments, financial deals and awarded contracts related to midstream oil and gas industry in the country, wherever available

Reasons to Buy

  • Gain strong understanding of the country's midstream oil and gas industry
  • Facilitate decision making on the basis of strong historical and outlook of capacity/length data
  • Assess your competitor's major LNG terminals, oil storage terminals, trunk pipelines, and gas processing plants in the country
  • Analyze the latest developments, financial deals landscape and awarded contracts related to the country's midstream oil and gas industry

Key Topics Covered:

1. Table of Contents

1.1. List of Tables

1.2. List of Figures

2. Introduction

2.1. What is This Report About?

2.2. Market Definition

3. United Arab Emirates LNG Industry

3.1. United Arab Emirates LNG Industry, Liquefaction

3.1.1. United Arab Emirates LNG Industry, Liquefaction, Overview

3.1.2. United Arab Emirates LNG Industry, Total Liquefaction Capacity

3.2. United Arab Emirates LNG Industry, Liquefaction Capacity by Company

3.3. United Arab Emirates LNG Industry, Liquefaction Capacity by Terminal

3.4. United Arab Emirates LNG Industry, Asset Details

3.4.1. United Arab Emirates LNG Industry, Liquefaction Active Asset Details

3.5. United Arab Emirates LNG Industry, Regasification

3.5.1. United Arab Emirates LNG Industry, Regasification, Key Data

3.6. United Arab Emirates LNG Industry, Regasification, Overview

3.6.1. United Arab Emirates LNG Industry, Total Regasification Capacity

3.7. United Arab Emirates LNG Industry, Regasification Capacity by Major Companies

3.8. United Arab Emirates LNG Industry, Regasification Capacity by Terminal

3.9. United Arab Emirates LNG Industry, Asset Details

3.9.1. United Arab Emirates LNG Industry, Regasification Active Asset Details

3.9.2. United Arab Emirates LNG Industry, Regasification Planned Asset Details

4. United Arab Emirates Oil Storage Industry

4.1. United Arab Emirates Oil Storage Industry, Key Data

4.2. United Arab Emirates Oil Storage Industry, Overview

4.3. United Arab Emirates Oil Storage Industry, Storage Operations

4.3.1. United Arab Emirates Oil Storage Industry, Total Storage Capacity

4.4. United Arab Emirates Oil Storage Industry, Storage Capacity Share by Area

4.5. United Arab Emirates Oil Storage Industry, Storage Capacity by Major Companies

4.6. United Arab Emirates Oil Storage Industry, Storage Capacity by Terminal

4.7. United Arab Emirates Oil Storage Industry, Asset Details

4.7.1. United Arab Emirates Oil Storage Industry, Active Asset Details

4.7.2. United Arab Emirates Oil Storage Industry, Planned Asset Details

5. United Arab Emirates Oil and Gas Pipelines Industry

5.1. United Arab Emirates Oil Pipelines

5.1.1. United Arab Emirates Oil Pipelines, Key Data

5.1.2. United Arab Emirates Oil Pipelines, Overview

5.2. United Arab Emirates Oil and Gas Pipelines Industry, Crude Oil Pipeline Length by Major Companies

5.3. United Arab Emirates Oil and Gas Pipelines Industry, Crude Oil Pipelines

5.4. United Arab Emirates Oil and Gas Pipelines Industry, Petroleum Products Pipeline Length by Company

5.5. United Arab Emirates Oil and Gas Pipelines Industry, Petroleum Products Pipelines

5.6. United Arab Emirates Oil and Gas Pipelines Industry, Oil Pipelines Asset Details

5.6.1. United Arab Emirates Oil and Gas Pipelines Industry, Oil Pipelines Active Asset Details

5.6.2. United Arab Emirates Oil and Gas Pipelines Industry, Oil Pipelines Planned Asset Details

5.7. United Arab Emirates Gas Pipelines

5.7.1. United Arab Emirates Gas Pipelines, Key Data

5.7.2. United Arab Emirates Gas Pipelines, Overview

5.8. United Arab Emirates Oil and Gas Pipelines Industry, Natural Gas Pipeline Length by Major Companies

5.9. United Arab Emirates Oil and Gas Pipelines Industry, Natural Gas Pipelines

5.10. United Arab Emirates Oil and Gas Pipelines Industry, Gas Pipelines Asset Details

5.10.1. United Arab Emirates Oil and Gas Pipelines Industry, Gas Pipelines Active Asset Details

5.10.2. United Arab Emirates Oil and Gas Pipelines Industry, Gas Pipelines Planned Asset Details

6. United Arab Emirates Gas Processing Industry

6.1. United Arab Emirates Gas Processing Industry, Key Data

6.2. United Arab Emirates Gas Processing Industry, Overview

6.3. United Arab Emirates Gas Processing Industry, Gas Processing Capacity by Major Companies

6.4. United Arab Emirates Gas Processing Industry, Processing Plant number by Facility Type

6.5. United Arab Emirates Gas Processing Industry, Capacity Contribution of Various Provinces

6.6. United Arab Emirates Gas Processing Industry, Active Gas Processing Capacity

6.7. United Arab Emirates Gas Processing Industry, Planned Gas Processing Capacity

6.8. United Arab Emirates Gas Processing Industry, Asset Details

6.8.1. United Arab Emirates Gas Processing Industry, Active Asset Details

6.8.2. United Arab Emirates Gas Processing Industry, Planned Asset Details

7. Recent Contracts

7.1. Detailed Contract Summary

7.1.1. Awarded Contracts

8. Recent Developments

8.1. Other Significant Developments

8.2. New Contracts Announcements

9. Appendix

For more information about this report visit https://www.researchandmarkets.com/r/9saby2


Contacts

ResearchAndMarkets.com
Laura Wood, Senior Press Manager
This email address is being protected from spambots. You need JavaScript enabled to view it.

For E.S.T Office Hours Call 1-917-300-0470
For U.S./CAN Toll Free Call 1-800-526-8630
For GMT Office Hours Call +353-1-416-8900

SANTA CLARITA, Calif.--(BUSINESS WIRE)--California Resources Corporation (NYSE: CRC) (the “Company”) announced today that it is reducing the size of its leadership team and realigning several functions as it focuses on efficiency and cost reductions. The Company is eliminating leadership positions in the areas of public affairs, exploration and development, investor relations and finance, and implementing the following functional realignment: (1) reporting to Mac McFarland (interim CEO) will be Francisco Leon (Chief Financial Officer), Mike Preston (Chief Administrative Officer and General Counsel), Shawn Kerns (Executive Vice President, Operations and Engineering), and Carlos Contreras (Senior Vice President, Commercial); (2) Mr. Leon’s functional responsibilities will include finance and planning, reserves, business development, investor relations and supply chain; (3) Mr. Preston will have responsibility for legal, IT, human resources and government and external affairs; (4) Mr. Kerns will have responsibility for all aspects of operations and development; and (5) Mr. Contreras will lead the marketing function. These organizational changes, when fully implemented, are expected to reduce the Company’s run rate costs by approximately $8 million per year (representing a 22% reduction in senior leadership team costs)1 and result in one-time charges of approximately $5 million.


Mr. McFarland said: “This streamlined leadership team is the first step in better positioning the Company to focus on implementing additional cost reductions, maintaining our capital discipline and asset rationalization through our full-scale Business Review. We will continue to maintain our focus on safe and environmentally responsible operations as we implement changes to the Company’s organization and strategic direction.”

Investor Presentation Available

The Company today posted an updated investor presentation to the Investor Relations page of its website at www.crc.com.

Forward-Looking Statement Disclosure

All statements, except for statements of historical fact, made in this release regarding activities, events or developments the Company expects, believes or anticipates will or may occur in the future, are forward-looking statements within the meaning of Section 27A of the Securities Act and Section 21E of the Securities Exchange Act of 1934, as amended. All forward-looking statements speak only as of the date of this release. Although the Company believes that the plans, intentions and expectations reflected in or suggested by the forward-looking statements are reasonable, there is no assurance that these plans, intentions or expectations will be achieved. Therefore, actual outcomes and results could materially differ from what is expressed, implied or forecast in such statements. Except as required by law, the Company expressly disclaims any obligation to and does not intend to publicly update or revise any forward-looking statements.

The Company cautions you that these forward-looking statements are subject to all of the risks and uncertainties incident to the Company’s business, most of which are difficult to predict and many of which are beyond the Company’s control. These risks include, but are not limited to, the risks described under the heading “Risk Factors” in the Company’s Annual Report on Form 10-K for the year ended December 31, 2019 and its subsequently filed Quarterly Reports on Form 10-Q.

About California Resources Corporation

California Resources Corporation is the largest oil and natural gas exploration and production company in California. The Company operates exclusively within the State of California, applying complementary and integrated infrastructure to gather, process and market its production. Using advanced technology, the Company focuses on safely and responsibly supplying affordable energy for California by Californians.

1 Calculations based on 2020 run rate at target. “Senior leadership team” consists of Vice Presidents and more senior positions, including the CEO position.


Contacts

Joanna Park (Investor Relations)
(818) 661-3731
This email address is being protected from spambots. You need JavaScript enabled to view it.

Margita Thompson (Media)
(818) 661-6015
This email address is being protected from spambots. You need JavaScript enabled to view it.

DUBLIN--(BUSINESS WIRE)--The "Russia Midstream Oil and Gas Industry Outlook to 2025" report has been added to ResearchAndMarkets.com's offering.


Russia Midstream Oil and Gas Industry Outlook to 2025 - Market Outlook for Liquefied Natural Gas (LNG), Liquids Storage, Pipelines, Underground Gas Storage and Gas Processing is a comprehensive report on midstream oil and gas industry in Russia.

The report provides details such as name, type, operational status and operator for all active and planned (new build) LNG terminals, liquids storage terminals major trunk pipelines, underground gas storage sites and gas processing plants in Russia till 2025. Further, the report also offers recent developments, financial deals as well as latest contracts awarded in the country's midstream sector, wherever available.

Scope

  • Updated information related to all active, planned and announced LNG terminals, oil storage terminals, trunk pipelines, underground gas storage and gas processing plants in the country, including operator and equity details
  • Key mergers and acquisitions and asset transactions in the country's midstream oil and gas industry, where available
  • Latest developments, financial deals and awarded contracts related to midstream oil and gas industry in the country, wherever available

Reasons to Buy

  • Facilitate decision making on the basis of strong historical and outlook of capacity/length data
  • Assess your competitor's major LNG terminals, oil storage terminals, trunk pipelines, underground gas storage sites and gas processing plants in the country
  • Analyze the latest developments, financial deals landscape and awarded contracts related to the country's midstream oil and gas industry

Key Topics Covered:

1. Tables & Figures

2. Introduction

3. Russia LNG Industry

3.1. Russia LNG Industry, Liquefaction

3.1.1. Russia LNG Industry, Liquefaction, Key Data

3.2. Russia LNG Industry, Liquefaction, Overview

3.2.1. Russia LNG Industry, Total Liquefaction Capacity

3.3. Russia LNG Industry, Liquefaction Capacity by Major Companies

3.4. Russia LNG Industry, Liquefaction Capacity by Terminal

3.5. Russia LNG Industry, Liquefaction Asset Details

3.5.1. Russia LNG Industry, Liquefaction Active Asset Details

3.5.2. Russia LNG Industry, Liquefaction Planned Asset Details

3.6. Russia LNG Industry, Regasification

3.6.1. Russia LNG Industry, Regasification, Overview

3.6.2. Russia LNG Industry, Total Regasification Capacity

3.7. Russia LNG Industry, Regasification Capacity by Company

3.8. Russia LNG Industry, Regasification Capacity by Terminal

3.9. Russia LNG Industry, Regasification Asset Details

3.9.1. Russia LNG Industry, Regasification Planned Asset Details

4. Russia Oil Storage Industry

4.1. Russia Oil Storage Industry, Key Data

4.2. Russia Oil Storage Industry, Overview

4.3. Russia Oil Storage Industry, Storage Operations

4.3.1. Russia Oil Storage Industry, Total Storage Capacity

4.3.2. Russia Oil Storage Industry, Storage Capacity Share by Area

4.4. Russia Oil Storage Industry, Storage Capacity by Major Companies

4.5. Russia Oil Storage Industry, Storage Capacity by Terminal

4.6. Russia Oil Storage Industry, Asset Details

4.6.1. Russia Oil Storage Industry, Active Asset Details

4.6.2. Russia Oil Storage Industry, Planned Asset Details

5. Russia Oil and Gas Pipelines Industry

5.1. Russia Oil Pipelines

5.1.1. Russia Oil Pipelines, Key Data

5.2. Russia Oil Pipelines, Overview

5.3. Russia Oil and Gas Pipelines Industry, Crude Oil Pipeline Length by Major Companies

5.4. Russia Oil and Gas Pipelines Industry, Crude Oil Pipelines

5.5. Russia Oil and Gas Pipelines Industry, Petroleum Products Pipeline Length by Company

5.6. Russia Oil and Gas Pipelines Industry, Petroleum Products Pipelines

5.7. Russia Oil and Gas Pipelines Industry, NGL Pipeline Length by Company

5.8. Russia Oil and Gas Pipelines Industry, NGL Pipelines

5.9. Russia Oil and Gas Pipelines Industry, Oil Pipelines Asset Details

5.9.1. Russia Oil and Gas Pipelines Industry, Oil Pipelines Active Asset Details

5.9.2. Russia Oil and Gas Pipelines Industry, Oil Pipelines Planned Asset Details

5.10. Russia Gas Pipelines, Key Data

5.10.1. Russia Gas Pipelines, Overview

5.11. Russia Oil and Gas Pipelines Industry, Natural Gas Pipeline Length by Major Companies

5.12. Russia Oil and Gas Pipelines Industry, Natural Gas Pipelines

5.13. Russia Oil and Gas Pipelines Industry, Gas Pipelines Asset Details

5.13.1. Russia Oil and Gas Pipelines Industry, Gas Pipelines Active Asset Details

5.13.2. Russia Oil and Gas Pipelines Industry, Gas Pipelines Planned Asset Details

6. Russia Underground Gas Storage Industry

6.1. Russia Underground Gas Storage Industry, Key Data

6.2. Russia Underground Gas Storage Industry, Overview

6.3. Russia Underground Gas Storage Industry, Storage Capacity by Company

6.4. Russia Underground Gas Storage Industry, Storage Capacity by Area

6.5. Russia Underground Gas Storage Industry, Storage Capacity by Site

6.5.1. Russia Underground Gas Storage Industry, Storage Capacity by Active Sites

6.5.2. Russia Underground Gas Storage Industry, Storage Capacity by Planned Sites

6.6. Russia Underground Gas Storage Industry, Asset Details

6.6.1. Russia Underground Gas Storage Industry, Active Asset Details

6.6.2. Russia Underground Gas Storage Industry, Planned Asset Details

7. Russia Gas Processing Industry

7.1. Russia Gas Processing Industry, Key Data

7.2. Russia Gas Processing Industry, Overview

7.3. Russia Gas Processing Industry, Gas Processing Capacity by Major Companies

7.4. Russia Gas Processing Industry, Processing Plant Number by Plant Type

7.5. Russia Gas Processing Industry, Capacity Contribution of Various Provinces

7.6. Russia Gas Processing Industry, Active Gas Processing Capacity

7.7. Russia Gas Processing Industry, Planned Gas Processing Capacity

7.8. Russia Gas Processing Industry, Asset Details

7.8.1. Russia Gas Processing Industry, Active Asset Details

7.8.2. Russia Gas Processing Industry, Planned Asset Details

8. Recent Contracts

9. Financial Deal Landscape

9.1. Detailed Deal Summary

9.1.1. Acquisition

9.1.2. Debt Offerings

9.1.3. Partnerships

9.1.4. Asset Transactions

10. Recent Developments

11. Appendix

For more information about this report visit https://www.researchandmarkets.com/r/cyz3qg


Contacts

ResearchAndMarkets.com
Laura Wood, Senior Press Manager
This email address is being protected from spambots. You need JavaScript enabled to view it.

For E.S.T Office Hours Call 1-917-300-0470
For U.S./CAN Toll Free Call 1-800-526-8630
For GMT Office Hours Call +353-1-416-8900

HOUSTON--(BUSINESS WIRE)--Crestwood Equity Partners LP (NYSE: CEQP) (“Crestwood” or “CEQP”) announced today that the board of directors of its general partner has declared the partnership’s quarterly cash distribution of $0.625 per limited partner unit ($2.50 annually) for the quarter ended December 31, 2020, which is flat quarter over quarter. In addition, Crestwood announced a quarterly cash distribution of $0.2111 per Class A preferred equity unit ($0.8444 annually). Both common and preferred distributions will be made on February 12, 2021, to unitholders of record as of February 5, 2021.


Crestwood plans to report financial results for the fourth quarter 2020 and provide 2021 guidance on Tuesday, February 23, 2021, before the New York Stock Exchange opens for trading. Following the announcement, management will host a conference call for investors and analysts at 9:00 a.m. Eastern Time (8:00 a.m. Central Time) that day to discuss the operating and financial results. Crestwood will provide an update on its operations and financial strategy at that time. The call will be broadcast live over the internet via audio webcast. Investors will be able to connect to the webcast via the “Investors” page of Crestwood’s website at www.crestwoodlp.com. Please log in at least ten minutes in advance to register and download any necessary software. A replay will be available shortly after the call for 90 days.

About Crestwood Equity Partners LP

Houston, Texas, based Crestwood Equity Partners LP (NYSE: CEQP) is a master limited partnership that owns and operates midstream businesses in multiple shale resource plays across the United States. Crestwood is engaged in the gathering, processing, treating, compression, storage and transportation of natural gas; storage, transportation, terminalling, and marketing of NGLs; gathering, storage, terminalling and marketing of crude oil; and gathering and disposal of produced water. Visit Crestwood Equity Partners LP at www.crestwoodlp.com; and to learn more about Crestwood’s sustainability efforts, please visit https://esg.crestwoodlp.com.

Forward Looking Statements

This press release may include certain statements concerning expectations for the future that are forward-looking statements as defined by federal securities law. Such forward-looking statements are subject to a variety of known and unknown risks, uncertainties, and other factors that are difficult to predict and many of which are beyond management’s control. These risks and assumptions are described in Crestwood’s annual reports on Form 10-K and other reports that are available from the United States Securities and Exchange Commission. Readers are cautioned not to place undue reliance on forward-looking statements, which reflect management’s view only as of the date made. We undertake no obligation to update any forward-looking statement, except as otherwise required by law.

Tax Notice to Foreign Investors

This release serves as qualified notice to nominees under Treasury Regulation Sections 1.1446-4(b)(4) and (d). Please note that 100% of Crestwood’s distributions to foreign investors are attributable to income that is effectively connected with a United States trade or business. Accordingly, all of Crestwood’s distributions to foreign investors are subject to federal income tax withholding at the highest effective tax rate for individuals or corporations, as applicable. Nominees, and not Crestwood, are treated as the withholding agents responsible for withholding on the distributions received by them on behalf of foreign investors.


Contacts

Crestwood Equity Partners LP
Investor Contacts

Josh Wannarka, 713-380-3081
This email address is being protected from spambots. You need JavaScript enabled to view it.
Senior Vice President, Investor Relations, ESG & Corporate Communications

Rhianna Disch, 713-380-3006
This email address is being protected from spambots. You need JavaScript enabled to view it.
Director, Investor Relations

DUBLIN--(BUSINESS WIRE)--The "Iran Midstream Oil and Gas Industry Outlook to 2025" report has been added to ResearchAndMarkets.com's offering.


Summary

Iran Midstream Oil and Gas Industry Outlook to 2025 - Market Outlook for Liquefied Natural Gas (LNG), Liquids Storage, Pipelines, Underground Gas Storage and Gas Processing is a comprehensive report on midstream oil and gas industry in Iran. The report provides details such as name, type, operational status and operator for all active and planned (new build) LNG terminals, liquids storage terminals major trunk pipelines, underground gas storage sites and gas processing plants in Iran till 2025. Further, the report also offers recent developments, financial deals as well as latest contracts awarded in the country's midstream sector, wherever available.

Scope

  • Updated information related to all active, planned and announced LNG terminals, oil storage terminals, trunk pipelines, underground gas storage and gas processing plants in the country, including operator and equity details
  • Key mergers and acquisitions and asset transactions in the country's midstream oil and gas industry, where available
  • Latest developments, financial deals and awarded contracts related to midstream oil and gas industry in the country, wherever available

Reasons to Buy

  • Gain strong understanding of the country's midstream oil and gas industry
  • Facilitate decision making on the basis of strong historical and outlook of capacity/length data
  • Assess your competitor's major LNG terminals, oil storage terminals, trunk pipelines, underground gas storage sites and gas processing plants in the country
  • Analyze the latest developments, financial deals landscape and awarded contracts related to the country's midstream oil and gas industry

Key Topics Covered:

1. Tables & Figures

2. Introduction

3. Iran LNG Industry

3.1. Iran LNG Industry, Liquefaction

3.1.1. Iran LNG Industry, Liquefaction, Overview

3.1.2. Iran LNG Industry, Total Liquefaction Capacity

3.2. Iran LNG Industry, Liquefaction, Capacity by Company

3.3. Iran LNG Industry, Liquefaction, Capacity by Terminal

3.4. Iran LNG Industry, Liquefaction Asset Details

3.4.1. Iran LNG Industry, Liquefaction Planned Asset Details

4. Iran Oil Storage Industry

4.1. Iran Oil Storage Industry, Key Data

4.2. Iran Oil Storage Industry, Overview

4.3. Iran Oil Storage Industry, Storage Operations

4.3.1. Iran Oil Storage Industry, Total Storage Capacity

4.4. Iran Oil Storage Industry, Storage Capacity Share by Area

4.5. Iran Oil Storage Industry, Storage Capacity by Major Companies

4.6. Iran Oil Storage Industry, Storage Capacity by Terminal

4.7. Iran Oil Storage Industry, Asset Details

4.7.1. Iran Oil Storage Industry, Active Asset Details

4.7.2. Iran Oil Storage Industry, Planned Asset Details

5. Iran Oil and Gas Pipelines Industry

5.1. Iran Oil Pipelines

5.1.1. Iran Oil Pipelines, Key Data

5.2. Iran Oil Pipelines, Overview

5.3. Iran Oil and Gas Pipelines Industry, Crude Oil Pipeline Length by Major Companies

5.4. Iran Oil and Gas Pipelines Industry, Crude Oil Pipelines

5.5. Iran Oil and Gas Pipelines Industry, Petroleum Products Pipeline Length by Major Companies

5.6. Iran Oil and Gas Pipelines Industry, Petroleum Products Pipelines

5.7. Iran Oil and Gas Pipelines Industry, Oil Pipelines Asset Details

5.7.1. Iran Oil and Gas Pipelines Industry, Oil Pipelines Active Asset Details

5.7.2. Iran Oil and Gas Pipelines Industry, Oil Pipelines Planned Asset Details

5.8. Iran Gas Pipelines

5.8.1. Iran Gas Pipelines, Key Data

5.8.2. Iran Gas Pipelines, Overview

5.9. Iran Oil and Gas Pipelines Industry, Natural Gas Pipeline Length by Major Companies

5.10. Iran Oil and Gas Pipelines Industry, Natural Gas Pipelines

5.11. Iran Oil and Gas Pipelines Industry, Gas Pipelines Asset Details

5.11.1. Iran Oil and Gas Pipelines Industry, Gas Pipelines Active Asset Details

5.11.2. Iran Oil and Gas Pipelines Industry, Gas Pipelines Planned Asset Details

6. Iran Underground Gas Storage Industry

6.1. Iran Underground Gas Storage Industry, Key Data

6.2. Iran Underground Gas Storage Industry, Overview

6.3. Iran Underground Gas Storage Industry, Storage Capacity by Company

6.4. Iran Underground Gas Storage Industry, Storage Capacity by Area

6.5. Iran Underground Gas Storage Industry, Storage Capacity by Site

6.5.1. Iran Underground Gas Storage Industry, Storage Capacity by Active Sites

6.5.2. Iran Underground Gas Storage Industry, Storage Capacity by Planned Sites

6.6. Iran Underground Gas Storage Industry, Asset Details

6.6.1. Iran Underground Gas Storage Industry, Active Asset Details

6.6.2. Iran Underground Gas Storage Industry, Planned Asset Details

7. Iran Gas Processing Industry

7.1. Iran Gas Processing Industry, Key Data

7.2. Iran Gas Processing Industry, Overview

7.3. Iran Gas Processing Industry, Gas Processing Capacity by Major Companies

7.4. Iran Gas Processing Industry, Processing Plant Number by Plant Type

7.5. Iran Gas Processing Industry, Capacity Contribution of Various Provinces

7.6. Iran Gas Processing Industry, Active Gas Processing Capacity

7.7. Iran Gas Processing Industry, Planned Gas Processing Capacity

7.8. Iran Gas Processing Industry, Asset Details

7.8.1. Iran Gas Processing Industry, Active Asset Details

7.8.2. Iran Gas Processing Industry, Planned Asset Details

8. Recent Contracts

8.1. Detailed Contract Summary

8.1.1. Awarded Contracts

9. Financial Deals Landscape

9.1. Detailed Deal Summary

9.1.1. Acquisition

9.1.2. Debt Offerings

10. Recent Developments

10.1. Other Significant Developments

10.2. New Contracts Announcements

11. Appendix

For more information about this report visit https://www.researchandmarkets.com/r/bdmpu9


Contacts

ResearchAndMarkets.com
Laura Wood, Senior Press Manager
This email address is being protected from spambots. You need JavaScript enabled to view it.

For E.S.T Office Hours Call 1-917-300-0470
For U.S./CAN Toll Free Call 1-800-526-8630
For GMT Office Hours Call +353-1-416-8900

HOUSTON--(BUSINESS WIRE)--Cactus, Inc. (NYSE: WHD) (“Cactus”) today announced that its Board of Directors has approved the payment of a cash dividend of $0.09 per share of Class A common stock to be paid on March 18, 2021 to holders of record of Class A common stock at the close of business on March 1, 2021. A corresponding distribution of up to $0.09 per CW Unit has also been approved for holders of CW Units of Cactus Wellhead, LLC.

Declarations of any dividends in the future, and the amount of any such dividends, are subject to approval by Cactus’ Board of Directors.

About Cactus, Inc.

Cactus designs, manufactures, sells and rents a range of highly engineered wellhead and pressure control equipment. Its products are sold and rented principally for onshore unconventional oil and gas wells and are utilized during the drilling, completion and production phases of its customers’ wells. In addition, it provides field services for all its products and rental items to assist with the installation, maintenance and handling of the wellhead and pressure control equipment. Cactus operates service centers in the United States, which are strategically located in the key oil and gas producing regions, including the Permian, SCOOP/STACK, Marcellus, Utica, Haynesville, Eagle Ford and Bakken, among other areas, and in Eastern Australia.


Contacts

Cactus, Inc.
John Fitzgerald, 713-904-4655
Director of Corporate Development and Investor Relations
This email address is being protected from spambots. You need JavaScript enabled to view it.

CANONSBURG, Pa.--(BUSINESS WIRE)--#ETRN--Equitrans Midstream Corporation (NYSE: ETRN) will release its fourth quarter and full-year 2020 earnings on Tuesday, February 23, 2021, and will also host a conference call with analysts and investors at 10:30 am (ET). A brief Q&A session for ETRN security analysts will immediately follow the results discussion.


Call Access: All participants must pre-register online, in advance of the call. Upon completion, registered participants will receive a confirmation email that includes instructions for accessing the call, as well as a unique registration ID and passcode. Please pre-register using the appropriate online registration links below:

Security Analysts :: Audio Registration
Your email confirmation will contain dial-in information, along with your unique ID and passcode.

All Other Participants :: Webcast Registration
Your email confirmation will contain the webcast link, along with your unique ID and passcode.

An updated investor presentation will be available on ETRN’s Investor Relations website the day of the call.

Call Replay: For 14 days following the call, an audio replay will be available at (800) 585-8367 or (416) 621-4642. Conference ID: 4233629

About Equitrans Midstream Corporation

Equitrans Midstream Corporation (ETRN) has a premier asset footprint in the Appalachian Basin and, as the parent company of EQM Midstream Partners, is one of the largest natural gas gatherers in the United States. Through its strategically located assets in the Marcellus and Utica regions, ETRN has an operational focus on gas transmission and storage systems, gas gathering systems, and water services that support natural gas development and production across the Basin. With a rich 135-year history in the energy industry, ETRN was launched as a standalone company in 2018 with the vision to be the premier midstream services provider in North America. ETRN is helping to meet America’s growing need for clean-burning energy, while also providing a rewarding workplace and enriching the communities where its employees live and work.

For more information on Equitrans Midstream Corporation, visit www.equitransmidstream.com; and to learn more about our environmental, social, and governance practices visit ETRN Sustainability Reporting.

Source: Equitrans Midstream Corporation


Contacts

Analyst/Investor inquiries:
Nate Tetlow – Vice President, Corporate Development and Investor Relations
412-553-5834
This email address is being protected from spambots. You need JavaScript enabled to view it.

Media inquiries:
Natalie A. Cox – Communications and Corporate Affairs
412-395-3941
This email address is being protected from spambots. You need JavaScript enabled to view it.

HOUSTON--(BUSINESS WIRE)--Magellan Midstream Partners, L.P. (NYSE: MMP) and Enterprise Products Partners L.P. (NYSE:EPD) today announced that affiliates of the two companies have entered into an agreement to jointly develop a futures contract for the physical delivery of crude oil in the Houston area in response to market interest for a Houston-based index with greater scale, flow assurance and price transparency. The quality specifications will be consistent with a West Texas Intermediate (“WTI”) crude oil originating from the Permian Basin with delivery capabilities at either Magellan’s East Houston terminal or Enterprise’s ECHO terminal in Houston.


“The industry-recognized quality and consistency of Midland WTI crude oil at Magellan’s East Houston terminal, combined with flexible and reliable market access offered by both Magellan and Enterprise, make this joint effort a logical advancement for crude oil futures to provide added value for our customers, both domestically and globally,” said Michael Mears, Magellan’s chief executive officer.

“We are pleased to join with Magellan on this initiative, which will provide customers with enhanced flexibility, connectivity, market access and price transparency for their physical barrels of crude oil,” said A.J. “Jim” Teague, co-chief executive officer of Enterprise’s general partner. “This project will leverage the strengths of two major midstream infrastructure systems, featuring five pipelines serving the Permian Basin capable of delivering 2 million barrels per day of crude oil into the Houston market (with the potential for third-party pipelines to double the capacity of Permian Basin crude oil into the market), a robust Gulf Coast storage position, redundant connectivity to every refinery in the Houston area, and access to the largest network of crude oil export terminals located along the Houston Ship Channel.”

Magellan Midstream Partners, L.P. (NYSE: MMP) is a publicly traded partnership that primarily transports, stores and distributes refined petroleum products and crude oil. Magellan owns the longest refined petroleum products pipeline system in the country, with access to nearly 50% of the nation’s refining capacity, and can store more than 100 million barrels of petroleum products such as gasoline, diesel fuel and crude oil. More information is available at www.magellanlp.com.

Enterprise Products Partners L.P. is one of the largest publicly traded partnerships and a leading North American provider of midstream energy services to producers and consumers of natural gas, NGLs, crude oil, refined products and petrochemicals. Our services include: natural gas gathering, treating, processing, transportation and storage; NGL transportation, fractionation, storage and export and import terminals; crude oil gathering, transportation, storage and export and import terminals; petrochemical and refined products transportation, storage, export and import terminals and related services; and a marine transportation business that operates primarily on the United States inland and Intracoastal Waterway systems. The partnership’s assets include approximately 50,000 miles of pipelines; 260 million barrels of storage capacity for NGLs, crude oil, refined products and petrochemicals; and 14 Bcf of natural gas storage capacity. Please visit www.enterpriseproducts.com for more information.

This press release includes “forward-looking statements” as defined by the Securities and Exchange Commission. All statements, other than statements of historical fact, included herein that address activities, events, developments or transactions that Enterprise and its general partner, as well as Magellan expect, believe or anticipate will or may occur in the future are forward-looking statements. These forward-looking statements are subject to risks and uncertainties that may cause actual results to differ materially from expectations, including required approvals by regulatory agencies, the possibility that the anticipated benefits from such activities, events, developments or transactions cannot be fully realized, the possibility that costs or difficulties related thereto will be greater than expected, the impact of competition, and other risk factors included in Enterprises and Magellan’s reports filed with the Securities and Exchange Commission. Readers are cautioned not to place undue reliance on these forward-looking statements, which speak only as of their dates. Except as required by law, Enterprise and Magellan do not intend to update or revise their respective forward-looking statements, whether as a result of new information, future events or otherwise.


Contacts

Magellan Contacts
Paula Farrell, Investor Relations (918) 574-7650, This email address is being protected from spambots. You need JavaScript enabled to view it.
Bruce Heine, Media Relations (918) 574-7010, This email address is being protected from spambots. You need JavaScript enabled to view it.

Enterprise Contacts
Randy Burkhalter, Investor Relations (713) 381-6812 or (866) 230-0745, This email address is being protected from spambots. You need JavaScript enabled to view it.
Rick Rainey, Media Relations (713) 381-3635, This email address is being protected from spambots. You need JavaScript enabled to view it.

DUBLIN--(BUSINESS WIRE)--The "Oil & Gas Industry in India: Insights into Human Capital & Locations 2020" report has been added to ResearchAndMarkets.com's offering.


The most comprehensive report on the Oil & Gas industry, which covers the various sub-sectors in great detail. The workforce insights and compensation benchmarking will provide unparalleled insights across all business functions and seniority levels.

The objective of this report is to provide executives from the Oil & Gas industry anywhere in the globe, very relevant information which will help them:

  • Quantify cost and skill advantages in human resources that India offers
  • Select the right manufacturing destination within India based on their individual context
  • Obtain human resources and related data for business planning

This report has been created with a singular focus in mind - to help decision makers obtain the right set of data points and information to make decisions regarding locations and human resources pertaining to the Oil & Gas industry in India.

Key Topics Covered

1. Location Intelligence

  • Geographical Inputs
  • Developmental Parameters
  • Industrial Ecosystem
  • Co-located Industries
  • Global Companies Manufacturing in India

2. Workforce Insights & Compensation Benchmarking

  • Pyramid, Education & Salaries

3. Industry Insights

  • Availability of White-collar Workforce in Each Industry
  • Availability of Skills and Competencies
  • Workforce Intelligence
  • Factors Affecting Migration Preferences
  • Factors Affecting Job Changes

Companies Mentioned

  • Bharat Petroleum
  • Indian Oil Corporation Limited
  • Adani Wilmar
  • Reliance Industries
  • ONGC
  • GAIL
  • Chennai Petroleum Corporation Ltd.
  • Gulf Oil Lubricants
  • Biomax Fuels
  • Castrol
  • Numaligarh Refinery Limited
  • Shell
  • ExxonMobil

For more information about this report visit https://www.researchandmarkets.com/r/d7f2j6


Contacts

ResearchAndMarkets.com
Laura Wood, Senior Press Manager
This email address is being protected from spambots. You need JavaScript enabled to view it.

For E.S.T Office Hours Call 1-917-300-0470
For U.S./CAN Toll Free Call 1-800-526-8630
For GMT Office Hours Call +353-1-416-8900

Shape strategic responses through the phases of industry recovery

AMATSUJI STEEL BALL MFG. Co. Ltd., Compagnie de Saint-Gobain SA and CoorsTek Inc. will emerge as major ceramic balls market participants during 2021-2025

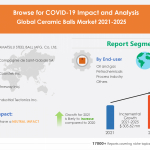
LONDON--(BUSINESS WIRE)--#GlobalCeramicBallsMarket--The ceramic balls market is expected to grow by USD 305.62 million during 2021-2025, according to Technavio. The report offers a detailed analysis of the impact of COVID-19 pandemic on the ceramic balls market in optimistic, probable, and pessimistic forecast scenarios.


Enterprises will go through the Response, Recovery, and Renew phases. Download a Free Sample Report on COVID-19

The ceramic balls market will witness a neutral impact during the forecast period owing to the widespread growth of the COVID-19 pandemic. As per Technavio’s pandemic-focused market research, market growth is likely to increase as compared to 2019.

With the continuing spread of the novel coronavirus pandemic, organizations across the globe are gradually flattening their recessionary curve by leveraging technology. Many businesses will go through response, recovery, and renewal phases. Building business resilience and enabling agility will aid organizations to move forward in their journey out of the COVID-19 crisis and towards the next normal.

This post-pandemic business planning research will aid clients to:

  • Adjust their strategic planning to move ahead once business stability kicks in.
  • Build resilience by making effective resource and investment choices for individual business units, products, and service lines.
  • Conceptualize scenario-based planning to mitigate future crisis situations.

Download the Post-Pandemic Business Planning Structure. Click here

Key Considerations for Market Forecast:

  • Impact of lockdowns, supply chain disruptions, demand destruction, and change in customer behavior
  • Optimistic, probable, and pessimistic scenarios for all markets as the impact of pandemic unfolds
  • Pre- as well as post-COVID-19 market estimates
  • Quarterly impact analysis and updates on market estimates

Gain instant access to 17,000+ market research reports by using

Technavio's SUBSCRIPTION platform

Related Report on Materials Industries:

Global Extruded Polypropylene Foam Market- The extruded polypropylene foam market is segmented by application (transport, packaging, building and construction, and others) and geography (APAC, Europe, North America, MEA, and South America). Click Here to Get an Exclusive Free Sample Report

Global Clear Brine Fluids Market- The clear brine fluids market is segmented by product (potassium chloride, calcium bromide, calcium chloride, sodium chloride, and others), geography (APAC, Europe, MEA, North America, and South America), and key vendors. Click Here to Get an Exclusive Free Sample Report

Major Three Ceramic Balls Market Participants:

AMATSUJI STEEL BALL MFG. Co. Ltd.

AMATSUJI STEEL BALL MFG. Co. Ltd. operates the business through the Unified segment. The company offers two types of balls made of ceramics namely, non-oxide ceramics (such as silicon nitride) and oxide ceramics (such as alumina and zirconia).

Compagnie de Saint-Gobain SA

Compagnie de Saint-Gobain SA operates the business through various segments such as High-Performance Solutions, Northern Europe, Southern Europe, Middle East, and Africa, the Americas, and Asia-Pacific. The company offers spherical ceramic balls that are used for applications including ceramic aerospace bearings, ceramic automotive bearings, float or level sensing, flow metering, gauging or alignment, valves, sprayers and pumps, and pollution or vapor control systems.

CoorsTek Inc.

CoorsTek Inc. operates the business through various segments such as Products, Materials, and Services. The company offers ceramic balls to be used in refining, petrochemical, and gas processing applications.

If you purchase a report that is updated in the next 60 days, we will send you the new edition and data extract FREE! Get report snapshot here to get a detailed market share analysis of market participants during COVID-19 lockdown: https://www.technavio.com/report/ceramic-balls-market-industry-analysis

Ceramic Balls Market 2021-2025: Segmentation

The ceramic balls market is segmented as below:

  • End-user
    • Oil And Gas
    • Petrochemicals
    • Process Industry
    • Others
  • Geography
    • APAC
    • Europe
    • North America
    • MEA
    • South America

The ceramic balls market is driven by the substitution of steel balls with ceramic balls. In addition, other factors such as the substitution of steel balls with ceramic balls are expected to trigger the ceramic balls market toward witnessing a CAGR of almost 13% during the forecast period.

Get more insights about the global trends impacting the future of ceramic balls market, Request Free Sample @ https://www.technavio.com/talk-to-us?report=IRTNTR46653

Market Drivers

Market Challenges

Market Trends

Vendor Landscape

  • Vendors covered
  • Vendor classification
  • Market positioning of vendors
  • Competitive scenario

About Us

Technavio is a leading global technology research and advisory company. Their research and analysis focuses on emerging market trends and provides actionable insights to help businesses identify market opportunities and develop effective strategies to optimize their market positions. With over 500 specialized analysts, Technavio’s report library consists of more than 17,000 reports and counting, covering 800 technologies, spanning across 50 countries. Their client base consists of enterprises of all sizes, including more than 100 Fortune 500 companies. This growing client base relies on Technavio’s comprehensive coverage, extensive research, and actionable market insights to identify opportunities in existing and potential markets and assess their competitive positions within changing market scenarios.


Contacts

Technavio Research
Jesse Maida
Media & Marketing Executive
US: +1 844 364 1100
UK: +44 203 893 3200
Email: This email address is being protected from spambots. You need JavaScript enabled to view it.
Website: www.technavio.com/

DUBLIN--(BUSINESS WIRE)--The "Cuba Upstream (Oil and Gas) Fiscal and Regulatory Guide" report has been added to ResearchAndMarkets.com's offering.


"Cuba Upstream (Oil and Gas) Fiscal and Regulatory Guide", presents the essential information relating to the terms which govern investment into Cuba's upstream oil and gas sector. The report sets out in detail the contractual framework under which firms must operate in the industry, clearly defining factors affecting profitability and quantifying the state's take from hydrocarbon production. Considering political, economic and industry specific variables, the report also analyses future trends for Cuba's upstream oil and gas investment climate.

Cuba offers acreage for upstream operations through production sharing agreements (PSAs). A new deepwater PSA model has been announced as part of Cuba's 1st Offshore Licensing round taking place between 2019-2021.

The licensing round includes 24 deepwater blocks in Cuba's Gulf of Mexico EEA. The new PSA model except from training fees does not include any royalties, surface fees and production bonuses. Cuba's fiscal changes since 2014 are increasingly attractive and favourable, especially for deep-water blocks. There is an increasing exploration interest during the last few years across the Caribbean region which might encourage investments in Cuba as well.

Taking into consideration that all peer countries of Cuba have higher exploration activity, Cuba's favourable terms are expected to remain in place over the following years with the objective to attract foreign investments and support its economy. However, the reinstated US sanctions, the sector uncertainty caused by the COVID-19 pandemic, the accelerated efforts towards the energy transition, and the frontier nature of the deep-water blocks may be barriers to investment.

Scope

  • Overview of current fiscal terms governing upstream oil and gas operations in Cuba
  • Assessment of the current fiscal regime's state take and attractiveness to investors
  • Charts illustrating the regime structure, and legal and institutional frameworks
  • Detail on legal framework and governing bodies administering the industry
  • Levels of upfront payments and taxation applicable to oil and gas production
  • Information on application of fiscal and regulatory terms to specific licenses
  • Outlook on future of fiscal and regulatory terms in Cuba

Reasons to Buy

  • Understand the complex regulations and contractual requirements applicable to Cuba's upstream oil and gas sector
  • Evaluate factors determining profit levels in the industry
  • Identify potential regulatory issues facing investors in the country's upstream sector
  • Utilize considered insight on future trends to inform decision-making

Key Topics Covered:

1. Executive Summary

1.1 Regime Overview - Production Sharing Agreements

1.2 Timeline

2. State Take Assessment

3. Key Fiscal Terms - Production Sharing Agreements

3.1 Royalties, Bonuses, and Fees

3.2 Cost Recovery

3.3 Profit Sharing

3.4 Direct Taxation

3.5 Indirect Taxation

3.6 State Participation

3.7 Natural Gas Provisions

3.8 Domestic Market Obligation

3.9 Local Content

3.10 Abandonment Provisions

3.11 Joint Committee

4. Regulation and Licensing

4.1 Legal Framework

4.2 Institutional Framework

4.3 Licensing Process

5. Appendix

For more information about this report visit https://www.researchandmarkets.com/r/ekbhmn


Contacts

ResearchAndMarkets.com
Laura Wood, Senior Press Manager
This email address is being protected from spambots. You need JavaScript enabled to view it.

For E.S.T Office Hours Call 1-917-300-0470
For U.S./CAN Toll Free Call 1-800-526-8630
For GMT Office Hours Call +353-1-416-8900

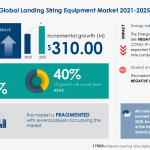
LONDON--(BUSINESS WIRE)--#GlobalLandingStringEquipmentMarket--The landing string equipment market is poised to grow by USD 310.00 million during 2021-2025 progressing at a CAGR of over 6% during the forecast period.


Worried about the impact of COVID-19 on your business? Here is an exclusive report talking about Market scenarios, Estimates, the impact of lockdown, and Customer Behaviour.

Get FREE Sample Report in Minutes!

The report on the landing string equipment market provides a holistic update, market size and forecast, trends, growth drivers, and challenges, as well as vendor analysis.

The report offers an up-to-date analysis regarding the current global market scenario, the latest trends and drivers, and the overall market environment. The market is driven by advances in landing string control systems.

The landing string equipment market analysis includes the application and geography landscape. This study identifies the increase in global offshore rig count as one of the prime reasons driving the landing string equipment market growth during the next few years.

This report presents a detailed picture of the market by the way of study, synthesis, and summation of data from multiple sources by an analysis of key parameters.

The landing string equipment market covers the following areas:

Landing String Equipment Market Sizing
Landing String Equipment Market Forecast
Landing String Equipment Market Analysis

Companies Mentioned

  • Enovate Systems Ltd.
  • Expro Holdings UK2 Ltd.
  • National Oilwell Varco Inc.
  • Quail Tools LP
  • Schlumberger Ltd.
  • Superior Energy Services Inc.
  • thyssenkrupp AG
  • Vallourec SA
  • WellPartner AS
  • Yantai Enerserva Machinery Co. Ltd.

Related Reports on Energy Include:

Global Petroleum Sorbent Pads Market- The petroleum sorbent pads market is segmented by end-user (oil and gas industry, chemical industry, manufacturing industry, and others), geography (North America, APAC, Europe, MEA, and South America), and key vendors. Click Here to Get an Exclusive Free Sample Report

Global Wet gas Meters Market- The wet gas meters market is segmented by application (onshore and offshore) and geography (APAC, Europe, MEA, North America, and South America). Click Here to Get an Exclusive Free Sample Report

Key Topics Covered:

Executive Summary

Market Landscape

  • Market ecosystem
  • Value chain analysis

Market Sizing

  • Market definition
  • Market segment analysis
  • Market size 2020
  • Market outlook: Forecast for 2020 - 2025

Five Forces Analysis

  • Five force summary
  • Bargaining power of buyers
  • Bargaining power of suppliers
  • Threat of new entrants
  • Threat of substitutes
  • Threat of rivalry
  • Market condition

Market Segmentation by Application

  • Market segments
  • Comparison by Application
  • Deepwater - Market size and forecast 2020-2025
  • Ultra-deepwater - Market size and forecast 2020-2025
  • Shallow water - Market size and forecast 2020-2025
  • Market opportunity by Application

Customer landscape

Geographic Landscape

  • Geographic segmentation
  • Geographic comparison
  • APAC - Market size and forecast 2020-2025
  • MEA - Market size and forecast 2020-2025
  • Europe - Market size and forecast 2020-2025
  • North America - Market size and forecast 2020-2025
  • South America - Market size and forecast 2020-2025
  • Key leading countries
  • Market opportunity by geography
  • Market drivers
  • Market challenges
  • Market trends

Vendor Landscape

  • Vendor Landscape
  • Landscape disruption

Vendor Analysis

  • Vendors covered
  • Market positioning of vendors
  • Enovate Systems Ltd.
  • Expro Holdings UK2 Ltd.
  • National Oilwell Varco Inc.
  • Quail Tools LP
  • Schlumberger Ltd.
  • Superior Energy Services Inc.
  • thyssenkrupp AG
  • Vallourec SA
  • WellPartner AS
  • Yantai Enerserva Machinery Co. Ltd.

Appendix

  • Scope of the report
  • Currency conversion rates for US$
  • Research methodology
  • List of abbreviations

Technavio suggests three forecast scenarios (optimistic, probable, and pessimistic) considering the impact of COVID-19. Technavio’s in-depth research has direct and indirect COVID-19 impacted market research reports.

Register for a free trial today and gain instant access to 17,000+ market research reports.

Technavio's SUBSCRIPTION platform

About Us

Technavio is a leading global technology research and advisory company. Their research and analysis focuses on emerging market trends and provides actionable insights to help businesses identify market opportunities and develop effective strategies to optimize their market positions. With over 500 specialized analysts, Technavio’s report library consists of more than 17,000 reports and counting, covering 800 technologies, spanning across 50 countries. Their client base consists of enterprises of all sizes, including more than 100 Fortune 500 companies. This growing client base relies on Technavio’s comprehensive coverage, extensive research, and actionable market insights to identify opportunities in existing and potential markets and assess their competitive positions within changing market scenarios.


Contacts

Technavio Research
Jesse Maida
Media & Marketing Executive
US: +1 844 364 1100
UK: +44 203 893 3200
Email: This email address is being protected from spambots. You need JavaScript enabled to view it.
Website: www.technavio.com/


HOUSTON--(BUSINESS WIRE)--Representatives of Kinder Morgan, Inc. (KMI) intend to make virtual presentations on January 27, 2021 at the Kinder Morgan 2021 Investor Day regarding the results for fiscal year 2020, the near-term outlook for 2021, as well as the long-term outlook for KMI.

Interested parties will be able to view the materials to be presented at the event by visiting KMI’s website at: https://ir.kindermorgan.com/events-and-presentations/default.aspx. The presentations will also be accessible by audio webcast (both live and on-demand) on KMI’s website at the same web address. Live presentations are scheduled to begin at 8 a.m. CT, and an archived webcast will remain available for 90 days on KMI’s website at the above address.

About Kinder Morgan

Kinder Morgan, Inc. (NYSE: KMI) is one of the largest energy infrastructure companies in North America. Access to reliable, affordable energy is a critical component for improving lives around the world. We are committed to providing energy transportation and storage services in a safe, efficient and environmentally responsible manner for the benefit of the people, communities and businesses we serve. We own an interest in or operate approximately 83,000 miles of pipelines and 144 terminals. Our pipelines transport natural gas, refined petroleum products, crude oil, condensate, CO2 and other products, and our terminals store and handle various commodities including gasoline, diesel fuel, chemicals, ethanol, metals and petroleum coke. For more information, please visit www.kindermorgan.com.


Contacts

Media Relations
(713) 420-6397
This email address is being protected from spambots. You need JavaScript enabled to view it.

Investor Relations
(800) 348-7320
This email address is being protected from spambots. You need JavaScript enabled to view it.

DENVER--(BUSINESS WIRE)--Liberty Oilfield Services Inc. (NYSE: LBRT) announced today that it will release its financial results for the fourth quarter and full-year 2020 after the market closes on Thursday, February 4, 2021. Following the release, the Company will host a conference call to discuss the results at 8:00 AM Mountain Time (10:00 AM Eastern Time) on Friday, February 5, 2021. Presenting the Company’s results will be Chris Wright, Chief Executive Officer, Ron Gusek, President and Michael Stock, Chief Financial Officer.


Individuals wishing to participate in the conference call should dial (833) 255-2827, or for international callers, (412) 902-6704. Participants should ask to join the Liberty Oilfield Services call. A live webcast will be available at http://investors.libertyfrac.com. The webcast can be accessed for 90 days following the call. A telephone replay will be available shortly after the call and can be accessed by dialing (877) 344-7529, or for international callers (412) 317-0088. The passcode for the replay is 10151812. The replay will be available until February 12, 2021.

About Liberty

Liberty is a leading North American oilfield services firm that offers one of the most innovative suites of completion services and technologies to onshore oil and natural gas exploration and production companies. Liberty was founded in 2011 with a relentless focus on developing and delivering next generation technology for the sustainable development of unconventional energy resources in partnership with our customers. Liberty is headquartered in Denver, Colorado. For more information about Liberty, please contact Investor Relations at This email address is being protected from spambots. You need JavaScript enabled to view it..


Contacts

Michael Stock
Chief Financial Officer
303-515-2851
This email address is being protected from spambots. You need JavaScript enabled to view it.

  • Orders of $5.2 billion for the quarter, up 2% sequentially and down 25% year-over-year.
  • Revenue of $5.5 billion for the quarter, up 9% sequentially and down 13% year-over-year.
  • GAAP operating income of $182 million for the quarter, up $231 million sequentially and down 45% year-over-year.
  • Adjusted operating income (a non-GAAP measure) of $462 million for the quarter, up 98% sequentially and down 15% year-over-year.
  • GAAP diluted earnings per share of $0.91 for the quarter which included $(0.98) per share of adjusting items. Adjusted diluted earnings per share (a non-GAAP measure) were $(0.07).
  • Cash flows generated from operating activities were $378 million for the quarter. Free cash flow (a non-GAAP measure) for the quarter was $250 million.

    The Company presents its financial results in accordance with GAAP. However, management believes that using additional non-GAAP measures will enhance the evaluation of the profitability of the Company and its ongoing operations. Please see Tables 1a, 1b and 1c in the section entitled "Charges & Credits" for a reconciliation of GAAP to non-GAAP financial measures.  Certain columns and rows in our tables and financial statements may not sum up due to the use of rounded numbers. 

LONDON & HOUSTON--(BUSINESS WIRE)--Baker Hughes Company (NYSE: BKR) ("Baker Hughes" or the "Company") announced results today for the fourth quarter and total year 2020.


Three Months Ended


Variance

(in millions except per share amounts)

December 31,
2020

September 30,
2020

December 31,
2019


Sequential

Year-over-
year

Orders

$

5,188


$

5,106


$

6,944


2%

(25)%

Revenue

5,495


5,049


6,347


9%

(13)%

Operating income (loss)

182


(49)


331


F

(45)%

Adjusted operating income (non-GAAP)

462


234


546


98%

(15)%

Net income (loss) attributable to Baker Hughes

653


(170)


48


F

F

Adjusted net income (non-GAAP) attributable to Baker Hughes

(50)


27


179


U

U

Diluted EPS attributable to Class A shareholders

0.91


(0.25)


0.07


F

F

Adjusted diluted EPS (non-GAAP) attributable to Class A shareholders

(0.07)


0.04


0.27


U

U

Cash flow from operating activities

378


219


1,357


73%

(72)%

Free cash flow (non-GAAP)

250


52


1,053


F

(76)%

"F" is used in most instances when variance is above 100%. Additionally, "U" is used in most instances when variance is below (100)%.

We are pleased with our fourth quarter and full year results while navigating the impacts of the global pandemic and industry downturn. Despite an incredibly challenging year for the industry in 2020, we generated over $500 million in free cash flow, booked $6.4 billion in TPS orders, and executed on our substantial cost-out and restructuring program. We also took several important steps to accelerate our strategy and invest in energy transition technologies, helping to position the company for the future. I cannot thank our employees enough for their hard work and dedication to achieve our goals and move the company forward,” said Lorenzo Simonelli, Baker Hughes chairman and chief executive officer.

As we look ahead to 2021, we are cautiously optimistic that the global economy and oil demand will begin to recover from the impact of the global pandemic. We believe this macro environment likely translates into a tepid investment environment for oil and gas during the first half of 2021. However, we expect spending and activity levels to gain momentum through the year as the macro environment improves, likely setting up the industry for stronger growth in 2022.

Baker Hughes is well placed to navigate the current market environment and positioned to lead the energy transition. We remain focused on executing for customers, being disciplined on cost, and delivering for our shareholders,” concluded Simonelli.

Quarter Highlights

Supporting our Customers

The OFS segment was awarded several large contracts for drilling and completions in the fourth quarter. Equinor awarded Baker Hughes a significant portion of the drilling and well completions contracts for Phase 1 of the Bacalhau field in offshore Brazil. OFS will provide an integrated well services package for Equinor across multiple product lines, including drilling services, drill bits, drilling and completion fluids, cementing, stimulation, fishing services, and completion equipment.

OFS also secured artificial lift contracts in multiple regions, continuing to demonstrate OFS’ differentiated portfolio in electrical submersible pumping systems (ESPs) and digital monitoring solutions. Commercial agreements for artificial lift equipment and services included a seven-year contract with a customer in the Middle East, a six-year contract with a customer in Italy, and a four-year contract with a customer in the Russia Caspian region.

The OFE segment secured a major equipment order with Eni for the Agogo offshore oilfield in Angola. Consistent with Baker Hughes' Subsea Connect strategy, the order includes multiple subsea trees, wellheads, manifolds, flexible jumpers, distribution units, and controls systems for subsea and the topside.

The TPS segment was awarded a major contract by South Gas Company (SGC) in Iraq for the design, manufacturing, delivery, construction and commissioning of an integrated facility for the processing and production of natural gas. The facility is expected to have a capacity of 200 million standard cubic feet of natural gas per day and utilize previously flared natural gas from the Nassiriya and Gharraf oil fields, reducing emissions by an estimated 6+ million tons of CO2 annually. Baker Hughes will act as an overall solution provider for SGC, overseeing construction and startup of the facility as well as supplying compression equipment, digital monitoring systems and multiple services.

TPS was also awarded several LNG contracts in the fourth quarter, booking an order with longtime partner Qatar Petroleum for power generation equipment for the North Field East LNG project following the third quarter order for the main refrigerant compressors.

The Digital Solutions segment secured a major contract with Petrobras as a follow up to a third quarter award for a three-year frame agreement. The fourth quarter contract will provide a suite of digital solutions and services to optimize productivity, reduce operational and safety risks, and lower carbon emissions across Petrobras sites in Brazil. Petrobras will accelerate its digital transformation, adopting the latest Bently Nevada condition monitoring and protection platform as well as remote monitoring and diagnostics capability. The contract also includes Nexus Controls systems and cybersecurity solutions, flare monitoring and calibration technologies, and Flare.IQ advanced flare gas monitoring and optimization system.

Executing on Priorities

The OFS Chemicals product line secured multiple upstream and downstream chemicals contracts, including a multi-year contract to provide hydrocarbon and water treatment services at one of the largest U.S. refineries. In Asia, Chemicals secured multiple contracts in Thailand, China, Australia, and Malaysia, providing additional regional volume as OFS plans to open its first chemicals manufacturing facility in the region in 2022.

TPS secured several upgrade orders for the supply of high efficiency compression equipment to help extend the field life of projects in the North Sea, Sub-Saharan Africa and in North West Kazakhstan for the Karachaganak Expansion Project-1A operated by Karachaganak Petroleum Operating B.V. Baker Hughes high pressure-reinjection compressors will be used within the 5th Injection Compressor facility, thus helping to extend the duration of the liquid production plateau.

TPS continued executing on LNG projects in the quarter, with multiple equipment modules shipped from Italy to the U.S. for the Calcasieu Pass LNG project with Venture Global LNG. TPS also completed all three LM9000 string tests for power generation and mechanical drive for the Arctic LNG 2 project led by NOVATEK PAO and shipped compression equipment as well as electrical generator and gas turbine packages for the first of three gravity-based structures.

DS secured several North American contracts to enhance operations, improve productivity and drive digital transformation across the energy sector. The Bently Nevada product line secured a contract with a major hydroelectric operator in the U.S. to provide its Orbit 60 system, System 1 software and a five-year services agreement for industrial asset management across multiple dams. Bently Nevada will also provide its System 1 software to American Electric Power (AEP) for several plants in its generation fleet, allowing AEP to monitor live data from and diagnose issues as needed.

DS also continued to expand in industrial end markets. The Waygate Technologies (WT) business secured a significant order with a global leading Asian automaker for its latest Phoenix Speedscan HD system, providing automated inline computed tomography to inspect aluminum cylinder heads for automotive engines. In the aerospace market, WT developed an ‘intelligent borescope’ solution with Rolls-Royce, significantly reducing the time to inspect a jet engine and offering integration between the borescope, app, and turning tool that has not been available to the segment before. The Druck product line also secured multiple military aerospace contracts in Europe, Asia, and North America for aircraft sensors and instrumentation.

Leading with Innovation

Baker Hughes continued to develop technologies to advance the energy transition, improve efficiencies, and reduce emissions for customers. The Company acquired Compact Carbon Capture (3C), a pioneering technology development company specializing in carbon capture solutions. The acquisition underpins Baker Hughes’ strategic commitment to lead in the energy transition and provide differentiated decarbonization solutions for carbon-intensive industries.

Baker Hughes also announced a joint service offering with Wurth Industry North America (WINA) to expand additive manufacturing solutions for Wurth’s 80,000+ global customers. Together, WINA and Baker Hughes will provide advanced design, digital inventory, and customized 3D printing services in a range of industrial applications. Through 3D printing at scale, customers are capable of supply chain logistics-related emissions by moving production closer to the point of consumption.

OFE launched engageSubsea remote, an extension of its engageSubsea platform. EngageSubsea provides a single platform for equipment inspection, operational management and technical support, driving operational excellence and increasing capital productivity for offshore oil and gas operations. The latest remote capabilities further allow operators to cut costs, reduce downtime, improve efficiency, and minimize safety and travel risks. EngageSubsea remote is already a proven technology with live deployments with customers in the Norwegian Continental Shelf and at Baker Hughes services facilities.

DS launched the world’s fastest pressure controller from Druck, known as PACE CM3, as well as Druck’s next generation of pressure sensors, the ADROIT6000. Druck’s technological leadership in pressure sensor solutions continues to deliver exceptional performance and class-leading reliability and stability for customers across multiple industrial markets.

The BakerHughesC3.ai joint venture alliance (BHC3) continued to see interest in AI-based software. In the fourth quarter, a Malaysian-based company adopted BCH3’s technology to detect failure and improve maintenance decisions on gas compressors and control valves. In addition, a Latin American customer adopted BHC3 Reliability to further improve the early warning systems and scheduled maintenance of ESPs.

Consolidated Results by Reporting Segment

Consolidated Orders by Reporting Segment

(in millions)

Three Months Ended


Variance

Consolidated segment orders

December 31,
2020

September 30,
2020

December 31,
2019


Sequential

Year-over-
year

Oilfield Services

$

2,266


$

2,296


$

3,284


(1)

%

(31)

%

Oilfield Equipment

561


432


1,104


30

%

(49)

%

Turbomachinery & Process Solutions

1,832


1,885


1,910


(3)

%

(4)

%

Digital Solutions

528


493


645


7

%

(18)

%

Total

$

5,188


$

5,106


$

6,944


2

%

(25)

%

Orders for the quarter were $5,188 million, up 2% sequentially and down 25% year-over-year. The sequential increase was a result of higher order intake in Oilfield Equipment, and Digital Solutions, partially offset by lower orders in Oilfield Services, and Turbomachinery & Process Solutions. Equipment orders were down 10% sequentially and service orders were up 13%.

Year-over-year, the decline in orders was a result of lower order intake across all segments. Year-over-year equipment orders were down 30% and service orders were down 21%.

The Company's total book-to-bill ratio in the quarter was 0.9; the equipment book-to-bill ratio in the quarter was 0.9.

Remaining Performance Obligations (RPO) in the fourth quarter ended at $23.4 billion, an increase of $0.4 billion from the third quarter of 2020. Equipment RPO was $8.0 billion, down 3% sequentially. Services RPO was $15.4 billion, up 5% sequentially.

Consolidated Revenue by Reporting Segment

(in millions)

Three Months Ended


Variance

Consolidated segment revenue

December 31,
2020

September 30,
2020

December 31,
2019


Sequential

Year-over-
year

Oilfield Services

$

2,282


$

2,308


$

3,292


(1)

%

(31)

%

Oilfield Equipment

712


726


765


(2)

%

(7)

%

Turbomachinery & Process Solutions

1,946


1,513


1,632


29

%

19

%

Digital Solutions

556


503


659


10

%

(16)

%

Total

$

5,495


$

5,049


$

6,347


9

%

(13)

%

Revenue for the quarter was $5,495 million, an increase of 9%, sequentially. The increase was driven by Turbomachinery & Process Solutions and Digital Solutions, partially offset by Oilfield Services and Oilfield Equipment.

Compared to the same quarter last year, revenue was down 13%, driven by lower volume across the Oilfield Services, Oilfield Equipment, and Digital Solutions segments, partially offset by Turbomachinery & Process Solutions.

Consolidated Operating Income by Reporting Segment

(in millions)

Three Months Ended


Variance

Segment operating income

December 31,
2020

September 30,
2020

December 31,
2019


Sequential

Year-over-
year

Oilfield Services

$

142


$

93


$

235


53

%

(40)

%

Oilfield Equipment

23


19


16


22

%

47

%

Turbomachinery & Process Solutions

332


191


305


74

%

9

%

Digital Solutions

76


46


109


66

%

(30)

%

Total segment operating income

573


349


665


64

%

(14)

%

Corporate

(111)


(115)


(118)


3

%

6

%

Inventory impairment

(27)


(42)


34

%

U

Restructuring, impairment & other

(229)


(209)


(159)


(10)

%

(44)

%

Separation related

(24)


(32)


(57)


24

%

57

%

Operating income (loss)

182


(49)


331


F

(45)

%

Adjusted operating income*

$

462


$

234


$

546


98

%

(15)

%

*Non-GAAP measure.

"F" is used in most instances when variance is above 100%. Additionally, "U" is used in most instances when variance is below (100)%.

On a GAAP basis, operating income for the fourth quarter of 2020 was $182 million. Operating income increased $230 million sequentially and decreased $149 million year-over-year. Total segment operating income was $573 million for the fourth quarter of 2020, up 64% sequentially and down 14% year-over-year.

Adjusted operating income (a non-GAAP measure) for the fourth quarter of 2020 was $462 million, which excludes adjustments totaling $281 million before tax, mainly related to restructuring and separation related charges. A complete list of the adjusting items and associated reconciliation from GAAP has been provided in Table 1a in the section entitled “Charges and Credits.” Adjusted operating income for the fourth quarter was up 98% sequentially, driven by margin expansion across all segments. Adjusted operating income was down 15% year-over-year driven by lower margins in the Oilfield Services, and Digital Solutions segments, partially offset by higher margins in Turbomachinery & Process Solutions, and Oilfield Equipment.

Depreciation and amortization for the fourth quarter of 2020 was $307 million.

Corporate costs were $111 million in the fourth quarter of 2020, down 3% sequentially and down 6% year-over-year.

Other Financial Items

Income tax expense in the fourth quarter of 2020 was $568 million.

GAAP diluted earnings per share was $0.91. Adjusted diluted loss per share was $(0.07). Excluded from adjusted diluted earnings per share were all items listed in Table 1a in the section entitled "Charges and Credits" as well as the "other adjustments (non-operating)" found in Table 1b.

Cash flows generated from operating activities were $378 million for the fourth quarter of 2020. Free cash flow (a non-GAAP measure) for the quarter was $250 million. A reconciliation from GAAP has been provided in Table 1c in the section entitled "Charges and Credits."

Capital expenditures, net of proceeds from disposal of assets, were $127 million for the fourth quarter of 2020.

Results by Reporting Segment

The following segment discussions and variance explanations are intended to reflect management's view of the relevant comparisons of financial results on a sequential or year-over-year basis, depending on the business dynamics of the reporting segments.

Oilfield Services

(in millions)

Three Months Ended


Variance

Oilfield Services

December 31,
2020

September 30,
2020

December 31,
2019


Sequential

Year-over-
year

Revenue

$

2,282


$

2,308


$

3,292


(1)%

(31)%

Operating income

$

142


$

93


$

235


53%

(40)%

Operating income margin

6.2

%

4.0

%

7.1

%


2.2pts

-0.9pts

Oilfield Services (OFS) revenue of $2,282 million for the fourth quarter decreased by $26 million, or 1%, sequentially.

North America revenue was $621 million, up 11% sequentially. International revenue was $1,661 million, a decrease of 5% sequentially, driven by Asia Pacific, the Middle East, and Europe. From a product line perspective, the sequential decline of (1)% in OFS was driven primarily by Wireline and Completions, partially offset by Artificial Lift.

Segment operating income before tax for the quarter was $142 million. Operating income for the fourth quarter of 2020 was up $49 million, or 53%, sequentially, primarily driven by cost productivity.

Oilfield Equipment

(in millions)

Three Months Ended


Variance

Oilfield Equipment

December 31,
2020

September 30,
2020

December 31,
2019


Sequential

Year-over-
year

Orders

$

561


$

432


$

1,104


30%

(49)%

Revenue

$

712


$

726


$

765


(2)%

(7)%

Operating income

$

23


$

19


$

16


22%

47%

Operating income margin

3.2

%

2.6

%

2.1

%


0.6pts

1.2pts

Oilfield Equipment (OFE) orders were down $544 million, or 49%, year-over-year, driven primarily by lower equipment order intake across all business segments. Equipment orders were down 54% year-over-year and services orders were down 33% year-over-year.

OFE revenue of $712 million for the quarter decreased $53 million, or 7%, year-over-year. The decrease was driven by lower volume in the Services business, and from the sale of the Surface Pressure Control flow business in the quarter. These decreases were partially offset by higher volume in the Subsea Production Systems, and Flexible Pipe businesses.

Segment operating income before tax for the quarter was $23 million, up $7 million year-over-year. The increase was driven primarily by cost productivity.

Turbomachinery & Process Solutions

(in millions)

Three Months Ended


Variance

Turbomachinery & Process Solutions

December 31,
2020

September 30,
2020

December 31,
2019


Sequential

Year-over-
year

Orders

$

1,832


$

1,885


$

1,910


(3)%

(4)%

Revenue

$

1,946


$

1,513


$

1,632


29%

19%

Operating income

$

332


$

191


$

305


74%

9%

Operating income margin

17.1

%

12.6

%

18.7

%


4.5pts

-1.6pts

Turbomachinery & Process Solutions (TPS) orders were down 4% year-over-year. Equipment orders were down 10% year-over-year and service orders were up 2% year-over-year.

TPS revenue of $1,946 million for the quarter increased $314 million, or 19%, year-over-year. The increase was driven by higher equipment and projects revenue, partially offset by lower services volume. Equipment revenue in the quarter represented 54% of total segment revenue, and Service revenue represented 46% of total segment revenue.

Segment operating income before tax for the quarter was $332 million, up $27 million, or 9%, year-over-year. The increase was driven primarily by volume and productivity, partially offset by a higher mix of equipment revenue.

Digital Solutions

(in millions)

Three Months Ended


Variance

Digital Solutions

December 31,
2020

September 30,
2020

December 31,
2019


Sequential

Year-over-
year

Orders

$

528


$

493


$

645


7%

(18)%

Revenue

$

556


$

503


$

659


10%

(16)%

Operating income

$

76


$

46


$

109


66%

(30)%

Operating income margin

13.8

%

9.2

%

16.6

%


4.6pts

-2.8pts

Digital Solutions (DS) orders were down 18% year-over-year, driven primarily by lower order intake in the Waygate Technologies, Bently Nevada and Process & Pipeline Services businesses, partially offset by higher volume in Reuter Stokes.

DS revenue of $556 million for the quarter decreased 16% year-over-year, driven by lower volume across all product lines.

Segment operating income before tax for the quarter was $76 million, down 30% year-over-year. The decrease year-over-year was primarily driven by lower volume.

2020 Total Year Results


Twelve Months Ended


Orders

December 31, 2020

December 31, 2019

Variance
Year-over-year

Oilfield Services

$

10,119


$

12,902


(22)%

Oilfield Equipment

2,184


3,517


(38)%

Turbomachinery and Process Solutions

6,424


7,947


(19)%

Digital Solutions

1,986


2,607


(24)%

Total Orders

$

20,714


$

26,973


(23)%


Revenue


Oilfield Services

$

10,140


$

12,889


(21)%

Oilfield Equipment

2,844


2,921


(3)%

Turbomachinery and Process Solutions

5,705


5,536


3%

Digital Solutions

2,015


2,492


(19)%

Total Revenue

$

20,705


$

23,838


(13)%


Segment operating income


Oilfield Services

$

487


$

917


(47)%

Oilfield Equipment

19


55


(65)%

Turbomachinery and Process Solutions

805


719


12%

Digital Solutions

193


343


(44)%

Total segment operating income

1,504


2,035


(26)%

Corporate

(464)


(433)


(7)%

Inventory impairment

(246)


U

Goodwill impairment

(14,773)


U

Restructuring, impairment & other

(1,866)


(342)


U

Separation related

(134)


(184)


27%

Operating income

(15,978)


1,074


U

Adjusted operating income(a)

$

1,040


$

1,602


(35)%

(a) Adjusted operating income, a non-GAAP measure, excludes inventory impairment, goodwill impairment, restructuring, impairment & other charges, and separation related costs from GAAP operating income.

Charges & Credits

Table 1a. Reconciliation of GAAP and Adjusted Operating Income/(Loss)


Three Months Ended

(in millions)

December 31,
2020

September 30,
2020

December 31,
2019

Operating income (loss) (GAAP)

$

182


$

(49)


$

331


Separation related

24


32


57


Restructuring, impairment & other

229


209


159


Inventory impairment

27


42


Total operating income adjustments

281


283


216


Adjusted operating income (non-GAAP)

$

462


$

234


$

546


Table 1a reconciles operating income (loss), which is the directly comparable financial result determined in accordance with Generally Accepted Accounting Principles (GAAP), to adjusted operating income (loss) (a non-GAAP financial measure). Adjusted operating income excludes the impact of certain identified items.

Table 1b. Reconciliation of GAAP and Non-GAAP Net Income


Three Months Ended

(in millions, except per share amounts)

December 31,
2020

September 30,
2020

December 31,
2019

Net income (loss) attributable to Baker Hughes (GAAP)

$

653


$

(170)


$

48


Total operating income adjustments (identified items)

281


283


216


Other adjustments (non-operating) (1)

(1,412)


90


Tax effect on total adjustments and other tax items (2)

114


(54)


(9)


Total adjustments, net of income tax

(1,017)


319


207


Less: adjustments attributable to noncontrolling interests

(314)


122


76


Adjustments attributable to Baker Hughes

(703)


197


131


Adjusted net income (loss) attributable to Baker Hughes (non-GAAP)

$

(50)


$

27


$

179


Denominator:


Weighted-average shares of Class A common stock outstanding diluted

713


678


653


Adjusted diluted earnings (loss) per Class A share (non-GAAP)

$

(0.07)


$

0.04


$

0.27


Contacts

Investor Relations
Jud Bailey
+1 281-809-9088
This email address is being protected from spambots. You need JavaScript enabled to view it.

Media Relations
Thomas Millas
+1 713-879-2862
This email address is being protected from spambots. You need JavaScript enabled to view it.


Read full story here
Offshore Source Logo

Offshore Source keeps you updated with relevant information concerning the Offshore Energy Sector.

Any views or opinions represented on this website belong solely to the author and do not represent those of the people, institutions or organizations that Offshore Source or collaborators may or may not have been associated with in a professional or personal capacity, unless explicitly stated.

Corporate Offices

Technology Systems Corporation
8502 SW Kansas Ave
Stuart, FL 34997

info@tscpublishing.com