Business Wire News

STAFFORD, Va.--(BUSINESS WIRE)--BAE Systems has received a $184 million contract option from the U.S. Marine Corps for 36 additional Amphibious Combat Vehicles (ACV) under full-rate production. The order demonstrates the Marine Corps’ confidence in a program that is on track to deliver this critical capability to the Marines.


This contract award will cover production, fielding, and support costs for the ACV personnel carrier (ACV-P) variant. BAE Systems was awarded the first full-rate production contract option in December for the first 36 vehicles. This option on that contract increases the total number of vehicles under full-rate production to 72, for a total value of $366 million.

“The exercising of this option validates years of teamwork in partnership with the Marines to provide the most adaptable amphibious vehicle possible to meet their expeditionary needs,” said John Swift, director of amphibious programs at BAE Systems. “The ACV was designed to meet the Marines’ needs of today while allowing for growth to meet future mission role requirements.”

The ACV is a highly mobile, survivable, and adaptable platform for conducting rapid ship-to-shore operations and brings enhanced combat power to the battlefield. BAE Systems is under contract to deliver two variants to the Marine Corps under the ACV Family of Vehicles program: the ACV-P and the ACV command variant (ACV-C). A 30mm cannon (ACV-30) is currently under contract for design and development and a recovery variant (ACV-R) is also planned.

The Marine Corps selected BAE Systems along with teammate Iveco Defence Vehicles for the ACV program in 2018 to replace its legacy fleet of Assault Amphibious Vehicles (AAV), also built by BAE Systems. BAE Systems was also recently awarded an indefinite delivery indefinite quantity (IDIQ) contract worth up to $77 million for the ACV program that includes the provision of spare and replacement parts, testing equipment, and other services.

ACV production and support is taking place at BAE Systems locations in Stafford, Virginia; San Jose, California; Sterling Heights, Michigan; Aiken, South Carolina; and York, Pennsylvania.


Contacts

Elizabeth Delano
Mobile: +001 (408) 289-2312
This email address is being protected from spambots. You need JavaScript enabled to view it.

www.baesystems.com/US
@BAESystemsInc

Q4 Revenue of $249.4 million; an increase of 16.8% from Q419; 2020 Full Year Revenue of $794.2 million, an increase of 1.1% over 2019

Q4 GAAP Gross Margin of 25.5%; Non-GAAP Gross Margin of 27.0%

Q4 GAAP Operating Margin of (1.8%); Non-GAAP Operating Margin of 4.8%

Q4 GAAP EPS of ($0.16); Adjusted EPS of ($0.08)

SAN JOSE, Calif.--(BUSINESS WIRE)--Bloom Energy Corporation (NYSE: BE) today announced financial results for its fourth quarter and full year that ended December 31, 2020.


Fourth Quarter Financial Highlights

  • Revenue of $249.4 million in the fourth quarter of 2020, an increase of 16.8% compared to revenue of $213.5 million in the fourth quarter of 2019, primarily driven by a 16.6% increase in acceptances.
  • 450 acceptances, or 45.0 megawatts (MW), a 16.6% increase year-over-year. Recall that an acceptance typically occurs when the system is turned on and producing full power. For orders where one of our partners performs the installation, our acceptance criteria are different. Those acceptances are generally achieved when the systems are shipped or delivered to our partner. Upon acceptance, the customer order is moved from product backlog and is recognized as revenue.
  • Gross margin of 25.5% in the fourth quarter of 2020, an increase of 13.8 percentage points compared to gross margin of 11.7% in the fourth quarter of 2019, primarily driven by an improvement in product gross margin from 10.5% to 38.8% over the same period. This improvement in product gross margins was driven by product cost reductions outpacing ASP reductions.
  • Excluding stock-based compensation, non-GAAP gross margin was 27.0% in the fourth quarter of 2020, an increase of 11.3 percentage points compared to non-GAAP gross margin of 15.7% in the fourth quarter of 2019, primarily driven by an improvement in product gross margin.
  • Operating margin of (1.8%) in the fourth quarter of 2020, an improvement of 20.6 percentage points compared to operating margin of (22.4%) in the fourth quarter of 2019, driven by the improvements in gross margin and a $14.6 million reduction in stock-based compensation expenses burdening operating expenses.
  • Excluding stock-based compensation, non-GAAP operating margin was 4.8% in the fourth quarter of 2020, an improvement of 10.3 percentage points compared to non-GAAP operating margin of (5.5%) in the fourth quarter of 2019, driven by an improvement in gross margin.
  • GAAP EPS of ($0.16) and Adjusted EPS of ($0.08) in the fourth quarter of 2020, compared to GAAP EPS of ($0.58) and Adjusted EPS of ($0.29) in the fourth quarter of 2019.

Full Year 2020 Financial Highlights

  • Revenue of $794.2 million in 2020, an increase of 1.1% compared to revenue of $785.2 million in 2019, primarily driven by an 11.1% increase in acceptances and offset by the favorable impact of the PPA II upgrade on revenue in 2019.
  • 1,326 acceptances, or 132.6 MW, an 11.1% increase versus full year 2019.
  • Gross margin of 20.9% in 2020, an increase of 8.5 percentage points compared to gross margin of 12.4% in 2019, primarily driven by an improvement in product gross margin of from 21.9% to 35.8%. This improvement was driven by our product cost reductions outpacing ASP reductions.
  • Excluding stock-based compensation, non-GAAP gross margin of 23.1% in 2020, an increase of 4.9 percentage points compared to non-GAAP gross margin of 18.2% in 2019, driven primarily by an improvement in product gross margin.
  • Operating margin of (10.2%) in 2020, an improvement of 19.4 percentage points compared to operating margin of (29.6%) in 2019, driven by the improvement in gross margin and a $94.4 million reduction in stock-based compensation expenses burdening operating expenses.
  • Excluding stock-based compensation, non-GAAP operating margin of (0.9%) in 2020, an improvement of 3.8 percentage points compared to non-GAAP operating margin of (4.7%) in 2019, driven primarily by an improvement in gross margin.
  • GAAP EPS of ($1.14) and Adjusted EPS of ($0.67) in 2020, compared to GAAP EPS of ($2.67) and Adjusted EPS of ($1.07) in 2019.

KR Sridhar, founder, chairman, and chief executive officer, Bloom Energy, commented: “2020 was a year unlike any other in modern history as we dealt with the dual challenges of the COVID-19 global pandemic and an uncertain economy. Yet, Bloom Energy’s management team and employees proved resilient in executing our business plan, delivering strong financial performance, solid operating results and significantly improving our balance sheet. We are well-positioned for growth as we implement our technology road map and build applications for the Bloom Energy Server that solve critical energy problems like resiliency, reducing carbon emissions and costs. As we enter 2021, there are many positive developments. The Biden Administration is embracing proactive climate change policies and continuing a low-interest environment while focusing on critical infrastructure investments that fit well with our strategic approach. And, beyond the United States, there is significant momentum in Asia and opportunities to grow in other markets around the world. We believe our work in 2020 provides a spring board for success in 2021 and beyond.”

Greg Cameron, executive vice president and chief financial officer, Bloom Energy, commented: “We were encouraged by the financial performance during the fourth quarter of 2020 across revenue, gross margin, operating income and cash. Our bookings in the second half of the year gained momentum, and we have a strong backlog for 2021 that provides high project visibility into our 2021 guidance framework and improving cash flow outlook. We continue to make significant progress on reducing our product costs, and our technology investments remain on track.”

Summary of Key Financial Metrics

Preliminary Summary GAAP Profit and Loss Statements


($000)

Q420

Q320

Q419

FY20

FY19


Revenue

249,387

200,305

213,543

794,247

785,177

Cost of Revenue

185,761

144,318

188,595

628,454

687,590

Gross Profit

63,626

55,987

24,948

165,793

97,587

Gross Margin

25.5%

28.0%

11.7%

20.9%

12.4%

Operating Expenses

68,144

56,359

72,820

246,578

330,391

Operating Loss

(4,518)

(372)

(47,872)

(80,785)

(232,804)

Operating Margin

(1.8%)

(0.2%)

(22.4%)

(10.2%)

(29.6%)

Non-operating Expenses1

22,620

11,582

20,415

76,768

74,064

Net Loss

(27,138)

(11,954)

(68,287)

(157,553)

(306,868)

GAAP EPS

($0.16)

($0.09)

($0.58)

($1.14)

($2.67)

1.

Non-Operating Expenses and tax provision and non-controlling interest

Preliminary Summary Non-GAAP Financial Information1
 

($000)

Q420

Q320

Q419

FY20

FY19


Revenue

249,387

200,305

213,543

794,247

785,177

Cost of Revenue2

182,097

140,750

180,001

610,979

642,161

Gross Profit2

67,290

59,555

33,542

183,268

143,016

Gross Margin2

27.0%

29.7%

15.7%

23.1%

18.2%

Operating Expenses2

55,300

44,192

45,356

190,160

179,529

Operating Income (loss) 2

11,990

15,363

(11,814)

(6,892)

(36,513)

Operating Margin2

4.8%

7.7%

(5.5%)

(0.9%)

(4.7%)

Adjusted EBITDA3

25,521

27,673

1,188

45,497

42,915

Adjusted EPS4

($0.08)

($0.04)

($0.29)

($0.67)

($1.07)

1.

Reference pages 12-15 for detailed reconciliation of GAAP to Non-GAAP financial measures

2.

Excludes stock-based compensation

3.

Adjusted EBITDA is net income (loss) excluding non-controlling interest, gain (loss) on derivative revaluations, fair value adjustment for PPA derivatives, stock-based compensation, provision for income taxes, depreciation and amortization, interest expense and other one-time items

4.

Adjusted EPS is net income (loss) excluding non-controlling interest, gain (loss) on derivative revaluations, fair value adjustment for PPA derivatives and stock-based compensation using the adjusted Weighted Average Shares Outstanding (WASO) share count

Revenue and Margin Highlights

Revenue in the fourth quarter of 2020 included $171.8 million of product revenue, $28.8 million of installation revenue, $32.1 million of service revenue, and $16.6 million of electricity revenue. For the full year 2020, Bloom Energy achieved $518.6 million of product revenue, $101.9 million of installation revenue, $109.6 million of service revenue and $64.1 million of electricity revenue.

GAAP gross margin in the fourth quarter of 2020 was 25.5%, up 13.8 percentage points compared to the fourth quarter of 2019 and 20.9% for the full year 2020, up 8.5 percentage points versus full year 2019. Non-GAAP gross margin in the fourth quarter of 2020 was 27.0%, up 11.3 percentage points compared to the fourth quarter of 2019 and 23.1% for the full year 2020, up 4.9 percentage points versus full year 2019. The improvement in margins for both the fourth quarter and full year 2020 was driven by lower product costs, better performance on installations and higher product margins.

Balance Sheet Highlights

Bloom Energy’s cash position, including restricted cash, as of December 31, 2020 was $416.7 million, compared to $504.4 million as of September 30, 2020. Bloom ended the year with $527.1 million of debt, a decrease of $180.1 million from the third quarter of 2020, which included a reduction of $175.5 million in recourse debt.

2021 Outlook

Bloom announced the following outlook for the full-year 2021:

  • Revenue: $950 million - $1 billion
  • Non-GAAP Gross Margin*: ~25%
  • Non-GAAP Operating Margin*: ~3%
  • Cash Flow from Operations: Approaching Positive

*Non-GAAP gross margin and non-GAAP operating margin only exclude stock-based compensation.

Conference Call Details

We will host a conference call today, February 10, 2021, at 2:00 p.m. Pacific Time (5:00 p.m. Eastern Time) to discuss its financial results. To participate in the live call, analysts and investors may call +1 (844) 828-0524 and enter the passcode: 5175667. Those calling from outside the United States may dial +1 (647) 689-5146 and enter the same passcode: 5175667. A simultaneous live webcast will also be available under the Investor Relations section on our website at https://investor.bloomenergy.com/. Following the webcast, an archived version will be available on our website for one year. A telephonic replay of the conference call will be available for one week following the call, by dialing +1 (800) 585-8367 or +1 (416) 621-4642 and entering passcode 5175667.

Use of Non-GAAP Financial Measures

This release includes certain non-GAAP financial measures as defined by the rules and regulations of the Securities and Exchange Commission (SEC). These non-GAAP financial measures are in addition to, and not a substitute for or superior to, measures of financial performance prepared in accordance with U.S. GAAP. There are a number of limitations related to the use of these non-GAAP financial measures versus their nearest GAAP equivalents. For example, other companies may calculate non-GAAP financial measures differently or may use other measures to evaluate their performance, all of which could reduce the usefulness of our non-GAAP financial measures as tools for comparison. We urge you to review the reconciliations of our non-GAAP financial measures to the most directly comparable U.S. GAAP financial measures set forth in this press release, and not to rely on any single financial measure to evaluate our business. With respect to our expectations regarding our 2021 Outlook, we are not able to provide a quantitative reconciliation of non-GAAP gross margin and non-GAAP operating margin measures to the corresponding GAAP measures without unreasonable efforts.

About Bloom Energy

Bloom Energy’s mission is to make clean, reliable energy affordable for everyone in the world. Bloom’s product, the Bloom Energy Server, delivers highly reliable and resilient, always-on electric power that is clean, cost-effective, and ideal for microgrid applications. Bloom’s customers include many Fortune 100 companies and leaders in manufacturing, data centers, healthcare, retail, higher education, utilities, and other industries. For more information, visit www.bloomenergy.com.

Forward-Looking Statements

This press release contains certain forward-looking statements, which are subject to the safe harbor provisions of the Private Securities Litigation Reform Act of 1995. Forward-looking statements generally relate to future events or our future financial or operating performance. In some cases, you can identify forward-looking statements because they contain words such as “anticipate,” “believe,” “could,” “estimate,” “expect,” “intend,” “may,” “should,” “will,” and “would” or the negative of these words or similar terms or expressions that concern Bloom’s expectations, strategy, priorities, plans or intentions. These forward-looking statements include, but are not limited to, expectations for growth as we implement our technology roadmap and build new applications; the pace of development of new product markets; the ability of the new Administration to enact new climate change policies; our ability for growth outside the United States; our plans for growth and success in 2021 and beyond; our expectations regarding improving cash flow; our ability to reduce our product costs; our ability to introduce new product; and our financial outlook for 2021. Readers are cautioned that these forward-looking statements are only predictions and may differ materially from actual future events or results due to a variety of factors including, but not limited to, our limited operating history, the emerging nature of the distributed generation market, the significant losses we have incurred in the past, our ability to service our existing debt obligations, the significant upfront costs of our Energy Servers, the ability to secure financing for our products, the risk of manufacturing defects, the accuracy of our estimates regarding the useful life of our Energy Servers, the availability of rebates, tax credits and other tax benefits, our reliance on tax equity financing arrangements, our reliance upon a limited number of customers, our lengthy sales and installation cycle, construction, utility interconnection and other delays and cost overruns related to the installation of our Energy Servers, business and economic conditions and growth trends in commercial and industrial energy markets, global economic conditions and uncertainties in the geopolitical environment, overall electricity generation market, the impact of the COVID-19 pandemic on the global economy and its potential impact on our supply chain, installation operations, demand for our products, our ability to protect our intellectual property, the restatement of our financial statements as announced in our Current Report on Form 8-K filed with the SEC on February 12, 2020 and other risks and uncertainties detailed in Bloom’s SEC filings from time to time. More information on potential factors that may impact Bloom’s business are set forth in Bloom’s periodic reports filed with the SEC, including its Annual Report on Form 10-K for the year ended on December 31, 2019 as filed with the SEC on March 31, 2020, and its Quarterly Report on Form 10-Q for the quarter ended September 30, 2020 as filed with the SEC on November 6, 2020, as well as subsequent reports filed with or furnished to the SEC from time to time. These reports are available on Bloom’s website at www.bloomenergy.com and the SEC’s website at www.sec.gov. Bloom assumes no obligation to, and does not currently intend to, update any such forward-looking statements.

The Investor Relations section of Bloom’s website at investor.bloomenergy.com contains a significant amount of information about Bloom Energy, including financial and other information for investors. We encourage investors to visit this website from time to time, as information is updated and new information is posted.

Condensed Consolidated Balance Sheets (preliminary & unaudited)

(in thousands)


December 31,


2020


2019


Assets


Current assets:


Cash and cash equivalents

$

246,947


$

202,823


Restricted cash

52,470


30,804


Accounts receivable

99,513


37,828


Inventories

142,059


109,606


Deferred cost of revenue

41,469


58,470


Customer financing receivable

5,428


5,108


Prepaid expenses and other current assets

30,718


28,068


Total current assets

618,604


472,707


Property, plant and equipment, net

600,628


607,059


Operating lease right-of-use assets

35,621


Customer financing receivable, non-current

45,268


50,747


Restricted cash, non-current

117,293


143,761


Deferred cost of revenue, non-current

2,462


6,665


Other long-term assets

34,511


41,652


Total assets

$

1,454,387


$

1,322,591


Liabilities, Redeemable Noncontrolling Interest, Stockholders’ Deficit and Noncontrolling Interest


Current liabilities:


Accounts payable

$

58,334


$

55,579


Accrued warranty

10,263


10,333


Accrued expenses and other current liabilities

112,004


70,284


Deferred revenue and customer deposits

114,286


89,192


Operating lease liabilities

7,899


Financing obligations

12,745


10,993


Current portion of recourse debt


304,627


Current portion of non-recourse debt

120,846


8,273


Current portion of recourse debt from related parties


20,801


Current portion of non-recourse debt from related parties


3,882


Total current liabilities

436,377


573,964


Derivative liabilities

4,989


17,551


Deferred revenue and customer deposits, net of current portion

87,463


125,529


Operating lease liabilities, net of current portion

41,849


Financing obligations, non-current

459,981


446,165


Long-term portion of recourse debt

168,008


75,962


Long-term portion of non-recourse debt

102,045


192,180


Long-term portion of non-recourse debt from related parties


31,087


Other long-term liabilities

12,279


28,013


Total liabilities

1,312,991


1,490,451


Redeemable noncontrolling interest

377


443


Stockholders’ deficit:


Common stock

17


12


Additional paid-in capital

3,182,753


2,686,759


Accumulated other comprehensive income (loss)

(9

)

19


Accumulated deficit

(3,103,937

)

(2,946,384

)

Total stockholders’ equity (deficit)

78,824


(259,594

)

Noncontrolling interest

62,195


91,291


Total liabilities, redeemable noncontrolling interest, stockholders' deficit and noncontrolling interest

$

1,454,387


$

1,322,591

Condensed Consolidated Statements of Operations (preliminary & unaudited)

(in thousands, except per share data)


Three Months Ended
December 31,


Years Ended
December 31,


2020


2019


2020


2019


Revenue:


Product

$

171,801


$

158,427


$

518,633


$

557,336


Installation


28,827


14,429


101,887


60,826


Service


32,137


25,628


109,633


95,786


Electricity


16,622


15,059


64,094


71,229


Total revenue


249,387


213,543


794,247


785,177


Cost of revenue:


Product


105,071


141,782


332,724


435,479


Installation


29,604


16,901


116,542


76,487


Service


39,493


17,127


132,329


100,238


Electricity


11,593


12,785


46,859


75,386


Total cost of revenue


185,761


188,595


628,454


687,590


Gross profit


63,626


24,948


165,793


97,587


Operating expenses:


Research and development


21,690


22,148


83,577


104,168


Sales and marketing


18,840


17,357


55,916


73,573


General and administrative


27,614


33,315


107,085


152,650


Total operating expenses


68,144


72,820


246,578


330,391


Loss from operations


(4,518

)


(47,872

)

(80,785

)

(232,804

)

Interest income


70


862


1,475


5,661


Interest expense


(21,246

)


(21,635

)

(76,276

)

(87,480

)

Interest expense to related parties


(1,933

)

(2,513

)

(6,756

)

Other income (expense), net


(4,176

)


138


(8,318

)

706


Loss on extinguishment of debt


(12,878

)


Gain (loss) on revaluation of embedded derivatives


(1,737

)


(540

)

464


(2,160

)

Loss before income taxes


(31,607

)


(70,980

)

(178,831

)

(322,833

)

Income tax provision


(16

)


31


256


633


Net loss


(31,591

)


(71,011

)

(179,087

)

(323,466

)

Less: Net loss attributable to noncontrolling interests and redeemable noncontrolling interests


(4,453

)


(5,178

)

(21,534

)

(19,052

)

Net loss attributable to Class A and Class B common stockholders


(27,138

)


(65,833

)

(157,553

)

(304,414

)

Less: deemed dividend to noncontrolling interest


(2,454

)


(2,454

)

Net loss available to Class A and Class B common stockholders

$

(27,138

)

$

(68,287

)

$

(157,553

)

$

(306,868

)

Net loss per share available to Class A and Class B common stockholders, basic and diluted

$

(0.16

)

$

(0.58

)

$

(1.14

)

$

(2.67

)

Weighted average shares used to compute net loss per share attributable to Class A and Class B common stockholders, basic and diluted


165,975


118,588


138,722


115,118


Condensed Consolidated Statement of Cash Flows (preliminary & unaudited)

(in thousands)


Years Ended
December 31,


2020


2019


Cash flows from operating activities:


Net loss

$

(179,087

)

$

(323,466

)

Adjustments to reconcile net loss to net cash provided by (used in) operating activities:


Depreciation and amortization

52,279


78,584


Non cash lease expense

5,328


Write-off of property, plant and equipment, net

38


3,117


Impairment of equity method investment

4,236


11,302


Write-off of PPA II and PPA IIIb decommissioned assets


70,543


Debt make-whole expense


5,934


Revaluation of derivative contracts

(497

)

2,779


Stock-based compensation

73,893


196,291


Loss on long-term REC purchase contract

72


53


Loss on extinguishment of debt

11,785


Amortization of debt issuance and premium cost, net

6,455


22,130


Changes in operating assets and liabilities:


Accounts receivable

(61,685

)

51,952


Inventories

(33,004

)

18,425


Deferred cost of revenue

19,910


(21,992

)

Customer financing receivable and other

5,159


5,520


Prepaid expenses and other current assets

(3,124

)

8,643


Operating lease right-of-use assets

(2,752

)


Other long-term assets

2,904


3,618


Accounts payable

(620

)

(11,310

)

Accrued warranty

(241

)

(6,603

)

Accrued expenses and other current liabilities

17,753


6,728


Deferred revenue and customer deposits

(12,972

)

37,146


Other long-term liabilities

(4,523

)

4,376


Net cash (used in) provided by operating activities

(98,693

)

163,770


Cash flows from investing activities:


Purchase of property, plant and equipment

(37,913

)

(51,053

)

Proceeds from maturity of marketable securities


104,500


Net cash (used in) provided by investing activities

(37,913

)

53,447


Years Ended
December 31,


2020


2019


Cash flows from financing activities:


Proceeds from issuance of debt

300,000


Proceeds from issuance of debt to related parties

30,000


Repayment of debt

(176,522

)

(119,277

)

Repayment of debt to related parties

(2,105

)

(2,200

)

Debt make-whole payment


(5,934

)

Debt issuance costs

(13,247

)


Proceeds from financing obligations

26,279


72,334


Repayment of financing obligations

(10,859

)

(8,954

)

Contributions from noncontrolling interest

6,513


Payments to noncontrolling and redeemable noncontrolling interests


(56,459

)

Distributions to noncontrolling and redeemable noncontrolling interests

(7,622

)

(12,537

)

Proceeds from issuance of common stock

23,491


12,713


Net cash provided by (used in) financing activities

175,928


(120,314

)

Net increase in cash, cash equivalents, and restricted cash

39,322


96,903


Cash, cash equivalents, and restricted cash:


Beginning of period

377,388


280,485


End of period

$

416,710


$

377,388


Reconciliation of GAAP to Non-GAAP Financial Measures (preliminary & unaudited) (in thousands)

Gross Profit and Gross Margin to Gross Profit Excluding Stock-Based Compensation and Gross Margin Excluding Stock-Based Compensation

Gross margin and gross profit excluding stock-based compensation (SBC) are supplemental measures of operating performance that do not represent and should not be considered alternatives to gross margin or gross profit, as determined under GAAP.


Contacts

Investor Relations:
This email address is being protected from spambots. You need JavaScript enabled to view it.

Media:
Jennifer Duffourg
Bloom Energy
+1 (480) 341-5464
This email address is being protected from spambots. You need JavaScript enabled to view it.


Read full story here

Howard University, a leading HBCU, partners with ENGIE North America, a leading energy services provider

HOUSTON--(BUSINESS WIRE)--#ENGIE--ENGIE North America announced today that it has solidified its relationship with Howard University, one of the nation’s premiere HBCUs, by executing a long-term agreement for the design, construction, operation, and maintenance of a new central utility plant on Howard’s campus located in Washington, D.C.


The new central utility plant will provide both electric and steam services for buildings on campus. Under this agreement, ENGIE will design and construct the new plant and once complete, provide operations and maintenance services over the next 20 years. This long-term partnership will result in safe, reliable operation and resilient service for Howard’s students, faculty and other stakeholders, while at the same time reducing the campus’ carbon footprint and furthering Howard’s energy efficiency goals. ENGIE plans to begin construction in late-February with expected completion in late 2022.

The new, modern steam plant will be a combined heat and power (CHP) plant, which will generate 35-40 percent of the University’s electric consumption on site. This technology produces a single source of energy that generates electricity or power at the point of use and utilizes exhaust heat that would normally be lost in the generation process to be recovered and recycled to produce steam.

After managing numerous challenges related to its aging energy distribution infrastructure, the University sought a new solution in 2018 that would completely overhaul the existing central utility plant. ENGIE worked alongside the University on a feasibility study that included a site investigation and recommendations for near-term and long-term solutions for the system. The shared goal was to develop a cost-effective, energy solution to ensure safe operations and eliminate the risk of future campus closures stemming from problems with campus utilities.

“Guided by our shared “Howard Forward” strategic vision, Howard is taking a proactive approach to strategizing and modernizing the University’s aging steam plant. Our partnership with ENGIE, to address one of the campus’ more critical infrastructural risks, will not only move our existing steam plant into the 21st century, but provide a blueprint for other HBCUs in their efforts to reduce vulnerabilities and become more energy efficient,” said Howard’s Executive Vice President and Chief Operating Officer, Tashni-Ann Dubroy, Ph.D.

“Howard University is an incredible leader in the constellation of Historically Black Colleges and Universities across the United States,” said Serdar Tüfekçi, Head of Large Campus Partnerships at ENGIE North America Inc. “It is fitting that Howard University has taken this bold step to lead towards the energy transition. ENGIE North America is proud to serve the community’s long-term vision of creating a utility system that is resilient, reliable and affordable for the University and its stakeholders.”

About Howard University

Founded in 1867, Howard University is a private, research university that is comprised of 13 schools and colleges. Students pursue more than 140 programs of study leading to undergraduate, graduate and professional degrees. The University operates with a commitment to Excellence in Truth and Service and has produced one Schwarzman Scholar, three Marshall Scholars, four Rhodes Scholars, 11 Truman Scholars, 25 Pickering Fellows and more than 165 Fulbright recipients. Howard also produces more on-campus African-American Ph.D. recipients than any other university in the United States. For more information on Howard University, visit www.howard.edu.

About ENGIE North America

ENGIE North America Inc. offers a range of capabilities in the United States and Canada to help customers decarbonize, decentralize and digitalize their operations. These include comprehensive services to help customers run their facilities more efficiently and optimize energy and other resource use and expense; clean power generation; energy storage; and retail energy supply that includes renewable, demand response, and on-bill financing options. Nearly 100% of the company’s power generation portfolio is low carbon or renewable. Globally, ENGIE S.A. relies on their key businesses (gas, renewable energy, services) to offer competitive solutions to customers. With 170,000 employees worldwide, customers, partners and stakeholders, we are a community of Imaginative Builders, committed every day to more harmonious progress. For more information on ENGIE North America, please visit our LinkedIn page or Twitter feed, www.engie-na.com and www.engie.com.


Contacts

ENGIE North America Media Contact:
Sandrine Deparis, This email address is being protected from spambots. You need JavaScript enabled to view it., (202) 855 3705

Howard University Media Contact:
Alonda Thomas, This email address is being protected from spambots. You need JavaScript enabled to view it., (202) 578-1679

BLOOMFIELD, Conn.--(BUSINESS WIRE)--Kaman Corp. (NYSE:KAMN) announced today that it will report its fourth quarter 2020 results after the stock market closes on Thursday, February 25, 2021, and host a live webcast and conference call at 8:30 am ET on Friday, February 26, 2021. In addition, a supplemental presentation relating to the fourth quarter and full year 2020 results will be posted to the Company’s website prior to the earnings call at http://www.kaman.com/investors/presentations.

The call will be accessible by telephone within the U.S. at (844) 473-0975 and from outside the U.S. at (562) 350-0826 (using the Conference I.D.: 6195753) or via the Internet at www.kaman.com. Please go to the website at least fifteen minutes prior to the start of the call to register, download and install any necessary audio software. A replay will also be available two hours after the call and can be accessed at (855) 859-2056 or (404) 537-3406 (using the Conference I.D.: 6195753).

About Kaman Corporation

Kaman Corporation, founded in 1945 by aviation pioneer Charles H. Kaman, and headquartered in Bloomfield, Connecticut, conducts business in the aerospace & defense, industrial and medical markets. Kaman produces and markets proprietary aircraft bearings and components; super precision, miniature ball bearings; proprietary spring energized seals, springs and contacts; complex metallic and composite aerostructures for commercial, military and general aviation fixed and rotary wing aircraft; safe and arming solutions for missile and bomb systems for the U.S. and allied militaries; subcontract helicopter work; restoration, modification and support of our SH-2G Super Seasprite maritime helicopters; manufacture and support of our K-MAX® manned and unmanned medium-to-heavy lift helicopters. More information is available at www.kaman.com.


Contacts

James Coogan
VP, Investor Relations and Business Development
(860) 243-6342
This email address is being protected from spambots. You need JavaScript enabled to view it.

COLUMBUS, Ohio--(BUSINESS WIRE)--The Battelle Savannah River Alliance (BRSA) team has received a Notice to Proceed with Transition after it was selected by the Department of Energy in December to manage one of the country’s premier environmental, energy, and national security research facilities—the Savannah River National Laboratory (SRNL).


Employing approximately 1,000 people, SRNL conducts research and development for diverse federal agencies, providing practical, cost-effective solutions for the nation’s environmental, nuclear security, energy and manufacturing challenges. As the U. S. Department of Energy’s (DOE’s) Environmental Management Laboratory, SRNL provides strategic scientific and technological support for the nation’s $6 billion per year waste clean-up program.

BSRA is led by and wholly-owned by Battelle, one of DOE’s leading laboratory management contractors. The BSRA Team includes five regional universities—Clemson University, Georgia Institute of Technology, South Carolina State University, University of Georgia, and University of South Carolina—as well as small business partners, Longenecker & Associates and TechSource.

The contract includes a five-year base with five, one-year options. The estimated value of the contract is $3.8 billion over the course of ten years if all options are exercised. BRSA will begin the 120-day transition period on Feb. 16.

Dr. Vahid Majidi, currently Executive Vice President and Director of SRNL for the incumbent contractor Savannah River Nuclear Solutions, LLC, will serve as the Laboratory Director for BSRA. Dr. Majidi is a decorated former member of the senior executive service and senior intelligence service with direct reporting responsibilities to the U.S. Secretary of Defense, U.S. Director of National Intelligence and the Director of the Federal Bureau of Investigation. He has more than 30 years of experience in the areas of chemistry, measurement science and technology, national and homeland security, science and technology policy, and nuclear nonproliferation. He holds a Ph.D in chemistry from Wayne State University and a B.A. in science and chemistry from Eastern Michigan University.

“It is a tremendous honor to be selected as leader of one of the nation’s leading research institutions, that is working at the forefront of science and technology to solve complex environmental challenges,” Majidi said. “I look forward to working closely with the DOE, the Savannah River Site contractors, our SRNL leadership team, laboratory staff and community members to carry out a seamless transition.”

Majidi noted that the lab has strong partnerships with the states of South Carolina and Georgia, especially in its engagement with communities on STEM education initiatives.

“BSRA and our university partnerships will allow us to expand on that interaction with our communities and ensure best-of-class STEM education is shared with our community partners,” he said. Hear more from Majidi in this video.

“We’re both honored and excited to have this opportunity to be a part of a very bright future at SRNL,” said Mark Peters, Battelle’s Executive Vice President for Global Laboratory Operations. “BSRA’s approach will ensure the delivery of high impact science, technology and engineering solutions into the future through a significant expansion of SRNL’s core competencies and programs. Our team offers an exciting, compelling vision for the future of SRNL and provides DOE a leadership team and strategy that will deliver excellence in science and technology, operations, and community engagement.”

Battelle currently has a management role at seven DOE national labs including Pacific Northwest National Lab, Brookhaven National Lab, Oak Ridge National Lab, National Renewable Energy Lab, Idaho National Lab, Los Alamos National Lab and Lawrence Livermore National Lab. It also operates the National Biodefense Analysis and Countermeasures Center for the Department of Homeland Security.

About Battelle

Every day, the people of Battelle apply science and technology to solving what matters most. At major technology centers and national laboratories around the world, Battelle conducts research and development, designs and manufactures products, and delivers critical services for government and commercial customers. Headquartered in Columbus, Ohio since its founding in 1929, Battelle serves the national security, health and life sciences, and energy and environmental industries. For more information, visit www.battelle.org, or contact Katy Delaney at (614) 424-7208 or This email address is being protected from spambots. You need JavaScript enabled to view it..


Contacts

Katy Delaney
(614) 424-7208
This email address is being protected from spambots. You need JavaScript enabled to view it.

HOUSTON--(BUSINESS WIRE)--SilverBow Resources, Inc. (NYSE: SBOW) (“SilverBow” or “the Company”) announced today it will release financial and operating results for the fourth quarter and full year 2020 and post an updated corporate presentation after market close on Wednesday, March 3, 2021.


SilverBow will host a conference call to discuss its results on Thursday, March 4, 2021 at 9:00 a.m. Central Time (10:00 a.m. Eastern Time). Investors and participants can register for the call in advance by visiting http://www.directeventreg.com/registration/event/6756335. After registering, instructions will be shared on how to join the call.

Info:


SilverBow Resources Fourth Quarter 2020 Earnings Conference Call
Conference ID: 6756335

Webcast:


Live and rebroadcast over the internet at:


https://event.on24.com/wcc/r/2948395/E7A1BE6762CAB0845E0C1C5E9CBEB6DB
https://www.sbow.com

Replay:


A replay will be available approximately two hours after the call through Thursday, March 25, 2021 at 10:59 p.m. Central Time (11:59 p.m. Eastern Time). The replay may be accessed by dialing 1-800-585-8367 or 1-416-621-4642, and referencing the Conference ID: 6756335.

ABOUT SILVERBOW RESOURCES, INC.

SilverBow Resources, Inc. (NYSE: SBOW) is a Houston-based energy company actively engaged in the exploration, development, and production of oil and gas in the Eagle Ford Shale in South Texas. With over 30 years of history operating in South Texas, the Company possesses a significant understanding of regional reservoirs which it leverages to assemble high quality drilling inventory while continuously enhancing its operations to maximize returns on capital invested. For more information, please visit www.sbow.com.


Contacts

Jeff Magids
Director of Finance & Investor Relations
(281) 874-2700, (888) 991-SBOW

DUBLIN--(BUSINESS WIRE)--The "GCC Solar Power Market By Technology (Photovoltaic Systems, Concentrated Systems, Parabolic Trough, Solar Power Tower, Fresnel Reflectors, Dish Stirling), By Raw Material, By Installation, By Application, By Company, By Region, Forecast & Opportunities, 2026" report has been added to ResearchAndMarkets.com's offering.


The GCC Solar Power Market is expected to grow at an impressive rate during the forecast period.

The GCC Solar Power Market is driven by the growing environmental concerns due to increasing greenhouse gases emissions and global warming. This has increased the need to shift towards cleaner forms of energy thereby positively influencing the market growth through 2026.

Additionally, supportive government policies and grants & subsidies for facilitating the use of solar energy is further expected to propel the market growth over the next few years. Furthermore, depleting fossil fuels and growing need to ensure future energy safety is expected to foster the market growth during the forecast period. However, high initial costs involved in infrastructure and setup is expected to hamper the market growth. Besides, higher electricity cost and low capacity factor can further impede the market growth through 2026.

The GCC Solar Power Market is segmented based on technology, raw material, installation, application, company, and region. Based on technology, the market can be fragmented into photovoltaic systems, concentrated systems, parabolic trough, solar power tower, fresnel reflectors and dish stirling.

The photovoltaic systems are expected to dominate the market owing to the increasing installations of solar panels and PV cells. Based on raw material, the market can be categorized into polycrystalline silicon cells, cadmium telluride, monocrystalline silicon cells and others.

The monocrystalline silicon cells segment is expected to dominate the market on account of the growing investments in solar panels and the growing demand of PV cells from the industrial sector. Based on application, the market can be classified into the residential, commercial and industrial. The commercial segment is expected to dominate the market owing to the major installations in hotels, offices, hospitals, among others.

The major players operating in the GCC Solar Power Market are Suntech Power Holdings Co., Ltd., Soitec, ReneSola Ltd., Sun & Life, Abengoa S.A., National Solar Systems LLC, Solar Frontier Kabushiki Kaisha, Canadian Solar Inc., Phoenix Solar AG, SunPower Corporation and others.

Major companies are developing advanced technologies and launching new products in order to stay competitive in the market. Other competitive strategies include mergers & acquisitions and new product developments.

Objective of the Study:

  • To analyze and estimate the market size of the GCC Solar Power Market from 2016 to 2019.
  • To estimate and forecast the market size of the GCC Solar Power Market from 2020 to 2026 and growth rate until 2026.
  • To classify and forecast the GCC Solar Power Market based on technology, raw material, installation, application, company, and regional distribution.
  • To identify dominant region or segment in the GCC Solar Power Market.
  • To identify drivers and challenges for the GCC Solar Power Market.
  • To examine competitive developments such as expansions, new product launches, mergers & acquisitions, etc., in the GCC Solar Power Market.
  • To identify and analyze the profile of leading players operating in the GCC Solar Power Market.
  • To identify key sustainable strategies adopted by market players in the GCC Solar Power Market.

Key Target Audience:

  • Solar power manufacturers/suppliers
  • Market research and consulting firms
  • Government bodies such as regulating authorities and policy makers
  • Organizations, forums and alliances related to solar power

Years considered for this report:

  • Historical Years: 2016-2019
  • Base Year: 2020
  • Estimated Year: 2021
  • Forecast Period: 2022-2026

Report Scope:

In this report, the GCC Solar Power Market has been segmented into following categories, in addition to the industry trends which have also been detailed below:

GCC Solar Power Market, By Technology:

  • Photovoltaic Systems
  • Concentrated Systems
  • Parabolic Trough
  • Solar Power Tower
  • Fresnel Reflectors
  • Dish Stirling

GCC Solar Power Market, By Raw Material:

  • Polycrystalline Silicon Cells
  • Cadmium Telluride
  • Monocrystalline Silicon Cells
  • Others

GCC Solar Power Market, By Installation:

  • Crystalline PV
  • Thin-Film PV

GCC Solar Power Market, By Application:

  • Residential
  • Commercial
  • Industrial

GCC Solar Power Market, By Region:

  • UAE
  • Bahrain
  • Saudi Arabia
  • Oman
  • Qatar
  • Kuwait

Companies Mentioned

  • Suntech Power Holdings Co., Ltd.
  • Soitec (JV with Khaled Juffali Company)
  • ReneSola Ltd.
  • Sun & Life LLC
  • Abengoa S.A.
  • National Solar Systems LLC
  • Solar Frontier Kabushiki Kaisha
  • Canadian Solar Inc.
  • Phoenix Solar AG
  • SunPower Corporation

For more information about this report visit https://www.researchandmarkets.com/r/wd2t9o


Contacts

ResearchAndMarkets.com
Laura Wood, Senior Press Manager
This email address is being protected from spambots. You need JavaScript enabled to view it.
For E.S.T Office Hours Call 1-917-300-0470
For U.S./CAN Toll Free Call 1-800-526-8630
For GMT Office Hours Call +353-1-416-8900

LEAWOOD, KS--(BUSINESS WIRE)--Tortoise Essential Assets Income Term Fund (NYSE: TEAF) provides an update on the fund’s direct investments, portfolio asset allocation, structure types and impact statistics as of January 31, 2021 on the company website here. Updates will continue to be posted on a monthly basis until the fund reaches its target of 60% direct investments.


In addition, on a monthly basis, details on each private deal that has taken place over the prior month will be published here. The list includes all deals completed since the fund’s inception through January 31, 2021.

For additional information on this fund, please visit cef.tortoiseecofin.com.

About Tortoise

Tortoise focuses on energy & power infrastructure and the transition to cleaner energy. Tortoise’s solid track record of energy value chain investment experience and research dates back more than 20 years. As one of the earliest investors in midstream energy, Tortoise believes it is well-positioned to be at the forefront of the global energy evolution that is underway. With a steady wins approach and a long-term perspective, Tortoise strives to make a positive impact on clients and communities. To learn more, please visit www.TortoiseEcofin.com.

Tortoise Capital Advisors, L.L.C. is the adviser to Tortoise Essential Assets Income Term Fund. Ecofin Advisors Limited is a sub-adviser to Tortoise Essential Assets Income Term Fund.

Safe harbor statement

This press release shall not constitute an offer to sell or a solicitation to buy, nor shall there be any sale of these securities in any state or jurisdiction in which such offer or solicitation or sale would be unlawful prior to registration or qualification under the laws of such state or jurisdiction.

Cautionary Statement Regarding Forward-Looking Statements

This press release contains certain statements that may include “forward-looking statements” within the meaning of Section 27A of the Securities Act of 1933, as amended, and Section 21E of the Securities Exchange Act of 1934, as amended. All statements, other than statements of historical fact, included herein are "forward-looking statements." Although the fund and Tortoise Capital Advisors believe that the expectations reflected in these forward-looking statements are reasonable, they do involve assumptions, risks and uncertainties, and these expectations may prove to be incorrect. Actual results could differ materially from those anticipated in these forward-looking statements as a result of a variety of factors, including those discussed in the fund’s reports that are filed with the Securities and Exchange Commission. You should not place undue reliance on these forward-looking statements, which speak only as of the date of this press release. Other than as required by law, the fund and Tortoise Capital Advisors do not assume a duty to update this forward-looking statement.


Contacts

Maggie Zastrow
(913) 981-1020
This email address is being protected from spambots. You need JavaScript enabled to view it.

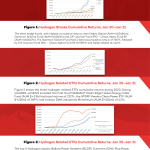
LONDON--(BUSINESS WIRE)--Using AlternativeSoft’s asset selection software, we were able to find the top 3 performing hedge funds to see how they performed vs the top 5 hydrogen stocks vs the top 3 ETF clean energy, during 2020.


Cumulative return during Jan2020-Dec2020

Top hydrogen stock

1,560%

Top ETF clean energy

222%

Top hedge fund

729%

Combating climate change is part of President Biden's core agenda. On his first day, he addressed this issue by rejoining the Paris Climate Agreement, ending the Keystone XL pipeline and revoking oil and gas development at national wildlife monuments1. As climate change has such a priority in Biden’s agendas, it has brought attention to the hydrogen economy.

The hydrogen economy is the process of producing hydrogen to use it as fuel, hence replacing fossil fuels and cutting carbon emission significantly2. Companies that operate under the hydrogen economy are the companies that sell fuel cells, renewable energy equipment, and supply hydrogen gas. The stocks of these companies have been soaring, driven not only by President Biden's support for clean energy, but also by 60 countries agreeing to reduce their net carbon emissions by 2050 to zero3, as well as by the rising adaptation of zero-emission.

The top 5 Hydrogen stocks, Ballard Power Systems (BLDP), Cummins (CMI), Plug Power (PLUG), Bloom Energy (BE) and FuelCell Energy (FCEL), had very impressive cumulative returns in 2020. PLUG had the highest return at 1560%. FCEL comes as a second with a return of 1247%, followed by BE’s return of 385%, BLDP 269% and, CMI 50%. What has also boosted this increase, is the falling costs and rising capital coming in the industry not just in the United States but globally. In the beginning of January this year, Plug Power got a $1.5 billion investment from SK Holdings4.

We conclude that selecting the correct hedge funds or the correct stocks, with skills, could have generated large returns during 2020.

N.B. This article is not intended to provide any professional investment advice and should be treated as more of an opinion piece.

To trial a truly powerful and comprehensive analytic software for investment decisions, fund allocation, and our new, innovative digital due diligence visit https://www.alternativesoft.com/


1 Erickson, B. (2021, January 21). Biden signs executive actions on COVID, climate change, immigration and more. Retrieved from https://www.cbsnews.com/news/biden-signs-executive-orders-day-one/

2 Bloom, SunPower, Cummins: Hydrogen Economy Stocks To Watch As Biden Administration Takes Over. (2021, January 21). Retrieved from https://www.forbes.com/sites/greatspeculations/2021/01/21/bloom-sunpower-cummins-hydrogen-economy-stocks-to-watch-as-biden-administration-takes-over/?sh=7c28d846b55e

3 Sengupta, S., & Popovich, N. (2019, September 25). More Than 60 Countries Say They'll Zero Out Carbon Emissions. The Catch? They're Not the Big Emitters. Retrieved January 22, 2021, from https://www.nytimes.com/interactive/2019/09/25/climate/un-net-zero-emissions.html

4 Plug Power and South Korean SK Group to Form a Strategic Partnership to Accelerate Hydrogen Economy Expansion in Asian Markets; Plug Power to Receive $1.5 Billion Strategic Investment From SK Group. (2021, January 6). Retrieved January 22, 2021, from https://www.ir.plugpower.com/Press-Releases/Press-Release-Details/2021/Plug-Power-and-South-Korean-SK-Group-to-Form-a-Strategic-Partnership-to-Accelerate-Hydrogen-Economy-Expansion-in-Asian-Markets-Plug-Power-to-Receive-1.5-Billion-Strategic-Investment-From-SK-Group/default.aspx


Contacts

Mitesh Gohil
+44 20 7510 2003
This email address is being protected from spambots. You need JavaScript enabled to view it.

HOUSTON--(BUSINESS WIRE)--The board of directors of Phillips 66 (NYSE: PSX) has declared a quarterly dividend of 90 cents per share on Phillips 66 common stock. The dividend is payable on March 1, 2021, to shareholders of record as of the close of business on Feb. 22, 2021.


About Phillips 66

Phillips 66 is a diversified energy manufacturing and logistics company. With a portfolio of Midstream, Chemicals, Refining, and Marketing and Specialties businesses, the company processes, transports, stores and markets fuels and products globally. Phillips 66 Partners, the company’s master limited partnership, is integral to the portfolio. Headquartered in Houston, the company has 14,300 employees committed to safety and operating excellence. Phillips 66 had $55 billion of assets as of Dec. 31, 2020. For more information, visit www.phillips66.com or follow us on Twitter @Phillips66Co.


Contacts

Jeff Dietert (investors)
832-765-2297
This email address is being protected from spambots. You need JavaScript enabled to view it.
or
Shannon Holy (investors)
832-765-2297
This email address is being protected from spambots. You need JavaScript enabled to view it.
or
Thaddeus Herrick (media)
855-841-2368
This email address is being protected from spambots. You need JavaScript enabled to view it.

No Shareholder Action Required at This Time

GREENEVILLE, Tenn.--(BUSINESS WIRE)--Forward Air Corporation (NASDAQ:FWRD) (the “Company” or “Forward”) today confirmed that Ancora Advisors (“Ancora”) has submitted a nomination notice for four candidates to stand for election to the Forward Air Board of Directors (the “Board”) at the Company’s 2021 Annual Meeting of Shareholders. Shareholders are not required to take any action at this time.


The Company issued the following statement:

Forward benefits from a strong and experienced Board that provides close oversight and guidance on the execution of the Company’s strategy. The Board – composed of 10 highly qualified directors, nine of whom are independent – brings significant experience across the logistics industry, financial operations, governance, and increasingly, technology. Our Board regularly evaluates its composition to ensure it has the right skills and perspectives to deliver value to all shareholders, and has made and intends to continue to make refreshment a priority, appointing four new independent directors since 2017, for an average Board tenure of approximately seven years.

While we believe Forward is on the right path to deliver sustainable growth for shareholders, we are also open-minded and receptive to ideas that may enhance value or our operations. To that end, members of the Board and management team have held numerous and extensive discussions with Ancora and members of its shareholder group, including Andrew Clarke and Scott Niswonger (collectively the “Ancora Group”), over the past several months to better understand its views on the Company’s strategy and progress. Through these discussions, the Board determined that it is either already executing on – or intends to undertake – many of the initiatives suggested by Ancora. In the areas where the parties disagree, the Board and management believe we can create superior value under the Forward strategic plan currently being executed.

Notwithstanding these differences in strategy, in an effort to engage constructively for the benefit of all shareholders, the Board has made a series of constructive settlement offers to Ancora. As recently as January 27, 2021, Forward made Ancora an offer whereby three new directors would be added to the Board, including any two directors chosen by Ancora, which could include any Ancora principals or members of the Ancora Group, and one independent director mutually agreed upon by Ancora and the Company. In response to a specific request made by Ancora, the proposed settlement offer also contemplated the creation of a new committee of the Board which would include two Ancora appointees, two independent directors, and Tom Schmitt as Chair. Ancora summarily rejected the proposal and demanded the appointment of three Ancora-selected candidates and 50% control of the proposed Board committee such that the Ancora Group would have veto-rights.

While we believe this proxy contest is unreasonable and disregards multiple constructive settlement offers by the Board, we remain committed to constructive and reasonable engagement with the Ancora Group moving forward, while ensuring that the best interests of all shareholders – not only those of the Ancora Group – are protected and represented.

Under Chairman and CEO Tom Schmitt, and with the full support and collaboration of the Board, we will continue to execute on the Company’s clearly defined strategy. The Board believes that its combined CEO and Chairman structure is optimal for Forward at this time as it ensures the Board is led by a voice with in-depth, critical knowledge of our business, while enhancing transparency between the Board and management overall. The structure, which includes a lead independent director, provides an effective balance between strong Company leadership and engaged oversight as it ensures the Board has a holistic view of our business when making key strategic decisions for the benefit of our shareholders.

Forward remains focused on driving continued improvements in operational performance and shipment-level profitability, while delivering enhanced offerings and service to customers. In 2020, we prudently enhanced our financial flexibility and liquidity in order to mitigate the short-term headwinds presented by COVID-19, and at year-end, we rapidly and effectively resolved certain IT challenges to minimize their impact on the business. As volumes continue to rebound, we are confident that we have emerged from the depths of the pandemic a stronger company. Simultaneously, the Company’s long-term value creation potential is compelling due to continued organic growth expansion; enhanced network capabilities; renewed commitment to Precision Execution; and consistent acquisition of complementary businesses.

The Board will review Ancora’s materials and, if appropriate, will present its formal recommendation regarding director nominations in the Company’s definitive proxy materials that will be filed with the Securities and Exchange Commission and mailed to shareholders eligible to vote at the 2021 Annual Meeting, which has not yet been scheduled.

Morgan Stanley & Co. LLC is serving as financial advisor to Forward Air and Cravath, Swaine & Moore LLP is serving as Forward Air’s legal advisor.

About Forward Air Corporation

Forward Air Corporation (NASDAQ: FWRD) is a leading asset-light freight and logistics company. We provide LTL, final mile, truckload, intermodal drayage and pool distribution services across the United States and in Canada. Headquartered in Greeneville, Tennessee, Forward operates approximately 200 facilities across the country and employs more than 5,200 people nationwide. We are more than a transportation company. As a single resource for your shipping needs, Forward is your supply chain partner. For more information, visit our website at www.forwardaircorp.com.

Forward-Looking Statements

This communication contains “forward-looking statements” within the meaning of the safe harbor provisions of the U.S. Private Securities Litigation Reform Act of 1995. Words such as “believes,” “anticipates,” “intends,” “plans,” “estimates,” “projects,” “expects” or similar expressions are intended to identify these forward-looking statements. These statements, which include, but are not limited to, statements regarding the value expected to be created by Forward Air’s strategic growth plan and being on the right path to deliver sustainable growth for shareholders, Forward Air’s long-term value creation potential and its drivers, Forward Air’s response to the COVID-19 pandemic and the expectation that volumes will continue to rebound and Forward Air’s execution of its strategy to drive operational, profitability and service offering improvements are based on Forward Air’s current plans and expectations and involve risks and uncertainties that could cause future activities and results of operations to be materially different from those set forth in the forward-looking statements, including the risks described in the “Risk Factors” section of our annual and quarterly reports filed with the Securities and Exchange Commission. For further information, please refer to Forward Air’s reports and filings with the Securities and Exchange Commission.

Further, any forward-looking statement made by us in this communication is based only on information currently available to us and speaks only as of the date on which it is made. Forward Air does not undertake any obligation to publicly update any forward-looking statement, whether written or oral, that may be made from time to time, whether as a result of new information, future developments or otherwise.

Additional Information and Where to Find It

In connection with the forthcoming solicitation of proxies from shareholders in respect of Forward Air’s 2021 Annual Meeting of Shareholders, Forward Air will file with the U.S. Securities and Exchange Commission (the “SEC”) a proxy statement on Schedule 14A (the “proxy statement”), containing a form of BLUE proxy card. Details concerning the nominees of Forward Air’s Board of Directors for election at Forward Air’s 2021 Annual Meeting of Shareholders will be included in the proxy statement. BEFORE MAKING ANY VOTING DECISION, INVESTORS AND SECURITY HOLDERS ARE URGED TO READ ALL RELEVANT DOCUMENTS, INCLUDING FORWARD AIR’S PROXY STATEMENT AND ANY AMENDMENTS AND SUPPLEMENTS THERETO AND ACCOMPANYING BLUE PROXY CARD, FILED WITH THE SEC WHEN THEY BECOME AVAILABLE BECAUSE THEY CONTAIN, OR WILL CONTAIN, IMPORTANT INFORMATION ABOUT FORWARD AIR. Shareholders may obtain free copies of the proxy statement and other relevant documents that Forward Air files with the SEC on Forward Air’s website at https://ir.forwardaircorp.com or from the SEC’s website at www.sec.gov.

Participants in the Solicitation

Forward Air, its directors and certain of its executive officers will be participants in the solicitation of proxies from shareholders in respect of Forward Air’s 2021 Annual Meeting of Shareholders. Information regarding certain of the directors and officers of Forward Air is contained in its proxy statement for the 2020 Annual Meeting of Shareholders which was filed with the SEC on March 31, 2020. To the extent holdings of Forward Air’s securities by directors or executive officers have changed since the amounts set forth in Forward Air’s 2020 proxy statement, such changes have been or will be reflected on Initial Statements of Beneficial Ownership on Form 3 or Statements of Change in Ownership on Form 4 filed with the SEC. Additional information regarding the identity of potential participants and their respective interests, by security holdings or otherwise, will be included in Forward Air’s proxy statement and other relevant documents filed with the SEC in connection with Forward Air’s 2021 Annual Meeting of Shareholders.


Contacts

For media inquiries, please contact:

Justin Moss
This email address is being protected from spambots. You need JavaScript enabled to view it.
404-362-2472

OR

Michael J. Morris
This email address is being protected from spambots. You need JavaScript enabled to view it.
404-362-8933

OR

Steve Frankel / Nick Lamplough
Joele Frank, Wilkinson Brimmer Katcher
212-355-4449

For investor inquiries, please contact:

Arthur Crozier / Gabrielle Wolf
Innisfree M&A Incorporated
212-750-5833

NOT FOR DISTRIBUTION TO UNITED STATES NEWSWIRE SERVICES OR FOR DISSEMINATION IN THE UNITED STATES

TORONTO--(BUSINESS WIRE)--Sherritt International Corporation (“Sherritt”, the “Corporation”, the “Company”) (TSX: S), a world leader in the mining and hydrometallurgical refining of nickel and cobalt from lateritic ores, today reported its financial results for the three- and 12-month periods ended December 31, 2020. All amounts are in Canadian currency unless otherwise noted.


CEO COMMENTARY

“With a significantly strengthened balance sheet, a considerably improved outlook for nickel and cobalt, and encouraging signs for improved Cuban-U.S. relations, Sherritt ended 2020 in its strongest position in more than a decade,” said David Pathe, President and CEO of Sherritt International. “Keys to our progress were completion of a debt restructuring initiative that resolved our Ambatovy investment legacy while extending our debt maturities to the fourth quarter of 2026, ongoing commitments to operational excellence and employee health and safety that contributed to production results largely in line with our guidance for the year, and measures we took to preserve liquidity against a backdrop of a global pandemic and volatile commodity prices.”

Mr. Pathe added, “We plan to sustain our momentum into 2021 – even as we manage against the continuing global pandemic – by capitalizing on the growing demand for high purity nickel as the market adoption of electric vehicles and requirement for low-carbon emissions accelerate, and on the current nickel price nearly US$2 per pound higher than the average for 2020. We will also be focused on our ESG commitments in 2021 and beyond. Over the longer term, we expect to fuel our growth through an increased focus on commercializing the innovation and process development capabilities of our Technologies Group.”

SELECTED Q4 2020 HIGHLIGHTS

  • Sherritt’s share of finished nickel and cobalt production at the Moa Joint Venture (Moa JV) were 4,020 tonnes and 451 tonnes, respectively. Despite being impacted by unplanned autoclave repairs at the refinery in Fort Saskatchewan, Alberta, Q4’s production totals helped to offset the negative effects of railway service disruptions in Q1 and an extended plant shutdown in Q3 due to additional found work scope, and reduced contractor availability due to COVID-19, enabling Sherritt to largely meet its production guidance at the Moa JV for the year.
  • Sherritt received US$20 million in distributions from the Moa JV, representing its 50% share of total dividends declared. Sherritt also received an additional US$20 million, representing the 50% share of distributions of its Moa JV partner, General Nickel Company (“GNC”), pursuant to an overdue receivables agreement negotiated by Sherritt in 2019. Distributions received in Q4 were indicative of improving nickel and cobalt prices and strong operational performance.
  • Sherritt received US$30.1 million in Cuban energy payments as part of the overdue receivables agreement with its Cuban partners. Included in this amount was the aforementioned US$20 million re-directed to Sherritt by GNC to be applied against amounts owed by Energas. Total payments consisted of US$27.7 million received in Canada and US$2.4 million accepted in Cuba to support local costs for Sherritt’s Oil and Gas operations.
  • Adjusted EBITDA was $10.7 million, down 34% from last year due to declining Oil and Gas contributions related to maturing oil fields and a $7.2 million increase in non-cash share-based compensation as a result of the 116% rise in Sherritt’s share price in Q4 2020.
  • Sherritt employee members of Unifor at the refinery in Fort Saskatchewan ratified a new collective agreement through March 31, 2022. The new agreement extends Sherritt’s track record of no labour disruptions at the refinery since it began operations in 1954.
  • Sherritt renewed and extended its $70 million credit facility with its syndicate of lenders to April 30, 2022, agreeing to more flexible financial covenants. As at December 31, Sherritt had drawn $8 million against the facility.
  • Sherritt purchased two separate put nickel options, each on 25% of its share of attributable finished nickel production from the Moa JV for 2021. The first, at a strike price of US$6.50/lb for a total cost of $5.8 million, is in effect for a 12-month period starting January 1, 2021. The second, at a strike price of US$7.00/lb for a total of $3.5 million, is in effect for a nine-month period starting April 1, 2021. Any cash settlements will be completed on a monthly basis against the average monthly nickel price on the London Metal Exchange and will involve no physical delivery. The hedging strategy is designed to provide Sherritt with cash flow security in 2021 against downward changes in nickel prices.
  • Sherritt announced that its CEO, David Pathe, plans to step down from his role in 2021. The Company has launched a search for his successor, and Mr. Pathe has agreed to stay on until a replacement is in place to ensure an orderly transition.

SUMMARY OF KEY 2020 DEVELOPMENTS

  • Sherritt ended 2020 with cash and cash equivalents of $167.4 million ($75.0 million held by Energas in Cuba), up from $166.1 million last year ($79.8 million held by Energas in Cuba). The higher cash position and increased amount held in Canada were driven by the receipt of $39.6 million of dividend distributions from the Moa JV, receipt of US$77 million of payments from Cuban energy partners, and lower interest payments of $5.0 million. The increased cash position was offset by balance sheet transaction costs of $27.6 million, capital expenditures of $12.1 million, and nickel put option purchase costs of $9.3 million.
  • Sherritt successfully completed a balance sheet initiative in Q3 that improved its capital structure and addressed its Ambatovy investment legacy following stakeholder approval. As a result of the transaction, Sherritt reduced its outstanding debt by approximately $301 million, extended the maturities of its note obligations to 2026 and 2029, reduced annual interest payments by more than $15 million, terminated its debt obligations relating to the Ambatovy Joint Venture, and ended the cross-default risk of the Ambatovy shareholder agreement, all without any dilution of its common shares.
  • Sherritt implemented a number of austerity measures that resulted in the reduction or deferral of more than $90 million in budgeted expenditures for the Moa JV (100% basis), Sherritt’s Oil and Power operations, and Corporate office, and reduced administrative expenses by $5.2 million (excluding non-cash share-based compensation and depreciation).
  • Sherritt’s share of production, unit costs, and capital spend for each of its business units in 2020 were largely in line with guidance for the year, indicative of ongoing commitments to operational excellence and employee health and safety, particularly in light of the COVID-19 global pandemic.
  • Net loss from continuing operations in FY2020 totaled $85.7 million or $0.22 per share. The amounts were an improvement from the net loss of $142.4 million, or $0.36 per share, for FY2019. In FY2020 Sherritt recognized earnings from discontinued operations of $107.9 million related to the disposition of its 12% ownership interest in the Ambatovy Joint Venture as part of the balance sheet initiative and reclassification as discontinued operations.
  • Sherritt committed to identifying commercial applications for innovations developed by its Technologies Group aimed at making next generation lateritic ore mining more economically viable and more sustainable.
  • Sherritt implemented a number of additional health and safety measures and work processes designed to protect employees, suppliers and other stakeholders at its operations in response to the spread of COVID-19. As a result of the additional measures, Sherritt had minimal impact to its nickel, cobalt, power, and oil production in 2020. The additional measures will remain in effect through the duration of the pandemic.
  • Sherritt released its 2019 Sustainability Report showing progress against its Environmental, Social, and Governance (ESG) targets, including efforts to reduce greenhouse emissions, maintain peer-leading safety metrics, and commitments to doubling the number of female employees by 2030. Sherritt will continue to develop and reinforce its ESG commitments in 2021 and beyond.
  • Sherritt signed the BlackNorth Initiative Pledge aimed at ending anti-Black systemic racism and creating opportunities for the BIPOC community.

DEVELOPMENTS SUBSEQUENT TO THE YEAR END

  • Sherritt received a $20.3 million prepayment against nickel deliveries in 2021. The prepayment is consistent with Sherritt’s efforts to enhance its liquidity.
  • Sherritt’s refinery in Fort Saskatchewan had its operating license renewed for 10 years by Alberta’s Ministry of Environment and Parks.
 

(1)

  For additional information see the Non-GAAP measures section of this press release.

Q4 2020 FINANCIAL HIGHLIGHTS(1)


For the three months ended


For the year ended


2020


2019


2020


2019


$ millions, except per share amount


December 31


December 31


Change


December 31


December 31


Change


Revenue


28.2


31.0


(9%)


$


119.8


$


136.3


(12%)

Combined revenue(2)


135.9


143.0


(5%)


497.0


544.9


(9%)

Net earnings (loss) from continuing operations for the period


(49.3)


(65.6)


25%


(85.7)


(142.4)


40%

Net earnings (loss) for the period


(49.6)


(185.5)


73%


22.2


(367.7)


106%

Adjusted EBITDA(2)


10.7


17.5


(39%)


38.9


46.0


(15%)

Cash provided (used) by continuing operations


12.7


7.3


74%


48.0


(10.9)


540%

Combined adjusted operating cash flow(2)


25.8


(3.4)


nm(3)


71.7


(6.1)


nm

Combined free cash flow(2)


(11.6)


28.1


(141%)


17.9


(24.2)


174%

Average exchange rate (CAD/US$)


1.303


1.320


-


1.341


1.327


-

Net earnings (loss) from continuing operations per share


(0.12)


(0.17)


29%


(0.22)


(0.36)


39%


(1)

  All non-GAAP measures exclude the Ambatovy Joint Venture performance. As a result of the transaction in Q3 2020, Ambatovy Joint Venture’s share of loss of an associate and other statement of comprehensive income (loss) items related to the Ambatovy Joint Venture were reclassified to the loss on discontinued operations in the current and comparative periods. The earnings on discontinued operations also includes the gain on disposal of Ambatovy Joint Venture Interests in the current year period.
 

(2)

  For additional information see the Non-GAAP measures section.
 

(3)

  Not meaningful (nm)

$ millions, as at December 31


2020


2019


Change


Cash, cash equivalents and short-term investments


167.4


166.1


1%

Loans and borrowings


441.4


713.6


(38%)

Cash, cash equivalents, and short-term investments at December 31, 2020 were $167.4 million, up from $165.1 million at September 30, 2020. The increase was due to a number of factors including, receipt of more than US$30.1 million of Cuban energy payments and $26.3 million of dividend distributions from the Moa Joint Venture, partly offset by negative cash flow at Oil and Gas and the $9.3 million purchase of nickel put options.

As at December 31, 2020, $75.0 million of Sherritt’s cash and cash equivalents was held by Energas in Cuba, down from $82.1 million at the end of Q3 2020.

Sherritt received US$30.1 million in Cuban energy payments as part of its overdue receivables agreement with its Cuban partners in Q4 2020. Payments, which included US$27.7 million received in Canada and US$2.4 million accepted in Cuba to support local costs relating to Sherritt’s Oil and Gas operations, were higher than expected as Sherritt’s Moa Joint Venture partner, GNC, redirected US$20.0 million of its share of dividends paid by the joint venture to Sherritt to reduce the overdue receivables.

Total overdue scheduled receivables at December 31, 2020 were US$145.9 million, down from US$159.1 million at September 30, 2020 due to the timing of payments received and re-direction of Moa Joint Venture dividends.

Adjusted net loss(1)


2020


2019

For the three months ended December 31


$ millions


$/share


$ millions


$/share


Net earnings (loss) from continuing operations


(49.3)


(0.12)


(65.6)


(0.17)


Adjusting items:


Unrealized foreign exchange (gain) loss


4.3


0.01


4.6


0.01

Moa JV expansion loans receivable revaluation


-


-


6.8


0.02

Impairment of Power intangible assets


-


-


20.3


0.05

Impairment of Power assets


9.4


0.02


1.4


-

Other


3.9


0.01


14.3


0.04

Adjusted net loss from continuing operations


(31.7)


(0.08)


(18.2)


(0.05)


2020


2019

For the year ended December 31


$ millions

$/share

$ millions

$/share


Net earnings (loss) from continuing operations


(85.7)


(0.22)


(142.4)


(0.36)


Adjusting items:


Unrealized foreign exchange (gain) loss


(4.4)


(0.01)


3.8


0.01

Gain on debenture exchange


(142.3)


(0.36)


-


-

Moa JV expansion loans receivable revaluation


(6.4)


(0.02)


6.8


0.02

Impairment of Oil assets


115.6


0.29


-


-

Impairment of Power intangible assets


-


-


20.3


0.05

Impairment of Power assets


9.4


0.02


1.4


-

Other


9.1


0.04


13.1


0.04

Adjusted net loss from continuing operations


(104.7)


(0.26)


(97.0)


(0.24)


(1)


For additional information see the Non-GAAP measures section.

Net loss for FY2020 includes a gain of $142.3 million on the exchange of debentures as part of the balance sheet initiative offset by an impairment loss recognized on the write down of exploration and evaluation assets and capitalized spare parts relating to Block 10 drilling activities totaling $115.6 million and an impairment on Power assets of $9.4 million.

On the close of the balance sheet initiative in Q3 2020, Sherritt exchanged its 12% ownership interest and its loans and operator fee receivables in the Ambatovy Joint Venture for $145.6 million owed to its partners. Consistent with IFRS standards, Sherritt’s investment in the Ambatovy Joint Venture met the criteria to be classified and presented as discontinued operations for accounting purposes. As a result, Sherritt’s share of loss of an associate, net of tax, and other components of comprehensive income (loss) related to the Ambatovy Joint Venture were reclassified to the earnings (loss) on discontinued operations, net of tax, in the current and comparative periods. For FY2020, Sherritt recognized earnings on the disposition and reclassification of $107.9 million.

METALS MARKET

Nickel

Nickel market conditions continued to improve in the fourth quarter of 2020, sustaining the momentum triggered by the restart of economic activities late in the second quarter, particularly in China, following the easing of restrictions caused by the COVID-19 pandemic.

Market conditions in Q4 also benefited from renewed interest in electric vehicles, bullish forecasts by industry analysts for accelerated demand growth, and multiple announcements from automakers indicating considerable investments to significantly expand electric vehicle production capacity. High purity, or Class 1 nickel, as produced by Sherritt, will be the primary metal in battery chemistries most automakers have adopted.

Nickel prices on the London Metal Exchange opened at US$6.52/lb on October 1 and closed on December 31 at US$7.50/lb, representing a growth of 15%. Nickel prices in 2020 experienced considerable volatility, ranging from a low of US$5.01/lb to a high of US$8.07/lb. In 2020, nickel prices ended the year up 18% from the start of the year.

While nickel prices climbed during Q4, nickel inventory levels on the London Metal Exchange (LME) and the Shanghai Future Exchange (SHFE) remained relatively flat. Combined inventory levels at December 31 totaled approximately 262,900 tonnes, up from approximately 262,700 tonnes at September 30. Nickel inventories on the LME and SHFE have stayed relatively flat despite the reduced production of stainless steel globally on a year to date basis largely because a number of nickel mines around the world have either significantly reduced production or have gone into care and maintenance as a result of the spread of COVID-19. Production at the Moa JV has largely been unaffected by the spread of COVID-19 in 2020.

The momentum of higher nickel prices has carried over into 2021, reaching US$8.38/lb on February 10, the highest price since August 2019. Nevertheless, nickel prices are expected to be volatile over the near and medium term given the softening of demand expected with the interruption of manufacturing activities in China caused by Lunar New Year celebrations in February, and also by the ongoing economic uncertainty caused by the continued spread of the COVID-19 pandemic.

As mining operations resume production activities, nickel inventory levels may rise given that supply could exceed demand as a number of industries that are large consumers of stainless steel, such as food and hospitality sector, will experience a delayed or slower economic recovery, particularly if the second wave of the pandemic is prolonged.

Added to this uncertainty is the substantial increase expected in nickel pig iron production, leading some industry analysts to predict an oversupplied nickel market in the near term. This development is putting additional pressure on producers of lower-grade material such as ferronickel, which is currently selling at significant discount. Combined, these developments suggest near-term nickel price fluctuations.

Over the longer term, as demand for nickel is expected to grow with the increased adoption of electric vehicles and requirement for low-carbon emissions since nickel – along with cobalt – is a key metal needed to manufacture assorted energy storage batteries, more favorable price conditions with less volatility are expected.

Cobalt

Cobalt prices remained relatively flat in the fourth quarter of 2020 according to data collected by Fastmarkets MB. Standard grade cobalt prices on December 31 closed at US$15.60/lb, down from US$15.65/lb at the start of the quarter. Stable prices in the fourth quarter suggest that soft market conditions experienced earlier in the year due the onset of the COVID-19 pandemic have improved. Cobalt prices had declined to US$13.90/lb in July from U$15.53/lb at the start of 2020, largely due to reduced demand emanating from markets, such as the aerospace sector, most impacted by the pandemic.

Since the start of 2021, cobalt prices have climbed to more than US$22.00/lb, largely on news reports that consumers in China have started to stockpile inventory to take advantage of weak prices in anticipation of stronger demand expected with accelerated growth of electric vehicle demand expected in the coming years. Cobalt is a key component of rechargeable batteries providing energy density and stability.

REVIEW OF OPERATIONS

Moa Joint Venture (50% interest) and Fort Site (100%)


For the three months ended


For the year ended


2020


2019


2020


2019


$ millions, except as otherwise noted


December 31


December 31


Change


December 31


December 31


Change


FINANCIAL HIGHLIGHTS


Revenue


$


118.8


$


123.4


(4%)


$


425.5


$


461.0


(8%)

Earnings from operations


4.4


8.7


(49%)


3.9


11.0


(65%)

Adjusted EBITDA(1)


24.8


26.2


(5%)


68.7


70.1


(2%)


CASH FLOW


Cash provided by operations


$


13.4


$


51.6


(74%)


$


53.7


$


59.6


(10%)

Adjusted operating cash flow(1)


24.9


24.0


4%


64.7


66.3


(2%)

Free cash flow(1)


4.1


44.7


(91%)


24.5


33.7


(27%)

Distributions and repayments to Sherritt from the Moa JV


26.3


14.9


77%


39.6


43.3


(9%)


PRODUCTION VOLUMES (tonnes)


Mixed Sulphides


4,421


4,203


5%


17,429


17,010


2%

Finished Nickel


4,020


4,049


(1%)


15,753


16,554


(5%)

Finished Cobalt


451


411


10%


1,685


1,688


-

Fertilizer


56,277


56,284


-


235,886


249,207


(5%)


NICKEL RECOVERY (%)


86%


80%


8%


86%


84%


2%


SALES VOLUMES (tonnes)


Finished Nickel


4,177


4,089


2%


15,687


16,698


(6%)

Finished Cobalt


443


437


1%


1,678


1,766


(5%)

Fertilizer


48,542


46,467


4%


187,922


165,162


14%


AVERAGE-REFERENCE PRICES (US$ per pound)


Nickel


$


7.23


$


7.01


3%


$


6.25


$


6.32


(1%)

Cobalt(2)


15.73


16.90


(7%)


15.58


16.57


(6%)


AVERAGE REALIZED PRICE(1)


Nickel ($ per pound)


$


9.13


$


9.38


(3%)


$


8.16


$


8.37


(3%)

Cobalt ($ per pound)


17.55


19.69


(11%)


17.84


17.80


-

Fertilizer ($ per tonne)


298


351


(15%)


343


417


(18%)


UNIT OPERATING COSTS(1) (US$ per pound)


Nickel - net direct cash cost


$


4.47


$


3.75


19%


$


4.20


$


4.14


1%


SPENDING ON CAPITAL(3)


Sustaining


$


9.3


$


6.9


35%


$


32.2


$


33.6


(4%)


$


9.3


$


6.9


35%


$


32.2


$


33.6


(4%)


(1)

  For additional information see the Non-GAAP measures section.
 

(2)

  Average standard grade cobalt published price per Fastmarkets MB.
 

(3)

  Spending on capital for the year ended December 31, 2019 excludes right of use assets recognized on adoption of IFRS 16. Refer to note 4 of the audited consolidated financial statements for the year ended December 31, 2019 for additional information.

Mixed sulphides production at the Moa JV in Q4 2020 was 4,421 tonnes, up 5% from 4,203 tonnes produced in Q4 2019. The increase in Q4 2020 was largely due to normalized availability of diesel fuel supply at Moa, resulting in the greater use of mining equipment and better access to higher grade material compared to last year. Mixed sulphides production at Moa for much of the second-half of 2019 was negatively impacted by diesel fuel conservation measures implemented in response to reduced diesel fuel supply availability caused by economic and trade sanctions imposed on Venezuela, Cuba’s largest oil supplier. The diesel conservation measures in 2019 included reduced use of mining equipment and increased draw down of lower grade ore stockpiles.

Mixed suphides production for FY2020 was 17,429 tonnes, up 2% from FY2019. The growth was largely attributable to normalized diesel supply in 2020, but also reflective of the ongoing benefits of operational excellence initiatives implemented over the past 24 months and Cuba’s success in limiting the spread of the COVID-19 virus in the country since the start of the global pandemic.

Finished nickel production in Q4 2020 totaled 4,020 tonnes, largely flat with the 4,049 tonnes produced in Q4 2019 while finished cobalt production for Q4 2020 was 451 tonnes, up 10% from the 411 tonnes produced in Q4 2019. Finished production totals in Q4 2020 were negatively impacted by unplanned autoclave repairs at the refinery in Fort Saskatchewan. The repairs resulted in a reduction of nickel and cobalt production to 50% of normal capacity for several days. Repairs were completed before the end of Q4 2020, and finished production resumed to normal capacity.

Despite being impacted by unplanned repairs, Q4’s production totals helped to offset the negative effects of railway service disruptions in Q1 and an extended plant shutdown in Q3 due to additional found work scope and reduced contractor availability due to COVID-19, enabling the Moa JV to largely meet its production guidance of 32,000 to 33,000 tonnes on a 100% basis for the year.


Contacts

Joe Racanelli, Director of Investor Relations
Telephone: (416) 935-2457
Toll-free: 1 (800) 704-6698
E-mail: This email address is being protected from spambots. You need JavaScript enabled to view it.


Read full story here

DUBLIN--(BUSINESS WIRE)--The "Global Marine Vessel Energy Efficiency Market 2021-2025" report has been added to ResearchAndMarkets.com's offering.


The publisher has been monitoring the marine vessel energy efficiency market and it is poised to grow by $163.00 million during 2021-2025 progressing at a CAGR of 4% during the forecast period.

The report on marine vessel energy efficiency market provides a holistic analysis, market size and forecast, trends, growth drivers, and challenges, as well as vendor analysis covering around 25 vendors.

The report offers an up-to-date analysis regarding the current global market scenario, latest trends and drivers, and the overall market environment. The market is driven by the alternative fuel and fuel engine innovations and increase in global naval vessel fleet.

The marine vessel energy efficiency market analysis includes application segment and geographical landscapes. This study identifies the adoption of renewable propulsion technologies as one of the prime reasons driving the marine vessel energy efficiency market growth during the next few years.

Companies Mentioned

  • Becker Marine Systems GmbH
  • Gaztransport & Technigaz SA
  • Haldor Topsoe AS
  • Hyundai Heavy Industries Co. Ltd.
  • MAN Energy Solutions SE
  • Norsepower Oy Ltd.
  • PowerCell Sweden AB
  • Schneider Electric SE
  • Siemens AG
  • Wartsila Corp.

The report on marine vessel energy efficiency market covers the following areas:

  • Marine vessel energy efficiency market sizing
  • Marine vessel energy efficiency market forecast
  • Marine vessel energy efficiency market industry analysis

The study was conducted using an objective combination of primary and secondary information including inputs from key participants in the industry. The report contains a comprehensive market and vendor landscape in addition to an analysis of the key vendors.

The publisher presents a detailed picture of the market by the way of study, synthesis, and summation of data from multiple sources by an analysis of key parameters such as profit, pricing, competition, and promotions. It presents various market facets by identifying the key industry influencers. The data presented is comprehensive, reliable, and a result of extensive research - both primary and secondary. The market research reports provide a complete competitive landscape and an in-depth vendor selection methodology and analysis using qualitative and quantitative research to forecast an accurate market growth.

Key Topics Covered:

1. Executive Summary

  • Market Overview

2. Market Landscape

  • Market ecosystem
  • Market characteristics
  • Value chain analysis

3. Market Sizing

  • Market definition
  • Market segment analysis
  • Market size 2020
  • Market outlook: Forecast for 2020 - 2025

4. Five Forces Analysis

  • Five forces summary
  • Bargaining power of buyers
  • Bargaining power of suppliers
  • Threat of new entrants
  • Threat of substitutes
  • Threat of rivalry
  • Market condition

5. Market Segmentation by Application

  • Market segments
  • Comparison by Application
  • Systems - Market size and forecast 2020-2025
  • Sensors and software - Market size and forecast 2020-2025
  • Market opportunity by Application

6. Customer landscape

7. Geographic Landscape

  • Geographic segmentation
  • Geographic comparison
  • APAC - Market size and forecast 2020-2025
  • Europe - Market size and forecast 2020-2025
  • North America - Market size and forecast 2020-2025
  • MEA - Market size and forecast 2020-2025
  • South America - Market size and forecast 2020-2025
  • Key leading countries
  • Market opportunity by geography
  • Market drivers
  • Market challenges
  • Market trends

8. Vendor Landscape

  • Vendor landscape
  • Landscape disruption
  • Competitive scenario

9. Vendor Analysis

  • Vendors covered
  • Market positioning of vendors
  • Becker Marine Systems GmbH
  • Gaztransport & Technigaz SA
  • Haldor Topsoe AS
  • Hyundai Heavy Industries Co. Ltd.
  • MAN Energy Solutions SE
  • Norsepower Oy Ltd.
  • PowerCell Sweden AB
  • Schneider Electric SE
  • Siemens AG
  • Wartsila Corp.

10. Appendix

  • Scope of the report
  • Currency conversion rates for US$
  • Research methodology
  • List of abbreviations

For more information about this report visit https://www.researchandmarkets.com/r/qo3odq


Contacts

ResearchAndMarkets.com
Laura Wood, Senior Press Manager
This email address is being protected from spambots. You need JavaScript enabled to view it.

For E.S.T Office Hours Call 1-917-300-0470
For U.S./CAN Toll Free Call 1-800-526-8630
For GMT Office Hours Call +353-1-416-8900

CALGARY, Alberta--(BUSINESS WIRE)--(ARX - TSX, VII - TSX) ARC Resources Ltd. ("ARC") and Seven Generations Energy Ltd. ("Seven Generations") today announce a strategic combination of the two premier Montney producers. The combined company will continue to focus on significant free funds flow(1) generation through a responsible and disciplined approach to development while creating superior and enduring value for all shareholders. The combination is consistent with ARC’s and Seven Generations’ long-term strategies and is expected to be immediately accretive on a free funds flow and net asset value per share basis to all shareholders.


The companies have entered into a definitive agreement to combine in an all-share transaction valued at approximately $8.1 billion, inclusive of net debt. The combined company will operate as ARC Resources Ltd. and remain headquartered in Calgary, Alberta. Under the terms of the definitive agreement, Seven Generations shareholders will receive 1.108 common shares of ARC for each common share of Seven Generations held.

TRANSACTION HIGHLIGHTS

  • The combined company will become the premier Montney producer of low-cost natural gas and high-margin condensate, with combined production expected to total over 340,000 boe(2) per day in 2021, comprising approximately 138,000 barrels per day of liquids and approximately 1.2 Bcf per day of natural gas.(3)
  • The transaction will create a combined company with material size and scale that enhances ARC’s and Seven Generations’ existing commodity and geographic diversification. The combined company will become Canada’s largest condensate producer, third-largest natural gas producer, and sixth-largest upstream energy company.
  • The combination will immediately deliver accretive free funds flow per share to all shareholders, yielding synergies that are expected to deliver approximately $110 million in annual cost savings by 2022. The combined company will continue to pay ARC’s quarterly dividend of $0.06 per share, subject to the approval of the Board of Directors.
  • The combined company is expected to generate significant free funds flow at current commodity prices, which will increase optionality in capital allocation decisions, including the ability to fund development of ARC’s Attachie asset, further development of Seven Generations’ Nest asset, and deliver incremental returns to shareholders.
  • Following the combination, ARC will maintain its strong financial position, with financing for the transaction fully committed. The combined company is expected to have an investment-grade credit rating and plans to manage a low-cost capital structure with ample liquidity. The combination also has a strong deleveraging profile, with net debt expected to be reduced to approximately 1.3 times funds from operations by year-end 2021.
  • The combination will advance both companies’ operational excellence and elevate their standing as prominent ESG-focused companies, with ARC and Seven Generations currently delivering the lowest greenhouse gas ("GHG") emissions intensity amongst their Canadian exploration and production peer group.
  • The combined company will benefit from the experience of ARC’s Hal Kvisle as Board Chair and Seven Generations’ Marty Proctor as Board Vice-Chair, and will be led by ARC’s Terry Anderson as President and Chief Executive Officer ("CEO") and director, ARC’s Kris Bibby as Senior Vice President and Chief Financial Officer ("CFO"), and Seven Generations’ David Holt as Senior Vice President and Chief Operating Officer (“COO”).

STRATEGIC RATIONALE

Delivers Immediately Accretive Returns to All Shareholders

The transaction is expected to be immediately accretive on a free funds flow and net asset value per share basis to all shareholders. Funds from operations, free funds flow, and the combined company’s net asset value are all expected to meaningfully increase.

The combined company’s balanced portfolio of top-tier, long-life condensate, liquids-rich, and natural gas assets will expand internal investment optionality. Capital allocation can be further optimized across all commodity cycles to enhance returns and deliver increased shareholder value. The premier Montney land base of the combined company will comprise over 1.1 million net acres of Montney land and a deep inventory of high-return, de-risked core development opportunities. Free funds flow will be allocated towards the company’s highest-returning assets for development, debt reduction, and potential return of capital to shareholders through share buybacks and/or dividend increases.

As part of its returns-focused value proposition, the combined company will pay a quarterly dividend of $0.06 per share, subject to the approval of the Board of Directors.

Accelerates Free Funds Flow Generation

The combined company is expected to generate significant free funds flow due to its prolific Montney resource base, its extensive network of owned-and-operated infrastructure, with natural gas processing and sales capacity of approximately 1.5 Bcf per day, and its low cost structure, which will further improve as a result of the combination. Initial annual sustaining capital requirements are expected to be approximately $1.0 billion. Estimated cost savings and synergies from the combination are expected to drive approximately $110 million in annual free funds flow improvements by 2022, attained through corporate cost savings, operating efficiencies, market optimization opportunities, and drilling and completions efficiencies. The combined company expects to capture additional interest savings as it intends to execute an investment-grade long-term financing plan.

Both ARC and Seven Generations share a focus on operational excellence. Additional synergies and efficiencies beyond those currently assigned a monetary value are expected to be realized as a result of the combination, leveraging the best practices and capabilities of both organizations. Through enhanced market diversification activities, the combined company will have the ability to access multiple downstream markets across North America and will execute an active risk management program with a long-term focus on reducing volatility in funds from operations.

Preserves Strong Financial Position

The combined company is expected to have an investment-grade credit rating and is committed to protecting its strong financial position by maintaining significant financial flexibility with its balance sheet. Financing for the transaction is fully committed, with net debt expected to be reduced to approximately 1.3 times funds from operations by year-end 2021, based on current commodity prices. The combined company has a strong deleveraging plan in place and will target a net debt to annualized funds from operations ratio of between 1.0 and 1.5 times over the long term.

In connection with the combination, ARC has entered in a binding agreement with RBC Capital Markets ("RBC") and CIBC Capital Markets ("CIBC"), who are acting as Joint Bookrunners, to provide the combined company with underwritten aggregate credit facility commitments of up to $3.5 billion which will ensure an ability to optimize the capital structure, including retirement of the Seven Generations outstanding senior notes, while maintaining adequate go-forward liquidity.

Achieves Size and Scale

The complementary assets of ARC and Seven Generations will possess material size and scale, while enhancing existing commodity and geographic diversification. The combined company will be the largest pure-play Montney producer, Canada’s largest condensate producer, third-largest natural gas producer, and sixth-largest upstream energy company. The balanced portfolio of approximately 40 per cent liquids and 60 per cent natural gas at this size and scale results in an enviable and resilient position.

With its increased size and scale, the combined company expects to have improved access to capital and greater relevance in the global energy market. These enhancements are expected to support additional long-term market access and integration opportunities to increase revenue diversification and profitability.

Elevates Position as ESG Leader

ARC and Seven Generations share a commitment to ESG excellence, including managing risks around all aspects of the business, ensuring employees’ and contractors’ safety, and stewarding environmental responsibility, performance, and reporting transparency. ARC and Seven Generations currently have the two lowest GHG emissions intensities amongst their Canadian exploration and production peer group. In addition to delivering strong environmental performance through responsible development activities, good governance, diversity and inclusion, to which both companies share a commitment, strong partnerships, and stakeholder service, will all be part of the combined company’s ESG principles.

PRELIMINARY PRO FORMA 2021 OUTLOOK

Detailed guidance for 2021 will be provided upon closing of the transaction. The preliminary pro forma 2021 outlook estimates capital investments of approximately $1.0 billion to $1.1 billion, which will primarily be focused on sustaining production at ARC’s and Seven Generations’ core operating properties. The combined company is expected to deliver average daily production of over 340,000 boe per day, comprising approximately 138,000 barrels per day of liquids and approximately 1.2 Bcf per day of natural gas. Approximately 60 per cent of production will be produced in Alberta, with the remaining 40 per cent being produced in British Columbia.

GOVERNANCE AND LEADERSHIP

The combined company will bring together the strengths and talents of both organizations to drive superior performance and deliver strong returns to shareholders. Financial strength, disciplined capital allocation, operational excellence, safety, and leading ESG performance, will continue to be key tenets for the organization.

The Board of Directors will consist of 11 members, made up of six directors from ARC and five directors from Seven Generations. ARC’s Hal Kvisle will remain as independent Chair and Seven Generations’ Marty Proctor will join the Board to serve as Vice-Chair. Management will be led by ARC’s Terry Anderson as President and CEO, ARC’s Kris Bibby as Senior Vice President and CFO, and Seven Generations’ David Holt as Senior Vice President and COO.

Additional senior leaders for the combined company will be selected from the senior leadership teams at both organizations and will be named before the close of the transaction.

The combined company will be headquartered in Calgary, Alberta, with field operations headquartered in Grande Prairie, Alberta, Dawson Creek, British Columbia, and Drayton Valley, Alberta.

TRANSACTION DETAILS

Under the terms of the definitive agreement, Seven Generations shareholders will receive 1.108 common shares of ARC for each common share of Seven Generations held. Following the close of the transaction, ARC shareholders will own approximately 49 per cent and Seven Generations shareholders will own approximately 51 per cent of the total shares outstanding.

The transaction is structured through a plan of arrangement in respect of the securities of Seven Generations under the Canada Business Corporations Act and is subject to the approval of at least two-thirds of the votes cast by holders of Seven Generations common shares. The issuance of ARC common shares is subject to the approval of the majority of votes cast by holders of ARC common shares in connection with the transaction. ARC expects to amalgamate Seven Generations upon closing.

The voting directors of both ARC and Seven Generations have unanimously approved the arrangement agreement. Canada Pension Plan Investment Board, which has been a Seven Generations shareholder since 2012 and controls 16.8 per cent of issued and outstanding shares, has entered into a Support Agreement whereby it will vote in favour of the transaction under the terms of the agreement. A joint information circular, which will include details of the transaction, is expected to be mailed to ARC and Seven Generations shareholders by the end of February.

The transaction is subject to shareholder approval for both ARC and Seven Generations, regulatory approvals, and other customary closing conditions. The transaction is expected to close in the second quarter of 2021.

ADVISORS

RBC is acting as exclusive financial advisor to ARC. RBC has provided a verbal opinion to ARC’s board of directors that the exchange ratio under the plan of arrangement is fair, from a financial point of view, to the ARC shareholders and is subject to the assumptions made and the limitations and qualifications included in the written opinion of RBC. Burnet, Duckworth & Palmer LLP is acting as ARC’s legal advisors for the transaction.

CIBC is acting as exclusive financial advisor to Seven Generations. CIBC has provided a verbal opinion to Seven Generations’ board of directors that the exchange ratio under the arrangement is fair, from a financial point of view, to the Seven Generations shareholders and is subject to the assumptions made, as well as the limitations and qualifications included in the written opinion of CIBC. Stikeman Elliott LLP is acting as Seven Generations’ legal advisors for the transaction.

CONFERENCE CALL AND ADDITIONAL MATERIALS

ARC and Seven Generations will be hosting a joint conference call to discuss the transaction on Wednesday, February 10, 2021 at 6:00 p.m. Mountain Time ("MT").

Date

Wednesday, February 10, 2021

Time

6:00 p.m. MT

Webcast Link

https://produceredition.webcasts.com/starthere.jsp?ei=1428800&tp_key=fec8cb8e91

Dial-in Numbers


Calgary

587-880-2171

Toronto

416-764-8659

Toll-free

1-888-664-6392

Conference ID

43893305

A live audio recording of the conference call will also be available on ARC's website at www.arcresources.com and Seven Generations’ website at www.7Genergy.com. A replay will be made available on both companies’ websites following the conference call.

Related presentation materials are available on ARC’s website at www.arcresources.com and Seven Generations’ website at www.7Genergy.com.

NOTES

(1)

Non-GAAP measure that does not have any standardized meaning under International Financial Reporting Standards ("IFRS") and therefore may not be comparable to similar measures presented by other entities. Free funds flow is computed as funds from operations generated during the period less capital expenditures before undeveloped land purchases and property acquisitions and dispositions.

(2)

ARC and Seven Generations have adopted the standard six thousand cubic feet ("Mcf") to one barrel ("bbl") of crude oil ratio when converting natural gas to barrels of oil equivalent ("boe"). Boe may be misleading, particularly if used in isolation. A boe conversion ratio of 6 Mcf:1 bbl is based on an energy equivalency conversion method primarily applicable at the burner tip and does not represent a value equivalency at the wellhead. Given that the value ratio based on the current price of crude oil as compared to natural gas is significantly different than the energy equivalency of the 6:1 conversion ratio, utilizing the 6:1 conversion ratio may be misleading as an indication of value.

(3)

Throughout this news release, crude oil ("crude oil") refers to light, medium, and heavy crude oil product types as defined by National Instrument 51-101 Standards of Disclosure for Oil and Gas Activities ("NI 51-101"). Condensate is a natural gas liquid as defined by NI 51-101. Throughout this news release, NGLs comprise all natural gas liquids as defined by NI 51-101 other than condensate, which is disclosed separately. Throughout this news release, crude oil and liquids ("crude oil and liquids") refers to crude oil, condensate, and NGLs.

ADVISORY STATEMENTS

Basis of Presentation

All financial figures and information have been prepared in Canadian dollars (which includes references to "dollars" and "$"), except where another currency has been indicated, and in accordance with IFRS or GAAP as issued by the International Accounting Standards Board. Production volumes are presented on a before royalties basis.

Non-GAAP Measures

Certain financial measures in this news release do not have a standardized meaning as prescribed by IFRS, such as free funds flow (including on a per share basis), and therefore are considered non-GAAP measures. See the "Capital Management" note of ARC's audited consolidated financial statements as at and for the year ended December 31, 2020 for further information on other measures contained in this news release including funds from operations and net debt. These measures may not be comparable to similar measures presented by other issuers. These measures have been described and presented in order to provide shareholders, potential investors and analysts with additional measures for analyzing the transaction. This additional information should not be considered in isolation or as a substitute for measures prepared in accordance with IFRS.

Note Regarding Forward-looking Information

This news release contains certain forward-looking statements and forward-looking information (collectively referred to as "forward-looking information") within the meaning of applicable securities legislation, about ARC's and Seven Generations' current expectations, estimates, and projections about the future, based on certain assumptions made in light of experiences and perceptions of historical trends. Although ARC and Seven Generations believe that the expectations represented by such forward-looking information are reasonable, there can be no assurance that such expectations will prove to be correct.

This forward-looking information is identified by words such as "achieve", "anticipate", "believe", "can be", "capacity", "committed", "commitment", "continue", "could", "drive", "enhance", "ensure", "estimate", "expect", "focus", "forward", "future", "guidance", "maintain", "may", "outlook", "plan", "position", "potential", "strategy", "should", "target", "will", or similar expressions and includes suggestions of future outcomes, including, but not limited to, statements about: the focus and business strategies of each of ARC and Seven Generations; the estimated value of the transaction; the timing and completion of the plan of arrangement and the acquisition of all issued and outstanding Seven Generations common shares; the timing and anticipated receipt of required regulatory, court, and securityholder approvals for the transaction and other customary closing conditions; ARC's ability to issue securities pursuant to the transaction; the anticipated benefits of the transaction, including corporate, operational, and other synergies and the timing thereof; the ability to integrate the businesses of ARC and Seven Generations; the anticipated production (including the location thereof), land, and inventory of development opportunities of the combined company; anticipated cost savings as a result of transaction synergies, including the anticipated timing of achieving such cost savings; the combined company's financial position including its rating, costs, debt profile, annual sustaining capital requirements, and expected liquidity; the expected management team of the combined company, their positions, and qualifications; the composition of the combined company's board of directors following closing of the transaction; the anticipated effect of the transaction on the competitiveness of the combined company and its profitability, liquidity, and cost structure; the expected increase to funds from operations, free funds flow, and net asset value; the benefits to be achieved from free funds flow, including the anticipated use and allocation of such funds; the anticipated payment of a quarterly dividend, subject to Board approval; the anticipated reduction of net debt and net debt to annualized funds from operations ratio; the expected size and scale of the combined company; the anticipated improved access to markets; the combined company's risk management program; the anticipated safety and reliability of the operations of the combined company; the anticipated benefits from ARC's new credit facility, including the amount thereof; the anticipated relevancy of the combined company in the global energy market and expected long-term opportunities; the continuing commitment to ESG excellence, good governance, diversity, and inclusion; expected capital investments and pro forma financial outlook; the expected headquarters of the combined company; the expected shareholder ownership following the business combination; the expected timing and mailing of the joint information circular; the anticipated timing of the closing of the transaction; the anticipated method and timing of the shareholders' meetings of ARC and Seven Generations; and other similar statements. Readers are cautioned not to place undue reliance on forward-looking information as the combined company's actual results may differ materially from those expressed or implied.

Developing forward-looking information involves reliance on a number of assumptions and consideration of certain risks and uncertainties, some of which are specific to ARC, Seven Generations, and the combined company, and others that apply to the industry generally. The factors or assumptions on which the forward-looking information is based include, but are not limited to: the satisfaction of the conditions to closing of the transaction in a timely manner and completing the arrangement on the expected terms; anticipated returns to shareholders; the combined company's ability to successfully integrate the businesses of ARC and Seven Generations; access to sufficient capital to pursue any development plans associated with full ownership of Seven Generations; the combined company's ability to issue securities; the impacts the transaction may have on the current credit ratings of ARC and Seven Generations and the credit rating of the combined company following closing; forecast commodity prices and other pricing assumptions; forecast production volumes based on business and market conditions; the accuracy of outlooks and projections contained herein; projected capital investment levels, the flexibility of capital spending plans, and associated sources of funding; achievement of further cost reductions and sustainability thereof; applicable royalty regimes, including expected royalty rates; future improvements in availability of product transportation capacity; increases to the combined company's share price and market capitalization over the long term; opportunity for the combined company to pay dividends, and the approval and declaration of such dividends by the Board of the combined company; opportunities to repurchase shares for cancellation at prices acceptable to the combined company; cash flows, cash balances on hand, and access to credit facilities being sufficient to fund capital investments; foreign exchange rates; the anticipated effects of the recent cancellation of the Keystone XL Project and its effect on commodity prices; near-term pricing and continued volatility of the market; the ability of the combined company's refining capacity, dynamic storage, existing pipeline commitments, and financial hedge transactions to partially mitigate a portion of the combined company's risks against wider price differentials; estimates of quantities of oil, bitumen, natural gas, and liquids from properties and other sources not currently classified as proved; accounting estimates and judgments; future use and development of technology and associated expected future results; the combined company's ability to obtain necessary regulatory approvals; the successful and timely implementation of capital projects or stages thereof; the ability to generate sufficient cash flow to meet current and future obligations; estimated abandonment and reclamation costs, including associated levies and regulations applicable thereto; the combined company's ability to obtain and retain qualified staff and equipment in a timely and cost-efficient manner; the combined company's ability to carry out transactions on the desired terms and within the expected timelines; forecast inflation and other assumptions inherent in the current guidance of ARC and Seven Generations; the retention of key properties; the continuance of existing tax, royalty, and regulatory regimes; the accuracy of the estimates of each of ARC's and Seven Generation's reserve volumes; the combined company's ability to access and implement all technology necessary to efficiently and effectively operate its assets; the ongoing impact of novel coronavirus COVID-19 ("COVID-19") on commodity prices and the global economy; and other risks and uncertainties described from time to time in the filings made by ARC and Seven Generations with securities regulatory authorities.


Contacts

Kris Bibby
Senior Vice President and CFO
ARC Resources Ltd.
403-503-8675
This email address is being protected from spambots. You need JavaScript enabled to view it.

Martha Wilmot
Investor Relations Analyst
ARC Resources Ltd.
403-509-7280
This email address is being protected from spambots. You need JavaScript enabled to view it.

Brian Newmarch
Vice President, Capital Markets and Stakeholder Engagement
Seven Generations Energy Ltd.
403-767-0752
This email address is being protected from spambots. You need JavaScript enabled to view it.

Ryan Galloway
Director, Investor Relations
Seven Generations Energy Ltd.
403-718-0709
This email address is being protected from spambots. You need JavaScript enabled to view it.


Read full story here

TORONTO--(BUSINESS WIRE)--Almonty Industries Inc. (“Almonty”) (TSX: AII / OTCQX: ALMTF / Frankfurt: ALI.F) is pleased to announce that it has now scheduled a start date of the week of April 12th, 2021 to commence a 12,500m drilling campaign to convert the existing historical data for its Sangdong Molybdenum Project into a NI 43-101 and JORC compliant report. The estimated time of this campaign is approximately 6 months to completion. This campaign will be focused around the previous 12,390m of historical core drilling that was conducted by Korea Tungsten and KORES in the 1980’s. At that time, indications of the preliminary high-grade ore reserves estimate were shown with grades in excess of 0.40% MoS2 with tonnage in excess of 16.30mt. The preliminary low grade global reserves indicated grades in excess of 0.11% with tonnage in excess of 120mt. If confirmed, this would create one of the world’s largest long life high grade Molybdenum projects. The Molybdenum orebody is located just 150 metres below the tungsten deposit.


Almonty’s Chairman, President and CEO Lewis Black commented:

“Our Molybdenum deposit now has every possibility to be proven to be as significant a deposit as our Tungsten project at Sangdong. Certainly, in what we know from the previous drilling conducted in part by the Korean government and by the Company, itself, all indications point to one of the world’s most significant high grade Moly projects. This campaign will allow the Company to confirm this historical data as well as formulate a robust mining plan so that this project will run alongside our tungsten mine simultaneously given that both can share the same existing mining infrastructure and the dramatic development cost savings it presents. This campaign will also allow the Company to attribute a value to the Moly deposit where currently in the absence of a NI 43-101 compliant report, it cannot apply any book value to these reserves. Being LME traded has enormous benefits to the Company regarding hedging and pricing transparency. LME quoted Molybdenum is up 54% in the last 6 months.”

About Almonty

The principal business of Toronto, Canada-based Almonty Industries Inc. is the mining, processing and shipping of tungsten concentrate from its Los Santos mine in western Spain and its Panasqueira mine in Portugal as well as the development of its Sangdong tungsten mine in Gangwon Province, South Korea and the development of the Valtreixal tin/tungsten project in north western Spain. The Los Santos mine was acquired by Almonty in September 2011 and is located approximately 50 kilometres from Salamanca in western Spain and produces tungsten concentrate. The Panasqueira mine, which has been in production since 1896, located approximately 260 kilometres northeast of Lisbon, Portugal, was acquired in January 2016 and produces tungsten concentrate. The Sangdong mine, which was historically one of the largest tungsten mines in the world and one of the few long-life, high-grade tungsten deposits outside of China, was acquired in September 2015 through the acquisition of a 100% interest in Woulfe Mining Corp. Almonty owns 100% of the Valtreixal tin-tungsten project in north-western Spain. Further information about Almonty’s activities may be found at www.almonty.com and under Almonty’s SEDAR profile at www.sedar.com.

Legal Notice

The release, publication or distribution of this announcement in certain jurisdictions may be restricted by law and therefore persons in such jurisdictions into which this announcement is released, published or distributed should inform themselves about and observe such restrictions.

Neither TSX nor its Regulation Services Provider (as that term is defined in the policies of the TSX) accepts responsibility for the adequacy or accuracy of this release.

Disclaimer for Forward-Looking Information

When used in this press release, the words “estimate”, “project”, “belief”, “anticipate”, “intend”, “expect”, “plan”, “predict”, “may” or “should” and the negative of these words or such variations thereon or comparable terminology are intended to identify forward-looking statements and information. This press release contains forward-looking statements. These statements and information are based on management’s beliefs, estimates and opinions on the date that statements are made and reflect Almonty’s current expectations.

Forward-looking statements are subject to known and unknown risks, uncertainties and other factors that may cause the actual results, level of activity, performance or achievements of Almonty to be materially different from those expressed or implied by such forward-looking statements, including but not limited to: any specific risks relating to fluctuations in the price of ammonium para tungstate from which the sale price of Almonty’s tungsten concentrate is derived, actual results of mining and exploration activities, environmental, economic and political risks of the jurisdictions in which Almonty’s operations are located and changes in project parameters as plans continue to be refined, forecasts and assessments relating to Almonty’s business, credit and liquidity risks, hedging risk, competition in the mining industry, risks related to the market price of Almonty’s shares, the ability of Almonty to retain key management employees or procure the services of skilled and experienced personnel, risks related to claims and legal proceedings against Almonty and any of its operating mines, risks relating to unknown defects and impairments, risks related to the adequacy of internal control over financial reporting, risks related to governmental regulations, including environmental regulations, risks related to international operations of Almonty, risks relating to exploration, development and operations at Almonty’s tungsten mines, the ability of Almonty to obtain and maintain necessary permits, the ability of Almonty to comply with applicable laws, regulations and permitting requirements, lack of suitable infrastructure and employees to support Almonty’s mining operations, uncertainty in the accuracy of mineral reserves and mineral resources estimates, production estimates from Almonty’s mining operations, inability to replace and expand mineral reserves, uncertainties related to title and indigenous rights with respect to mineral properties owned directly or indirectly by Almonty, the ability of Almonty to obtain adequate financing, the ability of Almonty to complete permitting, construction, development and expansion, challenges related to global financial conditions, risks related to future sales or issuance of equity securities, differences in the interpretation or application of tax laws and regulations or accounting policies and rules and acceptance of the TSX of the listing of Almonty shares on the TSX.

Forward-looking statements are based on assumptions management believes to be reasonable, including but not limited to, no material adverse change in the market price of ammonium para tungstate, the continuing ability to fund or obtain funding for outstanding commitments, expectations regarding the resolution of legal and tax matters, no negative change to applicable laws, the ability to secure local contractors, employees and assistance as and when required and on reasonable terms, and such other assumptions and factors as are set out herein. Although Almonty has attempted to identify important factors that could cause actual results, level of activity, performance or achievements to differ materially from those contained in forward-looking statements, there may be other factors that cause results, level of activity, performance or achievements not to be as anticipated, estimated or intended. There can be no assurance that forward-looking statements will prove to be accurate and even if events or results described in the forward-looking statements are realized or substantially realized, there can be no assurance that they will have the expected consequences to, or effects on, Almonty. Accordingly, readers should not place undue reliance on forward-looking statements and are cautioned that actual outcomes may vary.

Investors are cautioned against attributing undue certainty to forward-looking statements. Almonty cautions that the foregoing list of material factors is not exhaustive. When relying on Almonty’s forward-looking statements and information to make decisions, investors and others should carefully consider the foregoing factors and other uncertainties and potential events.

Almonty has also assumed that material factors will not cause any forward-looking statements and information to differ materially from actual results or events. However, the list of these factors is not exhaustive and is subject to change and there can be no assurance that such assumptions will reflect the actual outcome of such items or factors.

THE FORWARD-LOOKING INFORMATION CONTAINED IN THIS PRESS RELEASE REPRESENTS THE EXPECTATIONS OF ALMONTY AS OF THE DATE OF THIS PRESS RELEASE AND, ACCORDINGLY, IS SUBJECT TO CHANGE AFTER SUCH DATE. READERS SHOULD NOT PLACE UNDUE IMPORTANCE ON FORWARD-LOOKING INFORMATION AND SHOULD NOT RELY UPON THIS INFORMATION AS OF ANY OTHER DATE. WHILE ALMONTY MAY ELECT TO, IT DOES NOT UNDERTAKE TO UPDATE THIS INFORMATION AT ANY PARTICULAR TIME EXCEPT AS REQUIRED IN ACCORDANCE WITH APPLICABLE LAWS.


Contacts

Almonty
Lewis Black
Chairman, President and CEO
Telephone: +1 647 438-9766
Email: This email address is being protected from spambots. You need JavaScript enabled to view it.

Includes B. Riley Financial exchanging a portion of its existing Tranche A term loan for $35 million of senior notes

AKRON, Ohio--(BUSINESS WIRE)--$BW #BabcockWilcox--Babcock & Wilcox Enterprises, Inc. ("B&W" or the "Company") (NYSE: BW) announced that on February 10, 2021 it priced an underwritten public offering of $120 million aggregate principal amount of 8.125% senior notes due 2026. B&W has granted the underwriters a 30-day option to purchase up to an additional $5 million aggregate principal amount of senior notes in connection with the offering. The offering is expected to close on February 12, 2021, subject to customary closing conditions.


B&W and the senior notes both received a rating of BB+ from Egan-Jones Ratings Company, an independent, unaffiliated rating agency. The Company has applied to list the notes on NYSE under the symbol “BWSN” and expects the notes to begin trading within 30 business days of the closing date of this offering, if approved.

In addition to the public offering, B. Riley Financial, Inc. is exchanging $35 million of its existing Tranche A term loan for $35 million principal amount of senior notes in a concurrent private offering. Following the completion of the offerings, the interest rate on the remaining Tranche A term loan balance will be reduced to an interest rate of 6.625%, compared to its current rate of 12%.

The Company expects to use the net proceeds of this offering to support clean energy growth initiatives, substantially pay down its revolving credit facility and permanently reduce the facility size by 75% of the senior note value exclusive of the value of the B. Riley Financial term loan exchange.

B. Riley Securities, Inc. is acting as lead book-running manager for the offering. D.A. Davidson & Co., Janney Montgomery Scott LLC, Ladenburg Thalmann & Co. Inc., and National Securities Corporation are acting as joint book-running managers for the offering. Aegis Capital Corp., Boenning & Scattergood, Inc., Huntington Securities, Inc. and Kingswood Capital Markets, division of Benchmark Investments, Inc. are acting as co-managers for the offering.

The senior notes will be offered under the Company's shelf registration statement on Form S-3, which was declared effective by the Securities and Exchange Commission ("SEC") on February 13, 2020. The offering will be made only by means of a prospectus supplement and accompanying base prospectus, which will be filed with the SEC. Copies of the preliminary prospectus supplement and the accompanying base prospectus for the offering may be obtained on the SEC's website at www.sec.gov, or by contacting B. Riley Securities by telephone at (703) 312-9580, or by email at This email address is being protected from spambots. You need JavaScript enabled to view it.. The final terms of the proposed offering will be disclosed in a final prospectus supplement to be filed with the SEC.

This press release shall not constitute an offer to sell or the solicitation of an offer to buy, nor shall there be any sale of these securities in any state or jurisdiction in which such offer, sale or solicitation would be unlawful prior to registration or qualification under the securities laws of any such state or jurisdiction.

Forward-Looking Statements

Statements in this press release that are not descriptions of historical facts are forward-looking statements that are based on management's current expectations and assumptions and are subject to risks and uncertainties. If such risks or uncertainties materialize or such assumptions prove incorrect, our business, operating results, financial condition and stock price could be materially negatively affected. You should not place undue reliance on such forward-looking statements, which are based on the information currently available to us and speak only as of the date of this press release. Such forward looking statements include, but are not limited to, statements regarding the Company's public offering of senior notes, the intent of a lender to convert $35 million of its existing term loan to senior notes, the revolving credit facility to be permanently reduced by 75% of the senior note value, and the interest on remaining Tranche A term loan to be significantly reduced. Factors that could cause such actual results to differ materially from those contemplated or implied by such forward-looking statements include, without limitation, the risks associated with the unpredictable and ongoing impact of the COVID-19 pandemic and other risks described from time to time in the Company's periodic filings with the SEC, including, without limitation, the risks described in the Company's Annual Report on Form 10-K for the year ended December 31, 2019 and Quarterly Reports on Form 10-Q for the quarters ended March 31, 2020, June 30, 2020 and September 30, 2020 under the captions "Risk Factors" and "Management's Discussion and Analysis of Financial Condition and Results of Operations" (as applicable). These factors should be considered carefully, and B&W Enterprises cautions not to place undue reliance on these forward-looking statements, which speak only as of the date of this release, and undertakes no obligation to update or revise any forward-looking statement, except to the extent required by applicable law.

About Babcock & Wilcox Enterprises

Headquartered in Akron, Ohio, Babcock & Wilcox Enterprises is a global leader in energy and environmental technologies and services for the power and industrial markets.


Contacts

Investor Contact:
Megan Wilson
Vice President, Corporate Development & Investor Relations
Babcock & Wilcox Enterprises
704.625.4944 | This email address is being protected from spambots. You need JavaScript enabled to view it.

Media Contact:
Ryan Cornell
Public Relations
Babcock & Wilcox Enterprises
330.860.1345 | This email address is being protected from spambots. You need JavaScript enabled to view it.

EDISON, N.J.--(BUSINESS WIRE)--U.S. Shipping Corp. (“USSC” or the “Company”), a leading provider of long-haul marine transportation for chemical and petroleum cargoes in the U.S. coastwise trade operating under the Jones Act, announced that it has closed a refinancing transaction with Marathon Asset Management LP (“Marathon”), Riverstone Credit Partners LLC (“Riverstone”) and Old Hill Partners Inc. (“Old Hill”). Proceeds from the transaction, together with a portion of the Company’s cash balances, were used to fully refinance the Company’s existing indebtedness.

USSC was founded in 2002 as a provider of marine transportation services for major oil companies. Over the years, USSC has expanded its business to encompass transporting chemical products for major chemical companies and established a reputation for quality and reliability.

“We’re extremely excited to partner with Marathon, Riverstone and Old Hill as our new lenders during this next chapter for the Company,” said Al Bergeron, Chief Executive Officer at USSC. “We look forward to partnering with these lenders to further strengthen our business as the U.S. economy continues to recover.”

Adam Conrad, managing director and head of Maritime Finance at Marathon, said, “USSC’s unique offering and consistent market presence within the Jones Act trade make this a very attractive credit. We believe in the Company’s strategic vision and the ability of the management team to achieve it.”

Jefferies LLC acted as financial advisor to USSC and Norton Rose Fulbright US LLP and Hill, Betts & Nash LLP served as its legal advisors. Watson Farley & Williams LLP and Baker Botts L.L.P. served as legal advisors to Marathon and Riverstone, respectively.

About U.S. Shipping Corporation

U.S. Shipping operates a fleet of six U.S.-flagged vessels including one highly sophisticated parcel tanker, one product tanker, and four state-of-the-art articulated tug barges. The Company transports commodity chemicals and petroleum products and petroleum throughout the U.S. More information can be obtained at www.usshipcorp.com.


Contacts

For inquiries please contact:
Albert E. Bergeron, +1-732-635-2705, This email address is being protected from spambots. You need JavaScript enabled to view it.

Industry Vet Brings 25 Years of Innovation to Video Content Analytics Leader

BOSTON--(BUSINESS WIRE)--BriefCam, the industry's leading provider of Video Content Analytics solutions, today announced the appointment of Igal Dvir as VP Technology & Product. In this newly created role, Dvir will oversee product vision, strategy, and roadmap execution to drive company-wide innovation.


"BriefCam has an impressive track record of continued growth and innovation, and its disruptive technology is a key reason for that success,” said Dvir. “I look forward to working with this talented team to take BriefCam’s video analytics product offerings to the next stage.”

Dvir has 25 years of experience in computer vision, deep learning, video technologies, and system architecture, most recently serving as head of computer vision for autonomous systems for Rafael Advanced Defense Systems. He began his career at NICE Systems in 1996, rising to the level of CTO, VP R&D before departing in 2009 to join DVTel. Dvir has also held leadership positions with HTS and Tyco (now merged into Johnson Controls). He holds over a dozen patents in video surveillance, analytics, and related fields.

"Igal's proven leadership skills and commitment to strategic innovation make him an excellent addition to our executive team," said Gil Briman, CEO of BriefCam. "As the company explores new markets and opportunities, Igal will play an integral part in developing our growth strategy."

About BriefCam

BriefCam is the industry's leading provider of Deep Learning and VIDEO SYNOPSIS® solutions for rapid video review and search, face and license plate recognition, real-time alerting, and quantitative video insights. By transforming raw video into actionable intelligence, BriefCam dramatically shortens the time-to-target for security threats while increasing safety and optimizing operations. BriefCam's award-winning products are deployed by law enforcement and public safety organizations, government and transportation agencies, major enterprises, healthcare and educational institutions, and local communities worldwide.


Contacts

Mark Prindle
Fusion PR
917-517-4091
This email address is being protected from spambots. You need JavaScript enabled to view it.

Company to complete nation’s largest multi-state wind investment in 2021

MINNEAPOLIS--(BUSINESS WIRE)--At the end of 2020, Xcel Energy became one of the first energy providers in the United States to reach 10,000 megawatts of wind energy capacity online for customers in the states it serves. The milestone is powered by the company’s 10 new wind projects in the Upper Midwest, Colorado, Texas, and New Mexico.

While many projects are already completed, all the projects will be online by year’s end, completing the largest multi-state wind investment in the country. As new projects continue to come online in 2021, the company estimates more than 31% of its nameplate energy capacity will come from wind by the end of the year. Additionally, Xcel Energy owns and operates much of the new wind, increasing its owned projects from 850 megawatts, to 4,469 megawatts by the end of the year.

“We launched an ambitious wind energy expansion in 2017 as part of our ongoing commitment to reduce carbon emissions while continuing to provide safe, reliable, and affordable service for our customers,” said Ben Fowke, chairman and CEO, Xcel Energy. “The new wind projects we’ve added will save customers money in the coming decades, are among the most cost-effective energy sources on our grid and are integral to our groundbreaking vision to deliver 100% carbon-free electricity to our customers by 2050.”

Xcel Energy is the first major U.S. power provider to announce a commitment to reducing carbon emissions by 80% (from 2005 levels) by 2030, with a vision of delivering 100% carbon-free electricity by 2050. The company is more than halfway to that interim goal.

The projects enabled the creation of thousands of construction jobs and hundreds of permanent operations and maintenance jobs, while also supporting local governments and landowners who receive benefits through lease payments and taxes that help support local infrastructure.

New wind projects powering communities throughout Xcel Energy’s service territories

Xcel Energy has built new wind farms, repowered other projects, and secured new power purchase agreements (PPAs) for projects throughout its service territories since 2016, totaling more than 4,000 megawatts (MW), including:

Colorado:

  • Bronco Plains, 300 MW, completed in 2020 (PPA)
  • Cheyenne Ridge, 500 MW, completed in 2020 (owned)
  • Colorado Green, 200 MW, completed in 2020 (PPA)
  • Mountain Breeze, 171 MW, completed in 2020 (PPA)
  • Rush Creek, 600 MW, completed in 2018 (owned)

New Mexico/Texas:

  • Bonita, 230 MW, completed in 2018 (PPA)
  • Hale, 478 MW, completed in 2019 (owned)
  • Sagamore Wind, 522 MW, completed in 2020 (owned)

Upper Midwest:

  • Blazing Star 1, 200 MW, completed in 2019 (owned)
  • Community Wind North, 26 MW, completed in 2020 (owned)
  • Crowned Ridge 1, 200 MW, completed in 2020 (owned)
  • Crowned Ridge 2, 200 MW, completed in 2020 (PPA)
  • Foxtail Wind, 150 MW, completed in 2019 (owned)
  • Glen Ullin Wind, 106 MW, completed in 2019 (PPA)
  • Jeffers Wind, 44 MW, completed in 2020 (owned)
  • Lake Benton 2, 100 MW, completed in 2019 (owned)

Several other Upper Midwest projects are under construction and will be complete in 2021, including:

  • Blazing Star 2, 200 MW (owned)
  • Dakota Range 1-2, 296 MW (owned)
  • Dakota Range 3, 150 MW (PPA)
  • Freeborn Wind, 200 MW (owned)
  • Mower Wind, 99 MW (owned)
  • Deuel Harvest Wind, 100 MW (PPA)

About Xcel Energy

Xcel Energy (NASDAQ: XEL) provides the energy that powers millions of homes and businesses across eight Western and Midwestern states. Headquartered in Minneapolis, the company is an industry leader in responsibly reducing carbon emissions and producing and delivering clean energy solutions from a variety of renewable sources at competitive prices. For more information, visit xcelenergy.com or follow us on Twitter and Facebook.


Contacts

Xcel Energy Media Relations
(612) 215-5300
www.xcelenergy.com

DUBLIN--(BUSINESS WIRE)--The "Liquefied Petroleum Gas (LPG) Market: Global Industry Trends, Share, Size, Growth, Opportunity and Forecast 2020-2025" report has been added to ResearchAndMarkets.com's offering.


The global liquefied petroleum gas (LPG) market grew at a CAGR of around 6% during 2014-2019. Looking forward, the publisher expects the global liquefied petroleum gas (LPG) market to continue its moderate growth during the next five years.

Liquified petroleum gas (LPG) refers to a non-renewable source of energy commonly used as a portable, clean and non-toxic energy source in various domestic and industrial applications. It is a combination of flammable hydrocarbon gases and volatile hydrocarbons, such as propane, butane and isobutane and is stored in steel vessels, large gas cylinders and tanks. In comparison to natural gas, LPG burns readily in air and has higher heat energy. It also offers various other benefits, such as clean-burning, no soot, easily controllable flame temperatures and minimal sulfur content, thereby making it highly efficient for heating, cooking and automotive applications.

Increasing infrastructural developments across the globe represents one of the key factors driving the growth of the market. Furthermore, the rising environmental consciousness among the masses regarding the benefits of using LPG as an effective alternative to fossil fuels, is creating a positive outlook for the market. In line with this, significant growth in the automotive industry is also driving the market growth. LPG is widely used as an autogas and is a clean and effective source of energy that has lower levels of carbon emissions. It is stored in pressurized cylindrical containers for use in agricultural, hospitality, construction and sailing applications.

Additionally, improvements in the extraction and refining technologies for natural gases are favoring the market growth. Other factors, including the implementation of various government initiatives to promote the usage of LPG in place of coal, wood and kerosene for household cooking, along with rapid urbanization, especially in developing economies, are anticipated to drive the market further.

Companies Mentioned

  • Bharat Petroleum Corporation Limited
  • BP P.L.C.
  • Chevron Corporation
  • China Gas Holdings Ltd.
  • Exxon Mobil Corporation
  • Origin Energy Limited
  • Petroliam Nasional Berhad
  • Phillips 66 Company
  • Repsol S.A.
  • Royal Dutch Shell PLC
  • Valero Energy Corporation

Key Questions Answered in This Report:

  • How has the global liquefied petroleum gas (LPG) market performed so far and how will it perform in the coming years?
  • What has been the impact of COVID-19 on the global liquefied petroleum gas (LPG) market?
  • What are the key regional markets?
  • What is the breakup of the market based on the source?
  • What is the breakup of the market based on the application?
  • What is the breakup of the market based on the supply mode?
  • What are the various stages in the value chain of the industry?
  • What are the key driving factors and challenges in the industry?
  • What is the structure of the global liquefied petroleum gas (LPG) market and who are the key players?
  • What is the degree of competition in the industry?

Key Topics Covered:

1 Preface

2 Scope and Methodology

2.1 Objectives of the Study

2.2 Stakeholders

2.3 Data Sources

2.3.1 Primary Sources

2.3.2 Secondary Sources

2.4 Market Estimation

2.4.1 Bottom-Up Approach

2.4.2 Top-Down Approach

2.5 Forecasting Methodology

3 Executive Summary

4 Introduction

4.1 Overview

4.2 Key Industry Trends

5 Global Liquefied Petroleum Gas (LPG) Market

5.1 Market Overview

5.2 Market Performance

5.3 Impact of COVID-19

5.4 Market Forecast

6 Market Breakup by Source

6.1 Refinery

6.1.1 Market Trends

6.1.2 Market Forecast

6.2 Associated Gas

6.2.1 Market Trends

6.2.2 Market Forecast

6.3 Non-Associated Gas

6.3.1 Market Trends

6.3.2 Market Forecast

7 Market Breakup by Application

7.1 Residential

7.1.1 Market Trends

7.1.2 Market Forecast

7.2 Commercial

7.2.1 Market Trends

7.2.2 Market Forecast

7.3 Refinery and Petrochemical

7.3.1 Market Trends

7.3.2 Market Forecast

7.4 Transportation

7.4.1 Market Trends

7.4.2 Market Forecast

7.5 Others

7.5.1 Market Trends

7.5.2 Market Forecast

8 Market Breakup by Supply Mode

8.1 Packaged

8.1.1 Market Trends

8.1.2 Market Forecast

8.2 Bulk and On-Site

8.2.1 Market Trends

8.2.2 Market Forecast

9 Market Breakup by Region

9.1 North America

9.2 Asia Pacific

9.3 Europe

9.4 Latin America

9.5 Middle East and Africa

10 SWOT Analysis

11 Value Chain Analysis

12 Porters Five Forces Analysis

13 Price Analysis

14 Competitive Landscape

14.1 Market Structure

14.2 Key Players

14.3 Profiles of Key Players

For more information about this report visit https://www.researchandmarkets.com/r/ghp560


Contacts

ResearchAndMarkets.com
Laura Wood, Senior Press Manager
This email address is being protected from spambots. You need JavaScript enabled to view it.
For E.S.T Office Hours Call 1-917-300-0470
For U.S./CAN Toll Free Call 1-800-526-8630
For GMT Office Hours Call +353-1-416-8900

Offshore Source Logo

Offshore Source keeps you updated with relevant information concerning the Offshore Energy Sector.

Any views or opinions represented on this website belong solely to the author and do not represent those of the people, institutions or organizations that Offshore Source or collaborators may or may not have been associated with in a professional or personal capacity, unless explicitly stated.

Corporate Offices

Technology Systems Corporation
8502 SW Kansas Ave
Stuart, FL 34997

info@tscpublishing.com