Business Wire News

Untrained workers installing photovoltaics (PV) can lead to issues, so it’s imperative to train your employees about solar PV connector safety.

ARLINGTON, Va.--(BUSINESS WIRE)--The Electrical Safety Foundation International (ESFI) and The National Electrical Manufacturers Association’s (NEMA) Solar PV Council are partnering to raise awareness of solar PV connector safety. Improper installation and connector issues can cause fires and injure workers, so proper installation is imperative. In some cases, connectors with high operating temperatures may be the only warning sign of PV failure. Follow these tips on recommended installation practices and warning signs of failure:


Recommended Installation Practices

  • Manufacturer provided or recommended tools must be used.
  • Only use connector parts from the same manufacturer. Interoperability issues may occur when using connectors from different manufacturers.
  • 2020 NEC UL6703 requires that two parts of connector pairs must be tested together and certified for inter-matability.
  • Ensure open connectors and cables are protected from exposure prior to installation. Any connectors that are damaged, soiled or exposed to water before installation should be discarded.

Why Failures Happen

  • Soiled and dirty, mismatched, or counterfeit connectors
  • Improper installation
  • Lack of training
  • Faulty materials
  • Improper installation tools

Warning Signs of Failure

  • Loose or disconnected connectors
  • High temperatures and melted, discolored, or cracked casing
  • High resistance due to soiling, corrosion, foreign particles, or improper surface contact on metal contacts
  • Increased alarms on monitoring systems
  • Moisture or water ingress - broken seal and/or separated connectors
  • Material degradation and exposure to elements

Diagnosing and Preventing Connector Failures

  • Proper training and education are the best prevention measures.
  • The manufacturer’s assembly instructions should be followed.
  • Use thermal imaging to find abnormal temperature readings.
  • Thermal imaging on the ground can identify issues. Drone imaging may miss connector issues that are underneath modules.
  • Visually inspect connectors to locate any physical or heat-related damage.
  • Issues with connectors can cause power loss or fires and create ground faults that could be lethal.
  • Issues impact performance, cause downtime, and have a monetary impact.

If you would like access to free electrical safety materials you can share throughout your workplace, including a Solar PV Connector Safety infographic, visit esfi.org and NEMA Solar PV Council.

ABOUT ESFI

ESFI is a 501(c)(3) non-profit organization dedicated to promoting electrical safety at home and the workplace. For more information, visit esfi.org.


Contacts

Brianne Deerwester
ESFI
703.841.3295
This email address is being protected from spambots. You need JavaScript enabled to view it.

DALLAS--(BUSINESS WIRE)--Texas Pacific Land Corporation (NYSE: TPL) (the “Company” or “TPL”) today announced that it intends to further adjourn its 2022 annual meeting of stockholders (as further adjourned, the “2022 Annual Meeting”). The 2022 Annual Meeting, which had originally been adjourned to February 14, 2023, will be further adjourned to May 18, 2023 at 10:30 am Central Time at the Company’s offices located at 1700 Pacific Avenue, Suite 2900, Dallas, Texas.

The Delaware Court of Chancery has set a one-day trial currently scheduled to be held on April 17, 2023 to hear arguments regarding the Company’s disagreement with Horizon Kinetics LLC, Horizon Kinetics Asset Management LLC, SoftVest Advisors LLC, and SoftVest, L.P. over their voting commitments pursuant to a stockholders’ agreement with the Company. The adjournment of the 2022 Annual Meeting is intended to provide the Delaware Court of Chancery sufficient time to issue a ruling and stockholders the opportunity to evaluate such ruling prior to the Company reconvening the 2022 Annual Meeting.

The 2022 Annual Meeting will reconvene on February 14, 2023 only to immediately further adjourn without conducting any other business; accordingly, the Company recommends stockholders not attend on February 14, 2023. A revised notice for the 2022 Annual Meeting will be sent to stockholders in due course. The record date for the 2022 Annual Meeting remains the close of business on September 22, 2022.

If you have any questions about this announcement, please contact Investor Relations at 1700 Pacific Avenue, Suite 2900, Dallas, Texas, 75201 or This email address is being protected from spambots. You need JavaScript enabled to view it..

About Texas Pacific Land Corporation

Texas Pacific Land Corporation is one of the largest landowners in the State of Texas with approximately 880,000 acres of land in West Texas, with the majority of its ownership concentrated in the Permian Basin. The Company is not an oil and gas producer, but its surface and royalty ownership provide revenue opportunities throughout the life cycle of a well. These revenue opportunities include fixed fee payments for use of our land, revenue for sales of materials (caliche) used in the construction of infrastructure, providing sourced water and/or treated produced water, revenue from our oil and gas royalty interests, and revenues related to saltwater disposal on our land. The Company also generates revenue from pipeline, power line and utility easements, commercial leases and temporary permits related to a variety of land uses including midstream infrastructure projects and hydrocarbon processing facilities.

Visit TPL at http://www.TexasPacific.com.


Contacts

Investor Relations
This email address is being protected from spambots. You need JavaScript enabled to view it.

DULUTH, Minn.--(BUSINESS WIRE)--The Minnesota Public Utilities Commission (MPUC) on Monday approved a rate increase of approximately $59 million, or approximately 9%, that Minnesota Power, a utility division of ALLETE Inc. (NYSE: ALE), is allowed to recover through the base rates that it charges to residential and business electric customers. The commission also authorized a return on equity of 9.65% for the company. The decision is subject to a final written order and reconsideration.


Under the MPUC decision, rates will increase by approximately 9% for all customer classes. The average residential customer’s monthly bill will increase by approximately 2% above the interim rate they currently pay. The 9% increase will also apply to business and industrial customers, whose interim rate was 14%. The applicable difference between final and interim rates will be refunded to business and industrial customers. Final rates are expected to go into effect this summer.

As a regulated utility, Minnesota Power must receive approval from the MPUC whenever changes in revenue or expenses require adjusting its rates. In the past 25 years, Minnesota Power has completed only three full rate reviews, and its residential customers’ monthly bills are below the national average while they receive the highest percentage of renewable energy in the state. The company’s last rate review filed in 2019 was withdrawn in response to the COVID-19 pandemic and its impacts on customers and the region’s economy.

The company has taken a number of steps to mitigate rate impacts for customers, including requesting a lower interim rate for residential customers and adding new programs and bolstering existing ones that provide bill discounts for low-income customers. Due to those efforts, even if the company’s full request had been approved, the monthly bills for those customers would not have increased.

The company filed its rate request in November 2021, seeking to increase its annual operating revenue by $108 million or approximately 18%.

“I’m proud of our Minnesota Power team and all our company has done to lead our state’s clean-energy transformation while providing safe and reliable power and keeping residential customers’ monthly bills below the national average. Yesterday’s decision, however, does not give us the resources and tools we need to do all of this,” said Bethany Owen, ALLETE chair, president and CEO. “As utilities are asked to do more and even faster, we expect rate review requests to become more frequent going forward. We plan to file another rate request later this year that will reflect the revenue requirements that Minnesota Power needs in order to advance its state-leading EnergyForward strategy.”

The company has managed to keep 2022 operations and maintenance expenses lower than its 2010 operations and maintenance expenses, while inflation alone has increased costs nearly 2% annually over the same period. Minnesota Power’s residential electric rates have not kept pace with general inflation over the past 10 years, and have decreased by 0.2% annually on an inflation-adjusted basis.

Minnesota Power also is providing customers greater control over their daily energy decisions and monthly bills through new tools that empower customers to reduce how much energy they use; programs to choose their sources of energy; and rate options to customize what they pay for heating, cooling and vehicle charging.

Routine rate reviews are just one part of Minnesota’s regulatory framework. In November 2022, the MPUC approved Minnesota Power’s Integrated Resource Plan, the roadmap for the company’s EnergyForward vision to provide 100% carbon-free energy by 2050 while maintaining safe, reliable and affordable electric service to its customers.

Minnesota Power provides electric service within a 26,000-square-mile area in northeastern Minnesota, supporting comfort, security and quality of life for 145,000 customers, 14 municipalities and some of the largest industrial customers in the United States. More information can be found at www.mnpower.com.

The statements contained in this release and statements that ALLETE may make orally in connection with this release that are not historical facts, are forward-looking statements. Actual results may differ materially from those projected in the forward-looking statements. These forward-looking statements involve risks and uncertainties and investors are directed to the risks discussed in documents filed by ALLETE with the Securities and Exchange Commission. ALE-CORP


Contacts

Amy Rutledge
Director - Corporate Communications
Minnesota Power/ALLETE
218-723-7400
This email address is being protected from spambots. You need JavaScript enabled to view it.

Three quarters of business leaders do not believe their peers’ ESG reporting, according to a new study, showing that a lack of industry trust and verifiable data is driving scepticism


LONDON--(BUSINESS WIRE)--Most business leaders (76%) in major industries doubt their peers’ Environmental, Social and Governance (ESG) reporting, according to a new study by Inmarsat, the world leader in global, mobile satellite communications.

The findings come from a new global, independent research report Accelerating sustainable action through IoT commissioned by the company. It explores the views of over 1,000 senior technology and ESG decision-makers across agriculture, mining, transport, utilities and oil & gas firms. The survey asked professionals about their perceptions on ESG and whether they believed data provided by ‘Internet of Things’ (IoT) solutions could help improve reporting transparency.

Respondents also report concerns about their peers’ ESG priorities, with 80% saying their competitors are more focused on perception rather than achieving tangible sustainability outcomes.

However, despite scepticism about the motivations of their peers, most business leaders have faith in their own initiatives: with 81% convinced their company is more sustainable than their competitors.

LACK OF DATA DRIVING LACK OF TRUST

The results suggest that a lack of verifiable hard data – and the willingness to share it – is undermining trust and slowing progress on business sustainability.

Positively, however, many believe data collected via IoT solutions is critical to building trust (81%) and improving ESG outcomes overall (82%).

Four in five respondents plan to increase their use of IoT solutions over the next 12 months to measure and understand the impact of their sustainability initiatives more accurately. A similar proportion reported they are already seeing return on investment from IoT tools used to improve sustainability (78%).

While the majority (83%) agree they could be doing more to effectively leverage IoT solutions to produce ESG data, engrained resistance to data sharing creates an additional barrier to progress.

Only 47% said they would be comfortable sharing all their ESG data with third parties to improve industry reporting and benchmarking over the next 1-3 years, reinforcing that improving trust will be key to achieving better outcomes.

SATELLITE CONNECTIVITY KEY FOR IOT

With big data at the heart of IoT effectiveness, nine in ten (91%) agree that satellite connectivity is the key to harnessing the full potential of IoT solutions focused on improving sustainability.

Currently, just over a third of respondents (36%) rely on satellite networks for IoT connectivity. However, satellite is set to become the most popular method of connectivity over the next decade, with half expecting to use it within this timeframe.

IoT-enabled data is not the only way satellite technology can help improve environmental outcomes. Inmarsat’s recent ‘Can Space Help Save the Planet?’ report revealed that the world could reach Net Zero by 2040 – ten years ahead of schedule – by accelerating the adoption of space and satellite technologies.

Networks such as Inmarsat ELERA are central to this, providing ultra-reliable global connectivity which allows data sharing in industries like agriculture, electrical utilities, mining, oil and gas, and transport.

Jat Brainch, Chief Commercial and Product Officer, Inmarsat said: “You cannot manage what you cannot measure, so it is heartening to see so many organisations looking to IoT to assess and improve ESG reporting.

“To demonstrate progress, however, businesses must overcome their reluctance to share useful data and have the confidence to publish meaningful insights. Otherwise, they risk undermining genuine collaboration on sustainability and overshadowing the real progress being made. There is no quick fix, but creating methodical benchmarks based on actionable data, and sharing the results, will play a critical role in re-establishing trustworthy ESG reporting.

“IoT is nothing without connectivity. Yet terrestrial coverage often cannot reach the remote locations where our most valuable data points frequently originate. By using satellites to close that connectivity gap, organisations can access data to make the right decisions right away. We need to make the most of that opportunity if we are to achieve Net Zero quickly.”

David Hill, Executive Director, IoT Community, said: “Connected IoT solutions are the key to sourcing, analysing and sharing aggregate ESG data in a compliant and secure way. The same way we use wearable devices to measure our personal health, businesses should rely on IoT solutions more to monitor progress, reduce costs, improve safety and maximise sustainability. Robust data will back up their ESG claims and can be used for reporting across all areas of their operations, particularly in remote locations with challenging conditions.

“To achieve true success, we must shift our mindset with regards to data sharing and connectivity. Once businesses become comfortable sharing their ESG insights to improve broader industry reporting and benchmarking and prioritise satellite connectivity as a key enabler, will we start to see real progress on sustainability.”

ENDS

Notes to Editors

The report ‘Accelerating sustainable action through IoT’ focuses on challenges, opportunities and priorities businesses juggle as they work to improve their sustainability credentials and the role satellite-enabled IoT solutions will play in driving this change.

This report is based on independent research conducted by Censuswide on behalf of Inmarsat, surveying 1,000+ senior technology and ESG professionals with sustainability decision-making power across a range of businesses sizes (sole trader, 1-9, 10-49, 50-99, 100-249, 250-500 and 500+ employees). Survey respondents spanned agriculture, mining, oil & gas, utilities and transport sectors across Europe, North America, South America, Africa and Asia. As such, the results represent a broad range of businesses at various stages of their sustainability and industrial IoT adoption journeys. Data was collected in August/September 2022.

ABOUT INMARSAT

Inmarsat delivers world leading, innovative, advanced and exceptionally reliable global, mobile communications across the world – in the air, at sea and on land - that are enabling a new generation of commercial, government and mission-critical services.

In November 2021, Inmarsat and Viasat announced the planned combination of the two companies, to create a new leader in global communications.


Contacts

Dana Dzubas
Email: This email address is being protected from spambots. You need JavaScript enabled to view it.

Includes Recurring Revenue of $30.2M and Subscription Revenue Growth of 28.8%

Quarter Positive Adjusted EBITDA of $8.1M and GAAP EPS of $0.13 Per Share

Raises Fiscal 2023 Annual Revenue Guidance to $195M to $198M; Reiterates Greater Than 15% Adjusted EBITDA

ALPHARETTA, Ga.--(BUSINESS WIRE)--Agilysys, Inc. (NASDAQ: AGYS), a leading global provider of hospitality software solutions that deliver High Return Hospitality, today reported operating results for its fiscal 2023 third quarter and period ended December 31, 2022.

Summary of Fiscal 2023 Third Quarter Financial Results

  • Total net revenue increased 26.5% to a record $49.9 million, compared to total net revenue of $39.5 million in the comparable prior-year period.
  • Recurring revenue (comprised of subscription and maintenance charges) was a record $30.2 million, or 60.4% of total net revenue compared to $25.1 million, or 63.7% of total net revenue for the same period in fiscal 2022. Subscription revenue increased 28.8% year over year and was 49.8% of total recurring revenue compared to 46.4% of total recurring revenue in the third quarter of fiscal 2022.
  • Gross margin was 61.7% in the fiscal 2023 third quarter compared to 62.6% in the comparable prior-year period.
  • Net income attributable to common shareholders in the fiscal 2023 third quarter was $3.4 million, or $0.13 per diluted share compared to $1.1 million, or $0.04 per diluted share in the comparable prior-year period.
  • Adjusted EBITDA (non-GAAP) was $8.1 million compared to $6.6 million in the comparable prior-year period (reconciliation included in financial tables).
  • Adjusted diluted EPS (non-GAAP) was $0.26 per share in the fiscal 2023 third quarter compared to $0.19 per share in the comparable prior-year period (reconciliation included in financial tables).
  • Free cash flow (non-GAAP) in the fiscal 2023 third quarter was $11.7 million compared to free cash flow of $9.9 million in the fiscal 2022 third quarter (reconciliation included in financial tables). Ending cash balance was $105.8 million, compared to ending cash balance of $97.0 million as of fiscal 2022 year-end.

Ramesh Srinivasan, President and CEO of Agilysys, commented, “We are pleased to announce another record revenue quarter. The positive momentum in our selling success, which started around August of calendar year 2022, has continued at a healthy pace. Our extraordinary investments in product innovation to create state-of-the-art cloud-native hospitality industry focused end-to-end software solutions over the past five plus years, combined with the current increasing focus on sales and marketing, continue to yield good results. In our opinion, this industry has been underserved for decades with respect to software innovations which are essential to better serve increasingly technology savvy guests and internal staff. We expect the current escalating demand for such solutions in the hospitality industry to overcome any macro-economic challenges during the short and medium term.

Subscription revenue grew 28.8% while one-time revenue, consisting of product and services revenue, was 38% higher than the comparable quarter last fiscal year. Adjusted EBITDA improved to 16.1% of revenue.

Even excluding the recent Marriott PMS selection announcement from both sales and backlog, this October to December Q3 fiscal 2023 was our best selling success quarter since the current management team took charge about six years ago. The continued selling success has driven the combined product, services and recurring revenue backlog back to record levels. We are well positioned to beat the full-year revenue guidance provided at the start of our fiscal 2023 year. We now expect fiscal 2023 full-year revenue to be in the range of $195 to $198 million and adjusted EBITDA levels to be slightly higher than 15% of revenue, in line with prior guidance.”

Fiscal 2023 Outlook

The Company announced it is raising full-year fiscal 2023 revenue guidance to be $195 to $198 million, inclusive of close to 30% subscription revenue growth year over year and is reiterating its Adjusted EBITDA guidance of greater than 15% of revenue.

Dave Wood, Chief Financial Officer, commented, “We are making excellent progress across all aspects of our business. Our recent investments in sales and marketing along with the value propositions of our cloud native solutions are putting us in a strong position to win a good portion of sales opportunities. We continue to grow subscription revenue at a consistent pace. Our focus remains on managing a profitable business while executing well on our strategies for organic, consistent revenue growth over the medium and long term.”

2023 Third Quarter Conference Call and Webcast

Agilysys is hosting a conference call and webcast today, January 24, 2023, at 4:30 p.m. ET. Both the call and the webcast are open to the public. Interested parties can register for the call at https://register.vevent.com/register/BI92e7fb3f342349caafb48725c1a83416. After registration, an email confirmation with a personalized PIN will be provided along with further access details. Please plan to register fifteen minutes prior to the presentation to receive confirmation and further instruction in a timely manner.

Interested parties can also access the conference call live on the Events and Presentations page of Agilysys.com. Approximately two hours after the call has concluded, an archived version of the webcast will be available for replay at the same location.

Forward-Looking Language

This press release contains “forward-looking statements” within the meaning of the safe harbor provisions of the U.S. Private Securities Litigation Reform Act of 1995. Forward-looking statements can be identified by words such as: “anticipate,” “intend,” “plan,” “goal,” “seek,” “believe,” “project,” “estimate,” “expect,” “strategy,” “future,” “likely,” “may,” “should,” “will” and similar references to future periods. Examples of forward-looking statements include, among others, our revenue, subscription revenue and Adjusted EBITDA guidance for the 2023 fiscal year and statements we make regarding the hospitality industry's need for and investment in technology and our ability to continue profitable growth.

Forward-looking statements are neither historical facts nor assurances of future performance. Instead, they are based only on our current beliefs, expectations and assumptions regarding the future of our business, future plans and strategies, projections, anticipated events and trends, the economy and other future conditions. Because forward-looking statements relate to the future, they are subject to inherent uncertainties, risks and changes in circumstances that are difficult to predict and many of which are outside of our control. Our actual results and financial condition may differ materially from those indicated in the forward-looking statements. Therefore, you should not rely on any of these forward-looking statements. Important factors that could cause our actual results and financial condition to differ materially from those indicated in the forward-looking statements include, among others, the effect of the COVID-19 pandemic on our business and the success of any measures we have taken or may take in the future in response thereto; the impact other macroeconomic factors may have on the overall business environment and the risks described in the Company’s filings with the Securities and Exchange Commission, including the Company’s reports on Form 10-K and Form 10-Q. Additionally, references to "record" financial and business levels in this document refer only to the time period after Agilysys made the transformation to an entirely hospitality focused software solutions company in FY2014.

Any forward-looking statement made by us in this press release is based only on information currently available to us and speaks only as of the date on which it is made. We undertake no obligation to publicly update any forward-looking statement that may be made from time to time, whether written or oral, whether as a result of new information, future developments or otherwise.

Use of Non-GAAP Financial Information

To supplement the unaudited consolidated financial statements presented in accordance with U.S. GAAP in this press release, certain non-GAAP financial measures as defined by the SEC rules are used. These non-GAAP financial measures include EBITDA, Adjusted EBITDA, adjusted net income, adjusted basic earnings per share, adjusted diluted earnings per share and free cash flow. Management believes that such information can enhance investors’ understanding of the Company’s ongoing operations.

The Company has included the following non-GAAP financial measures in this press release: adjusted net income, adjusted basic earnings per share and adjusted diluted earnings per share. The Company believes these non-GAAP financial measures provide valuable insight into the Company’s overall profitability from core operations before certain non-cash and non-recurring charges. The Company defines adjusted net income as net income before amortization expense (including amortization of developed technology), share-based compensation, convertible preferred stock issuance costs, and one-time charges including severance and other charges, impairments and legal settlements, less the related income tax effect of these adjustments, as applicable, and defines adjusted earnings per share as adjusted net income divided by basic and diluted weighted average shares outstanding.

See the accompanying tables below for the definitions and reconciliation of these non-GAAP measures to the most closely related GAAP measures.

About Agilysys

Agilysys is well known for its long heritage of hospitality-focused technology innovation. The Company delivers modular and integrated software solutions and expertise to businesses seeking to maximize Return on Experience (ROE) through hospitality encounters that are both personal and profitable. Over time, customers achieve High Return Hospitality by consistently delighting guests, retaining staff and growing margins. Customers around the world include: branded and independent hotels; multi-amenity resort properties; casinos; property, hotel and resort management companies; cruise lines; corporate dining providers; higher education campus dining providers; food service management companies; hospitals; lifestyle communities; senior living facilities; stadiums; and theme parks. The Agilysys Hospitality Cloud™ combines core operational systems for property management (PMS), point-of-sale (POS) and Inventory and Procurement (I&P) with Experience Enhancers™ that meaningfully improve interactions for guests and for employees across dimensions such as digital access, mobile convenience, self-service control, personal choice, payment options, service coverage and real-time insights to improve decisions. Core solutions and Experience Enhancers are selectively combined in Hospitality Solution Studios™ tailored to specific hospitality settings and business needs. Agilysys operates across the Americas, Europe, the Middle East, Africa, Asia-Pacific, and India with headquarters located in Alpharetta, GA. For more information visit Agilysys.com.


AGILYSYS, INC.

CONDENSED CONSOLIDATED STATEMENTS OF OPERATIONS

(UNAUDITED)


Three months ended
December 31,


Nine months ended
December 31,


(In thousands, except per share data)


2022


2021


2022


2021


Net revenue:


Products


$

10,697


$

8,101


$

32,291


$

24,244


Subscription and maintenance


30,154


25,136


86,917


72,371


Professional services


9,069


6,223


25,960


19,463


Total net revenue


49,920


39,460


145,168


116,078


Cost of goods sold:


Products


5,368


4,400


16,682


12,420


Subscription and maintenance


6,767


5,421


19,223


15,184


Professional services


7,009


4,923


20,627


14,634


Total cost of goods sold


19,144


14,744


56,532


42,238


Gross profit


30,776


24,716


88,636


73,840


Gross profit margin


61.7

%


62.6

%


61.1

%


63.6

%

Operating expenses:


Product development


12,416


11,210


36,550


34,074


Sales and marketing


5,886


3,943


16,619


10,418


General and administrative


7,928


6,804


22,850


20,330


Depreciation of fixed assets


437


495


1,371


1,609


Amortization of internal-use software and intangibles


430


267


1,326


1,077


Other charges


93


381


374


1,187


Legal settlements


104


4


104


371


Total operating expense


27,294


23,104


79,194


69,066


Operating income


3,482


1,612


9,442


4,774


Other (income) expense:


Interest income


(704

)


(10

)


(1,186

)


(45

)

Interest expense


4


5


Other (income) expense, net


(384

)


52


(799

)


53


Income before taxes


4,570


1,566


11,427


4,761


Income tax expense


678


24


920


265


Net income


$

3,892


$

1,542


$

10,507


$

4,496


Series A convertible preferred stock dividends


(459

)


(459

)


(1,377

)


(1,377

)

Net income attributable to common shareholders


$

3,433


$

1,083


$

9,130


$

3,119


Weighted average shares outstanding - basic


24,703


24,477


24,651


24,315


Net income per share - basic:


$

0.14


$

0.04


$

0.37


$

0.13


Weighted average shares outstanding - diluted


26,070


25,392


25,780


25,327


Net income per share - diluted:


$

0.13


$

0.04


$

0.35


$

0.12


AGILYSYS, INC.

CONDENSED CONSOLIDATED BALANCE SHEETS

(UNAUDITED)


(In thousands, except share data)


December 31, 2022
(Unaudited)


March 31,
2022


ASSETS


Current assets:


Cash and cash equivalents


$

105,818


$

96,971


Accounts receivable, net of allowance for expected credit losses
of $655 and $318, respectively


31,953


25,175


Contract assets


2,531


1,669


Inventories


10,349


6,940


Prepaid expenses and other current assets


8,432


5,418


Total current assets


159,083


136,173


Property and equipment, net


9,696


6,345


Operating lease right-of-use assets


14,823


9,889


Goodwill


33,569


32,759


Intangible assets, net


19,165


20,178


Deferred income taxes, non-current


2,380


2,664


Other non-current assets


7,445


6,154


Total assets


$

246,161


$

214,162


LIABILITIES AND SHAREHOLDERS' EQUITY


Current liabilities:


Accounts payable


$

9,752


$

9,766


Contract liabilities


55,915


46,095


Accrued liabilities


11,728


10,552


Operating lease liabilities, current


3,734


5,049


Finance lease obligations, current


3


4


Total current liabilities


81,132


71,466


Deferred income taxes, non-current


1,679


938


Operating lease liabilities, non-current


12,509


5,649


Finance lease obligations, non-current


2


Other non-current liabilities


3,929


3,304


Commitments and contingencies


Series A convertible preferred stock, no par value


35,000


35,459


Shareholders' equity:


Common shares, without par value, at $0.30 stated value; 80,000,000
shares authorized; 31,606,831 shares issued; and 25,184,727
and 24,728,532 shares outstanding at December 31, 2022
and March 31, 2022, respectively


9,482


9,482


Treasury shares, 6,422,104 and 6,878,299 at December 31, 2022
and March 31, 2022, respectively


(1,926

)


(2,063

)

Capital in excess of stated value


56,166


49,963


Retained earnings


49,148


40,018


Accumulated other comprehensive loss


(958

)


(56

)

Total shareholders' equity


111,912


97,344


Total liabilities and shareholders' equity


$

246,161


$

214,162


AGILYSYS, INC.

CONDENSED CONSOLIDATED STATEMENTS OF CASH FLOWS

(UNAUDITED)


Nine Months Ended


December 31,


(In thousands)


2022


2021


Operating activities


Net income


$

10,507


$

4,496


Adjustments to reconcile net income to net cash provided by operating activities:


Loss on disposal of property & equipment


123


Depreciation of fixed assets


1,371


1,609


Amortization of internal-use software and intangibles


1,326


1,077


Deferred income taxes


(378

)


(491

)

Share-based compensation


9,410


10,802


Changes in operating assets and liabilities


(4,556

)


4,199


Net cash provided by operating activities


17,680


21,815


Investing activities


Capital expenditures


(3,616

)


(1,078

)

Additional investments in corporate-owned life insurance policies


(27

)


(3

)

Net cash used in investing activities


(3,643

)


(1,081

)

Financing activities


Payment of preferred stock dividends


(1,836

)


(1,836

)

Repurchase of common shares to satisfy employee tax withholding


(2,924

)


(2,902

)

Principal payments under long-term obligations


(3

)


(16

)

Net cash used in financing activities


(4,763

)


(4,754

)

Effect of exchange rate changes on cash


(427

)


(38

)

Net increase in cash and cash equivalents


8,847


15,942


Cash and cash equivalents at beginning of period


96,971


99,180


Cash and cash equivalents at end of period


$

105,818


$

115,122


AGILYSYS, INC.

RECONCILIATION OF NET INCOME TO EBITDA AND ADJUSTED EBITDA

(UNAUDITED)


Three months ended


Nine months ended


(In thousands)


December 31,


December 31,


2022


2021


2022


2021


Net income


$

3,892


$

1,542


$

10,507


$

4,496


Income tax expense


678


24


920


265


Income before taxes


4,570


1,566


11,427


4,761


Depreciation of fixed assets


437


495


1,371


1,609


Amortization of internal-use software and intangibles


430


267


1,326


1,077


Amortization of developed technology acquired


39


120


Interest income, net


(704

)


(6

)


(1,186

)


(40

)

EBITDA (a)


4,772


2,322


13,058


7,407


Share-based compensation


3,466


3,839


9,410


10,802


Other charges


93


381


374


1,187


Other non-operating (income) expense


(384

)


52


(799

)


53


Legal settlements


104


4


104


371


Adjusted EBITDA (b)


$

8,051


$

6,598


$

22,147


$

19,820


(a) EBITDA, a non-GAAP financial measure, is defined as net income before income taxes, interest income (net of interest expense), depreciation and amortization (including amortization of developed technology)


(b) Adjusted EBITDA, a non-GAAP financial measure, is defined as net income before income taxes, interest income (net of interest expense), depreciation and amortization (including amortization of developed technology), and excluding charges relating to i) legal settlements, ii) other charges, iii) share-based compensation, and iv) other non-operating (income) expense


AGILYSYS, INC.

RECONCILIATION OF NET INCOME TO ADJUSTED NET INCOME FOR ADJUSTED EARNINGS PER SHARE

(UNAUDITED)


Three months ended


Nine months ended


(In thousands, except per share data)


December 31,


December 31,


2022


2021


2022


2021


Net income attributable to common shareholders


$

3,433


$

1,083


$

9,130


$

3,119


Amortization of developed technology acquired


39


120


Amortization of internal-use software and intangibles


430


267


1,326


1,077


Share-based compensation


3,466


3,839


9,410


10,802


Other charges


93


381


374


1,187


Legal settlements


104


4


104


371


Income tax adjustments


(913

)


(657

)


(2,280

)


(1,868

)

Adjusted net income (a)


$

6,652


$

4,917


$

18,184


$

14,688


Basic weighted average shares outstanding


24,703


24,477


24,651


24,315


Diluted weighted average shares outstanding


26,070


25,409


25,780


25,296


Adjusted basic earnings per share (b)


$

0.27


$

0.20


$

0.74


$

0.60


Adjusted diluted earnings per share (b)


$

0.26


$

0.19


$

0.71


$

0.58


(a) Adjusted net income, a non-GAAP financial measure, is defined as net income attributable to common shareholders before amortization expense (including amortization of developed technology), share-based compensation, and one-time charges including other charges and legal settlements, less the related income tax effect of these adjustments, as applicable, at the Company’s current combined federal and state income statutory tax rate. No income tax effect applies to one-time charges when a valuation allowance offsets their related deferred tax assets


(b) Adjusted earnings per share, a non-GAAP financial measure, is defined as adjusted net income divided by basic and diluted weighted average shares outstanding


AGILYSYS, INC.

RECONCILIATION OF NET CASH PROVIDED BY OPERATING ACTIVITIES TO FREE CASH FLOW

(UNAUDITED)


Three months ended


Nine months ended


(In thousands)


December 31,


December 31,


2022


2021


2022


2021


Net cash provided by operating activities


$

14,563


$

10,142


$

17,680


$

21,815


Capital expenditures


(2,819

)


(292

)


(3,616

)


(1,078

)

Free cash flow (a)


$

11,744


$

9,850


$

14,064


$

20,737


(a) Free cash flow, a non-GAAP financial measure, is defined as net cash provided by operating activities, less capital expenditures


Contacts

Investor Contact:
Jessica Hennessy
Senior Director Corporate Strategy & Investor Relations
Agilysys, Inc.
770-810-6116 or This email address is being protected from spambots. You need JavaScript enabled to view it.

HOUSTON--(BUSINESS WIRE)--Genesis Energy, L.P. (NYSE: GEL) today announced that its previously announced cash tender offer to purchase any and all of the outstanding aggregate principal amount of the 5.625% senior unsecured notes due 2024 (the “Notes”) that we co-issued with our subsidiary, Genesis Energy Finance Corporation, expired at 5:00 p.m., New York City time, on January 24, 2023 (the “Expiration Time”). As of the Expiration Time, $316,325,000 aggregate principal amount of the outstanding Notes (92.73%) were validly tendered, which excludes $91,000 aggregate principal amount of the outstanding Notes that remain subject to guaranteed delivery procedures. The settlement date for the Notes is expected to be January 25, 2023.


Pursuant to the terms of the tender offer, Notes not tendered in the tender offer will remain outstanding. We intend to call such outstanding Notes for redemption in accordance with the terms and conditions of the indenture governing the Notes.

Persons with questions regarding the tender offer should contact the dealer manager, Wells Fargo Securities, LLC by telephone at (866) 309-6316 (toll-free) or (704) 410-4756, or the information agent and tender agent, D.F. King & Co., Inc., by telephone at (800) 578-5378 (toll-free) or, for banks and brokers, at (212) 269-5550 (Banks and Brokers only) or in writing at D.F. King & Co., Inc., 48 Wall Street, 22nd Floor, New York, New York 10005, Attention: Michael Horthman, or by email at This email address is being protected from spambots. You need JavaScript enabled to view it..

Genesis Energy, L.P. is a diversified midstream energy master limited partnership headquartered in Houston, Texas. Genesis’ operations include offshore pipeline transportation, sodium minerals and sulfur services, marine transportation and onshore facilities and transportation. Genesis’ operations are primarily located in the Gulf Coast region of the United States, Wyoming and the Gulf of Mexico.

This press release includes forward-looking statements as defined under federal law. Although we believe that our expectations are based upon reasonable assumptions, no assurance can be given that our goals will be achieved, including statements related to the tender offer and redemption. Actual results may vary materially. We undertake no obligation to publicly update or revise any forward-looking statement.


Contacts

Genesis Energy, L.P.
Ryan Sims
SVP – Finance and Corporate Development
(713) 860-2521

CANONSBURG, Pa.--(BUSINESS WIRE)--Equitrans Midstream Corporation (NYSE: ETRN) today declared quarterly cash dividends of $0.15 per common share and $0.4873 per share of Series A Perpetual Convertible Preferred Stock for the fourth quarter 2022. The dividends will be paid on February 14, 2023, to all applicable ETRN shareholders of record at the close of business on February 6, 2023.


About Equitrans Midstream Corporation:

Equitrans Midstream Corporation (ETRN) has a premier asset footprint in the Appalachian Basin and, as the parent company of EQM Midstream Partners, is one of the largest natural gas gatherers in the United States. Through its strategically located assets in the Marcellus and Utica regions, ETRN has an operational focus on gas transmission and storage systems, gas gathering systems, and water services that support natural gas development and production across the Basin. With a rich 135-year history in the energy industry, ETRN was launched as a standalone company in 2018 with the vision to be the premier midstream services provider in North America. ETRN is helping to meet America’s growing need for clean-burning energy, while also providing a rewarding workplace and enriching the communities where its employees live and work.

For more information on Equitrans Midstream Corporation, visit www.equitransmidstream.com; and to learn more about our environmental, social, and governance practices visit ETRN Sustainability Reporting.


Contacts

Analyst inquiries:
Nate Tetlow – Vice President, Corporate Development and Investor Relations
412.553.5834
This email address is being protected from spambots. You need JavaScript enabled to view it.

Media inquiries:
Natalie A. Cox – Communications and Corporate Affairs
This email address is being protected from spambots. You need JavaScript enabled to view it.

OSAKA, Japan--(BUSINESS WIRE)--OPTAGE, Inc., digital infrastructure and telecommunication company in Japan, today announced to build its Fifth Data Center ‘OPTAGE Sonezaki Data Center’ in Osaka, Japan.
In recent years, many companies and municipalities in Japan have been using cloud services, and there is a growing demand for data centers that can communicate with cloud services with low latency. As a result, many of Japan's data centers are concentrated in Osaka and Tokyo due to low latency and easy access. In addition, disaster preparedness is important in Japan because of the high number of earthquakes that occur there, and more companies are using data centers in both Osaka and Tokyo.
Until now, OPTAGE has operated multiple data centers in Osaka. This new data center location is close to access points of popular public cloud and Internet exchange and can communicate with low latency. Because the data center is carrier-neutral, services such as cloud, IX (Internet Exchange), and carriers are widely available.


Name

OPTAGE Sonezaki Data Center

Location

Kita-ku, Osaka, Japan

Area

24,109 sqft

Floors

14 stories above ground

Open

Expected January 2026

  1. Connectivity
    Data centers with popular cloud and IX access points are within two miles. OPTAGE's highly reliable fiber optic links directly to these data centers, enabling clients to communicate with stability and low latency.
  2. Carrier Neutral
    Clients are not tied to a specific service provider (Telecommunications, ISPs, etc.), allowing for diversity and flexibility. In addition, data center providers can take advantage of OPTAGE's rich fiber optics to provide a variety of network services.
  3. Green Energy
    The non-fossil certificate with tracking will ensure that all electricity used by the data center is generated by natural resources such as solar, wind and water. We will actively work to reduce CO2 emissions and aim to become a carbon-neutral green data center that is environmentally friendly.
  4. High-Density
    The latest high-efficiency air conditioning system and optimal air flow design make it possible to handle high-density, high-load equipment. It is possible to flexibly change the system configuration as we anticipate that server performance and heat generation will continue to increase due to advances in IoT and AI.
  5. Safety and Security
    Seismic isolation design, redundant power supply systems, emergency generators that can operate continuously for more than 72 hours, and resident management 24 hours a day, 365 days a year provide stable services even in the unlikely event of a disaster.

Press Release
https://optage.co.jp/en/press/2023/001.html

Our Website
https://optage.co.jp/en/

Contact us
https://optage.co.jp/en/form/inquiry/form.cgi


Contacts

OPTAGE, Inc.
Staff: Atsuo Katayama
Tel: +81-90-8206-9857
Mail: This email address is being protected from spambots. You need JavaScript enabled to view it.

NEWCASTLE & HOUSTON--(BUSINESS WIRE)--TechnipFMC (NYSE: FTI) has been awarded a substantial(1) master services agreement (MSA) for subsea services with Petrobras. The three-year contract has an option to extend for a further two years.


TechnipFMC will provide life-of-field services to support its installed base offshore Brazil. The contract covers installation, intervention, and maintenance of both equipment and tooling, as well as technical support for subsea umblicals, risers and flowlines.

The agreement succeeds a previous MSA and supports Petrobras’s increased volume of operations. Services will be supplied from TechnipFMC’s base in Macaé, Brazil.

Jonathan Landes, President, Subsea at TechnipFMC, commented: “This new MSA continues our enduring partnership with Petrobras. We are delighted to continue this relationship through this direct award. For 40 years, we have provided services from Macaé, demonstrating the strength of our commitment to delivering services using our in-country workforce.”

(1) For TechnipFMC, a “substantial” contract is between $250 million and $500 million. Note: a portion of this inbound order was included in the Company’s fourth quarter 2022 financial results. A portion of this award will be inbound in future periods.

Important Information for Investors and Securityholders

Forward-Looking Statement

This release contains "forward-looking statements" as defined in Section 27A of the United States Securities Act of 1933, as amended, and Section 21E of the United States Securities Exchange Act of 1934, as amended. The words “expect,” “believe,” “estimated,” and other similar expressions are intended to identify forward-looking statements, which are generally not historical in nature. Such forward-looking statements involve significant risks, uncertainties and assumptions that could cause actual results to differ materially from our historical experience and our present expectations or projections. For information regarding known material factors that could cause actual results to differ from projected results, please see our risk factors set forth in our filings with the United States Securities and Exchange Commission, which include our Annual Reports on Form 10-K, Quarterly Reports on Form 10-Q, and Current Reports on Form 8-K. We caution you not to place undue reliance on any forward-looking statements, which speak only as of the date hereof. We undertake no obligation to publicly update or revise any of our forward-looking statements after the date they are made, whether as a result of new information, future events or otherwise, except to the extent required by law.

About TechnipFMC

TechnipFMC is a leading technology provider to the traditional and new energy industries, delivering fully integrated projects, products, and services.

With our proprietary technologies and comprehensive solutions, we are transforming our clients’ project economics, helping them unlock new possibilities to develop energy resources while reducing carbon intensity and supporting their energy transition ambitions.

Organized in two business segments — Subsea and Surface Technologies — we will continue to advance the industry with our pioneering integrated ecosystems (such as iEPCI™, iFEED™ and iComplete™), technology leadership and digital innovation.

Each of our approximately 20,000 employees is driven by a commitment to our clients’ success, and a culture of strong execution, purposeful innovation, and challenging industry conventions.

TechnipFMC uses its website as a channel of distribution of material company information. To learn more about how we are driving change in the industry, go to www.TechnipFMC.com and follow us on Twitter @TechnipFMC.


Contacts

Investor relations

Matt Seinsheimer
Senior Vice President, Investor Relations and Corporate Development
Tel: +1 281 260 3665
Email: This email address is being protected from spambots. You need JavaScript enabled to view it.

James Davis
Senior Manager, Investor Relations
Tel: +1 281 260 3665
Email: This email address is being protected from spambots. You need JavaScript enabled to view it.

Media relations

Nicola Cameron
Vice President, Corporate Communications
Tel: +44 1383 742297
Email: This email address is being protected from spambots. You need JavaScript enabled to view it.

Catie Tuley
Director, Public Relations
Tel: +1 713 876 7296
Email: This email address is being protected from spambots. You need JavaScript enabled to view it.

PARIS--(BUSINESS WIRE)--Technip Energies (PARIS:TE) (ISIN:NL0014559478) – as part of its long-term agreement with Aramco – has been awarded a contract to upgrade sulfur recovery facilities at Aramco’s Riyadh Refinery.

This contract covers the implementation of three new tail gas treatment (TGT) units, improving the performance of the existing three sulfur recovery units (SRU) to comply with more stringent regulations for sulfur dioxide emissions, with recovery efficiency at more than 99.9%.

The project will be executed locally, leveraging Saudi economic resources and infrastructure.

The existing sulfur recovery units in the Riyadh refinery were designed and built by Technip Energies in the early 2000s.

Bhaskar Patel, SVP Sustainable Fuels, Chemicals & Circularity of Technip Energies, commented: “We are pleased to be entrusted by Aramco to work on the upgrading program of their refinery in Riyadh. By leveraging our long-standing relationship, which has been in place since the mid-1990s, we are committed to make this project another success, while utilizing local resources and supply chain.”

Note: this award is included in the Company’s fourth quarter 2022 financial results.

About Technip Energies

Technip Energies is a leading Engineering & Technology company for the energy transition, with leadership positions in Liquefied Natural Gas (LNG), hydrogen and ethylene, as well as growing market positions in blue and green hydrogen, sustainable chemistry and CO2 management. The company benefits from its robust project delivery model supported by extensive technology, products and services offering.

Operating in 34 countries, our 15,000 people are fully committed to bringing our clients’ innovative projects to life, breaking boundaries to accelerate the energy transition for a better tomorrow.

Technip Energies is listed on Euronext Paris with American depositary receipts (“ADRs”). For further information: www.technipenergies.com.

Important Information for Investors and Securityholders

Forward-Looking Statement

This release contains “forward-looking statements” as defined in Section 27A of the United States Securities Act of 1933, as amended, and Section 21E of the United States Securities Exchange Act of 1934, as amended. Forward-looking statements usually relate to future events and anticipated revenues, earnings, cash flows or other aspects of Technip Energies’ operations or operating results. Forward-looking statements are often identified by the words “believe,” “expect,” “anticipate,” “plan,” “intend,” “foresee,” “should,” “would,” “could,” “may,” “estimate,” “outlook,” and similar expressions, including the negative thereof. The absence of these words, however, does not mean that the statements are not forward-looking. These forward-looking statements are based on Technip Energies’ current expectations, beliefs and assumptions concerning future developments and business conditions and their potential effect on Technip Energies. While Technip Energies believes that these forward-looking statements are reasonable as and when made, there can be no assurance that future developments affecting Technip Energies will be those that Technip Energies anticipates.

All of Technip Energies’ forward-looking statements involve risks and uncertainties (some of which are significant or beyond Technip Energies’ control) and assumptions that could cause actual results to differ materially from Technip Energies’ historical experience and Technip Energies’ present expectations or projections. Should one or more of these risks or uncertainties materialize, or should underlying assumptions prove incorrect, actual results may vary materially from those set forth in the forward-looking statements.

For information regarding known material factors that could cause actual results to differ from projected results, please see Technip Energies’ risk factors set forth in Technip Energies’ filings with the U.S. Securities and Exchange Commission, which include amendment no. 4 to Technip Energies’ registration statement on Form F-1 filed on February 11, 2021.

Forward-looking statements involve inherent risks and uncertainties and speak only as of the date they are made. Technip Energies undertakes no duty to and will not necessarily update any of the forward-looking statements in light of new information or future events, except to the extent required by applicable law.


Contacts

Investor relations
Phil Lindsay
Vice-President Investor Relations
+44 207 585 5051
This email address is being protected from spambots. You need JavaScript enabled to view it.

Media relations
Stella Fumey
Director Press Relations & Digital Communications
+33 1 85 67 40 95
This email address is being protected from spambots. You need JavaScript enabled to view it.

Jason Hyonne
Press Relations & Social Media Lead
+33 1 47 78 22 89
This email address is being protected from spambots. You need JavaScript enabled to view it.

MINNEAPOLIS--(BUSINESS WIRE)--Northern Oil and Gas, Inc. (NYSE: NOG) (“NOG” or the “Company”) announced today that it plans to issue its fourth quarter and year-end 2022 financial and operating results on Thursday, February 23, 2023, after the market closes. Additionally, the Company will host a conference call on Friday, February 24, 2023, at 10:00 a.m. Central Time.


Those wishing to listen to the conference call may do so via phone or the Company’s webcast.

Conference Call and Webcast Details:

Date:


February 24, 2023

Time:


10:00 a.m. Central Time

Dial-In:


(866) 373-3407

International Dial-In:


(412) 902-1037

Conference ID:


13736011

Webcast:


Fourth Quarter and Year-End 2022 Earnings Conference Call

 
Replay Information:

A replay of the conference call will be available through April 25, 2023, by dialing:

Dial-In:


(877) 660-6853

International Dial-In:


(201) 612-7415

Conference ID:


13736011

ABOUT NORTHERN OIL AND GAS

NOG is a company with a primary strategy of investing in non-operated minority working and mineral interests in oil & gas properties, with a core area of focus in the premier basins within the United States.

More information about NOG can be found at www.NorthernOil.com.


Contacts

Evelyn Infurna
Vice President of Investor Relations
(952) 476-9800
This email address is being protected from spambots. You need JavaScript enabled to view it.

Production of RNG begins at Del Rio Dairy, Clean Energy’s First Investment in the Negative Carbon Intensive Fuel

NEWPORT BEACH, Calif.--(BUSINESS WIRE)--$CLNE--Clean Energy Fuels Corp. (NASDAQ: CLNE), the largest provider of the cleanest fuel for the transportation market, has been awarded a contract by San Diego Metropolitan Transit System (MTS), to provide an expected 86 million gallons of renewable natural gas (RNG) to operate its bus fleet.


“San Diego MTS was an early adopter of natural gas in the 1990s and has continued to seek cleaner and more economical fueling options,” said Clean Energy Senior Vice President Chad Lindholm. “As a result of the use of RNG the people who live in the San Diego area will have less exposure to greenhouse gas emissions and cleaner air.”

“RNG is a great example of how we can use innovation and technology to create a cleaner and more sustainable environment,” said MTS Chief Executive Officer Sharon Cooney. “The use of RNG is an important strategy for MTS while we work toward achieving our goal of zero emissions. This contract with Clean Energy will play key role as MTS continues transitioning to a more eco-friendly transit system.”

MTS serves the San Diego metropolitan area with a fleet of 764 buses, of which 595 run on RNG, that fuel at four private transit stations. The contract was awarded through competitive solicitation. By operating on RNG instead of diesel, it is anticipated that the fleet will reduce 73,972 metric tons of carbon dioxide—the equivalent of planting 1.2 million trees, taking 15, 939 gasoline cars off the road, or recycling 25,596 tons of landfill waste per year.

RNG Production

Clean Energy continues to make significant investments in the production of additional RNG sources and has partnered with two of the most sustainability-committed global energy companies, TotalEnergies and bp, to sign partnerships with dairy owners around the country.

The project at Del Rio Dairy in Texas, which is part of Clean Energy’s join venture with TotalEnergies, is in final commissioning with manure introduced to the digester and its first gas injection is expected in the first quarter of this year. When operational, the manure from Del Rio’s 8,000 milking cows is anticipated to produce more than a million gallons of RNG a year.

Construction at South Fork Dairy in Hart County, TX is expected to commence soon with an anticipated 2.6 million gallons of RNG to be produced annually once completed.

Construction at the first dairy projects through the joint venture with bp in Iowa, South Dakota and Minnesota are nearing completion. RNG is expected to begin to flow in the first quarter of 2023 with five total projects online by mid-year.

Expanding with New and Existing Customers

Filamar Energy Services, a full-service energy logistics provider based in Houston, signed an agreement with Clean Energy for an anticipated 4.2 million gallons of compressed natural gas to power a fleet of 50 heavy-duty trucks. These will be supported by a new station in Hennessey, OK to be built by Clean Energy.

“Our carbon-neutral logistics service will support customers who want to further decrease their environmental footprint,” said Filamar CEO Lambert Arceneaux. “In addition to CNG’s certain environmental benefits, it also makes Filamar a more efficient transportation provider by lowering fuel costs making our business and the industry as a whole more efficient.”

An early adopter of clean transportation, Denver International Airport (DEN) has contracted with Clean Energy to upgrade five fueling facilities that will power 95 natural gas vehicles with an anticipated 5 million gallons of RNG. The new stations are expected to be completed later in 2023.

Denver International Airport was recently awarded the NGVAmerica 2022 Achievement Award for their innovation and commitment to fueling with natural gas. The expanded availability of RNG at the airport will accommodate additional airport transportation, such as rental car firms and air freight operators, to provide low-carbon transportation.

“DEN’s continued investment in RNG-fueled vehicles and fueling infrastructure will enable airport operators to lower their motor fuel costs while the airport quickly achieves cleaner air and further decarbonizes its operational footprint,” said Daniel Gage, president, NGVAmerica. “We are pleased to recognize Denver’s continued achievement in this space.”

DEN was also bestowed the 2022 Leading Airport Fleet award by ACT Expo in recognition of the airport's alternative and sustainable fleet assets. The award recognizes airport fleets that demonstrate leadership in alternative fuel and advanced vehicle technology.

Clean Energy began providing RNG to long-time customer Jacksonville Transit, transitioning the large Jacksonville, FL transit agency to the cleanest available fuel option. Jacksonville Transit is committed to an approximate 2.1 million gallons per year to power its fleet of buses.

Stark Area Regional Transit Authority (SARTA) in Canton, OH has signed an operations and maintenance agreement with Clean Energy for its station which powers 60 buses with an anticipated 2.5 million gallons of natural gas. SARTA is committed to growing its low and zero-emission fleet and plans to phase out all diesel fuel in the next few years.

Clean Energy will continue to serve Washington Metropolitan Area Transit Authority (WMTA) by extending an operations and maintenance agreement for WMTA’s stations in Washington, DC and Arlington, VA which fuel 300 buses with an approximate 4.6 million gallons of natural gas.

Clean Energy is extending its partnership with the City of Burbank for an additional 10 years, providing an anticipated five million gallons of RNG at two stations to fuel 50 trucks and transit vehicles.

US Foods, a transporter of food products with operations in Sacramento, has signed a fueling agreement for an estimated 280,000 gallons of RNG to power 17 trucks.

More clean vehicles are coming to the Ports of Los Angeles and Long Beach. Clean Energy has signed fueling agreements with Pacific Expressway and others for an approximate total 2.2 million gallons of RNG.

Propark, a national parking and transit provider for Yale University Hospital in New Haven, CT, has signed a fueling agreement for an anticipated 400,000 gallons of natural gas to power its shuttle buses.

Forward-Looking Statements

This news release contains forward-looking statements within the meaning of Section 27A of the Securities Act of 1933 and Section 21E of the Securities Exchange Act of 1934 that involve risks, uncertainties and assumptions, including without limitation statements about amounts of natural gas expected to be produced or consumed; numbers of vehicles expected to be deployed or financed; the environmental and other benefits of Clean Energy’s fuels; the timing and scope of construction, maintenance, and other projects; the impacts of legislative and regulatory developments; and the value and scope of contracts. Actual results and the timing of events could differ materially from those anticipated in these forward-looking statements. The forward-looking statements made herein speak only as of the date of this press release and, unless otherwise required by law, Clean Energy undertakes no obligation to publicly update such forward-looking statements to reflect subsequent events or circumstances. Additionally, the reports and other documents Clean Energy files with the SEC (available at www.sec.gov) contain risk factors, which may cause actual results to differ materially from the forward-looking statements contained in this news release.

About Clean Energy

Clean Energy Fuels Corp. is the country’s largest provider of the cleanest fuel for the transportation market. Our mission is to decarbonize transportation through the development and delivery of renewable natural gas (RNG), a sustainable fuel derived from organic waste. Clean Energy allows thousands of vehicles, from airport shuttles to city buses to waste and heavy-duty trucks, to reduce their amount of climate-harming greenhouse gas. We operate a vast network of fueling stations across the U.S. and Canada. Visit www.cleanenergyfuels.com and follow @ce_renewables on Twitter.


Contacts

Raleigh Gerber
949-437-1397
This email address is being protected from spambots. You need JavaScript enabled to view it.

STAMFORD, Conn.--(BUSINESS WIRE)--Altus Power, Inc. (“Altus Power” or the “Company”) (NYSE: AMPS), the premier independent developer, owner and operator of commercial-scale solar facilities, today announced that Diane Brink has joined its Board of Directors. Ms. Brink will additionally chair the Compensation Committee and serve as a member of the Audit Committee.


“Diane’s proven track record leading marketing and customer experience complements the skill set of our current Board of Directors,” said Christine Detrick, Chairperson of Altus Power. “Altus Power is in the business of building customer relationships, and we believe Diane’s expertise will prove invaluable in the coming years as we continue to expand our brand.”

“I am honored to join the Board of Directors of Altus Power and look forward to supporting their mission to create a clean electrification ecosystem for every home, business and electric vehicle,” commented Brink. “I believe my work in digital transformation, go to market and technology will lend itself well to Altus Power’s strategy.”

Ms. Brink brings over thirty-five years of experience at IBM where she was most recently Chief Marketing Officer of IBM Global Technology Services. Ms. Brink is a Senior Fellow and Adjunct Professor at the Kellogg School of Management at Northwestern University, Kellogg Markets and Customers Initiative. Ms. Brink is currently a member of the Belden, Inc (NYSE: BDC) Board of Directors and the indie Semiconductor (NASDAQ: INDI) Board of Directors.

Ms. Brink replaces the Board position previously held by Sharon Daley, who effective as of January 18, 2023, has resigned as a director of the Company to pursue other professional opportunities. Ms. Brink will serve as director for the remainder of Ms. Daley’s term, which expires at the Company’s 2025 annual meeting of stockholders.

About Altus Power, Inc.

Altus Power, based in Stamford, Connecticut, is the premier independent commercial-scale clean electrification company serving commercial, industrial, public sector and community solar customers with an end-to-end solution. Altus Power originates, develops, owns and operates locally-sited solar generation, energy storage and charging infrastructure across the nation. Visit www.altuspower.com to learn more.


Contacts

Altus Power:

Chris Shelton
Head of IR
This email address is being protected from spambots. You need JavaScript enabled to view it.

AKRON, Ohio--(BUSINESS WIRE)--$BW #renewableenergy--Babcock & Wilcox (B&W) (NYSE: BW) announced today that its B&W Environmental and B&W Renewable business segments have been awarded a contract for approximately $65 million by Lostock Sustainable Energy Plant Ltd. (LSEP) to provide engineering services and advanced technologies for the LSEP Sustainable Energy plant located at Lostock Gralam near Manchester, UK. LSEP is a joint venture formed by Copenhagen Infrastructure Partners and FCC Environment (UK).

B&W’s global operations will provide technologies and services for the project, including GMAB™ flue gas treatment technologies, SPIG™ air-cooled condensers, Diamond Power® boiler cleaning equipment and engineering in both B&W’s Denmark and U.S. offices.

The Lostock plant will utilize residual waste to generate 60+ megawatts of energy for residents and businesses. Additionally, this plant will be one of the largest operational waste-to-energy plants in the UK processing around 600,000 tonnes of waste annually. The site of the plant was previously the site of a decommissioned coal-fired power plant.

“We thank LSEP for choosing B&W for this key clean energy project,” said Executive Vice President and Chief Operating Officer Jimmy Morgan. “B&W’s waste-to-energy, environmental and other technologies will play a critical role in decarbonization and the transition to renewable energy, and we’re pleased to contribute our expertise to the Lostock project.”

“Waste-to-energy is also a powerful solution for eliminating emissions of the potent greenhouse gas methane from landfills, using waste that would otherwise decompose and create methane to produce clean, renewable power,” Morgan said.

A spokesperson for LSEP said, “We thank Babcock & Wilcox for supporting us with the delivery of this project and look forward to working with the B&W team. This appointment is a key milestone on our journey to manage the delivery of the LSEP plant and provides the certainty that will help us to unlock the significant investment, job creation and energy security benefits of the project.”

With hundreds of units in operation around the world, B&W Renewable has many decades of experience and extensive expertise with technologies that generate steam and power from municipal and industrial waste fuels.

B&W Environmental’s GMAB flue gas cleaning and flue gas condensation technologies are applicable for a wide range of applications, including waste-to-energy, co-incineration and hazardous waste incineration plants. The company’s SPIG dry cooling technologies can be tailored for many applications and are a sustainable and environmentally conscious cooling solution, eliminating water discharge and protecting the environment. B&W’s Diamond Power boiler cleaning systems are available in steam/air, high pressure water, and dual-media air heater cleaning configurations and are ideally suited for renewable and waste-to-energy applications.

The Lostock waste-to-energy plant is scheduled to begin commercial operation in late 2025.

About Babcock & Wilcox

Headquartered in Akron, Ohio, Babcock & Wilcox Enterprises, Inc. is a leader in energy and environmental products and services for power and industrial markets worldwide. Follow us on LinkedIn and learn more at babcock.com.

Forward-Looking Statements

B&W cautions that this release contains forward-looking statements, including, without limitation, statements relating to a contract to provide engineering services and advanced technologies for the LSEP Sustainable Energy plant located near Manchester, UK. These forward-looking statements are based on management’s current expectations and involve a number of risks and uncertainties. For a more complete discussion of these risk factors, see our filings with the Securities and Exchange Commission, including our most recent annual report on Form 10-K. If one or more of these risks or other risks materialize, actual results may vary materially from those expressed. We caution readers not to place undue reliance on these forward-looking statements, which speak only as of the date of this release, and we undertake no obligation to update or revise any forward-looking statement, except to the extent required by applicable law.


Contacts

Investor Contact:
Investor Relations
Babcock & Wilcox
704.625.4944
This email address is being protected from spambots. You need JavaScript enabled to view it.

Media Contact:
Ryan Cornell
Public Relations
Babcock & Wilcox
330.860.1345
This email address is being protected from spambots. You need JavaScript enabled to view it.

HAMILTON, Bermuda--(BUSINESS WIRE)--Valaris Limited (NYSE: VAL) ("Valaris" or the "Company") will hold its fourth quarter 2022 earnings conference call at 9:00 a.m. CDT (10:00 a.m. EDT) on Tuesday, February 21, 2023. The earnings release will be issued before the New York Stock Exchange opens that morning.


The conference call will be webcast live at www.valaris.com. Alternatively, callers may dial +1-855-239-3215 within the United States or +1-412-542-4130 from outside the U.S. It is recommended that participants call 10 minutes prior to the scheduled start time.

A webcast replay and transcript of the call will be available on the Company’s website. A replay will also be available through March 21, 2023, by dialing +1-877-344-7529 within the United States or +1-412-317-0088 from outside the U.S. (conference ID 5286848).

Valaris uses its website to disclose material and non-material information to investors, customers, employees and others interested in the Company. To receive regular updates on Valaris news or SEC filings, please sign-up for Email Alerts on the Company’s website.

About Valaris Limited

Valaris Limited (NYSE: VAL) is the industry leader in offshore drilling services across all water depths and geographies. Operating a high-quality rig fleet of ultra-deepwater drillships, versatile semisubmersibles and modern shallow-water jackups, Valaris has experience operating in nearly every major offshore basin. Valaris maintains an unwavering commitment to safety, operational excellence, and customer satisfaction, with a focus on technology and innovation. Valaris Limited is a Bermuda exempted company (Bermuda No. 56245). To learn more, visit our website at www.valaris.com.


Contacts

Investor & Media Contacts:
Darin Gibbins
Vice President - Investor Relations and Treasurer
+1-713-979-4623

Tim Richardson
Director - Investor Relations
+1-713-979-4619

All amounts expressed are in U.S. dollars, denominated by “$”.


Q4 and FY 2022 Highlights

  • Quarterly V2O5 production of 2,004 tonnes (4.4 million lbs1) in Q4 2022 vs. 2,003 tonnes in Q4 2021; Annual V2O5 production of 10,436 tonnes (23.0 million lbs1) in 2022 vs. 10,319 tonnes in 2021
  • Quarterly global V2O5 recovery of 74.7% in Q4 2022 vs. 76.0% in Q4 2021; Annual global V2O5 recovery of 79.1% in 2022 vs. 79.7% in 2021
  • V2O5 production in Q4 2022 was largely impacted by a lower quantity of mined material available due in part to the Company's mining contractor transition in September 2022; As a result, the low availability of mined material stockpiles was insufficient to effectively mitigate the impacts of corrective maintenance in November 2022 and heavy rain in December 2022 at Maracás Menchen Mine
  • Quarterly sales of 2,774 tonnes of V2O5 equivalent (inclusive of 118 tonnes of purchased material) in Q4 2022 vs. 2,899 tonnes in Q4 2021; Annual V2O5 equivalent sales of 11,091 (inclusive of 1,057 tonnes of purchased material) tonnes in 2022 vs. 11,393 tonnes in 2021 and within sales guidance of 11,000 – 12,000 tonnes
  • In Q4 2022, vanadium demand remained steady in the steel and chemical sectors, while the aerospace and vanadium redox flow battery ("VRFB") sectors saw considerable growth; In Europe, average V2O5 prices increased approximately 18% to $9.44 per lb at the end of the quarter, and have risen to $10.08 as of January 20, 2023
  • Largo Clean Energy (“LCE”) and Ansaldo Green Tech (“Ansaldo”) continued their negotiations to form a joint venture for the manufacture and commercial deployment of vanadium redox flow batteries (“VRFB”) in the European, African and Middle East power generation markets; The exclusivity agreement between LCE and Ansaldo in accordance with the previously announced non-binding MOU has been extended to March 31, 2023 to allow for the completion of ongoing negotiations
  • The Company progressed with the construction of its ilmenite concentration plant at its Maracás Menchen Mine in Q4 2022; Received all required flotation structures and is finalizing the building of its desliming, flotation, filtration, warehouse and pipe rack structures; Commissioning to be completed in Q2 2023
  • The Company received 'Company of the Year in the Mineral Sector' for its work in Social Governance from Brasil Mineral magazine and ‘Company of the Year’ from Companhia Baiana de Pesquisa Mineral (“CBPM”); These recognitions are the result of the Company’s dedication to executing on our on going Environment, Social and Governance (“ESG”) initiatives with the goal of progressing sustainable development at Largo

TORONTO--(BUSINESS WIRE)--$LGO #cleanenergy--Largo Inc. ("Largo" or the "Company") (TSX: LGO) (NASDAQ: LGO) today announces annual production of 10,436 tonnes (23.0 million lbs1) of vanadium pentoxide (“V2O5”) equivalent and sales of 11,091 tonnes of V2O5 equivalent from its Maracás Menchen Mine in 2022.

Paulo Misk, President and CEO of Largo, stated: “Despite operational challenges faced in 2022, we continue to prioritize and focus on the steady state operation of our Maracás Menchen Mine in Brazil. To ensure normal operating performance throughout 2023, our operational team performed mitigation efforts to rectify rain-related impacts and preventive maintenance measures during the operational downtime in December 2022 and January 2023.”

He continued: “In the coming year, we expect to meet our planned objectives to fully realize the value of our tier one vanadium company, including annual guidance for 2023, the completion of our ilmenite concentration plant, and the delivery of our inaugural VRFB for Enel in the second quarter of 2023.” He concluded: “While our negotiation with Ansaldo continues, LCE’s senior management continue to maintain their efforts on core development and system improvements required to support the current and future needs of the long duration energy storage sector. We are pleased to see a strengthening in vanadium demand, driven by strong high purity aerospace inquiries and new VRFB deployments, which has led to price increases in recent months.”

Maracás Menchen Mine Operational and Sales Results


Q4 2022


Q4 2021


2022


2021


Total Ore Mined (tonnes)


326,552


277,783


1,359,927


1,248,967

Ore Grade Mined - Effective Grade (%)2


0.96


1.00


1.11


1.12


Concentrate Produced (tonnes)


90,797


86,129


406,951


398,847

Grade of Concentrate (%)


2.94


3.13


3.18


3.23

Global Recovery (%)3


74.7


76.0


79.1


79.7


V2O5 produced (Flake + Powder) (tonnes)


2,004


2,003


10,436


10,319

V2O5 produced (equivalent pounds) 1


4,420,263


4,415,854


23,007,414


22,749,473

Total V2O5 equivalent sold (tonnes)


2,774


2,899


11,091


11,393

Produced V2O5 equivalent sold (tonnes)


2,656


2,843


10,034


10,864

Purchased V2O5 equivalent sold (tonnes)


118


56


1,057


529


Q4, FY 2022 and Other Highlights

  • Quarterly Operational Results Impacted by a Mining Contractor Change, Mine Sequencing and Heavy Rainfall: In Q4 2022, V2O5 production from the Maracás Menchen Mine of 2,004 tonnes was in line with the 2,003 tonnes produced in Q4 2021. As a result of the Company's mining contractor transition and corrective maintenance at the leaching and deammoniator areas, 804 tonnes of V2O5 were produced in October 2022. Production of 605 tonnes in November 2022 was affected by changes in mining sequence and 596 tonnes in December 2022 was affected by heavy rains at the Company's operations. Annual V2O5 production was 10,436 tonnes in 2022, being largely in line with the 10,319 tonnes produced in 2021. Lower annual production was due to preventative and corrective maintenance at Company’s plant facility in Maracás in Q1 2022, a planned kiln and cooler refractory refurbishment in Q3 2022 and heavy rainfall in December. In Q4 2022, global recoveries3 averaged 74.7% as compared to the 76.0% averaged in Q4 2021. The Company achieved an annual average global V2O5 recovery3 rate of 79.1% in 2022. The Company mined 1,359,927 tonnes of ore with an effective V2O5 grade2 of 1.11% in 2022 compared to 1,248,967 tonnes with an effective V2O5 grade2 of 1.12% in 2021. The impact on the Company’s global recovery3 and mined ore in 2022 is primarily due to the reasons mentioned above.
  • Rainfall Impact and Mitigation Efforts – Impacts to January 2023 Production and Sales Expected: Despite rain-related mitigation efforts implemented at the end of 2021, the Company’s Maracás Menchen Mine experienced approximately 36% more rainfall in December 2022 compared to December 2021, and more than 76% more rainfall on a single day during the same comparative month. This resulted in approximately 16 days of operational downtime in December 2022 and January 2023, during which time the Company performed preventative maintenance measure such as kiln refractory and electrostatic precipitator (“ESP”) repairs, previously planned for February 2023. In 2021, the Company constructed a diversion channel surrounding the Campbell Pit and upgraded its pumping system capacity to mitigate rainwater accumulation inside the pit. In December 2022, the diversion channel successfully mitigated rain from entering the pit downstream, however, unexpected levels of heavy rainfall caused significant rainfall accumulation inside the pit. The Company plans to further upgrade its pumping system capacity and expects to build additional mined material stockpiles in 2023 to mitigate impacts to mining operations going forward. As a result of these rain-related impacts in December 2022 and January 2023, the Company expects Q1 2023 production and sales ranges of 1,900 – 2,200 tonnes and 2,300 – 2,500 tonnes, respectively.
  • Annual Sales Results Within Guidance – Vanadium Prices Reflect Increase in Demand: In Q4 2022, V2O5 equivalent sales were 2,774 tonnes (inclusive of 118 tonnes of purchased material), representing a 4% decrease over Q4 2021. Total V2O5 equivalent sales were 11,091 tonnes (inclusive of 1,057 tonnes of purchased material) in 2022, representing a 3% decrease over 2021. Lower sales in Q4 were impacted by the effects of lower production. Stronger vanadium prices exiting the quarter reflected an increase in demand from the high purity aerospace sector and continued growth in VRFB deployments, particularly in China. The average benchmark price per lb of V2O5 in Europe was $9.44 exiting the quarter, representing an increase of approximately 20% from the lows of 2022. As of January 20, 2023, the benchmark price per lb of V2O5 in Europe was $10.08.
  • Inaugural VRFB Deployment Progress: During Q4 2022, LCE continued to make additional progress on the delivery of the Enel Green Power España (“EGPE”) contract. Substantially all of the hardware is either in transit or ready for installation at the deployment site in Spain. The remaining items to be shipped are six of the twelve electrolyte storage containers, which will be shipped in February 2023 and installed in March 2023. Additionally, the Company expects the installation and interconnection of the AC and DC power systems to be completed in Q1 2023. The hot commissioning of the VRFB system as well as provisional acceptance, which requires the completion of as-build drawings, manuals, final punch-list items, and operational testing by EGPE is expected to be completed in Q2 2023.
  • New Debt Facilities Secured in Brazil: In December 2022, the Company secured an additional debt facility of $20.0 million with a bank in Brazil. The facility is for three years, with a 360-day grace period and equal principal repayments due every six months until maturity following the grace period. In addition to a fee of 0.7%, accrued interest at a rate of 8.20% p.a. is to be paid every six months until maturity. In January 2023, the Company secured two additional debt facilities with banks in Brazil. The first facility of $15.0 million is for two years, with a 180-day grace period and equal principal repayments due every three months until maturity following the grace period. In addition, accrued interest at a rate of 6.85% p.a. is to be paid every three months. The second facility of $10.0 million is for three years, with a 360-day grace period and equal principal repayments due every six months until maturity following the grace period. In addition to a fee of 0.7%, accrued interest at a rate of 8.36% p.a. is to be paid every six months. A portion of the December 2022 debt facility was used in December 2022 to repay the Company's existing $15.0 million debt facility secured in April 2022 and due for repayment in April 2023, with the remaining debt facilities primarily being used to address working capital pressures caused by ongoing capex projects in the first six months of 2023.

2023 Production, Sales and Cost Guidance

Tables summarizing the Company’s 2023 production, sales and cost guidance is provided below. It is expected that the Company will incur higher cash operating costs excluding royalties4 in the first half of 2023 as a result of lower sales in H1 2023, a result of previously noted rain-related operational impacts in Q4 2022 and Q1 2023. In H1 2023, the Company anticipates cash operating costs excluding royalties4 to be above the average cost guidance provided for 2023 with H2 2023 being closer to the lower end.

Tonnes V2O5

Q1

Q2

Q3

Q4

2023


Low


High

Low


High

Low


High

Low


High

Low


High

Productioni

1,900


2,200

3,000


3,200

3,050


3,300

3,050


3,300

11,000


12,000

Sales

2,300


2,500

2,300


2,500

2,850


3,150

2,850


3,150

10,300


11,300

i. The annual 2023 sales guidance does not include purchased material.

Cash Operating Cost Excluding Royalties ($/lb sold)4


$4.85 – 5.25

Vanadium Distribution Costs


$9.0 – 10.0 million

Corporate and Sales & Trading, General and Administrative Expenses


$9.0 – 10.0 million

Largo Clean Energy General and Administrative Expenses


$13.5 – 14.5 million

2023 Capital Expenditures Guidance

In 2023, the Company plans to invest approximately $50.5 million on capital expenditures of which approximately $4.0 million has been carried over from the 2022 capital expenditures budget. The $48.0 million capital expenditure budget includes approximately $12.5 million for sustaining capital requirements, $12.5 million for capitalized stripping, $18.0 million to finalize the construction of the Company’s ilmenite concentration plant and $2.5 million for the installation of an additional dry magnetic separator to assist with the Company’s mining operations in Brazil.

Sustaining Capital Expenditures


$13.0 – 14.0 million

Capitalized Stripping Capital Expenditures


$12.0 – 13.0 million

Ilmenite Concentration Plant Capital Expenditures


$17.5 – 18.5 million

Dry Magnetic Separator Capital Expenditure


$2.0 – 3.0 million

Carry-Over Capital Expenditures


$3.5 – 4.5 million

Management has made the decision to postpone the Company's existing plans to further develop its titanium dioxide ("TiO2") pigment plant until additional funds are made available, either internally or externally. At this time, the Company is exploring alternative debt financing or strategic association options with advisors and will provide an update as things progress.

About Largo

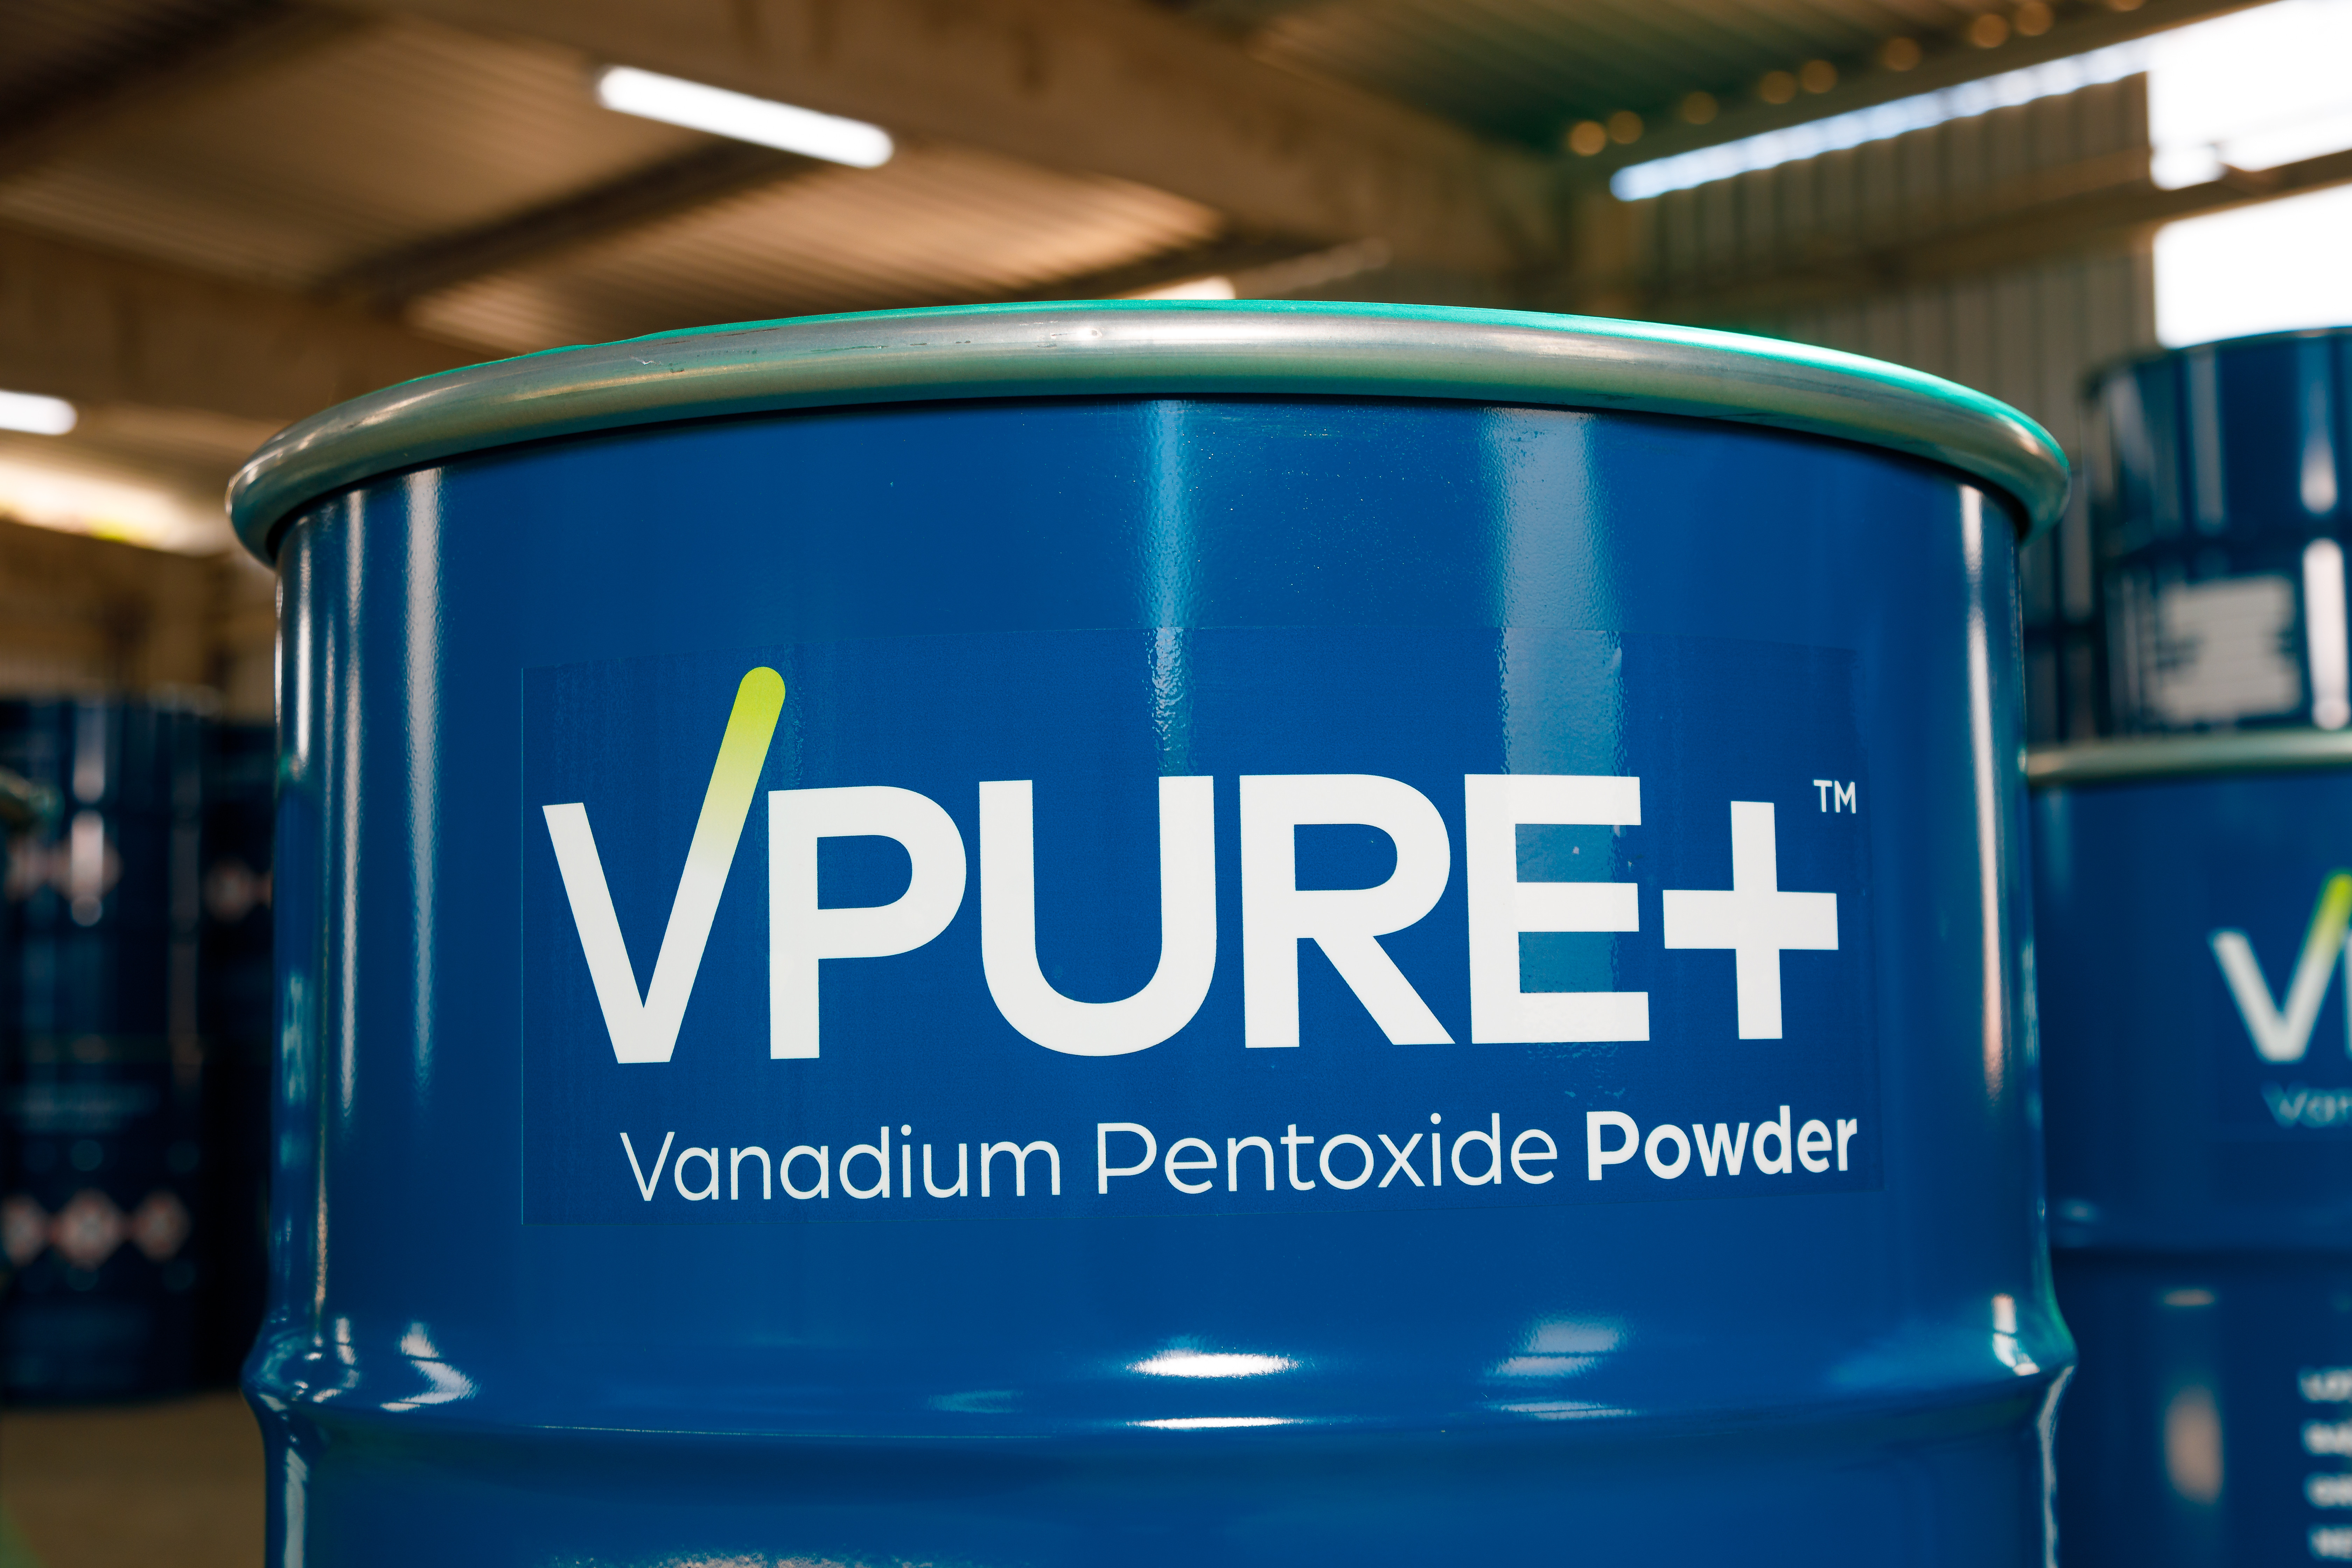
Largo has a long and successful history as one of the world’s preferred vanadium companies through the supply of its VPURE™ and VPURE+™ products, which are sourced from one of the world's highest-grade vanadium deposits at the Company's Maracás Menchen Mine in Brazil. Aiming to enhance value creation at Largo, the Company is in the process of implementing a titanium dioxide pigment plant using feedstock sourced from its existing operations in addition to advancing its U.S.-based clean energy division with its VCHARGE vanadium batteries. Largo’s VCHARGE vanadium batteries contain a variety of innovations, enabling an efficient, safe and ESG-aligned long duration solution that is fully recyclable at the end of its 25+ year lifespan. Producing some of the world’s highest quality vanadium, Largo’s strategic business plan is based on two pillars: 1.) leading vanadium supplier with an outlined growth plan and 2.) U.S.-based energy storage business support a low carbon future.

Largo’s common shares trade on the Nasdaq Stock Market and on the Toronto Stock Exchange under the symbol "LGO". For more information on the Company, please visit www.largoinc.com.

Cautionary Statement Regarding Forward-looking Information:

This press release contains “forward-looking information” and “forward-looking statements” within the meaning of applicable Canadian and United States securities legislation. Forwardlooking information in this press release includes, but is not limited to, statements with respect to the timing and amount of estimated future production and sales; the future price of commodities; costs of future activities and operations, including, without limitation, the effect of inflation and exchange rates; the effect of unforeseen equipment maintenance or repairs on production; timing and cost related to the build-out of the ilmenite plant; the ability to produce vanadium trioxide according to customer specifications; the extent of capital and operating expenditures; the impact of global delays and related price increases on the Company’s global supply chain and future sales of vanadium products. Forwardlooking information in this press release also includes, but is not limited to, statements with respect to our ability to build, finance and successfully operate a VRFB business, the projected timing and cost of the completion of the EGPE project; our ability to protect and develop our technology, our ability to maintain our IP, the competitiveness of our product in an evolving market, our ability to market, sell and deliver our VCHARGE batteries on specification and at a competitive price, our ability to successfully deploy our VCHARGE batteries in foreign jurisdictions; our ability to negotiate and enter into a joint venture with Ansaldo Green Tech on terms satisfactory to the Company and the success of such joint venture; the receipt of necessary governmental permits and approvals on a timely basis, our ability to secure the required resources to build and deploy our VCHARGE batteries, and the adoption of VRFB technology generally in the market.

The following are some of the assumptions upon which forward-looking information is based: that general business and economic conditions will not change in a material adverse manner; demand for, and stable or improving price of V2O5 and other vanadium commodities; receipt of regulatory and governmental approvals, permits and renewals in a timely manner; that the Company will not experience any material accident, labour dispute or failure of plant or equipment or other material disruption in the Company’s operations at the Maracás Menchen Mine or relating to Largo Clean Energy; the availability of financing for operations and development; the ability to mitigate the impact of continuing heavy rainfall; the Company’s ability to procure equipment and operating supplies in sufficient quantities and on a timely basis; that the estimates of the resources and reserves at the Maracás Menchen Mine are within reasonable bounds of accuracy (including with respect to size, grade and recovery and the operational and price assumptions on which such estimates are based); the competitiveness of the Company's VRFB technology; that the Company’s current plans for ilmenite and VRFBs can be achieved; the Company's "two-pillar" business strategy will be successful; the Company's sales and trading arrangements will not be affected by the evolving sanctions against Russia; and the Company’s ability to attract and retain skilled personnel and directors; the ability of management to execute strategic goals.

Forward-looking statements can be identified by the use of forward-looking terminology such as "plans", "expects" or "does not expect", "is expected", "budget", "scheduled", "estimates", "forecasts", "intends", "anticipates" or "does not anticipate", or "believes", or variations of such words and phrases or statements that certain actions, events or results "may", "could", "would", "might" or "will be taken", "occur" or "be achieved". All information contained in this news release, other than statements of current and historical fact, is forward looking information. Forward-looking statements are subject to known and unknown risks, uncertainties and other factors that may cause the actual results, level of activity, performance or achievements of Largo or Largo Clean Energy to be materially different from those expressed or implied by such forward-looking statements, including but not limited to those risks described in the annual information form of Largo and in its public documents filed on www.sedar.com and available on www.sec.gov from time to time. Forward-looking statements are based on the opinions and estimates of management as of the date such statements are made. Although management of Largo has attempted to identify important factors that could cause actual results to differ materially from those contained in forward-looking statements, there may be other factors that cause results not to be as anticipated, estimated or intended. There can be no assurance that such statements will prove to be accurate, as actual results and future events could differ materially from those anticipated in such statements. Accordingly, readers should not place undue reliance on forward-looking statements. Largo does not undertake to update any forward-looking statements, except in accordance with applicable securities laws. Readers should also review the risks and uncertainties sections of Largo's annual and interim MD&As which also apply.

Trademarks are owned by Largo Inc.

Future Oriented Financial Information:

Any financial outlook or future oriented financial information contained in this press release, as such term is defined by applicable securities laws, has been approved by management of Largo as of the date hereof and is provided for the purpose of providing information about management's current expectations and plans relating to the Company's 2023 guidance. Readers are cautioned that any such future oriented financial information contained herein should not be used for purposes other than those for which it is disclosed herein. The Company and its management believe that the prospective financial information as to the Company's anticipated 2023 guidance has been prepared on a reasonable basis, reflecting management's best estimates and judgments. However, because this information is highly subjective, it should not be relied on as necessarily indicative of future results.

Non-GAAP5 Measures

The Company uses certain non-GAAP financial performance measures in this press release, which are described in the following section.

Cash Operating Costs

The Company’s press release refers to cash operating costs per pound, a non-GAAP performance measure, in order to provide investors with information about a key measure used by management to monitor performance. This information is used to assess how well the Maracás Menchen Mine is performing compared to plan and prior periods, and also to assess its overall effectiveness and efficiency. Cash operating costs includes mine site operating costs such as mining costs, plant and maintenance costs, sustainability costs, mine and plant administration costs, royalties and sales, general and administrative costs (all for the Mine properties segment), but excludes depreciation and amortization, share-based payments, foreign exchange gains or losses, commissions, reclamation, capital expenditures and exploration and evaluation costs. Operating costs not attributable to the Mine properties segment are also excluded, including conversion costs, product acquisition costs, distribution costs and inventory write-downs. These costs are then divided by the pounds of vanadium sold that were produced by the Maracás Menchen Mine to arrive at the cash operating costs per pound. This measure differs to the new total cash costs non-GAAP measure the Company uses to measure its overall performance (see Company’s latest Management Discussion and Analysis). These measures, along with revenues, are considered to be one of the key indicators of the Company’s ability to generate operating earnings and cash flow from its Maracás Menchen Mine. These cash operating costs measures do not have any standardized meaning prescribed by IFRS and differ from measures determined in accordance with IFRS. These measures are intended to provide additional information and should not be considered in isolation or as a substitute for measures of performance prepared in accordance with IFRS. These measures are not necessarily indicative of net earnings or cash flow from operating activities as determined under IFRS.

___________________________
1 Conversion of tonnes to pounds, 1 tonne = 2,204.62 pounds or lbs.
2 Effective grade represents the percentage of magnetic material mined multiplied by the percentage of V2O5 in the magnetic concentrate.
3 Global recovery is the product of crushing recovery, milling recovery, kiln recovery, leaching recovery and chemical plant recovery.
4 Cash operating costs excluding royalties per pound reported are on a non-GAAP basis. Refer to the “Non-GAAP Measures” section of this press release.
5 GAAP – Generally Accepted Accounting Principles


Contacts

Investor Relations
Alex Guthrie
Senior Manager, External Relations
+1.416.861.9778
This email address is being protected from spambots. You need JavaScript enabled to view it.

Texas refinery meets standards to process pyrolysis oil from hard-to-recycle waste plastics into sustainable feedstocks

HOUSTON--(BUSINESS WIRE)--Phillips 66 (NYSE: PSX) today announced it has received International Sustainability and Carbon Certification (ISCC) PLUS certification for its Sweeny Refinery in Texas to process oil made from waste plastics into feedstocks for new plastics.


Phillips 66 is committed to keeping plastics out of the environment and driving toward a more circular economy where plastics packaging is reused, recycled or recovered,” said Zhanna Golodryga, Executive Vice President of Emerging Energy and Sustainability at Phillips 66. “The ISCC PLUS certification highlights the company’s resolve to create sustainable streams for waste materials and to support the growth of advanced recycling in plastics.”

ISCC is a globally applicable and industry recognized sustainability certification system that covers all sustainable feedstocks, including circular feedstocks produced from plastic waste. Its ISCC PLUS certificate covers bio-based and recycled, or circular, raw materials.

The certification for the Sweeny Refinery is the latest example of how Phillips 66 is working to play a key role in building a lower-carbon future by capitalizing on its core competencies and integrated assets.

The ISCC PLUS certification verifies the refinery meets the standards to process pyrolysis oil made from hard-to-recycle waste plastics into circular ethane, circular propane, circular propylene and other sustainable feedstocks and petrochemical building blocks. The products will be used to support polymer producers — including Chevron Phillips Chemical Company LLC, Phillips 66’s 50-50 joint venture — that are advancing a circular economy for plastics.

Chevron Phillips Chemical already produces Marlex® Anew™ Circular Polyethylene at its Cedar Bayou complex in Baytown, Texas, and is targeting an annual production volume of 1 billion pounds of the circular polymer by 2030.

Sweeny Refinery, which is located in Old Ocean, Texas, on the Gulf Coast, is the second Phillips 66 refinery to achieve an ISCC PLUS certification and the first for the processing of waste plastic pyrolysis oil into circular feedstocks. Its Humber Refinery in the U.K. is ISCC PLUS certified to process used cooking oil, food waste and other circular feedstocks.

About Phillips 66

Phillips 66 (NYSE: PSX) manufactures, transports and markets products that drive the global economy. The diversified energy company’s portfolio includes Midstream, Chemicals, Refining, and Marketing and Specialties businesses. Headquartered in Houston, Phillips 66 has employees around the globe who are committed to safely and reliably providing energy and improving lives while pursuing a lower-carbon future. For more information, visit phillips66.com or follow @Phillips66Co on LinkedIn or Twitter.

PHILLIPS 66 CAUTIONARY STATEMENT FOR THE PURPOSE OF THE “SAFE HARBOR” PROVISIONS OF THE PRIVATE SECURITIES LITIGATION REFORM ACT OF 1995

This news release contains forward-looking statements within the meaning of Section 27A of the Securities Act of 1933, as amended, and Section 21E of the Securities Exchange Act of 1934, as amended, which are intended to be covered by the safe harbors created thereby. Forward-looking statements may be identified by the use of words like “plans,” “expects,” “will,” “anticipates,” “believes,” “intends,” “projects,” “targets,” “estimates” or other words of similar meaning. Forward-looking statements are based on certain assumptions and expectations of future events which may not be accurate or realized, and involve risks and uncertainties, many of which are beyond Phillips 66’s control. A discussion of factors that may affect future results is included in Phillips 66’s filings with the Securities and Exchange Commission. Phillips 66 disclaims and does not undertake any obligation to update or revise any forward-looking statement, except as required by applicable law.


Contacts

Jeff Dietert (investors)
832-765-2297
This email address is being protected from spambots. You need JavaScript enabled to view it.

Owen Simpson (investors)
832-765-2297
This email address is being protected from spambots. You need JavaScript enabled to view it.

Thaddeus Herrick (media)
855-841-2368
This email address is being protected from spambots. You need JavaScript enabled to view it.

  • Net income of $0.72 per diluted share.
  • Operating margin of 17.5%, increased 460 basis points year-over-year.
  • Full year revenue of $20.3 billion, increased 33% year-over-year.
  • Full year operating income of $2.7 billion, increased 50% year-over-year.
  • 2023 first quarter dividend increases by 33% to $0.16 per share.

HOUSTON--(BUSINESS WIRE)--Halliburton Company (NYSE: HAL) announced today net income of $656 million, or $0.72 per diluted share, for the fourth quarter of 2022. This compares to net income for the third quarter of 2022 of $544 million, or $0.60 per diluted share. Halliburton's total revenue for the fourth quarter of 2022 was $5.6 billion compared to total revenue of $5.4 billion in the third quarter of 2022. Operating income was $976 million in the fourth quarter of 2022 compared to operating income of $846 million in the third quarter of 2022.


Total revenue for the full year of 2022 was $20.3 billion, an increase of $5.0 billion, or 33% from 2021. Operating income for 2022 was $2.7 billion, and adjusted operating income was $3.1 billion, excluding impairments and other charges, compared to operating income of $1.8 billion for 2021.

Halliburton’s execution in 2022 demonstrated the earnings power of our strategy, and I expect this earnings power to strengthen in 2023 and beyond. Both operating divisions delivered strong margins in the international and North America markets,” commented Jeff Miller, Chairman, President and CEO.

I am pleased to announce that our Board has adopted a capital returns framework and an increase in our dividend to sixteen cents ($0.16) per share beginning this quarter. This capital returns framework, our dividend increase, and the share buy backs we made during the fourth quarter demonstrate Halliburton’s confidence in our business, customers, employees, and value proposition.

I am confident in Halliburton’s strong outlook and ability to generate increased returns for shareholders. Halliburton’s exceptional financial performance is a clear result of executing our strategic priorities - to maximize value in North America, deliver profitable international growth and drive capital efficiency,” concluded Miller.

Operating Segments

Completion and Production

Completion and Production revenue in the fourth quarter of 2022 was $3.2 billion, an increase of $46 million, or 1%, when compared to the third quarter of 2022, while operating income was $659 million, an increase of $76 million, or 13%. These results were driven by weather related lower stimulation activity offset by improved pricing, service efficiency and activity mix in North America land, as well as higher completion tool sales and cementing activity globally.

Drilling and Evaluation

Drilling and Evaluation revenue in the fourth quarter of 2022 was $2.4 billion, an increase of $179 million, or 8%, when compared to the third quarter of 2022, while operating income was $387 million, an increase of $62 million, or 19%. These results were due to increased drilling-related services, testing services, and year-end software sales internationally and higher project management activity in Mexico.

Geographic Regions

North America

North America revenue in the fourth quarter of 2022 was $2.6 billion, a 1% decrease when compared to the third quarter of 2022. This decrease was primarily driven by weather related lower stimulation activity and artificial lift activity in North America land. These decreases were partially offset by improved activity across multiple product service lines in the Gulf of Mexico.

International

International revenue in the fourth quarter of 2022 was $3.0 billion, a 9% increase when compared to the third quarter of 2022.

Latin America revenue in the fourth quarter of 2022 was $945 million, an increase of 12% sequentially, due to higher activity across multiple product service lines in Mexico, higher completion tool sales in the region, increased pressure pumping services in Argentina, and improved well construction services in Colombia. Partially offsetting these increases was lower fluids activity in Guyana.

Europe/Africa revenue in the fourth quarter of 2022 was $657 million, an increase of 3% sequentially, primarily driven by higher completion tool sales, testing services, and well intervention services across the region, along with increased drilling-related services in West Africa. These increases were partially offset by lower activity in Norway and decreased pipeline services across the region.

Middle East/Asia revenue in the fourth quarter of 2022 was $1.4 billion, a 10% increase sequentially, primarily resulting from higher drilling and evaluation services across the region, increased cementing activity in the Middle East, and higher completion tool sales in Saudi Arabia and United Arab Emirates. Partially offsetting these increases was lower completion tool sales in Qatar.

Other Financial Items

Halliburton’s board of directors has declared a 2023 first quarter dividend of sixteen cents ($0.16) per share on the Company’s common stock payable on March 29, 2023, to shareholders of record at the close of business on March 1, 2023.

Selective Technology & Highlights

  • Halliburton entered into drilling and wells alliance agreements with Aker BP, Noble, and Odfjell Drilling to extend their alliance for another five-years. The jack-up alliance comprises Noble Corporation, Halliburton and Aker BP. The Semi Alliance comprises Odfjell Drilling, Halliburton and Aker BP. Through the last five years the Jack-up Rig Alliance and the Semi Rig Alliance have delivered over 100 wells on the Norwegian shelf.
  • Halliburton announced a successful installation of the industry's first single trip, electro-hydraulic wet connect in deepwater for Petrobras in Brazil - a significant achievement in downhole electric completion technology. The Halliburton Fuzion® EH electro-hydraulic downhole wet-mate connector helps increase well recovery factors by maintaining integrity of Halliburton's SmartWell® completion systems throughout the well's lifecycle.
  • Halliburton introduced the NeoCem E+ and EnviraCem cement barrier systems as an expansion of their portfolio of high-performance, reduced Portland cement systems. NeoCem E+ cement contains a 50 percent or greater reduction of mass cement while EnviraCem cement contains a 70 percent or greater reduction of mass cement. Portland cement reduction in barrier systems helps customers lower carbon emission baselines and provides engineered systems with enhanced sheath performance.
  • Halliburton introduced the BrightStar® look-ahead resistivity service, a novel solution that reveals the path ahead of the drill bit to enable proactive drilling decisions. The BrightStar service incorporates data, calculations, and visualization technology to reduce operational risks in unknown environments and provide operators higher confidence to avoid unwanted formation exits. The BrightStar service provides reservoir insight of the trajectory ahead and detects changes in formation resistivity, reducing the uncertainty of formation boundary positions.
  • Halliburton introduced the FloConnect® Surface Automation Platform, a fully automated and scalable solution for efficient and safe surface well testing operations. An industry first, the FloConnect platform controls, measures, and analyzes surface well testing through automated workflows. The innovative platform facilitates a collaborative work environment and provides operators with superior well controllability, process safety, flow assurance, and emissions quantification. It also allows data access in real time, process monitoring, and control from a command center or remote location.
  • Petrobras recognized Halliburton as its best supplier in the “Drilling and Completion Services” category. The award recognizes suppliers who presented a differentiated performance in the supply of goods and services in the year 2021 - 2022, considering the requirements of quality, HSE, management, delivery deadlines, compliance and integrity in the business carried out with Petrobras.
  • Halliburton was named to the 2022 Dow Jones Sustainability Indices (DJSI), which recognizes the top 10% most sustainable companies per industry. The DJSI uses environmental, social and governance (ESG) criteria to measure and rank the performance of best-in-class companies selected for its list. When compared to its peers, Halliburton ranked in the 98th percentile among its peers and received high marks in the Human Capital Development, Risk & Crisis Management, and Business Ethics categories.
  • Halliburton Labs announced it selected three new companies to participate in its collaborative environment to advance cleaner, affordable, and reliable energy. As Halliburton Labs participants, Matrix Sensors, Renew Power Systems (RPSi), and SunGreenH2 will receive access to a broad range of industrial capabilities, technical expertise, and mentorships to scale their respective businesses.
  • Halliburton and Aker BP collaborated to develop Field Development Planning, a DecisionSpace® 365 solution to optimize the development of entire oil and gas fields. By automating the entire process, Halliburton and Aker BP aim to save time, optimize engineering efficiency, and increase the quality of field development. At the heart of that collaboration is Digital Well Program®, a DecisionSpace® 365 solution, which enabled engineers to minimize well design time from several weeks to a day. Halliburton’s solution can aggregate data from multiple sources and offer accurate proposals for the optimal development plan for a specific field based on, among other things, economics, technical capabilities, and CO2 emissions.
  • Halliburton executed the first fully automated drilling run in Kuwait delivering the landing section in record time. The remotely controlled LOGIX® Autonomous Drilling Platform, in combination with other carefully selected tools, delivered multiple record-breaking results for the field, in addition to lower overall well construction costs for the customer.
  • Halliburton recently completed its 400th FlexRite® -multibranch inflow control (MIC) system installation in the North Sea. This system allows a multilateral well to be completed with sand screens, swellable packers, inflow control devices (ICDs), and interval control valves (ICVs) to help increase reservoir exposure and maximize production from each multilateral leg. Production or injection can be managed and controlled at each individual lateral, independent of all other lateral legs.
  • Halliburton announced its VersaFlex® Expandable Liner Hanger system was selected and installed more than 1,000 times in Norway over the past 17 years. VersaFlex technology helps operators in Norway reach new levels of operating efficiency by delivering purposed technology with distinctive service quality. Unlike typical liner hanger systems, VersaFlex has no packer element or slips, which increases reliability of running liners and other deployed solutions to depth.

About Halliburton

Halliburton is one of the world’s leading providers of products and services to the energy industry. Founded in 1919, we create innovative technologies, products, and services that help our customers maximize their value throughout the life cycle of an asset and advance a sustainable energy future. Visit us at www.halliburton.com; connect with us on Facebook, Twitter, LinkedIn, Instagram and YouTube.

Forward-looking Statements

The statements in this press release that are not historical statements, including statements regarding future financial performance and our intentions with respect to our shareholder return framework, are forward-looking statements within the meaning of the federal securities laws. These statements are subject to numerous risks and uncertainties, many of which are beyond the company's control, which could cause actual results to differ materially from the results expressed or implied by the statements. These risks and uncertainties include, but are not limited to: changes in the demand for or price of oil and/or natural gas, including as a result of development of alternative energy sources, general economic conditions such as inflation and recession, the ability of the OPEC+ countries to agree on and comply with production quotas, or other causes; changes in capital spending by our customers; the modification, continuation or suspension of our shareholder return framework, including the payment of dividends and purchases of our stock, which will be subject to the discretion of our Board of Directors and may depend on a variety of factors, including our results of operations and financial condition, growth plans, capital requirements and other conditions existing when any payment or purchase decision is made; potential catastrophic events related to our operations, and related indemnification and insurance; protection of intellectual property rights; cyber-attacks and data security; compliance with environmental laws; changes in government regulations and regulatory requirements, particularly those related to oil and natural gas exploration, the environment, radioactive sources, explosives, chemicals, hydraulic fracturing services, and climate-related initiatives; assumptions regarding the generation of future taxable income, and compliance with laws related to and disputes with taxing authorities regarding income taxes; risks of international operations, including risks relating to unsettled political conditions, war, including the ongoing Russia and Ukraine conflict and any expansion of that conflict, the effects of terrorism, foreign exchange rates and controls, international trade and regulatory controls and sanctions, and doing business with national oil companies; weather-related issues, including the effects of hurricanes and tropical storms; delays or failures by customers to make payments owed to us; infrastructure issues in the oil and natural gas industry; availability and cost of highly skilled labor and raw materials; and agreement with respect to and completion of potential dispositions, acquisitions and integration and success of acquired businesses and operations of joint ventures. Halliburton's Form 10-K for the year ended December 31, 2021, Form 10-Q for the quarter ended September 30, 2022, recent Current Reports on Form 8-K and other Securities and Exchange Commission filings discuss some of the important risk factors identified that may affect Halliburton's business, results of operations, and financial condition. Halliburton undertakes no obligation to revise or update publicly any forward-looking statements for any reason.


HALLIBURTON COMPANY

Condensed Consolidated Statements of Operations

(Millions of dollars and shares except per share data)

(Unaudited)


Three Months Ended


December 31


September 30


2022


2021


2022


Revenue:


Completion and Production

$

3,182


$

2,356


$

3,136


Drilling and Evaluation


2,400


1,921


2,221


Total revenue

$

5,582


$

4,277


$

5,357


Operating income:


Completion and Production

$

659


$

347


$

583


Drilling and Evaluation


387


269


325


Corporate and other


(70

)


(66

)


(62

)

Total operating income


976


550


846


Interest expense, net


(74

)


(108

)


(93

)

Other, net


(60

)


(24

)


(48

)

Income before income taxes


842


418


705


Income tax benefit (provision)


(177

)


409


(156

)

Net income

$

665


$

827


$

549


Net income attributable to noncontrolling interest


(9

)


(3

)


(5

)

Net income attributable to company

$

656


$

824


$

544


Basic and diluted net income per share

$

0.72


$

0.92


$

0.60


Basic weighted average common shares outstanding


906


896


908


Diluted weighted average common shares outstanding


910


896


910


See Footnote Table 2 for Reconciliation of As Reported Net Income to Adjusted Net Income.


HALLIBURTON COMPANY

Condensed Consolidated Statements of Operations

(Millions of dollars and shares except per share data)

(Unaudited)


Year Ended


December 31


2022


2021


Revenue:


Completion and Production

$

11,582


$

8,410


Drilling and Evaluation


8,715


6,885


Total revenue

$

20,297


$

15,295


Operating income:


Completion and Production

$

2,037


$

1,238


Drilling and Evaluation


1,292


801


Corporate and other


(256

)


(227

)

Impairments and other charges (a)


(366

)


(12

)

Total operating income


2,707


1,800


Interest expense, net


(375

)


(469

)

Loss on early extinguishment of debt (b)


(42

)


Other, net


(180

)


(79

)

Income before income taxes


2,110


1,252


Income tax benefit (provision) (c)


(515

)


216


Net Income

$

1,595


$

1,468


Net Income attributable to noncontrolling interest


(23

)


(11

)

Net Income attributable to company

$

1,572


$

1,457


Basic net income per share

$

1.74


$

1.63


Diluted net income per share

$

1.73


$

1.63


Basic weighted average common shares outstanding


904


892


Diluted weighted average common shares outstanding


908


892


(a)

See Footnote Table 1 for details of the impairments and other charges recorded during the year ended December 31, 2022 and 2021.

(b)

During the year ended December 31, 2022, Halliburton recognized a $42 million loss on extinguishment of debt related to the early redemption of $600 million aggregate principal amount of senior notes in February 2022.

(c)

The tax benefit (provision) includes the tax effect related to impairments and other charges and the loss on early extinguishment of debt during the year ended December 31, 2022. Based on changing market conditions during 2021, Halliburton recognized a $504 million tax benefit associated with a valuation allowance on its deferred tax assets.

See Footnote Table 1 for Reconciliation of As Reported Operating Income to Adjusted Operating Income.

See Footnote Table 3 for Reconciliation of As Reported Net Income to Adjusted Net Income.


HALLIBURTON COMPANY

Condensed Consolidated Balance Sheets

(Millions of dollars)

(Unaudited)


December 31


December 31


2022


2021


Assets

Current assets:


Cash and equivalents

$

2,346


$

3,044

Receivables, net


4,627


3,666


Inventories


2,923


2,361


Other current assets


1,056


872


Total current assets


10,952


9,943


Property, plant, and equipment, net


4,348


4,326


Goodwill


2,829


2,843


Deferred income taxes


2,636


2,695


Operating lease right-of-use assets


913


934


Other assets


1,577


1,580


Total assets

$

23,255


$

22,321


Liabilities and Shareholders’ Equity

Current liabilities:


Accounts payable

$

3,121


$

2,353


Accrued employee compensation and benefits


634


493


Current portion of operating lease liabilities


224


240


Other current liabilities


1,366


1,220


Total current liabilities


5,345


4,306


Long-term debt


7,928


9,127


Operating lease liabilities


791


845


Employee compensation and benefits


408


492


Other liabilities


806


823


Total liabilities


15,278


15,593


Company shareholders’ equity


7,948


6,713


Noncontrolling interest in consolidated subsidiaries


29


15


Total shareholders’ equity


7,977


6,728


Total liabilities and shareholders’ equity

$

23,255


$

22,321


HALLIBURTON COMPANY

Condensed Consolidated Statements of Cash Flows

(Millions of dollars)

(Unaudited)


Year Ended


Three Months Ended


December 31


December 31


2022


2021


2022


Cash flows from operating activities:


Net income

$

1,595


$

1,468


$

665


Adjustments to reconcile net income to cash flows from operating activities:


Depreciation, depletion, and amortization


940


904


236


Impairments and other charges


366


12


Deferred income tax provision (benefit)


70


(486

)


31


Working capital (a)


(941

)


285


(34

)

Other operating activities


212


(272

)


265


Total cash flows provided by operating activities


2,242


1,911


1,163


Cash flows from investing activities:


Capital expenditures


(1,011

)


(799

)


(350

)

Proceeds from sales of property, plant, and equipment


200


257


43


Proceeds from a structured real estate transaction


87


Other investing activities


(156

)


(79

)


(82

)

Total cash flows used in investing activities


(967

)


(534

)


(389

)

Cash flows from financing activities:


Payments on long-term borrowings


(1,242

)


(700

)


Dividends to shareholders


(435

)


(161

)


(108

)

Stock repurchase program


(250

)


(250

)

Other financing activities


129


23


15


Total cash flows used in financing activities


(1,798

)


(838

)


(343

)

Effect of exchange rate changes on cash


(175

)


(58

)


(62

)

Increase (decrease) in cash and equivalents


(698

)


481


369


Cash and equivalents at beginning of period


3,044


2,563


1,977


Cash and equivalents at end of period

$

2,346


$

3,044


$

2,346


(a)

Working capital includes receivables, inventories, and accounts payable.

See Footnote Table 4 for Reconciliation of Cash Flows from Operating Activities to Free Cash Flow.


HALLIBURTON COMPANY

Revenue and Operating Income Comparison

By Operating Segment and Geographic Region

(Millions of dollars)

(Unaudited)


Three Months Ended


December 31


September 30

Revenue


2022


2021


2022


By operating segment:


Completion and Production

$

3,182


$

2,356


$

3,136


Drilling and Evaluation


2,400


1,921


2,221


Total revenue

$

5,582


$

4,277


$

5,357


By geographic region:


North America

$

2,611


$

1,783


$

2,635


Latin America


945


669


841


Europe/Africa/CIS


657


730


639


Middle East/Asia


1,369


1,095


1,242


Total revenue

$

5,582


$

4,277


$

5,357


Operating Income


By operating segment:


Completion and Production

$

659


$

347


$

583


Drilling and Evaluation


387


269


325


Total Operations


1,046


616


908


Corporate and other


(70

)


(66

)


(62

)

Total operating income

$

976


$

550


$

846


HALLIBURTON COMPANY

Revenue and Operating Income Comparison

By Operating Segment and Geographic Region

(Millions of dollars)

(Unaudited)


Year Ended


December 31

Revenue


2022


2021


By operating segment:


Completion and Production

$

11,582


$

8,410


Drilling and Evaluation


8,715


6,885


Total revenue

$

20,297


$

15,295


By geographic region:


North America

$

9,597


$

6,371


Latin America


3,197


2,362


Europe/Africa/CIS


2,691


2,719


Middle East/Asia


4,812


3,843


Total revenue

$

20,297


$

15,295


Operating Income


By operating segment:


Completion and Production

$

2,037


$

1,238


Drilling and Evaluation


1,292


801


Total Operations


3,329


2,039


Corporate and other


(256

)


(227

)

Impairments and other charges


(366

)


(12

)

Total operating income

$

2,707


$

1,800


See Footnote Table 1 for Reconciliation of As Reported Operating Income to Adjusted Operating Income.


FOOTNOTE TABLE 1


HALLIBURTON COMPANY

Reconciliation of As Reported Operating Income to Adjusted Operating Income

(Millions of dollars)

(Unaudited)


Year Ended


December 31


2022


2021


As reported operating income

$

2,707


$

1,800


Impairments and other charges:


Receivables


202


Property, plant, and equipment, net


100


Inventory


70


Catch-up depreciation


36


Severance


15


Gain on real estate transaction


(74

)

Other


(6

)


35


Total impairments and other charges (a)


366


12


Adjusted operating income (b) (c)

$

3,073


$

1,812


(a)

During the year ended December 31, 2022, Halliburton recorded $366 million of impairments and other charges, primarily due to management's decision to market for sale the net assets of Russia operations, which was sold in August of 2022, and impairment of the assets in Ukraine. During the year ended December 31, 2021, Halliburton closed the structured transaction for the North America real estate assets, which resulted in a $74 million gain. Halliburton also discontinued the proposed sale of the Pipeline and Process Services business leading to a depreciation catch-up related to these assets previously classified as held for sale. As a result, among these and other items, a $12 million pre-tax charge was recognized.

(b)

Management believes that operating income adjusted for impairments and other charges for the year ended December 31, 2022 and 2021, is useful to investors to assess and understand operating performance, especially when comparing those results with previous and subsequent periods or forecasting performance for future periods, primarily because management views the excluded items to be outside of the company's normal operating results. Management analyzes operating income without the impact of these items as an indicator of performance, to identify underlying trends in the business, and to establish operational goals. The adjustments remove the effect of these items. Adjusted operating income is calculated as: “As reported operating income” plus "Total impairments and other charges" for the respective periods.

(c)

We calculate operating margin by dividing reported operating income by reported revenue. We calculate adjusted operating margin by dividing adjusted operating income by reported revenue.


Contacts

For Investors:
David Coleman
Investor Relations
This email address is being protected from spambots. You need JavaScript enabled to view it.
281-871-2688

For News Media:
Emily Mir
External Affairs
This email address is being protected from spambots. You need JavaScript enabled to view it.
281-871-2601


Read full story here

DENVER--(BUSINESS WIRE)--Liberty Energy Inc. (NYSE: LBRT; “Liberty” or the “Company”) announced today that its Board of Directors (the “Board”) has increased its existing share repurchase authorization announced on July 25, 2022, to $500 million, a $250 million increase from the originally authorized amount.


Since the repurchase program commencement, Liberty has repurchased and retired 8,185,890 shares of Class A common stock, representing 4.4% of outstanding shares, for approximately $125 million. With this program expansion, the Company has approximately $375 million available for share repurchases through July 31, 2024.

The Board has also declared a dividend of $0.05 per share of Class A common stock, to be paid on March 20, 2023, to holders of record as of March 6, 2023.

“Today’s announcement reinforces our conviction in our ability to execute on our strategic priorities while delivering a leading return of capital strategy that is designed to result in substantial long-term value creation,” commented Chris Wright, Chief Executive Officer. “We are acutely focused on maximizing total return for Liberty shareholders with a balanced approach of investing in high return opportunities while returning capital to shareholders. Our upsized authorization reflects our belief that the expected future cash generation profile of our business is significant.”

The shares may be repurchased from time to time in open market transactions, through block trades, in privately negotiated transactions, through derivative transactions or by other means in accordance with federal securities laws. The timing, as well as the number and value of shares repurchased under the program, will be determined by the Company at its discretion and will depend on a variety of factors, including management’s assessment of the intrinsic value of the Company’s common stock, the market price of the Company’s common stock, general market and economic conditions, available liquidity, compliance with the Company’s debt and other agreements, applicable legal requirements, and other considerations. The exact number of shares to be repurchased by the Company is not guaranteed, and the program may be suspended, modified, or discontinued at any time without prior notice. The Company expects to fund the repurchases by using cash on hand, borrowings under its revolving credit facility and expected free cash flow to be generated through the authorization period.

Future declarations of quarterly cash dividends are subject to approval by the Board of Directors and to the Board’s continuing determination that the declarations of dividends are in the best interests of Liberty and its stockholders. Future dividends may be adjusted at the Board’s discretion based on market conditions and capital availability.

As a reminder, Liberty will release its financial results for the fourth quarter and full year ending December 31, 2022 after the market closes on Wednesday, January 25, 2023. Following the release, the Company will host a conference call to discuss the results at 8:00 a.m. Mountain Time (10:00 a.m. Eastern Time) on Thursday, January 26, 2023.

Individuals wishing to participate in the conference call should dial (833) 255-2827, or for international callers, (412) 902-6704. Participants should ask to join the Liberty Energy call. A live webcast will be available at http://investors.libertyfrac.com. The webcast can be accessed for 90 days following the call. A telephone replay will be available shortly after the call and can be accessed by dialing (877) 344-7529, or for international callers (412) 317-0088. The passcode for the replay is 3034644. The replay will be available until February 2, 2023.

About Liberty

Liberty is a leading North American energy services firm that offers one of the most innovative suites of completion services and technologies to onshore oil and natural gas exploration and production companies. Liberty was founded in 2011 with a relentless focus on developing and delivering next generation technology for the sustainable development of unconventional energy resources in partnership with our customers. Liberty is headquartered in Denver, Colorado. For more information about Liberty, please contact Investor Relations at This email address is being protected from spambots. You need JavaScript enabled to view it..

Forward-Looking and Cautionary Statements

The information above includes “forward-looking statements” within the meaning of Section 27A of the Securities Act of 1933, as amended, and Section 21E of the Securities Exchange Act of 1934, as amended. All statements, other than statements of historical facts included herein are forward-looking statements. These forward-looking statements are identified by their use of terms and phrases such as “may,” “expect,” “estimate,” “outlook,” “project,” “plan,” “position,” “believe,” “intend,” “achievable,” “anticipate,” “will,” “continue,” “potential,” “likely,” “should,” “could,” and similar terms and phrases. However, the absence of these words does not mean that the statements are not forward-looking. These forward-looking statements are subject to certain risks, uncertainties and assumptions identified above or as disclosed from time to time in Liberty's filings with the Securities and Exchange Commission. Any forward-looking statement speaks only as of the date on which it is made, and, except as required by law, we do not undertake any obligation to update or revise any forward-looking statement, whether as a result of new information, future events or otherwise. As a result of these factors, actual results may differ materially from those indicated or implied by such forward-looking statements.


Contacts

Michael Stock
Chief Financial Officer

Anjali Voria, CFA
Strategic Finance & Investor Relations Lead

303-515-2851
This email address is being protected from spambots. You need JavaScript enabled to view it.

BETHESDA, Md.--(BUSINESS WIRE)--Enviva Inc. (NYSE: EVA), the world’s leading producer of sustainably sourced wood biomass, announced today that Thomas Meth, President and Chief Executive Officer, and Shai Even, Executive Vice President and Chief Financial Officer, will participate in a webinar hosted by Raymond James analyst Pavel Molchanov.


  • Date: Friday, January 27, 2023
  • Time: 10:00 a.m. Eastern Time

To attend the webinar, please email This email address is being protected from spambots. You need JavaScript enabled to view it. to request a registration link or contact a Raymond James representative.

About Enviva

Enviva Inc. (NYSE: EVA) is the world’s largest producer of industrial wood pellets, a renewable and sustainable energy source produced by aggregating a natural resource, wood fiber, and processing it into a transportable form, wood pellets. Enviva owns and operates ten plants with a combined production capacity of approximately 6.2 million metric tons per year in Virginia, North Carolina, South Carolina, Georgia, Florida, and Mississippi, and is constructing its 11th plant in Epes, Alabama. Enviva is planning to commence construction of its 12th plant, near Bond, Mississippi, in 2023. Enviva sells most of its wood pellets through long-term, take-or-pay off-take contracts with primarily creditworthy customers in the United Kingdom, the European Union, and Japan, helping to accelerate the energy transition and to decarbonize hard-to-abate sectors like steel, cement, lime, chemicals, and aviation fuels. Enviva exports its wood pellets to global markets through its deep-water marine terminals at the Port of Chesapeake, Virginia, the Port of Wilmington, North Carolina, and the Port of Pascagoula, Mississippi, and from third-party deep-water marine terminals in Savannah, Georgia, Mobile, Alabama, and Panama City, Florida.

To learn more about Enviva, please visit our website at www.envivabiomass.com. Follow Enviva on social media @Enviva.


Contacts

INVESTOR CONTACT:
Kate Walsh
Vice President, Investor Relations
This email address is being protected from spambots. You need JavaScript enabled to view it.
+1 240-482-3856

Offshore Source Logo

Offshore Source keeps you updated with relevant information concerning the Offshore Energy Sector.

Any views or opinions represented on this website belong solely to the author and do not represent those of the people, institutions or organizations that Offshore Source or collaborators may or may not have been associated with in a professional or personal capacity, unless explicitly stated.

Corporate Offices

Technology Systems Corporation
8502 SW Kansas Ave
Stuart, FL 34997

info@tscpublishing.com