Business Wire News

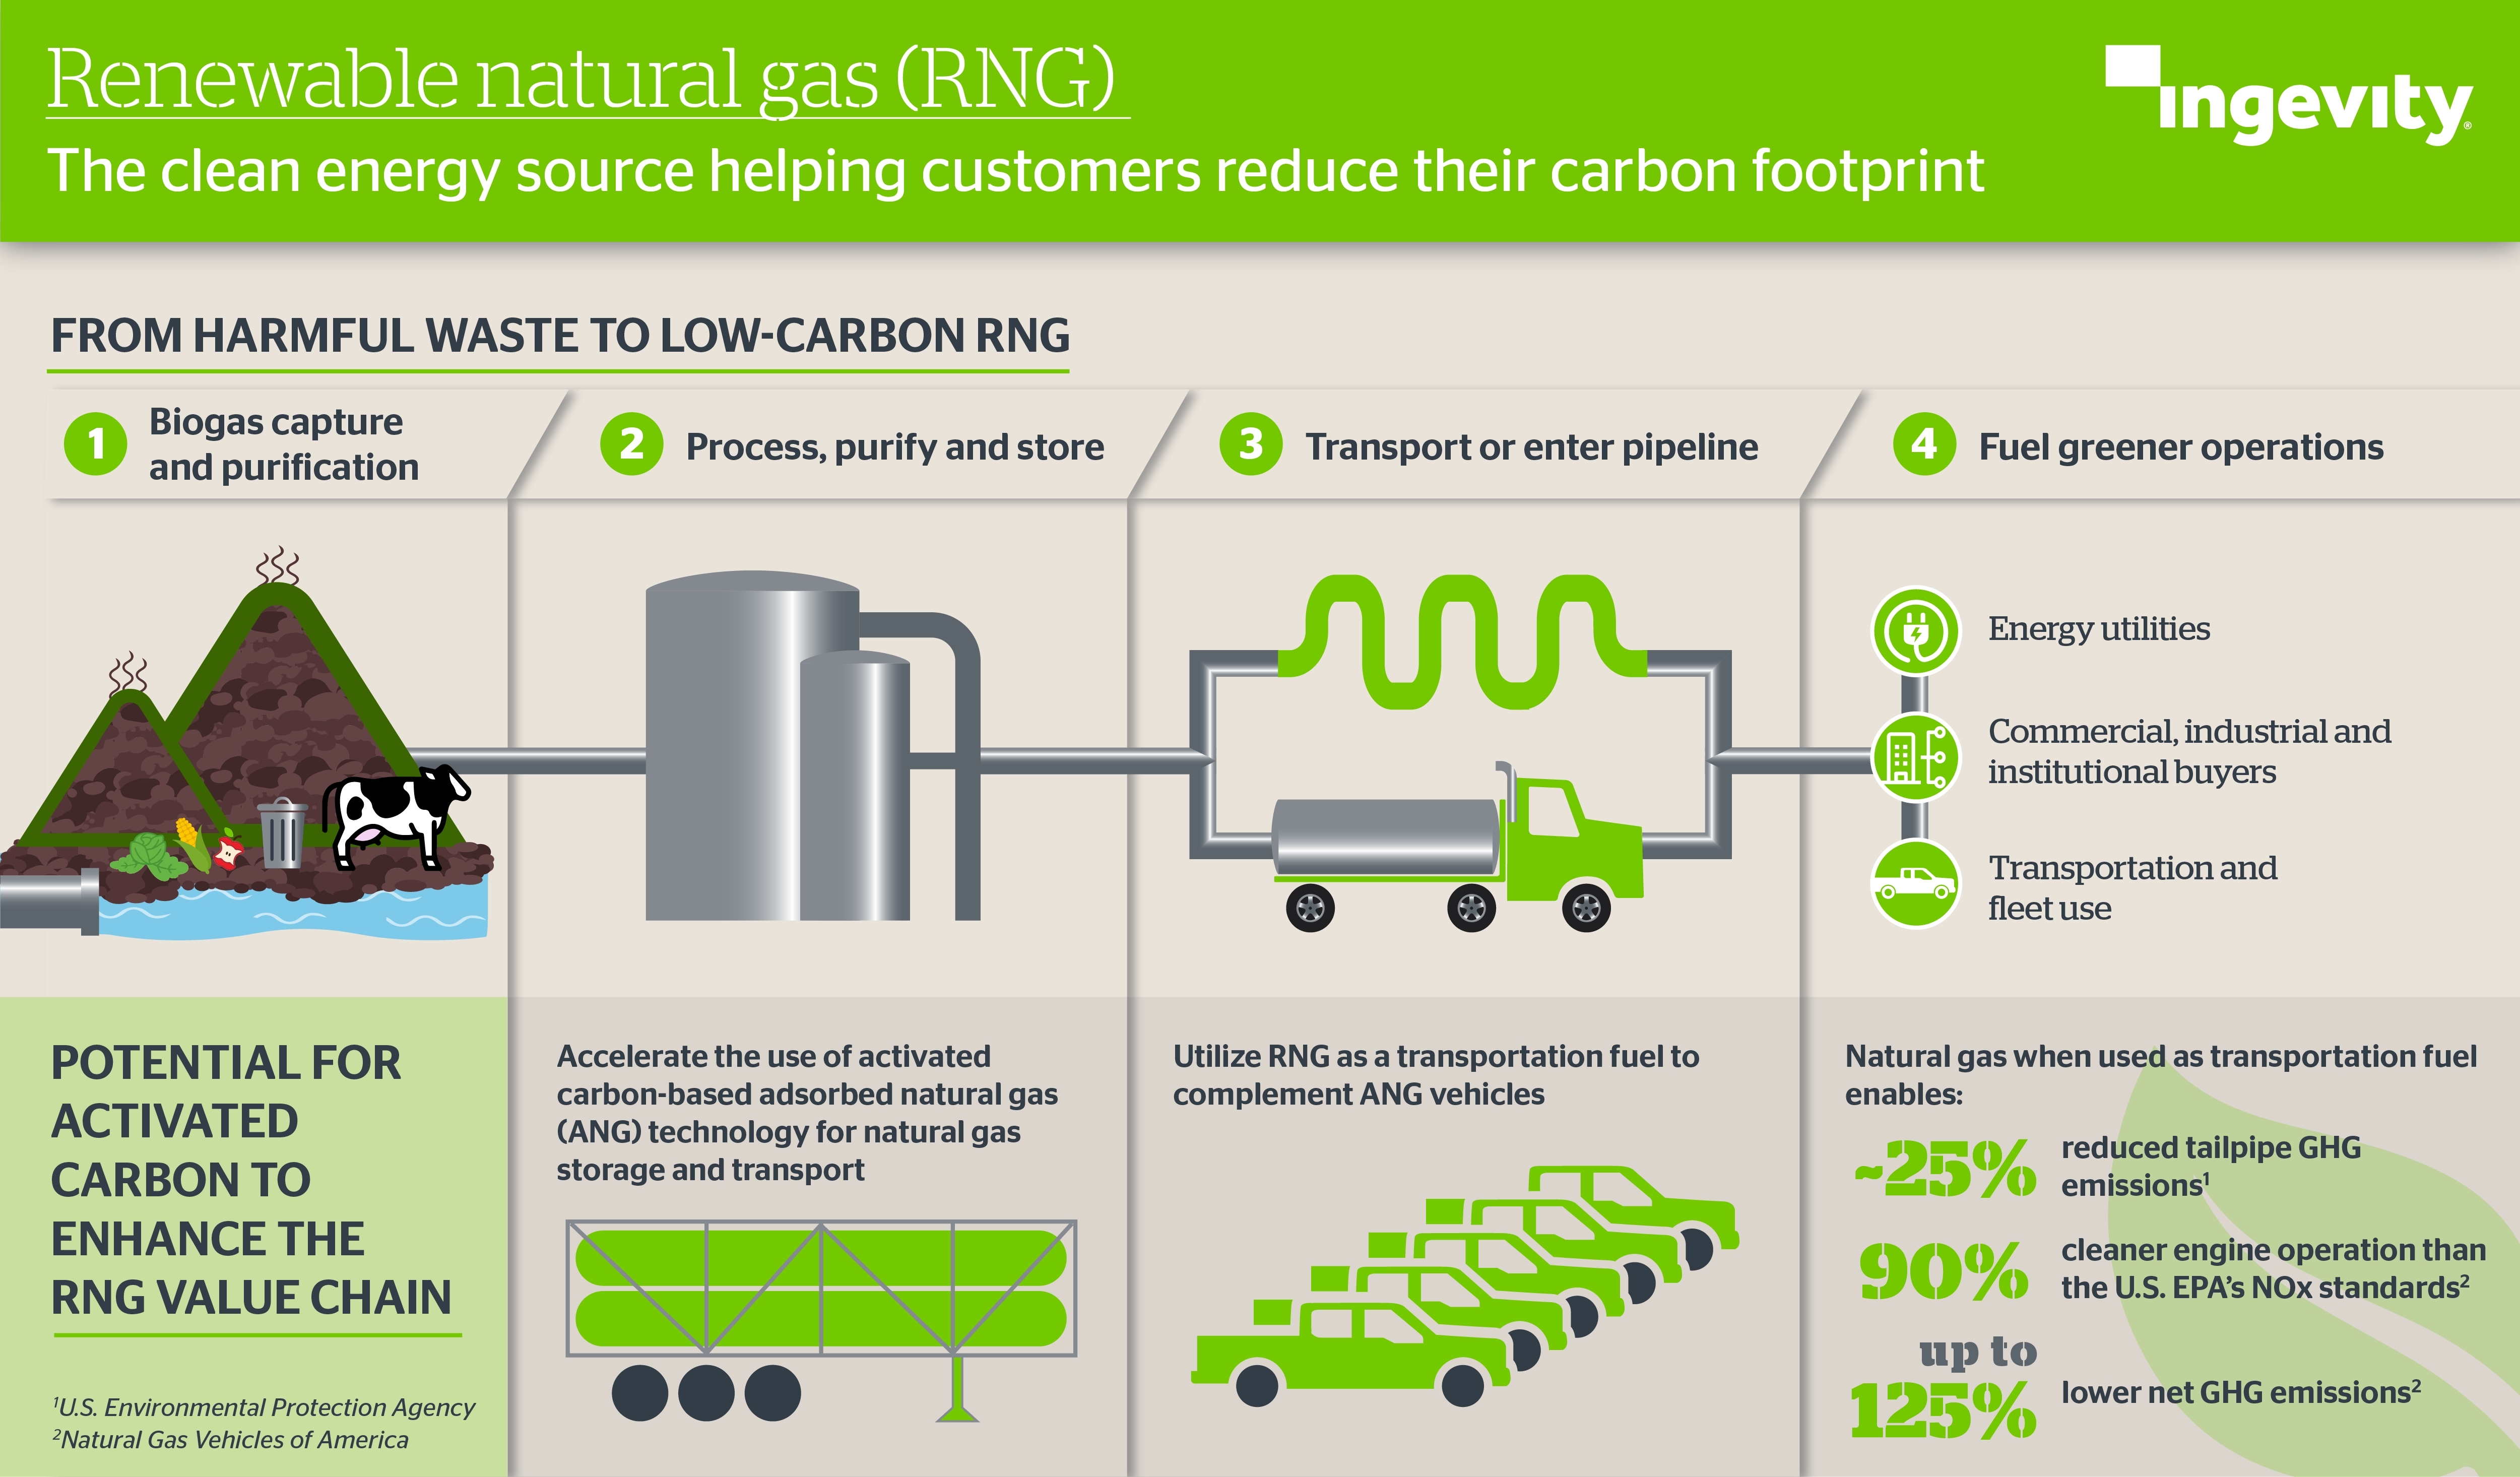
  • Strong financial performance in both Subsea and Surface Technologies
  • Cash flow from continuing operations $182 million, free cash flow $137 million
  • Subsea inbound orders more than doubled sequentially to $1.5 billion
  • New partnerships leverage subsea expertise for integrated wind, wave energy

LONDON & PARIS & HOUSTON--(BUSINESS WIRE)--Regulatory News:


TechnipFMC plc (NYSE: FTI) (Paris: FTI) today reported first quarter 2021 results.

Summary Financial Results from Continuing Operations

Reconciliation of U.S. GAAP to non-GAAP financial measures are provided in financial schedules.

Three Months Ended

(In millions, except per share amounts)

March 31,

2021

March 31,

2020

Change

Revenue

$1,632.0

$1,582.6

3.1%

Income (loss)

$430.3

$(3,234.8)

n/m

Diluted earnings (loss) per share

$0.95

$(7.23)

n/m


Adjusted EBITDA

$165.2

$79.7

107.3%

Adjusted EBITDA margin

10.1

%

5.0

%

510 bps

Adjusted income (loss)

$(14.5)

$(60.0)

n/m

Adjusted diluted earnings (loss) per share

$(0.03)

$(0.13)

n/m


Inbound orders

$1,722.1

$1,538.4

11.9%

Backlog

$7,221.4

$8,195.5

(11.9%)


Total Company revenue in the first quarter was $1,632 million. Income from continuing operations attributable to TechnipFMC plc was $430.3 million, or $0.95 per diluted share. These results included income from the Company’s equity investment in Technip Energies of $470.1 million primarily related to a favorable change in fair market value. After-tax charges and credits totaled $444.8 million of credit, or $0.99 per diluted share. Adjusted loss from continuing operations was $14.5 million, or $0.03 per diluted share (Exhibit 6).

Adjusted EBITDA, which excludes pre-tax charges and credits, was $165.2 million; adjusted EBITDA margin was 10.1 percent (Exhibit 7). Included in adjusted EBITDA was a foreign exchange gain of $28.1 million.

As previously announced, on February 16, 2021, the Company completed the partial spin-off of Technip Energies to its shareholders. Financial results for Technip Energies are reported as discontinued operations.

Doug Pferdehirt, Chairman and CEO of TechnipFMC, stated, “Our first quarter as a leading pure play, technology and services provider to both traditional and new energy industries was an exceptional start. Total Company adjusted EBITDA from continuing operations was $165 million, with free cash flow of $137 million. We delivered solid financial results in both Subsea and Surface Technologies, largely driven by strong operational execution. We also announced new strategic partnerships that will further progress the development of material opportunities for TechnipFMC in the energy transition.”

Pferdehirt added, “In Subsea, inbound orders more than doubled sequentially to $1.5 billion, with increased adoption of Subsea 2.0™ technologies. Integrated projects comprised nearly 40 percent of segment orders and included an award for Petronas’ first deepwater project, Limbayong, which will benefit from the seamless integration of both iEPCI™ and Subsea 2.0™. We also received a contract for manifolds for the Petrobras Marlim and Voador fields, which will utilize our all-electric robotic technology. Using digital automation and control, we can replace traditional subsea hydraulics, allowing for a more autonomous system that enables a significantly reduced carbon footprint.”

In Surface Technologies, our international revenue mix continued to expand and represented nearly 70 percent of the segment in the quarter, driven by strength in the Middle East, North Sea and Asia Pacific. These markets demand higher specification equipment, global services and local capabilities, which are areas where we continue to further differentiate our offering. We believe our unique capabilities will allow us to extend our leadership positions in these more resilient markets.”

Pferdehirt continued, “Client conversations remain constructive, suggesting a further increase in activity. We see potential for a global recovery that is more sustainable than previous cycles, giving us confidence in our 2021 Subsea outlook of more than $4 billion in inbound orders and for continued growth in 2022. We believe that integrated project awards have the potential to more than double versus the prior year, and the combination of direct project and service-related orders could represent 50 percent of total inbound for the current year.”

Pferdehirt added, “We announced two strategic partnerships focused on the generation of renewable energy. There is strong market momentum towards offshore wind, with governments increasingly focused on opening new areas for development. Our new partnership with Magnora is pursuing offshore wind development opportunities, and we are working separately with Bombora to convert both wind and wave energy into renewable power. It is estimated that nearly 80 percent of the world’s offshore wind resources will come from deepwater where we will benefit from our significant installed base, domain expertise and history of subsea innovation.”

Pferdehirt concluded, “Our first quarter results provide us with a very strong start to the year in support of our 2021 commitments. Looking ahead, we expect robust and sustained activity across our businesses, supported by improving market fundamentals and our competitive differentiation. Importantly, we continue to leverage our unique capabilities and technologies to strategically position TechnipFMC for the development of new energy sources, using the very same playbook that led to the successful transformation of our Subsea business.”

Operational and Financial Highlights

Subsea

Financial Highlights

Reconciliation of U.S. GAAP to non-GAAP financial measures are provided in financial schedules.

Three Months Ended

(In millions)

March 31,

2021

March 31,

2020

Change

Revenue

$1,386.5

$1,253.1

10.6%

Operating profit (loss)

$37.0

$(2,750.7)

n/m

Adjusted EBITDA

$135.1

$104.8

28.9%

Adjusted EBITDA margin

9.7%

8.4%

130 bps


Inbound orders

$1,518.8

$1,172.1

29.6%

Backlog1,2,3

$6,857.1

$7,773.5

(11.8%)


Estimated Consolidated Backlog Scheduling

(In millions)

March 31,

2021

2021

$2,954

2022

$2,534

2023 and beyond

$1,369

Total

$6,857

1 Backlog in the period was decreased by a foreign exchange impact of $131.3 million.

2 Backlog does not capture all revenue potential for Subsea Services.

3 Backlog does not include total Company non-consolidated backlog of $612 million.

Subsea reported first quarter revenue of $1,386.5 million, an increase of 10.6 percent from the prior year largely driven by higher project and services activity.

Subsea reported an operating profit of $37 million that included impairment, restructuring and other charges totaling $19.7 million. Operating results improved versus the prior-year quarter primarily due to the significant reduction in non-cash impairment charges as well as cost reduction initiatives and increased installation activity.

Adjusted EBITDA increased year-over-year due to cost reduction initiatives and increased installation activity; adjusted EBITDA margin improved 130 basis points to 9.7 percent.

Sequentially, Subsea revenue increased 3.6 percent, benefiting from strong project execution from backlog. The geographic mix of projects also mitigated the seasonal decline in services activity.

Operating results improved sequentially driven by increased manufacturing productivity which more than offset the impact of the services activity decline.

Subsea inbound orders were $1,518.8 million for the quarter, resulting in a book-to-bill of 1.1. The following awards were included in the period:

  • North El Amriya and North Idku iEPCI™ Project (Egypt)
    Significant* integrated engineering, procurement, construction and installation (iEPCI™) contract from NIpetco and PetroAmriya, two Joint Ventures between Energean and Egyptian Natural Gas Holding Company (EGAS) and Egyptian General Petroleum Corporation (EGPC) for a subsea tieback located offshore Egypt on the North El Amriya and North Idku concession. TechnipFMC will design, manufacture, deliver and install subsea equipment including the subsea production system, subsea trees, production manifolds, umbilicals, flexible pipelines, jumpers and associated subsea and topside controls.
    *A “significant” award ranges between $75 million and $250 million.
  • PETRONAS Carigali Limbayong Deepwater Development Project (Malaysia)
    Substantial* contract for front-end engineering design, and integrated engineering, procurement, construction, installation and commissioning of subsea production system, umbilicals, risers and flowlines (iEPCI™) by PETRONAS Carigali, a subsidiary of PETRONAS, for the Limbayong Deepwater Development Project. This contract covers the development of 10 deepwater wells and their tieback to the Limbayong Floating Production Storage and Offloading (FPSO) unit in Malaysia. TechnipFMC will design, manufacture, deliver and install subsea equipment including subsea trees, manifolds, umbilicals, flexible riser, flowlines, jumpers and other associated subsea hardware for the project. The iEPCI™ contract combines our integrated subsea solution with our Subsea 2.0™ products, demonstrating the added value of our unique and complete integrated offering.
    *A “substantial” award ranges between $250 million and $500 million.
  • Energean Karish North Development iEPCI™ Project (Israel)
    Letter of Award (LOA) from Energean Israel Limited for the development of the Karish North field, located offshore Israel. TechnipFMC will design, manufacture, deliver and install subsea equipment including the subsea production system, rigid flowlines and umbilicals as a tieback to the ‘Energean Power’ FPSO as well as the second gas export riser.
  • Petrobras Marlim and Voador Project (Brazil)
    Significant* contract from Petrobras for the Marlim and Voador fields offshore Brazil. TechnipFMC will supply up to eight manifolds for production and injection, utilizing the all-electric Robotic Valve Controller (RVC). The contract also includes associated tools, spares and services. The RVC is a unique robotic technology that replaces traditional subsea hydraulics, as well as thousands of mechanical parts, while providing real-time data and analysis on system performance. This results in a manifold that is smaller, less complex and less costly with a significantly reduced carbon footprint.
    *A “significant” award ranges between $75 million and $250 million.
  • Santos Barossa Project (Australia)
    Significant* Notice to Proceed for a subsea production system contract from Santos Ltd. for the Barossa project, located 300 kilometers north of Darwin, Australia. The contract scope covers the supply of subsea trees and associated control systems, manifolds and wellheads, as well as installation and commissioning support, which will help to extend the life of the existing Darwin LNG facility.
    *A “significant” award ranges between $75 million and $250 million.

Partnership and Alliance Highlights

  • TechnipFMC and Magnora to Develop Floating Offshore Wind Projects
    Formed a partnership with Magnora ASA (Magnora) to jointly pursue floating offshore wind project development opportunities under the name Magnora Offshore Wind. Magnora holds a strategic position within the renewable energy sector as an owner in offshore wind, onshore wind, and solar development projects. When combined with TechnipFMC’s unique technologies, experience delivering integrated EPCI (iEPCI™) projects and its novel Deep Purple™ initiative to integrate wind and wave energy with offshore green hydrogen, this partnership will enable Magnora Offshore Wind to realize significant opportunities in the growing offshore floating wind market.
  • TechnipFMC and Bombora to Develop Floating Wave, Wind Power Project
    Formed a strategic partnership with Bombora to develop a floating wave and wind power project in support of a more sustainable future. The relationship brings together TechnipFMC’s unique technologies and experience delivering complex integrated engineering, procurement, construction and installation (iEPCI™) projects offshore with Bombora’s patented multi-megawatt mWave™ technology that converts wave energy into electricity. The partnership will initially focus on TechnipFMC and Bombora’s InSPIRE project. With engineering work initiated in November 2020, the partnership is developing a hybrid system utilizing Bombora’s mWave™ technology.

Surface Technologies

Financial Highlights

Reconciliation of U.S. GAAP to non-GAAP financial measures are provided in financial schedules.

Three Months Ended

(In millions)

March 31,

2021

March 31,

2020

Change

Revenue

$245.5

$329.5

(25.5%)

Operating profit (loss)

$8.2

$(424.0)

n/m

Adjusted EBITDA

$26.9

$24.5

9.8%

Adjusted EBITDA margin

11.0%

7.4%

360 bps


Inbound orders

$203.3

$366.3

(44.5%)

Backlog

$364.3

$422.0

(13.7%)


Surface Technologies reported first quarter revenue of $245.5 million, a decrease of 25.5 percent from the prior-year quarter. The decline was primarily driven by the sharp reduction in operator activity in North America while international revenue was resilient, declining low-single digits.

Surface Technologies reported operating profit of $8.2 million that included restructuring, impairment and other charges totaling $2.8 million. Operating results improved versus the prior-year quarter primarily due to the significant reduction in non-cash impairment charges as well as improved operational performance, benefits from prior-year cost reduction initiatives and ongoing cost control measures.

Adjusted EBITDA increased year-over-year due to improved operational performance, benefits from prior-year cost reduction initiatives and ongoing cost control measures; adjusted EBITDA margin improved 360 basis points to 11 percent.

Sequentially, revenue decreased 6.4 percent largely due to seasonal declines in customer activity and timing of backlog conversion in international markets. International markets accounted for nearly 70 percent of total segment revenue in the quarter. Revenue in North America declined due in part to the Company’s exit from certain underperforming markets, partially offset by growth in the U.S. which benefited from further adoption of the iComplete™ ecosystem.

Operating profit decreased sequentially primarily due to lower volumes, partially offset by continued improvement in operational performance and a lower cost structure.

Inbound orders for the quarter were $203.3 million, a decrease of 44.5 percent versus the prior-year quarter primarily due to a shift in timing of international orders to future periods. Backlog ended the period at $364.3 million. Given the short-cycle nature of the business, orders are generally converted into revenue within twelve months.

Corporate and Other Items

Corporate expense in the quarter was $28.8 million. Excluding charges and credits totaling $3 million of expense, corporate expense was $25.8 million.

Foreign exchange gain in the quarter was $28.1 million.

The Company recognized income of $470.1 million from its equity ownership in Technip Energies. The income was related to the change in fair market value of the investment, which reflected the difference between the book value at the time of separation and the market value at the end of the period, as well as the discount associated with shares sold during the quarter.

Net interest expense was $34.5 million in the quarter. The Company also recorded a loss on the early extinguishment of debt of $23.5 million.

The Company recorded a tax provision in the quarter of $24.5 million.

Total depreciation and amortization for the quarter was $95.2 million.

Cash flow from continuing operations in the quarter was $181.5 million.

Capital expenditures in the quarter were $44.2 million.

Free cash flow from continuing operations was $137.3 million in the quarter (Exhibit 9).

The Company ended the period with cash and cash equivalents of $752.8 million; net debt was $1,778.3 million.

During the quarter, the Company completed the transaction contemplated by the Share Purchase Agreement with Bpifrance Participations SA (“Bpifrance”) where Bpifrance purchased $100 million in Technip Energies shares from the Company’s retained stake in Technip Energies. At the end of the period, the Company held 82.3 million ordinary shares of Technip Energies.

Bpifrance had previously provided funding of $200 million for the purchase of Technip Energies’ shares from TechnipFMC. As a result of the revised level of investment, the Company refunded $100 million to Bpifrance in the second quarter.

Also in the second quarter, the Company announced the sale of 26.8 million shares from its retained stake in Technip Energies for proceeds of approximately $360 million. The sale further reduced the Company’s ownership stake to 55.5 million shares, or approximately 31 percent of Technip Energies’ outstanding shares.

Discontinued operations

During the quarter, the Company completed the partial spin-off of Technip Energies. Financial results for Technip Energies are reported as discontinued operations.

For the three months ended March 31, 2021, the results of discontinued operations on the Consolidated Statement of Income include the historical results of Technip Energies prior to its spin-off on February 16, 2021 as well as all separation-related costs incurred for the transaction. The Company has accounted for its investment in Technip Energies using the fair value method with changes in the fair value recorded in its Consolidated Statement of Income.

On February 16, 2021, all assets and liabilities of Technip Energies were spun-off. There were no assets or liabilities classified as discontinued operations on the Condensed Consolidated Balance Sheet at the end of the period. The Company’s investment in Technip Energies is reflected in current assets at market value as of March 31, 2021.

2021 Full-Year Financial Guidance1

The Company’s full-year guidance for 2021 can be found in the table below.

Guidance is based on continuing operations and thus excludes the impact of Technip Energies, which is reported as discontinued operations.

Updates to the Company’s full-year guidance for 2021 are as follows:

  • Tax provision, as reported, of $70 - 80 million; decreased from the previous guidance of $110 - 120 million.
  • Free cash flow of $120 - 220 million; increased from the previous guidance of $50 - 150 million.

The guidance updates reflect a change to separation-related tax items and costs, previously estimated to be $40 million and $30 million, respectively. The actual separation-related expenses incurred were in-line with previous expectations and were reported as part of discontinued operations in the first quarter.

All segment guidance assumes no further material degradation from COVID-19-related impacts.

2021 Guidance *Updated April 27, 2021


Subsea


Surface Technologies

Revenue in a range of $5.0 - 5.4 billion


Revenue in a range of $1,050 - 1,250 million


EBITDA margin in a range of 10 - 11% (excluding charges and credits)


EBITDA margin in a range of 8 - 11% (excluding charges and credits)


TechnipFMC

Corporate expense, net $105 -115 million

(includes depreciation and amortization of ~$15 million)


Net interest expense $130 - 135 million


Tax provision, as reported* $70 - 80 million


Capital expenditures approximately $250 million


Free cash flow* $120 - 220 million


1 Our guidance measures adjusted EBITDA margin, corporate expense, net, net interest expense and free cash flow are non-GAAP financial measures. We are unable to provide a reconciliation to comparable GAAP financial measures on a forward-looking basis without unreasonable effort because of the unpredictability of the individual components of the most directly comparable GAAP financial measure and the variability of items excluded from each such measure. Such information may have a significant, and potentially unpredictable, impact on our future financial results.

Teleconference

The Company will host a teleconference on Wednesday, April 28, 2021 to discuss the first quarter 2021 financial results. The call will begin at 1 p.m. London time (8 a.m. New York time). Dial-in information and an accompanying presentation can be found at www.TechnipFMC.com.

Webcast access will also be available on our website prior to the start of the call. An archived audio replay will be available after the event at the same website address. In the event of a disruption of service or technical difficulty during the call, information will be posted on our website.

###

About TechnipFMC

TechnipFMC is a leading technology provider to the traditional and new energy industries; delivering fully integrated projects, products, and services.

With our proprietary technologies and comprehensive solutions, we are transforming our clients’ project economics, helping them unlock new possibilities to develop energy resources while reducing carbon intensity and supporting their energy transition ambitions.

Organized in two business segments — Subsea and Surface Technologies — we will continue to advance the industry with our pioneering integrated ecosystems (such as iEPCI™, iFEED™ and iComplete™), technology leadership and digital innovation.

Each of our approximately 20,000 employees is driven by a commitment to our clients’ success, and a culture of strong execution, purposeful innovation, and challenging industry conventions.

TechnipFMC uses its website as a channel of distribution of material company information. To learn more about how we are driving change in the industry, go to www.TechnipFMC.com and follow us on Twitter @TechnipFMC.

This communication contains “forward-looking statements” as defined in Section 27A of the United States Securities Act of 1933, as amended, and Section 21E of the United States Securities Exchange Act of 1934, as amended. Words such as “guidance,” “confident,” “believe,” “expect,” “anticipate,” “plan,” “intend,” “foresee,” “should,” “would,” “could,” “may,” “will,” “likely,” “predicated,” “estimate,” “outlook” and similar expressions are intended to identify forward-looking statements, which are generally not historical in nature. Such forward-looking statements involve significant risks, uncertainties and assumptions that could cause actual results to differ materially from our historical experience and our present expectations or projections, including the following known material factors:

Risks related to Our Business and Industry

  • demand for our products and services, which depends on oil and gas industry activity and expenditure levels that are directly affected by trends in demand for and price of crude oil and natural gas;
  • unanticipated changes relating to competitive factors in our industry, including ongoing industry consolidation;
  • our ability to develop, implement, and protect new technologies and services, as well as our ability to protect and maintain critical intellectual property assets;
  • the cumulative loss of major contracts, customers, or alliances;
  • risks associated with the COVID-19 pandemic, the United Kingdom’s withdrawal from the European Union, disruptions in the political, regulatory, economic, and social conditions of the countries in which we conduct business;
  • risks associated with The Depository Trust Company and Euroclear for clearance services for shares traded on the New York Stock Exchange (the “NYSE”) and the Eu

Contacts

Investor relations
Matt Seinsheimer
Vice President Investor Relations
Tel: +1 281 260 3665
Email: This email address is being protected from spambots. You need JavaScript enabled to view it.

James Davis
Senior Manager Investor Relations
Tel: +1 281 260 3665
Email: This email address is being protected from spambots. You need JavaScript enabled to view it.

Media relations
Nicola Cameron
Vice President Communications
Tel: +44 383 742 297
Email: This email address is being protected from spambots. You need JavaScript enabled to view it.

Brooke Robertson
Public Relations Director
Tel: +1 281 591 4108
Email: This email address is being protected from spambots. You need JavaScript enabled to view it.


Read full story here

DUBLIN--(BUSINESS WIRE)--The "Shale Gas Market - Growth, Trends, COVID-19 Impact, and Forecasts (2021 - 2026)" report has been added to ResearchAndMarkets.com's offering.


The shale gas market is expected to grow at a CAGR of more than 9.0% over the period of 2021-2026.

he COVID-19 has brought the largest change in the industry since the beginning of the shale boom, in 2007. The pandemic is expected to impede the growth of the market with most of the risky assets being restructured and many companies either leaving or soon to leave the basins till the price point becomes profitable.

Factors such as an increase in consumption of oil and rising growth in the oil-dependent industries are expected to drive the market. However, volatility in the oil market with prices going below the Shale Gas production cost may act as a restraint to the market.

Increasing environmental concerns during the production of shale gas are expected to restrain the market studied.

New development in the Shale Gas production technology, like the advancements in horizontal drilling technology, is expected to make the Shale Gas reservoirs more viable and may provide an opportunity for market players.

North America is expected to be the largest market in the forecast period owing to its large-scale production of Shale Gas in the region. The United States is expected to lead the Shale Gas production in the region.

Key Market Trends

Increasing Environmental Concerns to Restrain the Market

  • Despite the economic benefits, environmental risks associated with hydraulic fracturing are restraining the shale gas market.
  • Methane gas emissions during the drilling process pose potential air pollution risks. Additionally, incorrect disposal of large volumes of chemically treated water used in hydraulic fracturing operations can potentially cause severe surface water contamination. This has attracted criticism from environment protection bodies and NGOs, around the world. Local farmers and residents have also repeatedly opposed hydraulic fracturing, owing to its impact on health and farming.
  • Additionally, a typical fracking well requires approximately 2-10 million gallons of water during fracking operations, which puts additional strain on the water supply, particularly in the drought-prone regions.
  • In West Texas, where the Permian Basin (which is expected to drive the growth of shale gas activities in the United States ) is located, shale gas companies already faced opposition and criticism from the farmers, owing to the water shortage due to hydraulic fracturing.
  • The United States Geological Survey (USGS) blamed shale gas activities for the increase in earthquakes in the recent times, in certain parts of the Central and Eastern United States that are well-known for the extraction of oil and gas.
  • Thus, the increasing environmental concerns are expected to restrain the market during the forecast period.

Competitive Landscape

The shale gas market is moderately fragmented due to many companies operating in the industry. The key players in this market include Chesapeake Energy Corporation, Royal Dutch Shell PLC, Exxon Mobil Corporation, PetroChina Company Limited, and ConocoPhillips, among others.

Key Topics Covered:

1 INTRODUCTION

1.1 Scope of the Study

1.2 Market Definition

1.3 Study Assumptions

2 RESEARCH METHODOLOGY

3 EXECUTIVE SUMMARY

4 MARKET OVERVIEW

4.1 Introduction

4.2 Shale Gas Production and Forecast in billion cubic meter (BCM), until 2026

4.3 Recent Trends and Developments

4.4 Government Policies and Regulations

4.5 Market Dynamics

4.6 Supply Chain Analysis

4.7 Porter's Five Forces Analysis

5 MARKET SEGMENTATION

5.1 Geography

6 COMPETITIVE LANDSCAPE

6.1 Mergers and Acquisitions, Joint Ventures, Collaborations, and Agreements

6.2 Strategies Adopted by Leading Players

6.3 Company Profiles

6.3.1 Antero Resources Corp

6.3.2 Southwestern Energy Company

6.3.3 EQT Corporation

6.3.4 Equinor ASA

6.3.5 Repsol SA

6.3.6 SINOPEC/Shs

6.3.7 Chesapeake Energy Corporation

6.3.8 Royal Dutch Shell plc

6.3.9 Exxon Mobil Corporation

6.3.10 Chevron Corporation

6.3.11 PETROCHINA/Shs

6.3.12 ConocoPhillips

6.3.13 Pioneer Natural Resources

7 MARKET OPPORTUNITIES AND FUTURE TRENDS

For more information about this report visit https://www.researchandmarkets.com/r/dq7gqx


Contacts

ResearchAndMarkets.com
Laura Wood, Senior Press Manager
This email address is being protected from spambots. You need JavaScript enabled to view it.

For E.S.T Office Hours Call 1-917-300-0470
For U.S./CAN Toll Free Call 1-800-526-8630
For GMT Office Hours Call +353-1-416-8900

SAN JOSE, Calif.--(BUSINESS WIRE)--Bloom Energy, a leading provider of distributed energy solutions, today announced the appointment of Adam Bacon to its international leadership team to strengthen the company’s expansion efforts, enhance competitive positioning and support deployment of its fuel-flexible, clean energy technology in Australia.


An experienced executive, with extensive background in growing successful businesses and multi-disciplinary teams in industrial sectors, Mr. Bacon has held a number of leadership positions in the energy and transportation industries including General Electric, UGL Rail and Australian Industrial Energy.

Mr. Bacon will report to Bloom Energy’s executive vice president, international business, Azeez Mohammed.

We are thrilled to welcome Adam to Bloom,” said Azeez Mohammed. “He brings vast experience as well as valuable perspectives and relationships that will help Australian organizations reduce carbon emissions, enhance resiliency and chart a path toward a net-zero carbon future.”

Bloom Energy’s technology is the most advanced thermal electric generation technology on the market today. Bloom Energy’s fuel-flexible, non-combustion fuel cells use biogas and hydrogen, in addition to natural gas, to create electricity at significantly higher efficiencies than traditional, combustion-based resources. In addition, Bloom Energy’s technology can be used to create hydrogen, which is increasingly recognized as a critically important tool necessary for the full decarbonization of the energy economy.

About Bloom Energy

Bloom Energy’s mission is to make clean, reliable energy affordable for everyone in the world. The company’s product, the Bloom Energy Server, delivers highly reliable and resilient, always-on electric power that is clean, cost-effective, and ideal for microgrid applications. Bloom’s customers include many Fortune 100 companies and leaders in manufacturing, data centers, healthcare, retail, higher education, utilities, and other industries. For more information, visit www.bloomenergy.com.

Cautionary Note Regarding Forward-Looking Statements

This press release contains forward-looking statements within the meaning of the U.S. federal securities laws that involve risks and uncertainties. These statements should not be taken as guarantees of results and should not be considered an indication of future activity or future performance. Actual events or results may differ materially from those described in this press release due to a number of risks and uncertainties as detailed in Bloom’s periodic SEC filings. Bloom undertakes no obligation to revise or publicly update any forward-looking statements unless if and as required by law.


Contacts

Media:
Jennifer Duffourg
Bloom Energy
This email address is being protected from spambots. You need JavaScript enabled to view it.

DUBLIN--(BUSINESS WIRE)--The "Norway Oil and Gas Upstream Market - Growth, Trends, COVID-19 Impact, and Forecasts (2021 - 2026)" report has been added to ResearchAndMarkets.com's offering.


The Norway oil and gas upstream market is expected to register a CAGR of more than 1% during the forecast period.

The strain on oil demand and prices from the impact of the COVID-19 pandemic has led oil companies to lower exploration budgets and delay a number of exploration wells in 2020. The major factor driving the market is the increasing development of new oilfields in the country over the forecast period. However, the divestment of government funds from the upstream oil and gas sector can act as a restraining factor for the market growth.

The development of new oilfields is likely to drive the market over the forecast period. The discovery of new small oilfields is likely to provide an opportunity for the upstream oil and gas companies operating in Norway in the near future. The availability of oil reserves and increasing investment in the upstream sector are likely to drive the market over the forecast period.

Competitive Landscape

The Norwegian oil and gas upstream market is partially consolidated. Some of the major companies operating in this market include:

  • Equinor ASA
  • Aker BP ASA
  • Total SA
  • ConocoPhillips
  • Royal Dutch Shell PLC
  • Var Energi AS

Key Market Trends

Development of New Oilfields to Drive the Market

  • Norway is one of the largest oil producers and exporters in the European region. In 2019, the country's crude oil production was 1437 thousand barrels per day, which accounted for about 47.9% of Europe's total crude oil production. The average offshore rig count was 16 in 2020.
  • The major oilfields in the country are reaching their maturity, and, as a result, since 2016, the oil production of Norway has declined significantly. However, in January 2021, about 30 companies have received offers of ownership interests in a total of 61 production licenses (34 are in the North Sea, 24 are in the Norwegian Sea and 3 are in the Barents Sea) on the Norwegian Shelf in the Awards in Predefined Areas (APA) 2020. Hence, with the award of 61 new production licenses, the upstream segment is likely to make more profitable discoveries on the Norwegian shelf during the forecast period.
  • Moreover, Johan Sverdrup oilfield, the third-largest oil field on the Norwegian continental shelf, operated by Equinor, announced its plan to increase its daily production capacity up to 535,000 barrels of oil by mid-2021. Also with expected resources of 2.7 billion barrels of oil, the field is one of the most important industrial projects in Norway for the next 50 years. Phase 1 of the field was opened in October 2019, and phase 2 is scheduled to begin production in the Q4 of 2022.
  • Some of the major fields that are expected to come on stream during the forecast period are the Johan Sverdrup oilfield, Martin Linge, and Johan Castberg. Therefore, with new upcoming discoveries of oil fields and expansion of existing oil fields are likely to reverse the trend and register significant growth in the market over the forecast period.

Availability of Oil Reserves to Drive the Market

  • Norway holds the largest share in terms of total oil reserves among the European countries. According to the Norwegian Petroleum Directorate, there are around 8 billion standard cubic meters of oil equivalent (Sm3 o.e.) of resources (oil and gas) remaining on the Norwegian continental shelf (NCS), of which 52% (4.2 billion Sm3 o.e.) of resources are proven, as of February 2021. The production on the Norwegian shelf in 2020 was 229 million Sm3 o.e.
  • Around 43% of the remaining resources are concentrated in the North Sea. The distribution of the rest indicates that 38% are in the Barents Sea and 19% are in the Norwegian Sea. In the Barents Sea, large parts of the remaining planned resources are not confirmed. At the end of 2020, there were 67 producing fields in the North Sea, 20 producing fields in the Norwegian Sea, and two producing fields in the Barents Sea.
  • As of December 2020, the estimated total unproven resources were 665 million Sm3 o.e., 665 million Sm3 o.e., 2,505 million Sm3 o.e. in the North Sea, Norwegian Sea, and the Barents Sea respectively. Hence, with the plenty of proven and unproven resources in the country, the oil & gas upstream sector is likely to witness significant growth over the forecast period.

For more information about this report visit https://www.researchandmarkets.com/r/ii8mfi


Contacts

ResearchAndMarkets.com
Laura Wood, Senior Press Manager
This email address is being protected from spambots. You need JavaScript enabled to view it.
For E.S.T Office Hours Call 1-917-300-0470
For U.S./CAN Toll Free Call 1-800-526-8630
For GMT Office Hours Call +353-1-416-8900

NORTH CHARLESTON, S.C.--(BUSINESS WIRE)--Ingevity Corporation (NYSE:NGVT) has announced a strategic partnership with and investment in GreenGasUSA Holdings, LLC (GreenGas), an integrated renewable natural gas (RNG) solutions provider helping customers reduce their environmental impact. Charleston, South Carolina-based GreenGas contracts with agricultural farms, landfills and industrial and municipal wastewater treatment facilities to collect and treat biogas from the organic waste of their operations that it then sells as pipeline-quality, low-carbon RNG. GreenGas also provides compression, transportation and delivery of natural gas directly to customers through its wholly owned pipeline injection point or as part of its virtual pipeline services. With this investment, Ingevity now holds a less than 50% ownership in GreenGas.


Initially, Ingevity’s funding will enable GreenGas to further develop biogas capture and cleanup systems at facilities where harmful methane-producing organic waste can be converted to RNG instead of being flared off or escaping into the atmosphere. GreenGas founder Marc Fetten will continue as GreenGas CEO, overseeing growth strategy and business development efforts.

Ingevity will now play an active role in exploring and accelerating the application of its activated carbon-based, low-pressure adsorbed natural gas (ANG) technology for the storage and transport of natural gas as part of the GreenGas model. The collaboration will also be integral in facilitating RNG use within Ingevity’s ANG vehicle platform by offering fleet customers broader access to the benefits of RNG as a transportation fuel, which Natural Gas Vehicles of America notes reduces greenhouse gas (GHG) emissions by up to 125%. Looking to the future, Ingevity is uniquely positioned to leverage its expertise as an operating and technology partner for GreenGas, while the investment also helps Ingevity gain a foothold in the rapidly expanding RNG industry.

Our partnership with GreenGas is yet another step forward as we advance ‘Ingevity 2.0’ and explore value-added applications for our activated carbon in growing markets like RNG,” said John Fortson, president and CEO at Ingevity. “We are excited to work with Marc and his team to understand where our technology and expertise can help broaden the reach of RNG as an environmentally and economically viable energy solution and enhance the innovative offerings of GreenGas.”

Ingevity stood out as the perfect strategic partner as we continue to provide customers with a growing variety of decarbonization and waste-to-value solutions,” said Marc Fetten, GreenGas founder. “Ingevity’s strong commitment to executing strategies that create measurable environmental impacts will serve as a strong foundation for our partnership. The company’s proven track record as a collaborative partner with operational experience in leveraging its activated carbon technology to drive the commercialization of its market-leading ANG platform will help to accelerate our mission to reduce GHG emissions. We look forward to continuing to scale our product and service offerings with Ingevity.”

About GreenGasUSA Holdings, LLC:

Formed in 2019 by Marc Fetten, GreenGas provides low- and zero-emitting energy solutions to industrial, commercial and residential users committed to reducing their environmental footprint. This includes supplying compressed natural gas (CNG) as an alternative to higher-cost and higher-emitting fuels such as oil or propane; operation of a virtual pipeline fleet for CNG and RNG across the U.S.; production of RNG from a variety of waste sources; as well as pipeline injection services. GreenGas currently owns a natural gas injection point in Georgetown, South Carolina that serves as a primary renewable energy aggregation hub enabling farmers to participate in the renewable gas industry and providing income to an important sector in the U.S. economy.

Ingevity: Purify, Protect and Enhance

Ingevity provides products and technologies that purify, protect, and enhance the world around us. Through a team of talented and experienced people, we develop, manufacture and bring to market solutions that help customers solve complex problems and make the world more sustainable. We operate in two reporting segments: Performance Chemicals, which includes specialty chemicals and engineered polymers; and Performance Materials, which includes high-performance activated carbon. These products are used in a variety of demanding applications, including asphalt paving, oil exploration and production, agrochemicals, adhesives, lubricants, publication inks, coatings, elastomers, bioplastics and automotive components that reduce gasoline vapor emissions. Headquartered in North Charleston, South Carolina, Ingevity operates from 25 locations around the world and employs approximately 1,750 people. The company is traded on the New York Stock Exchange (NYSE: NGVT). For more information visit www.ingevity.com.

Cautionary Statements About Forward-Looking Statements

This press release contains “forward-looking statements” within the meaning of the Securities Exchange Act of 1934, as amended, and the Private Securities Litigation Reform Act of 1995. Such statements generally include the words “will,” “plans,” “intends,” “targets,” “expects,” “outlook,” or similar expressions. Forward-looking statements may include, without limitation, the potential benefits of the GreenGas investment, expected financial positions, results of operations and cash flows; financing plans; business strategies and expectations; operating plans; and the impact of COVID-19. Actual results could differ materially from the views expressed. Factors that could cause actual results to materially differ from those contained in the forward-looking statements, or that could cause other forward-looking statements to prove incorrect, include, without limitation, risks that the expected benefits from the GreenGas investment will not be realized or will not be realized within the expected time period, adverse effects from the COVID-19 pandemic; adverse effects of general economic and financial conditions; risks related to international sales and operations; and the other factors detailed from time to time in the reports we file with the SEC, including those described under "Risk Factors" in our Annual Report on Form 10-K and other periodic filings. These forward-looking statements speak only as of the date of this press release. Ingevity assumes no obligation to provide any revisions to, or update, any projections and forward-looking statements contained in this press release.


Contacts

Amy Chiconas
843-746-8197
This email address is being protected from spambots. You need JavaScript enabled to view it.

Investors:
Bill Hamilton
843-740-2138
This email address is being protected from spambots. You need JavaScript enabled to view it.

SANTA MONICA, Calif.--(BUSINESS WIRE)--#BatteryShowEU--The Battery Show & EV Tech Europe Digital Days, a three-day digital event, strategically scheduled for 18-20 May to connect and educate industry professionals during a time of immense disruption via technical sessions, panels, networking opportunities, and digital sourcing, today announced the second raft of speakers confirmed to address the advanced battery and hybrid & electric vehicle (H/EV) tech community. Executives and senior-level experts from 3M, EnBW, McLaren Applied, Punch Powertrain, Renault, among many others, will present novel solutions and lead technical demonstrations that address the industry's leading challenges. The online conference will run adjacent to the digital exhibition floor that features hundreds of leading companies including Parker/LORD, Siemens, and TE Connectivity.


Registration for the digital conference and exhibition is open to attendees and press:

  • To tune into the conference, register as an attendee here.
  • To register as press, visit here.

As the effects of the ongoing COVID-19 pandemic continue to impact grid storage, battery materials, battery-powered electric vehicles, and manufacturer supply chains, the European region is presented with unprecedented stressors amid exceptional market acceleration. Speaking to the importance and timeliness of the event, James Frith, Head of Energy Storage at Bloomberg New Energy Finance and chair of the keynote panel “Meeting Demand for EV Battery Production in Europe; The Rise of the Giga Factory,” said: "The European battery manufacturing industry has been turned on its head over the last three years, going from almost non-existent to the second largest market globally. The Digital Days event will be the perfect opportunity to find out how the companies at the heart of this change envisage the next decade."

"At the rate the advanced battery and H/EV tech sectors are progressing in the European region and the number of obstacles that require an immediate solution, we felt it was critical to orchestrate industry connection before our next in-person event in November," said Rob Shelton, group event director, The Battery Show & EV Tech Europe Digital Days, Informa Markets. "The level of support for the upcoming digital event permeates all corners of the industry and is a clear indicator of the battery and H/EV tech market's fortitude and future advancement."

Featured conference content includes:

Tuesday 18 May

EV Forecasts: 2020 Summary of European EV Market Expansion and its Implications on Battery Demand
Speaker: Viktor Irle, Co-Founder & Market Analyst, EV Volumes

Latest Developments in EV Architectures: Determining the Optimum Level of Hybridization versus Societal, Environmental, and Economic Benefits
Speaker: Marcin Seredynski, Head of Innovation and Research, E-Bus Competence Centre

Race to Road Debate: Examining Formula E & Hyper Car Architectures and How they Can be Adapted for the Mass Market EV
Moderator: Luke Gear, Technology Analyst, IDTechEx

  • Angus Lyon, Director, Rockfort Engineering
  • Yu Merla, Principal Engineer - Advanced Battery Projects, Williams Advanced Engineering
  • Wasim Sarwar, Head of Research and Advanced Engineering, Rimac Automobil

Wednesday 19 May

EV Technical Session: The Role of Electric Vehicles in the Energy Transition
Speaker: Jeremy Parkes, Global Business Lead - Electric Vehicles, DNV

Keynote (Open to All) – Leaders Panel: Meeting Demand for EV Battery Production in Europe; the Rise of the Giga Factory
Moderator: James Frith, Senior Energy Storage Analyst, Bloomberg New Energy Finance

  • Benoit Lemaignan, CEO, Verkor
  • Kai-Uwe Wollenhaupt, President Europe & Vice President, SVOLT Energy Technology Company Ltd
  • Sebastian Wolf, Sr Director EU Operations and Managing Director, Farasis Energy Europe
  • Gery Bonduelle, SVP Sales, Freyr
  • Allan Paterson, CTO, Britishvolt

Electric Motor Development: Faster Charging, Higher Efficiency, Longer Range: The next Step in Electrification
Steve Lambert, Head of Electrification, McLaren Applied

Electric Powertrain: Developing High-Speed Electric Drive Unit for the Next Generation
Speaker: Henrik Dhejne, Product Line Manager - Passenger Car Transmissions, electrified Transmission & e-Axle, AVL

Thursday 20 May

EV Technical Session: State of the art Electric Track Drive for Medium & Heavy-Duty Machines
Speaker: Massimo Palomba, Global Sales Manager E-Mobility, Bonfiglioli Mobility & Wind Industries, Bonfiglioli Spa

EV Technical Session: HEV Battery Design; Should it be for Second Life or Easy to Recycle?
Speaker: Paweł Swoboda, Business Development Manager, BMZ Poland

Electric Buses: If 70% Of EV Cost is in The Battery… How Can You Reduce the Cost of Electrification?
Speaker: Manos Polioudis, Head of Powertrain Engineering, Arrival

For the full The Battery Show & EV Tech Europe Digital Days conference agenda, please visit here.

Follow The Battery Show & EV Tech Europe Digital Days on social media: #TheBatteryShow

About Informa Markets – Engineering:

Informa Markets' Engineering portfolio is the leading B2B event producer, publisher, and digital media business for the world's $3-trillion advanced, technology-based manufacturing industry. Our print and electronic products deliver trusted information to the engineering market and leverage our proprietary 1.3-million-name database to connect suppliers with buyers and purchase influencers. We produce more than 50 events and conferences in a dozen countries, connecting manufacturing professionals from around the globe. The Engineering portfolio is organized by Informa, the world's leading exhibitions organizer that brings a diverse range of specialist markets to life, unlocking opportunities and helping them to thrive 365 days of the year. For more information, please visit www.informamarkets.com.

About Informa Markets

Informa Markets creates platforms for industries and specialist markets to trade, innovate and grow. Our portfolio is comprised of more than 550 international B2B events and brands in markets including Engineering, Healthcare & Pharmaceuticals, Infrastructure, Construction & Real Estate, Fashion & Apparel, Hospitality, Food & Beverage, and Health & Nutrition, among others. We provide customers and partners around the globe with opportunities to engage, experience and, do business through face-to-face exhibitions, specialist digital content and, actionable data solutions. As the world's leading exhibitions organizer, we bring a diverse range of specialist markets to life, unlocking opportunities and helping them to thrive 365 days of the year. For more information, please visit www.informamarkets.com.


Contacts

Lauren Lloyd
This email address is being protected from spambots. You need JavaScript enabled to view it.
310-266-4792

NOT FOR DISTRIBUTION TO U.S. NEWSWIRE SERVICES OR FOR DISSEMINATION IN THE UNITED STATES

TORONTO--(BUSINESS WIRE)--Superior Plus Corp. (“Superior”) (TSX:SPB) announced today that its wholly-owned subsidiary, Superior Plus LP (“Superior LP”) has entered into an underwriting agreement with a syndicate of underwriters to issue and sell on a private placement basis CDN$500 million aggregate principal amount of 4.25% senior unsecured notes due May 18, 2028 (the “Notes”), which will be issued at par (the “Offering”). The Notes will be guaranteed by Superior and certain of its subsidiaries. Interest on the Notes will be payable semi-annually in arrears on May 18 and November 18 of each year, commencing on November 18, 2021. The Notes will be issued under a new trust indenture, a copy of which will be available on SEDAR following closing of the Offering. Closing of the Offering is expected to occur on or about May 18, 2021, subject to customary closing conditions.


The Offering is being underwritten by National Bank Financial Inc., Scotia Capital Inc., TD Securities Inc., BMO Nesbitt Burns Inc., CIBC World Markets Inc. and RBC Dominion Securities Inc. as joint bookrunners, and a syndicate of underwriters, including, ATB Capital Markets Inc., Canaccord Genuity Corp., Desjardins Securities Inc., J.P. Morgan Securities Canada Inc., Wells Fargo Securities Canada, Ltd., Casgrain & Company Ltd., Cormark Securities Inc., iA Private Wealth Inc. and Raymond James Ltd.

The Notes are being offered on a private placement basis to certain accredited investors in the provinces of Canada. The Notes have not been, and will not be, registered under the U.S. Securities Act of 1933, as amended (the “U.S. Securities Act”), or any state securities laws, and are being offered and sold in the United States only to qualified institutional buyers in reliance on the exemption from such registration requirement contained in Rule 144A under the U.S. Securities Act and comparable exemptions under applicable state securities laws. The Notes have not been and will not be qualified under the securities laws of any province or territory of Canada for distribution to the public and may not be offered or sold directly or indirectly in Canada or to or for the benefit of any resident of Canada except pursuant to applicable prospectus exemptions.

Superior LP intends to use the net proceeds of the Offering, together with borrowings under its credit facilities and cash on hand, to redeem all of its outstanding: (i) CDN$400 million principal amount of 5.25% senior unsecured notes due February 27, 2024 (the “2024 Notes”) in accordance with the indenture governing the 2024 Notes; and (ii) CDN$370 million principal amount of 5.125% senior unsecured notes due August 27, 2025 (the “2025 Notes”) in accordance with the indenture governing the 2025 Notes and, in each case, at the applicable redemption price and date noted below.

Superior LP has issued conditional redemption notices to redeem in full the 2024 Notes and the 2025 Notes. Subject to completion of the Offering: (a) the 2024 Notes will be redeemed (the “2024 Redemption”) on May 27, 2021 (the “2024 Redemption Date”) at the redemption price set forth in the indenture of CDN$1,026.25 per CDN$1,000 principal amount of 2024 Notes, together with accrued and unpaid interest thereon of CDN$12.80 per CDN$1,000 principal amount of 2024 Notes up to but excluding the 2024 Redemption Date, for a total amount payable on redemption of CDN$1,039.05 per CDN$1,000 principal amount of 2024 Notes; and (b) the 2025 Notes will be redeemed (the “2025 Redemption”) on May 19, 2021 at the redemption price set forth in the indenture of CDN$1,038.44 per CDN$1,000 principal amount of 2025 Notes, together with accrued and unpaid interest thereon of CDN$11.37 per CDN$1,000 principal amount of 2025 Notes up to but excluding the 2025 Redemption Date, for a total amount payable on redemption of CDN$1,049.81 per CDN$1,000 principal amount of 2025 Notes. The 2024 Notes and the 2025 Notes that are redeemed will cease to bear interest from and after their applicable redemption date.

Each of the 2024 Redemption and 2025 Redemption are subject to the condition precedent that the Offering is successfully completed. Superior LP reserves the right to waive this condition, wholly or partially, in its sole discretion. Superior LP further reserves the right to delay either or both of the 2024 Redemption Date and 2025 Redemption Date until such time as the condition is satisfied or waived in Superior LP’s sole discretion. In the event the condition has not been satisfied or waived in Superior LP’s sole discretion prior to the 2024 Redemption Date or 2025 Redemption Date, as the case may be, and as the same may be delayed, Superior LP may rescind the notices of redemption.

This press release does not constitute an offer to sell or an offer to purchase, or a solicitation of an offer to sell or an offer to purchase, the Notes. No offer, solicitation, purchase or sale will be made in any jurisdiction in which such offer, solicitation, purchase or sale would be unlawful.

About Superior Plus Corp.

Superior is a leading North American distributor and marketer of propane and distillates and related products and services, servicing over 780,000 customer locations in the U.S. and Canada.

For further information about Superior, please visit Superior’s website at: www.superiorplus.com or contact: Beth Summers, Executive Vice President and Chief Financial Officer, Tel: (416) 340-6015, or Rob Dorran, Vice President, Investor Relations and Treasurer, Tel: (416) 340-6003, E-mail: This email address is being protected from spambots. You need JavaScript enabled to view it., Toll Free: 1-866-490-PLUS (7587).

Forward Looking Information

Certain information included herein is forward-looking, within the meaning of applicable Canadian securities laws. Such information is typically identified by words such as “anticipate”, “believe”, “could”, “estimate”, “expect”, “plan”, “intend”, “forecast”, “future”, “guidance”, “may”, “predict”, “project”, “should”, “strategy”, “target”, “will” or similar expressions suggesting future outcomes. Forward-looking information in this news release includes forward looking information relating to the proposed Offering, the use of proceeds therefrom, the timing and successful completion of the Offering and the redemption of the 2024 Notes and 2025 Notes. Superior believes the expectations reflected in such forward-looking information are reasonable but no assurance can be given that these expectations will prove to be correct and such information should not be unduly relied upon.

Forward-looking information is not a guarantee of future performance. By its very nature, forward-looking information involves inherent assumptions, risks and uncertainties, both general and specific, and risks that predictions, forecasts, projections and other forward-looking information will not be achieved, including risks and assumptions relating to Canadian and U.S. market conditions and satisfaction of conditions to, and completion of, the Offering and redemption of the 2024 Notes and 2025 Notes. Forward-looking information herein is based on information currently available to Superior. No assurance can be given that these assumptions and expectations will prove to be correct. Should one or more of these risks and uncertainties materialize, or should assumptions described above prove incorrect, Superior’s actual performance and results in future periods may differ materially from any projections of future performance or results expressed or implied by such forward-looking information. Superior cautions readers not to place undue reliance on this information as a number of important factors could cause the actual results to differ materially from the beliefs, plans, objectives, expectations and anticipations, estimates and intentions expressed in such forward-looking information.

Forward-looking information contained in this news release is provided for the purpose of providing information about management’s goals, plans and range of expectations for the future and may not be appropriate for other purposes. Any forward-looking information is made as of the date hereof and, except as required by law, Superior does not undertake any obligation to publicly update or revise such information to reflect new information, subsequent or otherwise.


Contacts

Beth Summers
Executive Vice President and Chief Financial Officer
Tel: (416) 340-6015

Rob Dorran
Vice President, Investor Relations and Treasurer
Tel: (416) 340-6003
Toll Free: 1-866-490-PLUS (7587)
E-mail: This email address is being protected from spambots. You need JavaScript enabled to view it.

Strong first quarter performance delivers record Adjusted EBITDA and distributable cash flow, up 9% and 15% respectively, over first quarter 2020 generating significant positive free cash flow

Quarterly results highlighted by increased commodity prices and operational reliability in the face of extreme winter weather providing producer customers with strong flow assurance and improved net-backs

Executed a series of transactions that enabled First Reserve to exit its ten-year investment in Crestwood and allows for the transition to a publicly elected Board of Directors, further enhancing corporate governance

HOUSTON--(BUSINESS WIRE)--Crestwood Equity Partners LP (NYSE: CEQP) (“Crestwood”) reported today its financial and operating results for the three months ended March 31, 2021.


First Quarter 2021 Highlights1

  • First quarter 2021 net loss of $38.3 million, compared to net loss of $23.4 million in first quarter 2020
  • First quarter 2021 Adjusted EBITDA of $165.4 million, an increase of 9% compared to $151.4 million in the first quarter 2020
  • First quarter 2021 distributable cash flow (“DCF”) to common unitholders of $108.4 million, an increase of 15% compared to first quarter 2020; The first quarter 2021 coverage ratio was 2.8x
  • First quarter 2021 free cash flow after distributions of $63.6 million
  • Ended March 31, 2021 with approximately $2.6 billion in total debt and a 4.2x leverage ratio; Crestwood has substantial liquidity available under its $1.25 billion revolver with $530 million drawn as of March 31, 2021
  • Announced first quarter 2021 cash distribution of $0.625 per common unit, or $2.50 per common unit on an annualized basis, payable on May 14, 2021, to unitholders of record as of May 7, 2021

Recent Highlights

  • On March 30, 2021, Crestwood closed the first step of the previously announced strategic transactions with First Reserve; in the transactions First Reserve completed a private placement of six million common units for proceeds of $132 million and Crestwood purchased the general partner interest and 11.5 million common units for $268 million, facilitating First Reserve’s complete exit of its investment in Crestwood; In total, these transactions drive substantial accretion to Crestwood’s distributable cash flow per unit and allows for Crestwood’s transition to a publicly elected Board of Directors
  • The Board of Directors authorized a $175 million opportunistic common and preferred unit repurchase program through December 31, 2022 that will provide additional flexibility for increased return of capital to investors, once the company’s long-term leverage target is met
  • On April 21, 2021, closed on the redemption of the remaining $288 million of 6.25% senior notes due 2023 at par utilizing borrowings on the $1.25 billion revolving credit facility; Crestwood’s nearest term senior note maturity is now 2025
  • As a result of the strategic transactions, strong first quarter results and an increasingly positive commodity price outlook for 2021, Crestwood provided revised guidance including full year Adjusted EBITDA in a range of $575 million to $625 million, distributable cash flow of $335 million to $385 million, and free cash flow after distributions of $130 million to $180 million


Management Commentary

“I am pleased to announce record first quarter 2021 results with Adjusted EBITDA of $165.4 million and distributable cash flow of $108.4 million, increases of 9% and 15%, respectively, over the first quarter of 2020, leading to free cash flow after distributions of $63.6 million,” commented Robert G. Phillips, Chairman, President and Chief Executive Officer of Crestwood’s general partner. “These results were largely achievable because of the tireless efforts of our dedicated operations teams that maintained strong flow assurance through our gathering systems, processing plants and storage facilities despite the unprecedented challenges presented by Winter Storm Uri. Additionally, with the significant increase in commodity prices during the quarter, both Crestwood and our producers benefitted through increased margins and net-backs, respectively. As a result, we took advantage of these higher and more stabilized prices to hedge a portion of our commodity exposure throughout 2021 and lock in higher margins on several of our assets, giving us increased confidence in our revised 2021 guidance.”

Mr. Phillips commented further, “In addition to a strong operating quarter, we completed a historic transaction by arranging for the acquisition of all of First Reserve’s general partner and limited partner interests, allowing our sponsor to exit Crestwood after a ten-year partnership with management. This series of transactions not only improves Crestwood’s financial and strategic flexibility in the future, but greatly simplifies our capital structure and transitions Crestwood to an independent MLP with an elected Board of Directors. Given our strong first quarter performance and improving market fundamentals in 2021, Crestwood is on-track to achieve its revised annual guidance, continue to maintain our distribution, reduce debt to our target levels and opportunistically execute our repurchase program which we believe will further drive long-term value to our unitholders.”

First Quarter 2021 Segment Results

Gathering and Processing (G&P) segment EBITDA totaled $119.5 million in the first quarter 2021 compared to $119.4 million in the first quarter 2020. First quarter 2020 excludes an $80.3 million goodwill impairment related to Crestwood’s Powder River Basin operations. Strong first quarter results were driven by higher favorable commodity prices that had a positive impact on Crestwood’s percent-of-proceeds (POP) contracts in the Bakken and percent-of-index (POI) contracts on the Barnett system, as well as year-over-year volume growth of 13% and 17% for Arrow natural gas gathering and processing, respectively. As part of Crestwood’s on-going conservative risk management practices, the company opportunistically hedged approximately 50% of its POP and POI exposure at favorable commodity price levels for the remainder of the year which drives incremental upside from its original budget price expectations. During the first quarter 2021, Crestwood had continued producer rig activity in the Bakken, Powder River Basin, Delaware Basin and Barnett shale which is expected to result in strong volume growth beginning in the second quarter 2021.

Storage and Transportation (S&T) segment EBITDA totaled $20.4 million in the first quarter 2021, compared to $13.7 million in the first quarter 2020. First quarter 2021 EBITDA excludes a $119.9 million impairment recorded by Crestwood’s equity investment in Stagecoach Gas Services (“Stagecoach”), while first quarter 2020 EBITDA excludes a $4.5 million impairment recorded by Crestwood’s equity investment in a rail terminal in the Powder River Basin. First quarter 2021 natural gas storage and transportation volumes averaged 2.3 Bcf/d, compared to 1.8 Bcf/d in the first quarter 2020. In the first quarter 2021, Stagecoach has continued to see record setting transportation volumes as natural gas production in Northeast Pennsylvania continues to increase due to favorable economics. This increased demand has resulted in both the transportation and storage assets reaching nearly 100% contracted capacity. At the COLT Hub, first quarter 2021 rail loading volumes were 52 MBbls/d as the facility benefited from increased activity due to ongoing uncertainty around the Dakota Access Pipeline (“DAPL”). The Tres Palacios facility in south Texas significantly exceeded internal expectations during the first quarter 2021 driven primarily by the effects of the extreme weather from Winter Storm Uri that drove an increase in natural gas withdrawals across the state of Texas in mid-February. As a result of prior winterization efforts, the 35 Bcf natural gas storage facility located 60-miles southwest of Houston was able to maintain operations during the storm to meet all primary firm customer withdrawal requests for the duration of the storm.

Marketing, Supply and Logistics (MS&L) segment EBITDA totaled $30.5 million in the first quarter 2021, compared to $26.0 million in the first quarter 2020. All periods exclude the non-cash change in fair value of commodity inventory-related derivative contracts. During the first quarter 2021, Crestwood’s gas and crude marketing teams benefitted from increased product demand and volatility in commodity prices as a result of extreme winter weather conditions. The NGL marketing and logistics business continued to benefit from consistent residential demand and expects to see increases in commercial demand and refinery utilization as economic re-openings begin to occur across the country. Over the last twelve months, the NGL business has fully integrated and optimized its larger asset base and operations after the Plains acquisition in April 2020, and as a result of a full year of ownership and consistent customer relationships, has been able to capture increased market share during the 2021 re-contracting season.

Combined O&M and G&A expenses, net of non-cash unit-based compensation, in the first quarter 2021 were $49.2 million compared to $56.9 million in the first quarter 2020. The decrease in expenses in first quarter 2021 was due to Crestwood’s permanent cost reduction efforts to streamline its operations during the second quarter 2020.

First Quarter 2021 Business Update and Outlook

Bakken

During the first quarter 2021, the Arrow system averaged crude oil gathering volumes of 100 MBbls/d, natural gas gathering volumes of 134 MMcf/d, and produced water gathering volumes of 82 MBbls/d. During the quarter, extreme winter weather negatively impacted volumes on the Arrow system as producers experienced freeze-offs and shut-in production due to record low temperatures, offset by favorable commodity prices on Crestwood’s contracted POP exposure. There are currently two rigs running and two completion crews operating on acreage dedicated to Arrow which are expected to drive 10 to 15 new three product and 10 to 15 water-only well connections in the second quarter. Crestwood continues to expect 45+ three product wells to be connected in 2021 in the current commodity price environment.

During the first quarter, Crestwood invested $4.3 million in the Bakken which was primarily comprised of capital to complete the southern expansion of Arrow’s produced water gathering infrastructure. This strategic growth project provides critical produced water gathering infrastructure to Enerplus Corporation (“Enerplus”) as well as support for Enerplus’ sustainability initiatives to re-use produced water in completion operations. For the remainder of 2021, capital investments in the Bakken will remain focused on the enhancement and expansion of the produced water gathering system and incremental natural gas compression projects to support producer development plans.

DAPL

Crestwood continues to actively monitor the legal proceedings on DAPL and remains well-positioned to manage its Bakken operations under any potential outcome for the pipeline. At current basin production rates of approximately 1.2 million barrels of crude oil per day, there is more than adequate alternative crude oil pipeline and crude-by-rail takeaway capacity to provide operators flow assurance to premium markets out of the basin. During the first quarter 2021, Crestwood’s customers further mitigated their exposure to a DAPL shutdown by utilizing other takeaway options at the Arrow CDP. These mitigation efforts have resulted in less than 50% of Arrow producer volumes being delivered to DAPL. Currently, in addition to DAPL, Arrow offers its customers connectivity to Kinder Morgan’s Hiland pipeline, Tesoro’s High Plains pipeline, and the True Companies’ Bridger Four Bears pipeline system, in addition to the COLT Hub and trucking takeaway. In total, Arrow has over 220 MBbls/d of takeaway capacity for customers, allowing it to competitively clear all of its producers’ product from the basin in the event operations on DAPL are temporarily suspended.

Powder River Basin

During the first quarter 2021, the Jackalope system averaged natural gas gathering and processing volumes of 98 MMcf/d, increases of 19% and 16%, respectively, over the fourth quarter of 2020 as all producing wells across the system have resumed full operations. During the quarter, Jackalope customers experienced production disruptions as a result of the extreme winter weather which had a short-term negative impact to gathering and processing volumes. Crestwood continues to expect 15 to 20 wells to be connected to the Jackalope system during 2021, the majority of which are expected to come online in the second quarter 2021.

Delaware Basin

During the first quarter 2021, the Delaware Basin systems averaged gathering volumes of 182 MMcf/d and processing volumes of 54 MMcf/d. Gathering volumes increased 5% compared to the fourth quarter 2020 as a result of 23 new wells connected to the systems driven primarily by Royal Dutch Shell’s (“Shell”) development program on the Nautilus gathering system. Volumes across both the Nautilus and Willow Lake systems were negatively impacted by Winter Storm Uri in mid-February as producers experienced freeze-offs at the well-head during the storm. Produced water gathering volumes averaged 48 MBbls/d during the first quarter 2021, an increase of 10% compared to fourth quarter 2020, as the anchor producer re-used fewer barrels for completion activities.

During the first quarter, Crestwood invested $3.3 million in the Delaware Basin related to system expansions and well-connect capital. Crestwood expects a material increase in activity on the Willow Lake system in the beginning in the second quarter driven by new wells connections from ConocoPhillips, formerly Concho Resources, and Mewbourne Oil Company, resulting in incremental gathering volumes as well as a significant increase in volumes processed at the Orla processing plant. Activity on the Nautilus system continues to be driven by Shell’s development program on dedicated acreage. Based on current producer forecasts, Crestwood estimates 30 to 40 wells to be connected to the Delaware Basin gathering systems during the second quarter.

Barnett Shale

In the Barnett shale, completion operations have begun on a new eight-well pad on Crestwood’s Lake Arlington system. Crestwood’s gathering infrastructure is connected to the pad and initial production is expected in the coming weeks. The new pad will be the first new wells completed on the Lake Arlington system in over five years and utilized modern well bore and frack design techniques to optimize initial flow performance. Crestwood anticipates the incremental volumes from this activity to more than offset natural field decline for the year.

Stagecoach Gas Services

The Stagecoach assets have continued to benefit as producers in the Northeast Marcellus region have increased capital allocation to the area due to favorable natural gas prices that has resulted in increased production in the region. Stagecoach is connected to more than 5.0 Bcf/d natural gas supply and its advantaged infrastructure position provides customers with access to high-demand metropolitan areas including New York City and the East Coast. As demand has increased, Stagecoach has seen a favorable uptick in transportation demand that has led to both transportation and storage nearly 100% contracted for 2021. Crestwood estimates that the Stagecoach asset will generate approximately $55 million to $60 million in Adjusted EBITDA, net to Crestwood, in 2021.

During the first quarter of 2021, Crestwood recorded a $119.9 million reduction to the equity earnings from its investment in Stagecoach as a result of a goodwill impairment at the asset level. This goodwill impairment is a non-cash adjustment and was based on market-based information received through the on-going strategic evaluation Consolidated Edison (“ConEd”) is conducting on its investment in Stagecoach, as well as other precedent market transactions. The carrying value of Crestwood’s Stagecoach equity method investment was approximately $666 million as of March 31, 2021.

Capitalization and Liquidity Update

On March 30, 2021, Crestwood completed the first closing of the previously announced strategic transactions which allowed First Reserve to exit its investment in Crestwood which included 17.5 million common units, approximately 24% of total common units outstanding, and control of the general partner. In a private placement, First Reserve sold six million common units representing limited partner interests in Crestwood to third parties, resulting in total proceeds of $132 million. In addition, Crestwood repurchased the general partner interest and the remaining 11.5 million units held by First Reserve with $268 million drawn from its existing $1.25 billion revolving credit facility. The 11.5 million common units were then retired. Closing of the purchase of the general partner interest is expected in the coming months following an amendment to the Crestwood partnership agreement. This second closing is not subject to any closing conditions. Using the proceeds it received on March 30, 2021, First Reserve repaid the term loan B at Crestwood Holdings in full.

Following the completion of these transactions, Crestwood has approximately 62.8 million common units outstanding, representing an approximate 15% reduction in total common units outstanding. Crestwood’s purchase and retirement of the 11.5 million common units from First Reserve results in annual cash distribution savings of approximately $29 million based on the current annual distribution rate of $2.50 per common unit.

As of March 31, 2021, Crestwood had approximately $2.6 billion of debt outstanding, comprised of $2.1 billion of fixed-rate senior notes and $530 million outstanding under its $1.25 billion revolving credit facility, resulting in a leverage ratio of 4.2x. On April 21, 2021, Crestwood closed on the redemption of the remaining $288 million of 6.25% senior notes due 2023 at par utilizing borrowings on the revolving credit facility. As a result, Crestwood’s outstanding debt balance pro forma for calling the 2023 senior notes remains unchanged at $2.6 billion but is now comprised of $1.8 billion of fixed-rate senior notes and $818 million outstanding under the revolving credit facility. Crestwood currently has more than $400 million of availability on its revolving credit facility which, when combined with its substantial free cash flow, provides Crestwood more than ample liquidity to execute its business strategy.

Crestwood invested approximately $8.8 million in consolidated growth capital projects and joint venture contributions during the first quarter 2021. Crestwood expects growth capital for 2021 to be in a range of $35 million to $45 million, primarily focused on optimizations to the Arrow gathering system in the Bakken and well connects in the Delaware Permian and Powder River Basin. Crestwood expects to invest between $20 million to $25 million on maintenance capital projects for the year. Based on the current outlook, Crestwood expects to fund its total 2021 capital program entirely with retained cash flow and to generate meaningful free cash flow after distributions.

Crestwood currently has 71.3 million preferred units outstanding (par value of $9.13 per unit) which pay a fixed-rate annual cash distribution of 9.25%, payable quarterly. The preferred units are listed on the New York Stock Exchange and trade under the ticker symbol CEQP-P.

Sustainability Program Update

Since 2018, Crestwood has been a leader in the midstream ESG space by advancing ESG initiatives both within the company and across the energy industry. ESG/Sustainability at Crestwood continues to be a top priority and it remains steadfast in advancing ESG within the midstream sector. Upon closing the recent strategic transactions, Crestwood will be only one of three existing master limited partnerships to enhance its corporate governance with a transition to a publicly elected board. Going forward, Crestwood will continue to enhance its commitment to board diversity and other governance elements in accordance with its ESG strategy.

Crestwood’s 2020 sustainability will be issued in June 2021 and will include additional disclosures including those associated with the Task Force for Climate-related Financial Disclosures (“TCFD”), progress made on its three-year sustainability strategy and the continuation of executive compensation linked to sustainability key performance indicators.

For up-to-date information on Crestwood’s on-going commitment to sustainability please visit https://esg.crestwoodlp.com.

Upcoming Conference Participation

Crestwood’s management will participate in the following upcoming virtual investor conferences. Prior to the start of each conference, new presentation materials may be posted to the Investors section of Crestwood’s website at www.crestwoodlp.com.

  • EIC 2021 Investor Conference, May 18 – 21, 2021
  • Stifel Cross Sector Insight Conference, June 8 – 10, 2021
  • J.P. Morgan Energy, Power & Renewables Conference, June 22 - 23, 2021

Earnings Conference Call Schedule

Management will host a conference call for investors and analysts of Crestwood today at 9:00 a.m. Eastern Time (8:00 a.m. Central Time) which will be broadcast live over the Internet. Investors will be able to connect to the webcast via the “Investors” page of Crestwood’s website at www.crestwoodlp.com. Please log in at least 10 minutes in advance to register and download any necessary software. A replay will be available shortly after the call for 90 days.

Non-GAAP Financial Measures

Adjusted EBITDA, distributable cash flow and free cash flow are non-GAAP financial measures. The accompanying schedules of this news release provide reconciliations of these non-GAAP financial measures to their most directly comparable financial measures calculated and presented in accordance with GAAP. Our non-GAAP financial measures should not be considered as alternatives to GAAP measures such as net income or operating income or any other GAAP measure of liquidity or financial performance.

Forward-Looking Statements

This news release contains forward-looking statements within the meaning of the U.S. Private Securities Litigation Reform Act of 1995 and Section 21E of the Securities and Exchange Act of 1934. The words “expects,” “believes,” “anticipates,” “plans,” “will,” “shall,” “estimates,” and similar expressions identify forward-looking statements, which are generally not historical in nature. Forward-looking statements are subject to risks and uncertainties and are based on the beliefs and assumptions of management, based on information currently available to them. Although Crestwood believes that these forward-looking statements are based on reasonable assumptions, it can give no assurance that any such forward-looking statements will materialize. Important factors that could cause actual results to differ materially from those expressed in or implied from these forward-looking statements include the risks and uncertainties described in Crestwood’s reports filed with the Securities and Exchange Commission, including its Annual Report on Form 10-K and its subsequent reports, which are available through the SEC’s EDGAR system at www.sec.gov and on our website.


Contacts

Crestwood Equity Partners LP
Investor Contacts

Josh Wannarka, 713-380-3081
This email address is being protected from spambots. You need JavaScript enabled to view it.
Senior Vice President, Investor Relations, ESG & Corporate Communications

Rhianna Disch, 713-380-3006
This email address is being protected from spambots. You need JavaScript enabled to view it.
Director, Investor Relations

Sustainability and Media Contact

Joanne Howard, 832-519-2211
This email address is being protected from spambots. You need JavaScript enabled to view it.
Vice President, Sustainability and Corporate Communications


Read full story here

FORT WORTH, Texas--(BUSINESS WIRE)--Basic Energy Services, Inc. (OTCQX: BASX) (“Basic” or the “Company”) today announced it has entered into a purchase and sale agreement for the sale of certain non-core assets for a purchase price of $6.6 million, not including the assumption of certain capital leases with a remaining balance of approximately $0.7 million and earn-out payment of up to $1.0 million payable one year after closing. The closing date is anticipated to occur approximately thirty days after the execution of the purchase and sale agreement. The sale includes heavy duty trucks, light duty vehicles, fracturing tanks and certain non-core salt water disposal wells.


About Basic Energy Services

Basic Energy Services provides wellsite services essential to maintaining production from the oil and gas wells within its operating areas. The Company’s operations are managed regionally and are concentrated in major United States onshore oil-producing regions located in Texas, California, New Mexico, Oklahoma, Arkansas, Louisiana, Wyoming, North Dakota, Colorado and Montana. Our operations are focused in prolific basins that have historically exhibited strong drilling and production economics in recent years as well as natural gas-focused shale plays characterized by prolific reserves. Specifically, the Company has a significant presence in the Permian Basin, Bakken, Los Angeles and San Joaquin Basins, Eagle Ford, Haynesville and Powder River Basin. We provide our services to a diverse group of over 2,000 oil and gas companies. Additional information on Basic Energy Services is available on the Company’s website at www.basices.com.

Safe Harbor Statement

This release includes “forward-looking statements” within the meaning of the federal and securities laws. Forward-looking statements are not statements of historical fact and reflect Basic’s current views about future events. The words “believe,” “estimate,” “expect,” “anticipate,” “project,” “intend,” “seek,” “could,” “should,” “may,” “potential” and similar expressions are intended to identify forward-looking statements. However, the absence of these words does not mean that the statements are not forward-looking. Although Basic believes the expectations reflected in its forward-looking statements are reasonable and are based on reasonable assumptions and estimates, certain risks and uncertainties could cause actual results to differ materially from the projections, anticipated results or other expectations expressed in this release. These risks and uncertainties include without limitation, risks associated with a future closing of the purchase and sale agreement described therein and the satisfaction of the conditions thereto. Additional important risk factors that could cause actual results to differ materially from expectations are disclosed in Item 1A of the Company’s most recent Annual Report on Form 10-K and other filings with the Securities and Exchange Commission. While Basic makes these statements and projections in good faith, neither Basic nor its management can guarantee that the transactions will be consummated or that anticipated future results will be achieved. Any forward-looking statement speaks only as of the date on which such statement is made and Basic assumes no obligation to publicly update or revise any forward-looking statements made herein or any other forward-looking statements made by Basic, whether as a result of new information, future events, or otherwise, except as required by applicable law.


Contacts

Trey Stolz
Director of Financial Planning & Analysis
Basic Energy Services, Inc.
817-334-4100

Spire Bridge will bring customer solutions under a single platform

Spire Analytics will deliver actionable insights for your decision-making process

SAN FRANCISCO & RESTON, Va.--(BUSINESS WIRE)--Spire Global, Inc. (“Spire”), a leading global provider of space-based data and analytics, announced today the launch of a new platform and a new analytics product for the maritime industry. Spire Bridge and Spire Analytics will allow customers to create their own dashboards and alerts customized to their specific use cases.

Through the Spire Bridge portal, customers can now access our new product, Spire Analytics, to monitor data usage, get support, documentation, and product updates to activate and operationalize the data Spire measures and provides. Having a dedicated location for all of these features will allow data users to access insights and support faster.

“After listening to our customers, the Maritime team has developed a platform for users to better access the data and information they need when they need it. Spire puts its customers first and Spire Bridge is a result of this philosophy,” said Simon van den Dries, General Manager, Spire Maritime.

To expand Spire Maritime API data services, the team has introduced new analytics capabilities that provide valuable time savings for developers and data engineers. Spire Analytics transforms maritime data into actionable insights to help solve the Maritime industry’s business challenges. This tool allows customers to graph, report, and visualise the data. It can also filter searches by ship type, voyage, density map, and more. For customers looking for a faster way to get information about a fleet, port, anchorage, or terminal event, our easy-to-use dashboard can filter the information and deliver the data they need to make data-driven decisions, case by case, without all the background noise.

“Spire Maritime’s industry-specific dashboards are easy to use, customizable and deliver in-depth insights to help predict outcomes, test business strategies and automate decision making. These new features will allow Spire’s customers to use data in more actionable ways,” said Max Abouchar, Product Manager, Spire Maritime.

As of January 2021, Spire Global has over 100 satellites in orbit that are collecting hundreds of million messages per day. Spire will continue to provide more data and insights to enable the digital transformation of organizations towards data-driven opportunities in the maritime industry.

About Spire Global, Inc.

Spire is a global provider of space-based data and analytics that offers unique datasets and powerful insights about Earth from the ultimate vantage point so organizations can make decisions with confidence, accuracy, and speed. Spire uses a multi-purpose satellite constellation to source hard to acquire, valuable data and enriches it with predictive solutions. Spire then provides this data as a subscription to organizations around the world so they can improve business operations, decrease their environmental footprint, deploy resources for growth and competitive advantage, and mitigate risk. Spire has offices in San Francisco, CA, Boulder, CO Washington DC, Glasgow, Luxembourg, and Singapore. On March 1, 2021 Spire announced plans to go public via a planned business combination with NavSight Holdings, Inc. (NYSE:NSH), and expects to be traded on the NYSE under the ticker symbol “SPIR.” To learn more, visit spire.com.

About NavSight Holdings, Inc.

NavSight Holdings, Inc. (“NavSight”) is a blank check company formed for the purpose of effecting a merger, capital stock exchange, asset acquisition, stock purchase, reorganization or similar business combination with one or more businesses. NavSight was organized with the opportunity to pursue a business combination target in any business or industry, with the intent to focus its search on identifying a prospective target business that provides expertise and technology to U.S. government customers in support of their national security, intelligence and defense missions.

Additional Information and Where to Find It

In connection with the planned business combination with Spire (the “Proposed Transaction”), NavSight intends to file a Form S-4 Registration Statement (the “Registration Statement”) with the SEC, which will include a preliminary proxy statement to be distributed to holders of NavSight’s common stock in connection with NavSight’s solicitation of proxies for the vote by NavSight’s stockholders with respect to the Proposed Transaction and other matters as described in the Registration Statement, a prospectus relating to the offer of the securities to be issued to the Company’s stockholders in connection with the Proposed Transaction, and an information statement to Company’s stockholders regarding the Proposed Transaction. After the Registration Statement has been filed and declared effective, NavSight will mail a definitive proxy statement/prospectus, when available, to its stockholders. Investors and security holders and other interested parties are urged to read the proxy statement/prospectus, any amendments thereto and any other documents filed with the SEC carefully and in their entirety when they become available because they will contain important information about NavSight, the Company and the Proposed Transaction. Investors and security holders may obtain free copies of the preliminary proxy statement/prospectus and definitive proxy statement/prospectus (when available) and other documents filed with the SEC by NavSight through the website maintained by the SEC at http://www.sec.gov, or by directing a request to: NavSight Holdings, Inc., 12020 Sunrise Valley Drive, Suite 100, Reston, VA 20191.

Participants in Solicitation

NavSight and the Company and their respective directors and certain of their respective executive officers and other members of management and employees may be considered participants in the solicitation of proxies with respect to the Proposed Transaction. Information about the directors and executive officers of NavSight is set forth in its Form 10-K filed on March 29, 2021. Additional information regarding the participants in the proxy solicitation and a description of their direct and indirect interests, by security holdings or otherwise, will be included in the Registration Statement and other relevant materials to be filed with the SEC regarding the Proposed Transaction when they become available. Stockholders, potential investors and other interested persons should read the Registration Statement carefully when it becomes available before making any voting or investment decisions. When available, these documents can be obtained free of charge from the sources indicated above.

No Offer or Solicitation

This press release shall not constitute an offer to sell or the solicitation of an offer to buy any securities, nor shall there be any sale of securities in any jurisdiction in which such offer, solicitation or sale would be unlawful prior to registration or qualification under the securities laws of any such jurisdiction. No offering of securities shall be made except by means of a prospectus meeting the requirements of Section 10 of the U.S. Securities Act of 1933, as amended.

Forward-Looking Statements

The information in this press release includes “forward-looking statements” within the meaning of the federal securities laws with respect to the Proposed Transaction. Forward-looking statements may be identified by the use of words such as “estimate,” “plan,” “project,” “forecast,” “intend,” “will,” “expect,” “anticipate,” “believe,” “seek,” “target” or other similar expressions that predict or indicate future events or trends or that are not statements of historical matters. These forward-looking statements include, but are not limited to, statements regarding expectations of accelerating Spire’s sales and marketing efforts, expectations of product development across Spire’s maritime segment and the applicability of such products to Spire’s market, the strengthening of Spire’s competitive advantage, the importance of maritime analytics solutions to Spire’s target markets, Spire’s ability to advance its solutions to its core markets, the expansion of Spire’s business to new regions and markets, Spire’s future growth, estimates and forecasts of financial and performance metrics, expectations of achieving and maintaining profitability, projections of total addressable markets, market opportunity and market share, net proceeds from the Proposed Transactions, potential benefits of the Proposed Transaction and the potential success of the Company’s market and growth strategies, and expectations related to the terms and timing of the Proposed Transaction. These statements are based on various assumptions and on the current expectations of NavSight’s and the Company’s management and are not predictions of actual performance. These forward-looking statements are provided for illustrative purposes only and are not intended to serve as, and must not be relied on by any investor as, a guarantee, an assurance, a prediction or a definitive statement of fact or probability. Actual events and circumstances are difficult or impossible to predict and will differ from assumptions. Many actual events and circumstances are beyond the control of NavSight and the Company. These forward-looking statements are subject to a number of risks and uncertainties, including (i) the risk that the Proposed Transaction may not be completed in a timely manner or at all, which may adversely affect the price of NavSight's securities; (ii) the risk that the Proposed Transaction may not be completed by NavSight's business combination deadline and the potential failure to obtain an extension of the business combination deadline if sought by NavSight; (iii) the failure to satisfy the conditions to the consummation of the Proposed Transaction, including the approval of the Proposed Transaction by the stockholders of NavSight, the satisfaction of the minimum trust account amount following any redemptions by NavSight's public stockholders and the receipt of certain governmental and regulatory approvals; (iv) the inability to complete the PIPE investment in connection with the Proposed Transaction; (v) the failure to realize the anticipated benefits of the Proposed Transaction; (vi) the effect of the announcement or pendency of the Proposed Transaction on Spire’s business relationships, performance, and business generally; (vii) risks that the Proposed Transaction disrupts current plans of Spire and potential difficulties in Spire employee retention as a result of the Proposed Transaction; (viii) the outcome of any legal proceedings that may be instituted against NavSight or Spire related to the business combination agreement or the Proposed Transaction; (ix) the ability to maintain the listing of NavSight’s securities on the New York Stock Exchange; (x) the ability to address the market opportunity for Space-as-a-Service; (xi) the risk that the Proposed Transaction may not generate expected net proceeds to the combined company; (xii) the ability to implement business plans, forecasts, and other expectations after the completion of the Proposed Transaction, and identify and realize additional opportunities; (xiii) the occurrence of any event, change or other circumstance that could give rise to the termination of the business combination agreement; (xiv) the risk of downturns, new entrants and a changing regulatory landscape in the highly competitive space data analytics industry; and those factors discussed in NavSight’s final prospectus filed on September 11, 2020 under the heading “Risk Factors,” and other documents of NavSight filed, or to be filed, with the SEC. If any of these risks materialize or the Company’s assumptions prove incorrect, actual results could differ materially from the results implied by these forward-looking statements. There may be additional risks that neither NavSight nor the Company presently know or that NavSight and the Company currently believe are immaterial that could also cause actual results to differ from those contained in the forward-looking statements. In addition, forward-looking statements reflect NavSight’s and the Company’s expectations, plans or forecasts of future events and views as of the date of this press release. NavSight and the Company anticipate that subsequent events and developments will cause NavSight’s and the Company’s assessments to change. However, while NavSight and the Company may elect to update these forward-looking statements at some point in the future, NavSight and the Company specifically disclaim any obligation to do so. These forward-looking statements should not be relied upon as representing NavSight’s and the Company’s assessments as of any date subsequent to the date of this press release. Accordingly, undue reliance should not be placed upon the forward-looking statements.


Contacts

For Spire Global, Inc.:
Investor Contact:
Michael Bowen and Ryan Gardella
This email address is being protected from spambots. You need JavaScript enabled to view it.

Media Contact:
Phil Denning
This email address is being protected from spambots. You need JavaScript enabled to view it.

For NavSight Holdings, Inc.:
Investor Contact:
Jack Pearlstein
This email address is being protected from spambots. You need JavaScript enabled to view it.

HOUSTON--(BUSINESS WIRE)--NOV Inc. (NYSE: NOV) today reported first quarter 2021 revenues of $1.25 billion, a decrease of six percent compared to the fourth quarter of 2020 and a decrease of 34 percent compared to the first quarter of 2020. Net loss for the first quarter of 2021 was $115 million, or 9.2 percent of sales, which included non-cash, pre-tax charges (“other items”, see Other Corporate Items for additional detail) of $9 million. Adjusted EBITDA (operating profit excluding depreciation, amortization, and other items) decreased $17 million sequentially to $0.


We are encouraged by signs of an emerging global recovery for our industry,” stated Clay Williams, Chairman, President and CEO. “However, NOV’s weak first quarter results reflect the extreme austerity that descended on the oilfield following the economic shutdown of 2020, as our oilfield service customers preserved cash by cannibalizing idle equipment rather than buying new. Severe winter weather in Texas and Oklahoma, additional COVID lockdown measures in Asia, and supply chain disruptions further impacted first quarter results.

Higher rig activity in North America and certain international markets, resulting from stronger oil prices, is leading to tangible improvements. We are seeing better volume and pricing for our products and services tied to activity, including drill bits, downhole tools, oilfield pipe inspection and wellsite services. Additionally, improving tendering activity is expected to drive additional capital equipment orders in the second half of 2021.

NOV has undertaken extraordinary cost reduction measures over the past several quarters while continuing to invest in its next generation of products, leaving the Company well-positioned for a recovery. Global economic growth, shrinking crude inventories, stronger oil and gas prices, and recovering oilfield activity are expected to provide the foundation for a meaningful improvement in financial results as the year progresses,” concluded Williams.

Wellbore Technologies

Wellbore Technologies generated revenues of $413 million in the first quarter of 2021, an increase of 11 percent from the fourth quarter of 2020 and a decrease of 40 percent from the first quarter of 2020. The sequential increase in revenue was driven by improving drilling activity in the Western Hemisphere, partially offset by seasonality in the Eastern Hemisphere. Operating loss improved $64 million sequentially to $14 million, or 3.4 percent of sales, and included $6 million of other items. Adjusted EBITDA increased $22 million sequentially to $34 million, or 8.2 percent of sales.

Completion & Production Solutions

Completion & Production Solutions generated revenues of $439 million in the first quarter of 2021, a decrease of 20 percent from the fourth quarter of 2020 and a decrease of 35 percent from the first quarter of 2020. The sharp sequential decline in revenue was primarily the result of severe weather disruptions, certain project delays, COVID-19 shutdowns in Southeast Asia, and raw material shortages for the segment’s Fiberglass business unit. Operating loss improved $14 million sequentially to $17 million, or 3.9 percent of sales, and included -$2 million in other items. Adjusted EBITDA decreased $32 million sequentially to -$4 million, or -0.9 percent of sales.

New orders booked during the quarter totaled $338 million, representing a book-to-bill of 127 percent when compared to the $267 million of orders shipped from backlog. For 2021, the segment began including Denali brand underground fiberglass tanks in its capital equipment backlog, increasing the January 1, 2021 backlog balance by $57 million. Book-to-bill for the quarter was 115 percent excluding Denali. At March 31, 2021, backlog for capital equipment orders for Completion & Production Solutions was $810 million.

Rig Technologies

Rig Technologies generated revenues of $431 million in the first quarter of 2021, a decrease of one percent from the fourth quarter of 2020 and a decrease of 23 percent from the first quarter of 2020. Revenue declined due to soft orders and lower backlog in the segment’s rig equipment business, partially offset by growing demand for offshore wind related equipment and the initial progress on the first two rigs to be built at the Company’s new manufacturing facility in Saudi Arabia. Operating loss improved $124 million to $8 million, or 1.9 percent of sales, and included $3 million of other items. Adjusted EBITDA decreased $6 million sequentially to $13 million, or 3.0 percent of sales. Profitability was negatively impacted by the decline in revenue, a less favorable product mix and costs associated with severe weather disruptions.

New orders booked during the quarter totaled $112 million, representing a book-to-bill of 59 percent when compared to the $190 million of orders shipped from backlog. At March 31, 2021, backlog for capital equipment orders for Rig Technologies was $2.59 billion.

Other Corporate Items

During the first quarter, the Company recognized $9 million in net restructuring charges, primarily due to severance costs and facility closures. See reconciliation of Adjusted EBITDA to Net Income.

As of March 31, 2021, the Company had total debt of $1.85 billion, with $2.00 billion available on its revolving credit facility, and $1.61 billion in cash and cash equivalents. Subsequent to quarter end, the Company repaid the entire outstanding balance ($183 million) of its 2.60% unsecured Senior Notes due December 2022 using available cash balances. Following the repayment, the Company’s earliest bond maturity is in 2029.

Significant Achievements

NOV received work orders for the first two rigs to be built at its state-of-the-art manufacturing facility in Saudi Arabia. The plant has a commitment from Saudi Aramco Nabors Drilling Company to build 50 drilling rigs that are designed for the rugged conditions of the GCC region and incorporate NOV’s most cutting-edge technology suite.

NOV introduced a new design of its IntelliServ wired drill pipe technology that simplifies the process of embedding the coil and data cables, shortening the manufacturing process from 20 hours to only 20 minutes. In addition to the significant reduction in upfront manufacturing costs, the new design also enables field installation and simplifies repair and maintenance processes, resulting in a significantly lower total cost of ownership over the life-cycle of the pipe. The new IntelliServ offering provides the same instantaneous and bi-directional transmission of downhole data during the drilling process that enables operators to achieve greater downhole transparency and better overall well performance, at a fraction of the cost.

NOV won a large contract to supply Viper™, XLW, and XLW-GT large-diameter casing for the Gulf of Mexico North Platte 20,000-psi project, the first of its kind. Ideal for critical deepwater applications, XLW and XLW-GT casings combine the integrity of integral connectors with the strength of weld-on connectors. Viper technology’s proven performance in deepwater brings exceptional sealing properties, fatigue performance, and full pipe body strength to differentiate it from the competition.

NOV technology continues to drive efficiency improvements in harsh-environment drilling applications for geothermal development projects. NOV’s FluidHammer drilling tool, combined with a Vector™ Series 36i Drilling Motor, will be used by a customer in Switzerland to drill through 3,200 meters of extremely challenging granite. The Series 36i motor incorporates NOV’s Impulse technology that creates an axial impulse at the bit without restricting flow to the bit, increasing drilling efficiency in the most demanding applications.

NOV continued to grow its presence in the burgeoning offshore wind energy market with an order to order for the design, jacking systems, and heavy lift crane equipment for a wind turbine installation vessel for a European contractor.

NOV brought measurement-while-drilling (MWD) technologies to several new markets during the quarter. A geothermal contractor used the Tolteq™ MWD platform to drill a directional well in Japan for the first time. In another first, a customer in Namibia leveraged NOV’s Teledrift™ survey-on-connection tools to monitor the well trajectory in an operator’s first exploration well in a frontier play.

NOV’s ReedHycalog™ Fuego™ drill bit series, developed specifically for the challenging and diverse drilling applications of Latin America, continued to drive exceptional results across the region. In Mexico, a large service contractor achieved its best drilling performance ever in the country with the Fuego™ bit, reducing drilling time in every hole section to save more than 52 hours. On another project in Mexico, NOV provided a 14½-in. Fuego™ drill bit with SabertoothTM cutter configuration to enhance the durability and rate of penetration (ROP) while drilling through multiple formations in a high-pressure/high-temperature operation. The bit beat the ROP benchmark by 80% and saved approximately 90 hours in drilling time for the operator. Similarly, in Colombia, NOV supplied a 12¼-in. Fuego™ drill bit equipped with ION™ cutters, which was run with a downhole motor-powered rotary steerable assembly. The bit drove a 145% improvement in ROP and reduced drilling time by more than 19 hours.

NOV won a contract to provide Tuboscope’s TK-70™ internal coating for 43,000 ft of SCH80 10-in. line pipe and 1,400 Thru-Kote™ connections for a gathering system in South Texas. When used together, TK coated line pipe and the Thru-Kote welded connection system provide a seamless coated pipeline with improved flow efficiency and superior corrosion protection.

NOV continued its long history of providing emergency services during critical situations when its Portable Power team assisted numerous new and existing customers in Texas and Louisiana with emergency power generators during the freezing weather event in February. The Shreveport, Houston, Corpus Christi, and Odessa NOV field offices provided emergency power to an array of customers, including Texas government entities, local municipalities, and hospitals.

NOV was awarded a contract for an MPowerD™ managed-pressure-drilling (MPD) drilling campaign in West Africa starting later this year. NOV will provide critical engineering and field operations services, as the application requires a high-profile system to meet challenging well conditions with narrow drilling parameters.

NOV’s M/D Totco™ Downhole Broadband Solutions product line continued to expand the capabilities of the eVolve™ optimization and automation services. Customers saw the benefits of real-time, high-frequency along-string measurements in new applications of the eVolve service. A coring operator utilized the eVolve service to optimize parameters and prevent premature breaking of the core, as well as jamming in the core barrel. Additionally, IntelliServ™ Wired Drill Pipe (WDP) was used on subsea operations alongside a new third-party tool designed to eliminate the umbilical during well completions. The operator remotely controls the tool topside through a WDP interface, allowing them to eliminate significant amounts of equipment from the rig and reduce complex mechanical and hydraulic interfaces.

First Quarter Earnings Conference Call

NOV will hold a conference call to discuss its first quarter 2021 results on April 28, 2021 at 10:00 AM Central Time (11:00 AM Eastern Time). The call will be broadcast simultaneously at www.nov.com/investors. A replay will be available on the website for 30 days.

About NOV

NOV delivers technology-driven solutions to empower the global energy industry. For more than 150 years, NOV has pioneered innovations that enable its customers to safely produce abundant energy while minimizing environmental impact. The energy industry depends on NOV’s deep expertise and technology to continually improve oilfield operations and assist in efforts to advance the energy transition towards a more sustainable future. NOV powers the industry that powers the world.

Visit www.nov.com for more information.

Cautionary Statement for the Purpose of the “Safe Harbor” Provisions of the Private Securities Litigation Reform Act of 1995

Statements made in this press release that are forward-looking in nature are intended to be “forward-looking statements” within the meaning of Section 21E of the Securities Exchange Act of 1934 and may involve risks and uncertainties. These statements may differ materially from the actual future events or results. Readers are referred to documents filed by NOV Inc. with the Securities and Exchange Commission, including the Annual Report on Form 10-K, which identify significant risk factors which could cause actual results to differ from those contained in the forward-looking statements.

Certain prior period amounts have been reclassified in this press release to be consistent with current period presentation.

NOV INC.

CONSOLIDATED STATEMENTS OF INCOME (LOSS) (Unaudited)

(In millions, except per share data)


Three Months Ended


March 31,


December 31,


2021


2020


2020

Revenue:


Wellbore Technologies


$

413


$

691


$

373


Completion & Production Solutions


439


675


546


Rig Technologies


431


557


437


Eliminations


(34

)


(40

)


(29

)

Total revenue


1,249


1,883


1,327


Gross profit


156


224


(66

)

Gross profit %


12.5

%


11.9

%


-5.0

%


Selling, general, and administrative


244


283


235


Goodwill and indefinite-lived intangible asset impairment


1,378


Long-lived asset impairment


513


Operating loss


(88

)


(1,950

)


(301

)

Interest and financial costs


(20

)


(22

)


(19

)

Interest income


2


3


2


Equity loss in unconsolidated affiliates


(4

)


(233

)


(10

)

Other income (expense), net


(10

)


(3

)


2


Loss before income taxes


(120

)


(2,205

)


(326

)

Provision (benefit) for income taxes


(6

)


(156

)


22


Net loss


(114

)


(2,049

)


(348

)

Net (income) loss attributable to noncontrolling interests


1


(2

)


(1

)

Net loss attributable to Company


$

(115

)


$

(2,047

)


$

(347

)

Per share data:


Basic


$

(0.30

)


$

(5.34

)


$

(0.90

)

Diluted


$

(0.30

)


$

(5.34

)


$

(0.90

)

Weighted average shares outstanding:


Basic


385


383


385


Diluted


385


383


385


NOV INC.

CONSOLIDATED BALANCE SHEETS (Unaudited)

(In millions)


March 31,


December 31,


2021


2020


ASSETS


Current assets:


Cash and cash equivalents


$

1,607


$

1,692


Receivables, net


1,265


1,274


Inventories, net


1,357


1,408


Contract assets


577


611


Other current assets


190


224


Total current assets


4,996


5,209


Property, plant and equipment, net


1,894


1,927


Lease right-of-use assets


543


566


Goodwill and intangibles, net


2,011


2,020


Other assets


228


207


Total assets


$

9,672


$

9,929


LIABILITIES AND STOCKHOLDERS’ EQUITY


Current liabilities:


Accounts payable


$

467


$

489


Accrued liabilities


792


863


Contract liabilities


349


354


Current portion of lease liabilities


106


110


Current portion of long-term debt


182


Accrued income taxes


38


51


Total current liabilities


1,934


1,867


Lease liabilities


590


612


Long-term debt


1,669


1,834


Other liabilities


329


337


Total liabilities


4,522


4,650


Total stockholders’ equity


5,150


5,279


Total liabilities and stockholders’ equity


$

9,672


$

9,929


NOV INC.

CONSOLIDATED STATEMENTS OF CASH FLOWS (Unaudited)

(In millions)


Three Months Ended


March 31,


2021


2020

Cash flows from operating activities:


Net loss


$

(114

)


$

(2,049

)

Adjustments to reconcile net loss to net cash provided by operating activities:


Depreciation and amortization


79


105


Long-lived asset impairment


1,891


Working capital and other operating items, net


8


92


Net cash provided by (used by) operating activities


(27

)


39


Cash flows from investing activities:


Purchases of property, plant and equipment


(49

)


(68

)

Other


(2

)


15


Net cash used in investing activities


(51

)


(53

)


Cash flows from financing activities:


Borrowings against lines of credit and other debt


17


Cash dividends paid


(19

)

Other


(20

)


(24

)

Net cash used in financing activities


(3

)


(43

)

Effect of exchange rates on cash


(4

)


1


Decrease in cash and cash equivalents


(85

)


(56

)

Cash and cash equivalents, beginning of period


1,692


1,171


Cash and cash equivalents, end of period


$

1,607


$

1,115


NOV INC.

RECONCILIATION OF ADJUSTED EBITDA TO NET INCOME (LOSS) (Unaudited)

(In millions)


The Company discloses Adjusted EBITDA (defined as Operating Profit excluding Depreciation, Amortization and, when applicable, Other Items) in its periodic earnings press releases and other public disclosures to provide investors additional information about the results of ongoing operations. The Company uses Adjusted EBITDA internally to evaluate and manage the business. Adjusted EBITDA is not intended to replace GAAP financial measures, such as Net Income. Other items include impairment charges, inventory charges and severance and other restructuring costs.


Three Months Ended


March 31,


December 31,


2021


2020


2020

Operating loss:


Wellbore Technologies


$

(14

)


$

(663

)


$

(78

)

Completion & Production Solutions


(17

)


(1,013

)


(31

)

Rig Technologies


(8

)


(202

)


(132

)

Eliminations and corporate costs


(49

)


(72

)


(60

)

Total operating loss


$

(88

)


$

(1,950

)


$

(301

)


Other items:


Wellbore Technologies


$

6


$

715


$

46


Completion & Production Solutions


(2

)


1,054


43


Rig Technologies


3


238


132


Corporate


2


16


15


Total other items


$

9


$

2,023


$

236


Depreciation & amortization:


Wellbore Technologies


$

42


$

51


$

44


Completion & Production Solutions


15


30


16


Rig Technologies


18


20


19


Corporate


4


4


3


Total depreciation & amortization


$

79


$

105


$

82


Adjusted EBITDA:


Wellbore Technologies


$

34


$

103


$

12


Completion & Production Solutions


(4

)


71


28


Rig Technologies


13


56


19


Eliminations and corporate costs


(43

)


(52

)


(42

)

Total Adjusted EBITDA


$


$

178


$

17


Reconciliation of Adjusted EBITDA:


GAAP net loss attributable to Company


$

(115

)


$

(2,047

)


$

(347

)

Noncontrolling interests


1


(2

)


(1

)

Provision (benefit) for income taxes


(6

)


(156

)


22


Interest expense


20


22


19


Interest income


(2

)


(3

)


(2

)

Equity loss in unconsolidated affiliate


4


233


10


Other (income) expense, net


10


3


(2

)

Depreciation and amortization


79


105


82


Other items


9


2,023


236


Total Adjusted EBITDA


$


$

178


$

17


Contacts

Blake McCarthy
Vice President, Corporate Development and Investor Relations
(713) 815-3535
This email address is being protected from spambots. You need JavaScript enabled to view it.

SAN FRANCISCO--(BUSINESS WIRE)--A survey by GHD, one of the world’s leading professional services companies, has found that only 42% of U.S. and 47% of Canadian consumers believe governments are meeting their responsibilities to achieve net zero by 2050. There is also a low level of confidence in society (43% U.S./41% Canada) and businesses (42% U.S./38% Canada) to meet this goal.


With so much societal upheaval having occurred since the start of the pandemic, GHD surveyed over 3,000 people across the U.S. and Canada as part of a global survey to assess how changing attitudes and behaviors will reshape the energy world.

The global shutdown has changed consumers’ environmental consciousness and puts their demand for greener lifestyle choices – and the clean energy transition already underway – into overdrive. If we are to make a successful shift to net zero, it is crucial the public and private sectors work together with consumers to shape a joint vision for how our world needs to operate. The more we commit to the transition and invest in greener technologies and lifestyles, the more momentum will build,” said Dr. Tej Gidda, Future Energy Global Leader at GHD.

The Electric Vehicle Revolution Is Supercharging

Consumers across North America are open and enthusiastic about embracing electric vehicles (EVs) as part of the global energy transition. The survey found:

  • 16% of U.S. respondents and 7% of Canadian respondents already drive a hybrid/plug-in hybrid or fully electric vehicle.
  • That number is expected to grow, with nearly half of Americans (45%) and Canadians (46%) considering an EV purchase in the next five years.

However, one of the biggest barriers to increased EV uptake is the concern about the electric charging infrastructure needed to support widespread adoption.

  • 39% of U.S. respondents are concerned they will not be able to access reliable charging infrastructure locally and 28% are worried they will not be able to install a charger at home.
  • Amongst Canadians, that concern is even greater, with 42% concerned about access to local charging infrastructure and 35% apprehensive about their ability to install a charger at home.

With 75% of U.S. and 71% of Canadian respondents saying they’ll travel by car the same amount or more as before the pandemic, increasing the use of EVs will be critical to helping lower transportation emissions,” commented Maria Lehman, GHD’s U.S. Infrastructure Leader.President Biden’s American Jobs Plan calls for a $174 billion investment in EVs and charging infrastructure, and in the past year, the Canadian government and auto manufacturers have announced billions of dollars of stimulus investments to transition to EVs. While this is an important step, further EV adoption will take continued partnerships and radical collaboration between industry and government in both countries.”

Going Green: Consumers Are Focused on Sustainability

The pandemic has made consumers more aware of the environment. As a result, they’re willing to make changes to live a more sustainable life and expect businesses and governments to do the same. Survey results found:

  • Consumers have become more aware of the environment than they were pre-pandemic (59% U.S./57% Canada), with 86% of Americans and 87% of Canadians agreeing that we all have a responsibility to help the planet become more sustainable.
  • Respondents in the U.S. (56%) and Canada (55%) are looking for their local government to prioritize greener public transportation over personal transportation investments.
  • They also have high expectations for the brands they support, with 64% of respondents in the U.S. and 67% in Canada saying green issues will be an important consideration when determining which brands to buy goods/services from following the pandemic.

The survey also found both U.S. and Canadian residents have considered moving homes due to the pandemic.

  • 32% of both Americans and Canadians want to live in an environment with cleaner air.
  • 30% of respondents in the U.S. and 34% in Canada cited the desire to move to have more access to nature.

The Future of Work

As a result of the pandemic, 78% of American and 82% of Canadian respondents believe their daily habits will change over the long term. This includes how they work and live – which will ultimately change the energy landscape.

  • Going forward, 37% of U.S. and 36% of Canadian respondents expect to work from home more than they did before the pandemic.
  • Residents of both countries expect to spend an average of three hours or more online each day.
  • 30% of Americans and 15% of Canadians surveyed said their employer’s green credentials impacted their decision about whether to become an employee and would consider those factors when choosing a future employer.

The shifting workplace dynamics will permanently change how we think about everything – from transportation and digital infrastructure to how we configure our cities and office spaces,” said Greg Carli, Sustainability, Resilience & ESG Advisory Leader at GHD. These changes will significantly impact how energy is consumed and distributed over a 24-hour period to respond to growing requirements for lighting and consuming more data at home, as well as supporting domestic cooling systems in the summer and heating poorly insulated homes every day throughout the colder months. The challenge for businesses and governments will be to quickly adapt and transition to a re-imagined work and energy model that sustainably meets these new needs.”

Each of these changes will have a sizeable impact on the way our society consumes energy – from increasing renewable energy to mitigate the environmental impact of rapidly growing electricity consumption to ensuring the right EV charging infrastructure is available to those who need it. A great deal of work and investment is required to meet our net zero carbon obligations by 2050.

As highlighted by the relatively low confidence scores given by the wider public, governments, businesses, and consumers now need to commit to the transition and use the hiatus of 2020 as a springboard to a cleaner energy future. This means not merely putting strategies in place but acting on them quickly.

GHD’s whitepaper on the survey findings, entitled “The World of Energy Post-COVID,” can be found here.

Methodology:

The survey was conducted among 8,041 consumers within the U.K., US, Canada, Australia, New Zealand and Singapore. At an overall level, results are accurate to ± 1.1% at 95% confidence limits, assuming a result of 50%. The interviews were conducted online by Sapio Research in February 2021 using an email invitation and an online survey.

About GHD:

GHD is a leading professional services company operating in the global markets of water, energy and resources, environment, property and buildings, and transportation. Committed to a vision to make water, energy and urbanization sustainable for generations to come, GHD delivers engineering, architecture, environmental and construction solutions to public and private sector clients. Established in 1928 and privately owned by its people, GHD’s network of 10,000+ specialists are connected across 200 offices located in five continents and the Pacific region. www.ghd.com


Contacts

PR Advisors

U.S.
Jennifer Pflieger
M (212) 446-1866
E This email address is being protected from spambots. You need JavaScript enabled to view it.
W www.ghd.com/futureenergy

Canada
Kathleen Munro
M (902) 789-3165
E This email address is being protected from spambots. You need JavaScript enabled to view it.
W www.ghd.com/futureenergy

DENVER--(BUSINESS WIRE)--Liberty Oilfield Services Inc. (NYSE: LBRT; “Liberty” or the “Company”) announced today first quarter 2021 financial and operational results.


Summary Results and Highlights

  • Revenue of $552 million and net loss1 of $39 million, or $0.21 fully diluted loss per share, for the quarter ended March 31, 2021
  • Adjusted EBITDA2 of $32 million
  • Completed the first full quarter after the OneStim® acquisition, integration proceeding well
  • Enhanced our platform as a fully integrated completion services, engineering and diagnostics company, doubling our size with expanded services, basins and entering Canada
  • digiFrac™ field testing to commence with key partner next month following successful high-pressure durability testing in the first quarter
  • Implemented next generation of proprietary SonicStrap chemical management automation system
  • Launched FracSense™ diagnostic service

“Liberty delivered an excellent first quarter. The highly accretive acquisition of Schlumberger’s North American frac, pumpdown-perforating wireline and Permian frac sand businesses (OneStim®) strengthened our business and technology leadership. Our team handled the challenges of a large-scale integration and delivered a seamless transition for our customers. We were pleased to see early benefits from leveraging our full suite of completions services, including frac, wireline and sand, along with our top tier engineering and diagnostics tools, driving increased engagement with customers. I am proud of the Liberty team for executing at the highest level,” commented Chris Wright, Chief Executive Officer.

Mr. Wright continued, “The acquisition is transformative for Liberty and the oilfield services industry. We plan to build on the success of the first quarter with our technological advantages, an integrated suite of completion services and a highly motivated team of men and women at Liberty rising to the challenge. The investments we made through the cycle further accelerate our ability to support our customers in the next stage of the shale revolution. We are excited to bolster our frac technology leadership with rapid progress on our new electric frac fleet, digiFrac, expanded frac automation, and a new downhole real-time frac measurement service, FracSense. A year on from the onset of the global pandemic, the fundamentals of our industry are on an upward trajectory, and we believe our compelling strategy will drive the next phase of the Liberty story.”

Outlook

Buoyed by worldwide vaccine distribution campaigns together with fiscal and monetary stimulus, global economic growth expectations are increasingly more constructive. A rise in energy demand has paralleled the economic recovery, with strong leading economic indicators suggesting that these trends should continue. There is still risk driven by the resurgent virus spread in India, Brazil and several European countries which has led to a reinstatement of containment measures, unlike the U.S. and U.K. where another wave of the Covid pandemic has been kept at bay. A tightening in oil supply and demand has developed, with a steady draw of global oil inventory signifying that increased OPEC+ production is largely being absorbed by higher global demand.

Over the last three quarters North American frac activity has rapidly increased towards supporting maintenance production levels. Hence public exploration and production (“E&P”) companies have now reached roughly maintenance run-rate frac activity for 2021. Private E&P companies, on the other hand, are more responsive to current oil and gas prices which continue to support modestly increasing demand for frac services, in line with their recent rise in rig activity. Importantly, E&P companies are maintaining capital discipline and moderating long-term growth aiming to increase commodity price stability and enhance sector attractiveness. This fundamental change in philosophy should impact positively the entire value chain, leading to a disciplined phase in North American energy development.

As E&P economics have substantially improved with WTI crude oil prices stabilizing in the $60 range, Liberty’s customers are becoming more comfortable with the necessity to incorporate a phased approach to price increases. Frac industry underinvestment has accelerated attrition of older equipment. Importantly, the market for next generation equipment has tightened, and the market for next generation equipment with industry leading operations and technology innovation is even tighter.

“The economic realities of the last twelve months has led E&P companies to demand higher performing frac partners with top notch expertise, operational efficiency, technology, and ESG leadership. As the leading technology-centric service provider, we see a pathway to normalized margins at some point in 2022 for Liberty,” commented Mr. Wright. “The demand pull for next generation equipment with engineering and diagnostics is strong. Pricing dynamics are improving, technology-driven efficiency gains in automation and design are rising, and underinvestment in equipment and technology has led to a more concentrated market of service companies that can accommodate the sophisticated needs of our E&P partners. We are excited to lead the industry into the next phase of innovation in the completions sector.”

First Quarter Results

For the first quarter of 2021, revenue increased 114% to $552 million from $258 million in the fourth quarter of 2020.

Net loss before income taxes totaled $46 million for the first quarter of 2021 compared to net loss before income taxes of $58 million for the fourth quarter of 2020.

Net loss1 (after taxes) totaled $39 million for the first quarter of 2021 compared to net loss1 (after taxes) of $48 million in the fourth quarter of 2020.

Adjusted EBITDA2 increased 345% to $32 million from $7 million in the fourth quarter. Please refer to the reconciliation of Adjusted EBITDA (a non-GAAP measure) to net income (a GAAP measure) in this earnings release.

Fully diluted loss per share was $0.21 for the first quarter of 2021 compared to $0.41 for the fourth quarter of 2020.

Balance Sheet and Liquidity

As of March 31, 2021, Liberty had cash on hand of $70 million, approximately flat from fourth quarter levels, and total debt of $106 million, net of deferred financing costs and original issue discount. There were no borrowings drawn on the ABL credit facility, and total liquidity, including availability under the credit facility, was $258 million based on the financial statements as of March 31, 2021.

Conference Call

Liberty will host a conference call to discuss the results at 8:00 a.m. Mountain Time (10:00 a.m. Eastern Time) on Wednesday, April 28, 2021. Presenting Liberty’s results will be Chris Wright, Chief Executive Officer, Ron Gusek, President, and Michael Stock, Chief Financial Officer.

Individuals wishing to participate in the conference call should dial (833) 255-2827, or for international callers (412) 902-6704. Participants should ask to join Liberty’s call. A live webcast will be available at http://investors.libertyfrac.com. The webcast can be accessed for 90 days following the call. A telephone replay will be available shortly after the call and can be accessed by dialing (877) 344-7529, or for international callers (412) 317-0088. The passcode for the replay is 10148920. The replay will be available until May 5, 2021.

About Liberty

Liberty is a leading North American oilfield services firm that offers one of the most innovative suites of completion services and technologies to onshore oil and natural gas exploration and production companies. Liberty was founded in 2011 with a relentless focus on developing and delivering next generation technology for the sustainable development of unconventional energy resources in partnership with our customers. Liberty is headquartered in Denver, Colorado. For more information about Liberty, please contact Investor Relations at This email address is being protected from spambots. You need JavaScript enabled to view it..

1

Net loss attributable to controlling and non-controlling interests.

2

“Adjusted EBITDA” is not presented in accordance with generally accepted accounting principles in the United States (“U.S. GAAP”). Please see the supplemental financial information in the table under “Reconciliation of Net Income to EBITDA and Adjusted EBITDA” at the end of this earnings release for a reconciliation of the non-GAAP financial measure of Adjusted EBITDA to its most directly comparable GAAP financial measure.

Non-GAAP Financial Measures

This earnings release includes unaudited non-GAAP financial and operational measures, including EBITDA, Adjusted EBITDA and Pre-Tax Return on Capital Employed. We believe that the presentation of these non-GAAP financial and operational measures provides useful information about our financial performance and results of operations. Non-GAAP financial and operational measures do not have any standardized meaning and are therefore unlikely to be comparable to similar measures presented by other companies. The presentation of non-GAAP financial and operational measures is not intended to be a substitute for, and should not be considered in isolation from, the financial measures reported in accordance with U.S. GAAP. See the tables entitled Reconciliation and Calculation of Non-GAAP Financial and Operational Measures for a reconciliation or calculation of the non-GAAP financial or operational measures to the most directly comparable GAAP measure.

Forward-Looking and Cautionary Statements

The information above includes “forward-looking statements” within the meaning of Section 27A of the Securities Act of 1933, as amended, and Section 21E of the Securities Exchange Act of 1934, as amended. All statements, other than statements of historical facts, included herein concerning, among other things, the deployment of fleets in the future, planned capital expenditures, future cash flows and borrowings, pursuit of potential acquisition opportunities, our financial position, return of capital to stockholders, business strategy and objectives for future operations, are forward-looking statements. These forward-looking statements are identified by their use of terms and phrases such as “may,” “expect,” “estimate,” “outlook,” “project,” “plan,” “believe,” “intend,” “achievable,” “anticipate,” “will,” “continue,” “potential,” “likely,” “should,” “could,” and similar terms and phrases. Although we believe that the expectations reflected in these forward-looking statements are reasonable, they do involve certain assumptions, risks and uncertainties. These forward-looking statements represent our expectations or beliefs concerning future events, and it is possible that the results described in this earnings release will not be achieved. These forward-looking statements are subject to certain risks, uncertainties and assumptions identified above or as disclosed from time to time in Liberty's filings with the Securities and Exchange Commission. As a result of these factors, actual results may differ materially from those indicated or implied by such forward-looking statements.

Any forward-looking statement speaks only as of the date on which it is made, and, except as required by law, we do not undertake any obligation to update or revise any forward-looking statement, whether as a result of new information, future events or otherwise. New factors emerge from time to time, and it is not possible for us to predict all such factors. When considering these forward-looking statements, you should keep in mind the risk factors and other cautionary statements in “Item 1A. Risk Factors” included in our Annual Report on Form 10-K for the year ended December 31, 2020 as filed with the SEC on February 24, 2021 and in our other public filings with the SEC. These and other factors could cause our actual results to differ materially from those contained in any forward-looking statements.

Liberty Oilfield Services Inc.

Selected Financial Data

(unaudited)


Three Months Ended


March 31,


December 31,


March 31,


2021


2020


2020

Statement of Income Data:


(amounts in thousands, except for per share data)

Revenue


$

552,032


$

257,586


$

472,344


Costs of services, excluding depreciation and amortization shown separately


498,935


236,510


392,716


General and administrative


26,359


20,114


28,613


Transaction, severance and other costs


7,621


9,395


Depreciation and amortization


62,056


45,826


44,831


(Gain) loss on disposal of assets


(720

)


109


(102

)


Total operating expenses


594,251


311,954


466,058


Operating (loss) income


(42,219

)


(54,368

)


6,286


Interest expense, net


3,754


3,646


3,608


Net (loss) income before taxes


(45,973

)


(58,014

)


2,678


Income tax (benefit) expense


(7,357

)


(9,783

)


261


Net (loss) income


(38,616

)


(48,231

)


2,417


Less: Net (loss) income attributable to noncontrolling interests


(4,411

)


(11,201

)


697


Net (loss) income attributable to Liberty Oilfield Services Inc. stockholders


$

(34,205

)


$

(37,030

)


$

1,720


Net (loss) income attributable to Liberty Oilfield Services Inc. stockholders per common share:


Basic


$

(0.21

)


$

(0.41

)


$

0.02


Diluted


$

(0.21

)


$

(0.41

)


$

0.02


Weighted average common shares outstanding:


Basic


163,207


91,026


81,651


Diluted (1)


163,207


91,026


114,952


Other Financial and Operational Data


Capital expenditures (2)


$

41,938


$

23,961


$

32,888


Adjusted EBITDA (3)


$

31,685


$

7,124


$

57,662


(1)

In accordance with U.S. GAAP, diluted weighted average common shares outstanding for the three months ended March 31, 2021 and December 31, 2020, exclude weighted average shares of Class B common stock (16,333 and 21,970, respectively), restricted shares (0 and 79, respectively) and restricted stock units (3,326 and 2,507, respectively) outstanding during the period.

(2)

Capital expenditures presented above are shown on an as incurred basis, including capital expenditures in accounts payable and accrued liabilities.

(3)

Adjusted EBITDA is a non-GAAP financial measure. See the tables entitled “Reconciliation and Calculation of Non-GAAP Financial and Operational Measures” below.


Liberty Oilfield Services Inc.

Condensed Consolidated Balance Sheets

(unaudited, amounts in thousands)


March 31,


December 31,


2021


2020

Assets


Current assets:


Cash and cash equivalents

$

69,534


$

68,978


Accounts receivable and unbilled revenue

336,464


313,949


Inventories

129,338


118,568


Prepaids and other current assets

47,887


65,638


Total current assets

583,223


567,133


Property and equipment, net

1,105,938


1,120,950


Operating and finance lease right-of-use assets

106,151


114,611


Deferred tax asset

43,514


5,360


Other assets

77,949


81,888


Total assets

$

1,916,775


$

1,889,942


Liabilities and Equity


Current liabilities:


Accounts payable

$

184,799


$

193,338


Accrued liabilities

166,193


118,383


Current portion of operating and finance lease liabilities

42,187


44,061


Current portion of long-term debt, net of discount

370


364


Total current liabilities

393,549


356,146


Long-term debt, net of discount

105,317


105,411


Long-term operating and finance lease liabilities

55,506


61,748


Payable pursuant to tax receivable agreement

84,668


56,594


Total liabilities

639,040


579,899


Stockholders’ equity:


Common Stock

1,795


1,795


Additional paid in capital

1,212,354


1,125,554


(Accumulated deficit) retained earnings

(10,915

)


23,288


Accumulated other comprehensive income

1,318


Total stockholders’ equity

1,204,552


1,150,637


Noncontrolling interest

73,183


159,406


Total equity

1,277,735


1,310,043


Total liabilities and equity

$

1,916,775


$

1,889,942


Liberty Oilfield Services Inc.

Reconciliation and Calculation of Non-GAAP Financial and Operational Measures

(unaudited, amounts in thousands)

Reconciliation of Net Income to EBITDA and Adjusted EBITDA


Three Months Ended


March 31,


December 31,


March 31,


2021


2020


2020

Net (loss) income

$

(38,616

)


$

(48,231

)


$

2,417


Depreciation and amortization

62,056


45,826


44,831


Interest expense, net

3,754


3,646


3,608


Income tax (benefit) expense

(7,357

)


(9,783

)


261


EBITDA

$

19,837


$

(8,542

)


$

51,117


Stock based compensation expense

4,947


4,245


4,124


Fleet start-up and lay-down costs


1,718


Asset acquisition costs

7,621


6,997


(Gain) loss on disposal of assets

(720

)


109


(102

)


Provision for credit losses


199


2,523


Non-recurring payroll expense


2,398


Adjusted EBITDA

$

31,685


$

7,124


$

57,662


Calculation of Pre-Tax Return on Capital Employed


Twelve Months Ended


March 31, 2021


2021


2020

Net loss

$

(201,707

)


Add back: Income tax benefit

(38,475

)


Pre-tax net loss

$

(240,182

)


Capital Employed


Total debt, net of discount

$

105,687


$

106,039


Total equity

1,277,735


781,453


Total Capital Employed

$

1,383,422


$

887,492


Average Capital Employed (1)

$

1,135,457


Pre-Tax Return on Capital Employed (2)

(21

)

%


(1)

Average Capital Employed is the simple average of Total Capital Employed as of March 31, 2021 and 2020.

(2)

Pre-tax Return on Capital Employed is the ratio of pre-tax net loss for the twelve months ended March 31, 2021 to Average Capital Employed.


Contacts

Michael Stock
Chief Financial Officer
303-515-2851
This email address is being protected from spambots. You need JavaScript enabled to view it.

Lee Constable to host premier clean technology podcast covering pertinent trends and innovations across a variety of industries

TORONTO--(BUSINESS WIRE)--Li-Cycle Corp. (“Li-Cycle” or “the Company”), an industry leader in lithium-ion battery resource recovery and the largest lithium-ion battery recycler in North America, today announced that it has launched The Green-Cycle Podcast, featuring the latest news, trends, and innovations in clean technology.


The Green-Cycle Podcast hosted by Lee Constable, a notable TV personality and professional science communicator, made its official debut today with its first episode discussing the importance of lithium-ion battery recycling and resource recovery with Li-Cycle’s Co-founders Ajay Kochhar and Tim Johnston. The Green-Cycle Podcast is easily accessible and listeners can find episodes on The Green-Cycle Podcast webpage, in the Podcasts section on Li-Cycle’s website and on platforms such as Apple Podcasts and Spotify.

“We are excited to launch our brand-new Green-Cycle podcast in celebration of Earth Month as part of our efforts to promote sustainability and showcase innovations in clean technology,” said Ajay Kochhar, President, CEO and Co-founder of Li-Cycle. “This will be a great platform for clean tech leaders to share their ideas and initiatives through discussions on how companies and people can make a truly positive impact on our environment.”

The Green-Cycle Podcast releases episodes monthly featuring a range of clean tech guests and experts. Inquiries into how to become a future guest are encouraged; those interested in becoming part of the conversation should reach out to: This email address is being protected from spambots. You need JavaScript enabled to view it.

On February 16, 2021, Li-Cycle announced its entry into a definitive business combination agreement with Peridot Acquisition Corp. (NYSE: PDAC) (“Peridot”). Upon the closing of the business combination, which is expected in the second quarter of 2021, the combined company will be named Li-Cycle Holdings Corp. Li-Cycle intends to apply to list the common shares of the combined company on the New York Stock Exchange under the new ticker symbol, “LICY.”

ABOUT LI‑CYCLE CORP.

Li-Cycle is on a mission to leverage its innovative Spoke & Hub Technologies™ to provide a customer-centric, end-of-life solution for lithium-ion batteries, while creating a secondary supply of critical battery materials. Lithium-ion rechargeable batteries are increasingly powering our world in automotive, energy storage, consumer electronics, and other industrial and household applications. The world needs improved technology and supply chain innovations to better manage battery manufacturing waste and end-of-life batteries and to meet the rapidly growing demand for critical and scarce battery-grade raw materials through a closed-loop solution. For more information, please visit https://li-cycle.com/.

ADDITIONAL INFORMATION AND WHERE TO FIND IT

In connection with the proposed transaction involving Li-Cycle and Peridot, Newco has prepared and filed with the U.S. Securities and Exchange Commission (the “SEC”) a registration statement on Form F-4 that includes both a prospectus of Newco and a proxy statement of Peridot (the “Proxy Statement/Prospectus”). Once effective, Peridot will mail the Proxy Statement/Prospectus to its shareholders and file other documents regarding the proposed transaction with the SEC. This communication is not a substitute for any proxy statement, registration statement, proxy statement/prospectus or other documents Peridot or Newco may file with the SEC in connection with the proposed transaction. INVESTORS AND SECURITY HOLDERS ARE URGED TO READ CAREFULLY AND IN THEIR ENTIRETY THE PROXY STATEMENT/PROSPECTUS WHEN IT BECOMES AVAILABLE, ANY AMENDMENTS OR SUPPLEMENTS TO THE PROXY STATEMENT/PROSPECTUS, AND OTHER DOCUMENTS FILED BY PERIDOT OR NEWCO WITH THE SEC IN CONNECTION WITH THE PROPOSED TRANSACTION BECAUSE THESE DOCUMENTS WILL CONTAIN IMPORTANT INFORMATION. Investors and security holders will be able to obtain free copies of the Proxy Statement/Prospectus and other documents filed with the SEC by Peridot or Newco through the website maintained by the SEC at www.sec.gov.

Investors and securityholders will also be able to obtain free copies of the documents filed by Peridot and/or Newco with the SEC on Peridot’s website at www.peridotspac.com or by emailing This email address is being protected from spambots. You need JavaScript enabled to view it..

PARTICIPANTS IN THE SOLICITATION

Li-Cycle, Peridot, Newco, and certain of their respective directors, executive officers and employees may be deemed to be participants in the solicitation of proxies in connection with the proposed Business Combination. Information regarding the persons who may, under the rules of the SEC, be deemed participants in the solicitation of proxies in connection with the proposed Business Combination, including a description of their direct or indirect interests, by security holdings or otherwise, are set forth in the Proxy Statement/Prospectus. Information regarding the directors and executive officers of Peridot is contained in Peridot’s Annual Report on Form 10-K for the year ended December 31, 2020, filed with the SEC on March 26, 2021 and certain of its Current Reports filed on Form 8-K. These documents can be obtained free of charge from the sources indicated above.

NO OFFER OR SOLICITATION

This communication does not constitute an offer to sell or the solicitation of an offer to buy any securities of Li-Cycle, Peridot or Newco or a solicitation of any vote or approval. No offer of securities shall be made except by means of a prospectus meeting the requirements of Section 10 of the Securities Act of 1933, as amended.

CAUTION CONCERNING FORWARD‑LOOKING STATEMENTS

Certain statements contained in this communication may be considered forward-looking statements within the meaning of the U.S. Private Securities Litigation Reform Act of 1995, Section 27A of the Securities Act of 1933, as amended, and Section 21 of the Securities Exchange Act of 1934, as amended, including statements regarding the proposed transaction involving Li-Cycle and Peridot and the ability to consummate the proposed transaction. Forward-looking statements generally include statements that are predictive in nature and depend upon or refer to future events or conditions, and include words such as “may,” “will,” “should,” “would,” “expect,” “anticipate,” “plan,” “likely”, “believe,” “estimate,” “project,” “intend,” and other similar expressions among others. Statements that are not historical facts are forward-looking statements. Forward-looking statements are based on current beliefs and assumptions that are subject to risks and uncertainties and are not guarantees of future performance. Actual results could differ materially from those contained in any forward-looking statement as a result of various factors, including, without limitation: (i) the risk that the conditions to the closing of the proposed transaction are not satisfied, including the failure to timely or at all obtain shareholder approval for the proposed transaction or the failure to timely or at all obtain any required regulatory clearances, including under the Hart-Scott Rodino Antitrust Improvements Act; (ii) uncertainties as to the timing of the consummation of the proposed transaction and the ability of each of Li-Cycle and Peridot to consummate the proposed transaction; (iii) the possibility that other anticipated benefits of the proposed transaction will not be realized, and the anticipated tax treatment of the combination; (iv) the occurrence of any event that could give rise to termination of the proposed transaction; (v) the risk that stockholder litigation in connection with the proposed transaction or other settlements or investigations may affect the timing or occurrence of the proposed transaction or result in significant costs of defense, indemnification and liability; (vi) changes in general economic and/or industry specific conditions; (vii) possible disruptions from the proposed transaction that could harm Li-Cycle’s business; (viii) the ability of Li-Cycle to retain, attract and hire key personnel; (ix) potential adverse reactions or changes to relationships with customers, employees, suppliers or other parties resulting from the announcement or completion of the proposed transaction; (x) potential business uncertainty, including changes to existing business relationships, during the pendency of the proposed transaction that could affect Li-Cycle’s financial performance; (xi) legislative, regulatory and economic developments; (xii) unpredictability and severity of catastrophic events, including, but not limited to, acts of terrorism, outbreak of war or hostilities and any epidemic, pandemic or disease outbreak (including COVID-19), as well as management’s response to any of the aforementioned factors; and (xiii) other risk factors as detailed from time to time in Peridot’s reports filed with the SEC, including Peridot’s annual report on Form 10-K, periodic quarterly reports on Form 10-Q, periodic current reports on Form 8-K and other documents filed with the SEC. The foregoing list of important factors is not exclusive. Neither Li-Cycle nor Peridot can give any assurance that the conditions to the proposed transaction will be satisfied. Except as required by applicable law, neither Li-Cycle nor Peridot undertakes any obligation to revise or update any forward-looking statement, or to make any other forward-looking statements, whether as a result of new information, future events or otherwise.


Contacts

Investor Relations: This email address is being protected from spambots. You need JavaScript enabled to view it.
Press: This email address is being protected from spambots. You need JavaScript enabled to view it.

KYOTO, Japan--(BUSINESS WIRE)--Kyocera Corporation (TOKYO:6971) today announced its consolidated financial results for the fiscal year ended March 31, 2021 (“fiscal year 2021” or “the period”), as summarized below. Complete details are available at: https://global.kyocera.com/ir/library/f_results.html


Consolidated Results: Year-Over-Year

Unit: Millions (except percentages and per-share amounts)
Year Ended March 31,

2020
(FY20)
in JPY

2021
(FY21)
in JPY

Change

2021
(FY21)
in USD

2021
(FY21)
in EUR

Amount
in JPY

%

Sales revenue:

1,599,053

1,526,897

(72,156

)

(4.5

)

13,756

11,745

Operating profit:

100,193

70,644

(29,549

)

(29.5

)

636

543

Profit before income taxes:

148,826

117,559

(31,267

)

(21.0

)

1,059

904

Profit attributable to owners of
the parent:

107,721

90,214

(17,507

)

(16.3

)

813

694

Earnings per share attributable
to owners of the parent (basic):

297.36

248.91


2.24

1.91

Note on exchange rates: U.S. dollar (USD) and euro (EUR) conversions are provided above as a convenience to the reader, based on the rates of USD1 = JPY111 and EUR1 = JPY130, rounded to the nearest unit (as of March 31, 2021)

Summary

Sales revenue and profit both decreased compared to fiscal year 2020 results, due primarily to the economic slowdown caused by the COVID-19 pandemic. In the Components Business, sales revenue increased slightly over the prior year due to M&A revenue contributions and increased demand for components used in semiconductor and 5G-related markets, which collectively offset a sharp first-quarter drop in demand from the automotive-related market. However, sales revenue decreased in the Equipment and Systems Business. As a result, consolidated sales revenue for fiscal year 2021 totaled JPY1,526,897 (USD13,756) million, a decrease of 4.5% from the prior year.

Profit decreased due to decreased sales revenue, increased depreciation charges, and the recording of a one-time impairment loss in the smart energy business. As a result, in comparison with the prior year, operating profit decreased by JPY29,549 (USD266) million, or 29.5%, to JPY70,644 (USD636) million; profit before income taxes decreased by JPY31,267 (USD282) million, or 21.0%, to JPY117,559 (USD1,059) million; and profit attributable to owners of the parent decreased by JPY17,507 (USD158) million, or 16.3%, to JPY90,214 (USD813) million.

Average exchange rates for the period show the Japanese yen strengthened by 2.8% against the U.S. dollar, to JPY106, and weakened by 2.5% against euro, to JPY124. As a result, sales revenue was pushed down by approximately JPY9 billion (USD81 million) compared to the prior year.

Consolidated Financial Highlights: Fourth Quarter

Unit: Millions (except percentages)
Three Months Ended March 31,
2020
(FY20-Q4)
in JPY
2021
(FY21-Q4)
in JPY
Change 2021
(FY21-Q4)
in USD
2021
(FY21-Q4)
in EUR
Amount
in JPY
%
Sales revenue:

402,168

426,363

24,195


6.0


3,841

3,280

Operating profit:

5,333

27,661

22,328


418.7


249

213

Profit before income taxes:

7,197

30,343

23,146


321.6


273

233

Profit attributable to owners of
the parent:

6,456

26,283

19,827


307.1


237

202

(See note above regarding exchange rates.)

Consolidated Forecasts: Year Ending March 31, 2022

Although future economic conditions and the COVID-19 pandemic remain shrouded in uncertainty, the global economy is expected to improve in the fiscal year ending March 31, 2022 as a result of better COVID-19 prevention measures, stimulus policies, and the gradual reopening of major economies worldwide. The company will strive to expand its Components Business by enhancing its manufacturing systems to increase production capacity for components that support 5G wireless communication, semiconductor processing equipment and packaging, and Advanced Driver Assistance Systems (ADAS), all of which will rise in demand as digitization advances. In the Solutions Business, the company will focus on aggressively developing new products and businesses, particularly in the Document Solutions Business. In addition to these efforts, the company will introduce automated production lines utilizing AI and robots to further improve productivity across Kyocera group companies. With the above strategies, Kyocera aims to seek record sales and to improve profitability in the next fiscal year. We expect exchange rates of JPY105 to the U.S. dollar and JPY125 to the euro during the fiscal year ending March 31, 2022.

Unit: Yen in millions (except percentages, per-share amounts and exchange rates)
Fiscal 2021
Results
Fiscal 2022
Forecasts
Change
(%) from
Fiscal 2021
Results
 
Sales revenue:

1,526,897

1,730,000

13.3

Operating profit:

70,644

117,000

65.6

Profit before income taxes:

117,559

160,000

36.1

Profit attributable to owners of the parent:

90,214

113,000

25.3

Earnings per share attributable to owners of the parent (basic):

248.91

311.78

*

-

Average USD exchange rate:

106

105

-

Average EUR exchange rate:

124

125

-

*Based on the average number of shares outstanding during the year ended March 31, 2021

Forward‐Looking Statements

Please refer to https://global.kyocera.com/ir/disclaimer.html

About KYOCERA

Kyocera Corporation (TOKYO:6971, https://global.kyocera.com/), the parent and global headquarters of the Kyocera Group, was founded in 1959 as a producer of fine ceramics (also known as “advanced ceramics”). By combining these engineered materials with metals and integrating them with other technologies, Kyocera has become a leading supplier of industrial and automotive components, semiconductor packages, electronic devices, smart energy systems, printers, copiers, and mobile phones. Kyocera is ranked #549 on Forbes magazine’s 2020 “Global 2000” list of the world’s largest publicly traded companies, and appears on The Wall Street Journal’s latest list of “The World’s 100 Most Sustainably Managed Companies.”


Contacts

KYOCERA Corporation (Japan), Corporate Communications
Kenichi Hara, Tel: +81-(0)75-604-3514 Fax: +81-(0)75-604-3516
This email address is being protected from spambots. You need JavaScript enabled to view it.

PRINCETON, N.J.--(BUSINESS WIRE)--NRG Energy, Inc. (NYSE:NRG) plans to report its First Quarter 2021 financial results on Thursday, May 6, 2021. Management will present the results during a conference call and webcast at 9:00 a.m. Eastern.

A live webcast of the conference call, including presentation materials, can be accessed through NRG’s website at http://www.nrg.com and clicking on “Presentations & Webcasts” in the “Investors” section found at the top of the home page. The webcast will be archived on the site for those unable to listen in real time.

About NRG Energy

At NRG, we’re bringing the power of energy to people and organizations by putting customers at the center of everything we do. We generate electricity and provide energy solutions and natural gas to approximately 6 million customers through our diverse portfolio of retail brands. A Fortune 500 company, operating in the United States and Canada, NRG delivers innovative solutions while advocating for competitive energy markets and customer choice, working towards a sustainable energy future. More information is available at www.nrg.com. Connect with NRG on Facebook, LinkedIn and follow us on Twitter @nrgenergy.


Contacts

Investors:
Kevin L. Cole, CFA
609.524.4526
This email address is being protected from spambots. You need JavaScript enabled to view it.

Media:
Candice Adams
609.524.5428
This email address is being protected from spambots. You need JavaScript enabled to view it.

DUBLIN--(BUSINESS WIRE)--The "Nigeria Oil & Gas Upstream Market - Growth, Trends, COVID-19 Impact, and Forecasts (2021 - 2026)" report has been added to ResearchAndMarkets.com's offering.


The Nigeria oil & gas upstream market is expected to grow at a CAGR of more than 2.0% over the period of 2021-2026.

As of January 2021, the number of rigs working in the offshore and onshore fields reduced drastically in the country owing to the lack of investments and the negative impact of the COVID-19 pandemic. The country's economy has witnessed a significant contraction due to the decline in the revenues generated from the hydrocarbon industry.

However, factors such as an anticipated recovery in the demand for oil and gas and governmental push towards increasing exploration and production activities in the country are expected to aid the growth of the market. On the flip side, the country is plagued by political instability and large-scale corruption which are expected to restrain the growth of the market.

The development of gas infrastructure in Nigeria is expected to drive the commercialization of the gas that is already being flared but also is expected to attract investments in the gas reserves that are currently underdeveloped.

The government has instigated reforms in the sector including new laws which are expected to provide opportunities for the market players

Nigeria's offshore oil and gas industry continues to expand, albeit not very fast, opening more market opportunities. The growth of Nigeria's offshore exploration and production activities has been mainly driven by the efforts of the government to develop the country's oil and gas industry.

Key Market Trends

Growing Investments in Gas Infrastructure to Drive the Market

  • Nigeria is one of the major oil and gas producers in the Africa region, accounting for about 25% of oil and 21% of gas production in the region as of 2019. But during 2013-2019, the oil production in the region declined due to several factors, including a low and volatile oil price environment, political instability, militant attacks on the country's oil and gas infrastructure, and others. During the 2018-2019 period, oil production increased due to relatively higher oil prices. But in the first quarter of 2020, the oil prices registered a sudden decline, which, in turn, is expected to affect oil production negatively.
  • On the other hand, gas production has registered a significant rise in the last ten years. During 2009-2019 period, gas production in the country increased by over 200%. But the gas flaring is the cause for wastage of a large amount of gas. Despite the introduction of the Natural Gas Flare Commercialization Program introduced in 2016, the stats provided by NNPC indicate that the flaring has been increasing. Some of the factors that are causing the operators to flare the gas are the lack of infrastructure, legislation, pricing regulations, and consumers ready to buy gas.
  • The country has started to invest heavily in the gas infrastructure as the country plans to become an export hub in Africa, by exporting not only to regional countries but also to the other Asian countries, like India and China. Additionally, the country has significant domestic demand for gas mainly from the power sector. The gas-fired power plants in the country are consistently under-utilized due to lack of uninterrupted gas supply. The country also has a potential domestic demand from the commercial, residential, and industrial sectors. By building the country-wide gas distribution network, the Nigerian government aims to tap into this potential.
  • New projects in the country include the development of ultra-deepwater Egina oilfield by Total is one of the key projects, which started production in the first week of 2019. Further investment in the Egina field may significantly boost the production and cash flow, in 2019, and continue onward.
  • The development of this infrastructure is not only expected to drive the commercialization of the gas that is already being flared but also is expected to attract the investments in the gas reserves that are currently underdeveloped.

Competitive Landscape

The oil and gas upstream sector in the country is majorly dominated by government-owned companies. Private companies operate in joint ventures and collaboration with NNPC, the national oil company of Nigeria.

Some of the key players operating in this market include

  • Nigerian National Petroleum Corporation
  • Royal Dutch Shell PLC
  • Chevron Corporation
  • Exxon Mobil Corporation
  • Total SA

For more information about this report visit https://www.researchandmarkets.com/r/c4v2uq


Contacts

ResearchAndMarkets.com
Laura Wood, Senior Press Manager
This email address is being protected from spambots. You need JavaScript enabled to view it.

For E.S.T Office Hours Call 1-917-300-0470
For U.S./CAN Toll Free Call 1-800-526-8630
For GMT Office Hours Call +353-1-416-8900

Veritone’s new Grid Reliability in Device (GRID) asset modeling and control initiative expected to make the company’s technology the standard for intelligent autonomous grid control, optimization and resilience

DENVER--(BUSINESS WIRE)--#AI--Veritone, Inc. (NASDAQ: VERI), the creator of the world’s first operating system for artificial intelligence, aiWARE™, today announced its new Grid Reliability in Device (GRID) initiative, an aggressive plan to embed Veritone’s intelligent predictive controllers into common renewable grid assets, including solar and storage inverters, battery storage systems, EV chargers, wind turbines and hydroelectric power systems. The Company expects this initiative to simplify distributed energy resource (DER) integration, prolong asset life and increase grid resilience.


Utilities, independent power producers (IPPs) and microgrid developers are faced with reliability challenges in integrating and managing green energy sources due to their variable nature. Fluctuations in the power provided by these sources can cause costly damage to grid assets, as well as inefficient energy distribution. In addition, extreme weather can knock out entire grids in the absence of autonomously controlled emergency microgrids. Without predictive AI modeling and control of grid assets, these reliability challenges will continue.

Veritone Energy Solutions are predictive, AI-powered solutions that balance and strengthen the grid to increase reliability, reduce operational costs and improve resilience. With Veritone’s new GRID asset modeling and control initiative, predictive controllers embedded into common grid assets can empower the industry to achieve these benefits faster than ever before. These controllers also complement the standard controllers bundled with some devices, providing innovative predictive capabilities and dynamic decisioning models reflecting the current grid state.

Renewable grid assets with Veritone controllers can enable autonomous grid control and decision making across thousands of supported grid devices, helping to ensure optimal economic dispatch during normal operations and macro and microgrid resilience during extreme weather events. “Out of the box” device compatibility also simplifies grid integration of renewable energy devices, making the transition to green energy easier and faster for developers and operators. Embedded controllers also enable energy smoothing, which prolongs asset life and reduces the risk of device burnout and any resulting environmental damage.

“We believe that Veritone’s Energy solutions will become the standard for intelligent autonomous grid control, optimization and resilience, and our GRID initiative is a critical path forward toward this goal,” said Chad Steelberg, chairman and CEO of Veritone. “Our patented model optimization and control technology can be built into every grid asset to make electrical grids everywhere more green, cost-effective and reliable.”

Veritone’s GRID initiative will enable grid asset manufacturers to deliver added value to their end-customers, giving them peace of mind around device reliability and longevity. Utilities, IPPs and developers will be able to use Veritone AI-embedded grid assets to deliver optimal operation with both macro and microgrids.

“The need for reliable, clean, distributed power generation has never been greater,” said Mark Ward, Managing Director at Amshore Renewable Energy, which develops wind, solar, and battery storage projects. “We expect that predictive control built into solar inverters and solar battery systems will not only help us more rapidly integrate these intelligent systems into utility grids, but will also give us confidence that these systems will work reliably with the grid to continuously perform optimal economic dispatch.”

Veritone is currently creating, integrating and simulating AI control models for the solar inverters and batteries of the largest and most innovative clean energy device manufacturers, resulting in “plug-and-play” grid compatibility with Veritone’s aiWARE operating system and predictive energy solutions. Veritone expects the GRID initiative to more rapidly scale its AI-powered energy business, helping to reach its goal of an interconnected, on-demand, green and autonomous electrical grid.

For more information on Veritone Energy Solutions, please visit: https://www.veritone.com/solutions/energy/

About Veritone

Veritone (Nasdaq: VERI) is a leading provider of artificial intelligence (AI) technology and solutions. The company’s proprietary operating system, aiWARE™ powers a diverse set of AI applications and intelligent process automation solutions that are transforming both commercial and government organizations. aiWARE orchestrates an expanding ecosystem of machine learning models to transform audio, video, and other data sources into actionable intelligence. The company’s AI developer tools enable its customers and partners to easily develop and deploy custom applications that leverage the power of AI to dramatically improve operational efficiency and unlock untapped opportunities. Veritone is headquartered in Denver, Colorado, and has offices in Costa Mesa, Denver, London, New York and San Diego. To learn more, visit www.veritone.com.

Safe Harbor Statement

This news release contains forward-looking statements, including without limitation statements regarding Veritone’s GRID initiative, the expected capabilities of Veritone’s intelligent predictive controllers and other Energy solutions and the anticipated benefits thereof to customers, the Company’s expectation that its GRID initiative will enable the Company to more rapidly scale its AI-powered energy business and help it reach its goal of an interconnected, on-demand, green and autonomous electrical grid, and the Company’s belief that Veritone’s Energy solutions will become the standard for intelligent autonomous grid control. Without limiting the generality of the foregoing, words such as “may,” “will,” “expect,” “believe,” “anticipate,” “intend,” “could,” “estimate” or “continue” or the negative other variations thereof or comparable terminology are intended to identify forward-looking statements. In addition, any statements that refer to expectations, projections or other characterizations of future events or circumstances are forward-looking statements. Assumptions relating to the foregoing involve judgments and risks with respect to various matters which are difficult or impossible to predict accurately and many of which are beyond the control of Veritone. Certain of such judgments and risks are discussed in Veritone’s SEC filings. Although Veritone believes that the assumptions underlying the forward-looking statements are reasonable, any of the assumptions could prove inaccurate and, therefore, there can be no assurance that the results contemplated in forward-looking statements will be realized. In light of the significant uncertainties inherent in the forward-looking information included herein, the inclusion of such information should not be regarded as a representation by Veritone or any other person that their objectives or plans will be achieved. Veritone undertakes no obligation to revise the forward-looking statements contained herein to reflect events or circumstances after the date hereof or to reflect the occurrence of unanticipated events.


Contacts

Allison Zullo
Walker Sands, for Veritone
This email address is being protected from spambots. You need JavaScript enabled to view it.
330-554-5965

DUBLIN--(BUSINESS WIRE)--The "Oil Refining Market - Growth, Trends, COVID-19 Impact, and Forecasts (2021 - 2026)" report has been added to ResearchAndMarkets.com's offering.


The global refining capacity is expected to grow at a CAGR of more than 1.25% during 2021-2026.

The COVID-19 pandemic has negatively affected the market due to a reduction in consumption of refined petroleum products and declining economic development across the major nations of the world. The COVID-19 pandemic coupled with the high volatility of crude oil prices has delayed many refinery projects across the globe.

The growth in refining capacity is expected to be driven by the increasing demand for petroleum products in the coming years. However, the refining market is restrained by factors, such as lack of funds, delay in commissioning projects, acquiring lands, and increasing adoption of electric vehicles in developed and developing nations across the globe.

The expansion of downstream infrastructure across the globe in order to meet to increasing demand for refined petroleum products is expected to drive the market during the forecast period.

African countries such as Nigeria, Algeria, and others are planning to make their countries the regional hub for refineries in the coming years. This, in turn, is expected to create a huge opportunities for the international and domestic refiners to tap into the African market in the near future.

Asia-Pacific is expected to remain the major player in the oil refining market. As of 2019, the region covered around 34% of the global refining capacity and is expected to remain the major region during the forecast period owing to the upcoming major refinery projects in China and India.

Key Market Trends

Expansion in the Downstream Infrastructure

  • The demand for oil as fuel in the transportation sector is likely to maintain its momentum in the short term. The recovery in oil consumption trends, driven by lower oil prices, is expected to support the momentum. Many countries across the globe are trying to invest in refining capacity to reduce their dependence on imported refined petroleum products.
  • As of 2018, there were above 470 planned and announced petrochemical plants, out of which, China is estimated to have 240 plants. The capital expenditure for the projects in China is expected to reach around USD 52 billion by 2026.
  • In addition to this, in Nigeria, Dangote Oil Refinery Company (Dangote) is constructing an integrated refinery and petrochemical complex in the Lekki Free Zone near Lagos, Nigeria. The refinery is expected to be the world's biggest single-train facility, upon commissioning in 2021. The project is estimated to cost USD 18 billion, the refinery will produce Euro-V quality gasoline and diesel, as well as jet fuel and polypropylene.
  • In the United States, there are above 95 planned and announced projects, which are expected to have a total capacity of up to 63 MTPA by 2026. The CAPEX for these projects stands at around USD 53 billion. Major capacity additions in the country are likely to be initiated by IGP Methanol LLC and NW Innovation Works.
  • Therefore, the expansion of the global refining sector in the form of upcoming petrochemical and refinery complexes is expected to drive the market studied during the forecast period.

Competitive Landscape

The global refining market is moderately consolidated. Some of the major players operating in the market include Exxon Mobil Corporation, Royal Dutch Shell Plc, Sinopec Corp., BP PLC, and Saudi Arabian Oil Co.

Key Topics Covered:

1 INTRODUCTION

1.1 Scope of the Study

1.2 Market Definition

1.3 Study Assumptions

2 EXECUTIVE SUMMARY

3 RESEARCH METHODOLOGY

4 MARKET OVERVIEW

4.1 Introduction

4.2 Refining Capacity and Forecast in million barrels per day (mbpd), till 2026

4.3 Refining Throughput, in barrels per day, till 2019

4.4 Recent Trends and Developments

4.5 Government Policies and Regulations

4.6 Market Dynamics

4.6.1 Drivers

4.6.2 Restraints

4.7 Supply Chain Analysis

4.8 Porter's Five Forces Analysis

5 MARKET SEGMENTATION - BY GEOGRAPHY

5.1 North America

5.2 Asia-Pacific

5.3 Europe

5.4 South America

5.5 Middle-East and Africa

6 COMPETITIVE LANDSCAPE

6.1 Mergers and Acquisitions, Joint Ventures, Collaborations, and Agreements

6.2 Strategies Adopted by Leading Players

6.3 Company Profiles

6.3.1 Exxon Mobil Corporation

6.3.2 Royal Dutch Shell PLC

6.3.3 Sinopec Corp.

6.3.4 BP PLC

6.3.5 Saudi Arabian Oil Co.

6.3.6 Valero Energy Corporation

6.3.7 Petroleos de Venezuela SA

6.3.8 China National Petroleum Corporation

6.3.9 Chevron Corporation

6.3.10 Rosneft PAO

6.3.11 Total SA

7 MARKET OPPORTUNITIES AND FUTURE TRENDS

For more information about this report visit https://www.researchandmarkets.com/r/2ksrhk


Contacts

ResearchAndMarkets.com
Laura Wood, Senior Press Manager
This email address is being protected from spambots. You need JavaScript enabled to view it.

For E.S.T Office Hours Call 1-917-300-0470
For U.S./CAN Toll Free Call 1-800-526-8630
For GMT Office Hours Call +353-1-416-8900

  • Lockheed Martin and Thales closed negotiations for the supply up to 55 ALFS anti-submarine warfare sonars to the U.S. Navy and foreign navies.
  • As a tier-one supplier to Lockheed Martin, Thales will deliver the ALFS systems for installation on the MH-60R helicopter platform.
  • The navies of India, Greece and Denmark will receive the helicopter dipping sonars through U.S. Foreign Military Sales of the MH-60R.

PARIS LA DÉFENSE--(BUSINESS WIRE)--Thales has signed a contract with Lockheed Martin as a tier-one supplier for the delivery of up to 55 airborne anti-submarine warfare sonars. The ALFS (Airborne Low Frequency Sonar)* dipping sonars will be installed on the MH-60R platform for the U.S. Navy and three navies. Delivery of the first 42 systems will occur over the next five years with a delivery of 13 optional systems to occur in year six.


Thales has delivered more than 300 ALFS sonars to the U.S. Navy since the early 2000s and this new contract with Lockheed Martin will continue to support the Navy’s readiness strategy. The navies of India, Denmark and Greece will receive their first deliveries of the ALFS sonar system through direct U.S. Foreign Military Sales of the MH-60R platforms.

To maintain control over their maritime space and protect security interests around the world, naval forces need reliable, high-performing systems to operate with optimum effect on missions including anti-submarine warfare, maritime search and rescue, defence of maritime approaches and fleet protection for naval forces on deployment.

Offering unparalleled protection to maritime convoys, the ALFS anti-submarine warfare system is capable of detecting, classifying, prosecuting, harassing or attacking submarines, making Thales the benchmark for the world’s major navies. In addition to the U.S. Navy, the other navies that have chosen Thales dipping sonar solutions include the navies of Australia, the United Kingdom, France, Norway, Sweden, the United Arab Emirates, Poland, South Korea and the Philippines.

As a low frequency active sonar, ALFS is designed for the initial detection and tracking of opposing submarines. It offers a long detection range with a wide coverage rate and a low false alarm level, both in deep and coastal waters. It can be used autonomously to clear a particular area or as a complementary anti-submarine warfare asset to sonars on board surface vessels for target relocation and attack.

“Earning the trust of the U.S. Navy and its allies and partners around the globe is a source of pride for our team. This contract enhances our position as a strategic supplier to Lockheed Martin and further consolidates the Group's world leadership position in anti-submarine warfare systems. We will continue to improve the performance and competitiveness of our airborne sonars to meet the new anti-submarine warfare operational challenges of our customers.” Alexis Morel, VP Underwater systems, Thales.

Note to Editors

* The Thales ALFS and FLASH systems are from the same product family of airborne anti-submarine dipping sonars but each product has variances due to system destinations and the local technological requirements to comply with including U.S. ITAR.

About Thales

Thales (Euronext Paris: HO) is a global leader in advanced technologies, investing in digital and “deep tech” innovations – connectivity, big data, artificial intelligence, cybersecurity and quantum computing – to build a confident future crucial for the development of our societies. The Group provides its customers – businesses, organisations and governments – in the defense, aeronautics, space, transport, and digital identity and security domains with solutions, services and products that help them fulfil their critical role, consideration for the individual being the driving force behind all decisions.

Thales has 81,000 employees in 68 countries. In 2020 the Group generated sales of €17 billion.

About Thales in the USA

In the United States, Thales has conducted significant research and development, manufacturing, and service capabilities for more than 100 years. Today, Thales is present in 22 states, operating 46 different facilities and employing nearly 5,000 people. Working closely with U.S. customers and local partners, Thales is able to meet the most complex requirements for every operating environment.

PLEASE VISIT

Thales Group
Defence
Download HD photos


Contacts

PRESS CONTACT

Thales, Media Relations
Land & Naval Defence
Faïza Zaroual
+33 (0)7 64 25 99 31
This email address is being protected from spambots. You need JavaScript enabled to view it.

Thales, Media Relations
USA
Adam Kostecki
+1 (703) 838-5645
This email address is being protected from spambots. You need JavaScript enabled to view it.

Offshore Source Logo

Offshore Source keeps you updated with relevant information concerning the Offshore Energy Sector.

Any views or opinions represented on this website belong solely to the author and do not represent those of the people, institutions or organizations that Offshore Source or collaborators may or may not have been associated with in a professional or personal capacity, unless explicitly stated.

Corporate Offices

Technology Systems Corporation
8502 SW Kansas Ave
Stuart, FL 34997

info@tscpublishing.com