Business Wire News

  • Petroleum Additives Second Quarter Shipments Strong, Margins Compressed
  • First Half Net Income of $121.7 Million and Earnings Per Share of $11.13
  • Petroleum Additives First Half Operating Profit of $168.3 Million

RICHMOND, Va.--(BUSINESS WIRE)--NewMarket Corporation (NYSE:NEU) Chairman and Chief Executive Officer, Thomas E. Gottwald, released the following earnings report of the Company’s operations for the second quarter and first half of 2021.

Net income for the second quarter of 2021 was $52.0 million, or $4.75 per share, compared to net income of $22.3 million, or $2.05 per share, for the second quarter of 2020. Results for the second quarter of 2020 were severely impacted by the COVID-19 pandemic and the resulting government restrictions on the movement of people, goods and services to combat the spread of the virus in its early stages. For the first half of 2021, net income was $121.7 million, or $11.13 per share, compared to $107.9 million or $9.78 per share, for the first half of last year.

Sales for the petroleum additives segment for the second quarter of 2021 were $586.6 million, up from $408.7 million in the second quarter of 2020. Petroleum additives operating profit for the second quarter of 2021 was $74.2 million, compared to $33.1 million for the same period last year. The increase was due to higher shipments, lower conversion costs and favorable changes in selling prices, partially offset by higher raw material costs. Shipments increased 41.1% between periods, driven by increases in all world regions in both lubricant additives and fuel additives. Petroleum additives operating margin for the second quarter of 2021 was 12.7%, significantly lower than our historical average.

Petroleum additives sales for the first half of the year were $1.2 billion compared to sales in the first half of last year of $966.1 million. Petroleum additives operating profit for the first half of the year was $168.3 million compared to $146.7 million for the first half of 2020. The increase was due to higher shipments and lower conversion costs, partially offset by higher raw material costs. Shipments increased 19.1% between periods, due to increases in lubricant additives shipments. Fuel additives shipments were relatively flat between periods.

We are encouraged by our petroleum additives operating results and the strong shipments for the first half of 2021, but disappointed with our operating margins. Our product shipments for the first half of 2021 are the highest since the first half of 2018. However, we are seeing downward pressure on our operating margins due mainly to the steady increase in raw material costs throughout the year. While our efforts have been focused on recovering these cost increases, we have been experiencing the lag between when price increases go into effect and when margins start to improve. Margin improvement will continue to be a priority until we see margins consistently within our historical ranges.

During the first half of 2021, we funded capital expenditures of $44.4 million, and paid dividends of $41.5 million. In March 2021, we issued $400 million 2.70% senior notes that are due in 2031.

We remain focused on the long-term success of our company, including emphasis on satisfying customer needs, generating solid operating results, and promoting the greatest long-term value for our shareholders, customers and employees. We believe the fundamentals of how we run our business – a long-term view, safety and people first culture, customer-focused solutions, technology-driven product offerings, and a world-class supply chain capability – will continue to be beneficial for all our stakeholders.

Sincerely,

Thomas E. Gottwald

The petroleum additives segment consists of the North America (the United States and Canada), Latin America (Mexico, Central America, and South America), Asia Pacific, and Europe/Middle East/Africa/India (Europe or EMEAI) regions.

The Company has disclosed the non-GAAP financial measure EBITDA and the related calculation in the schedules included with this earnings release. EBITDA is defined as income from continuing operations before the deduction of interest and financing expenses, income taxes, depreciation (on property, plant and equipment) and amortization (on intangibles and lease right-of-use assets). The Company believes that even though this item is not required by or presented in accordance with United States generally accepted accounting principles (GAAP), this additional measure enhances understanding of the Company’s performance and period to period comparability. The Company believes that this item should not be considered an alternative to net income determined under GAAP.

As a reminder, a conference call and Internet webcast is scheduled for 3:00 p.m. EDT on Thursday, July 29, 2021 to review second quarter results. You can access the conference call live by dialing 1-844-602-0380 (domestic) or 1-862-298-0970 (international) and requesting the NewMarket conference call. To avoid delays, callers should dial in five minutes early. A teleconference replay of the call will be available until August 5, 2021 at 3:00 p.m. EDT by dialing 1-877-481-4010 (domestic) or 1-919-882-2331 (international). The replay passcode number is 41908. The call will also be broadcast via the Internet and can be accessed through the Company’s website at www.NewMarket.com or www.webcaster4.com/Webcast/Page/2001/41908. A webcast replay will be available for 30 days.

NewMarket Corporation, through its subsidiaries Afton Chemical Corporation and Ethyl Corporation, develops, manufactures, blends, and delivers chemical additives that enhance the performance of petroleum products. From custom-formulated additive packages to market-general additives, the NewMarket family of companies provides the world with the technology to make engines run smoother, machines last longer, and fuels burn cleaner.

Some of the information contained in this press release constitutes forward-looking statements within the meaning of the Private Securities Litigation Reform Act of 1995. Although NewMarket’s management believes its expectations are based on reasonable assumptions within the bounds of its knowledge of its business and operations, there can be no assurance that actual results will not differ materially from expectations.

Factors that could cause actual results to differ materially from expectations include, but are not limited to, the availability of raw materials and distribution systems; disruptions at production facilities, including single-sourced facilities; hazards common to chemical businesses; the ability to respond effectively to technological changes in our industry; failure to protect our intellectual property rights; sudden or sharp raw material price increases; competition from other manufacturers; current and future governmental regulations; the gain or loss of significant customers; failure to attract and retain a highly-qualified workforce; an information technology system failure or security breach; the occurrence or threat of extraordinary events, including natural disasters; terrorist attacks and health-related epidemics such as the COVID-19 pandemic; risks related to operating outside of the United States; political, economic, and regulatory factors concerning our products; the impact of substantial indebtedness on our operational and financial flexibility; the impact of fluctuations in foreign exchange rates; resolution of environmental liabilities or legal proceedings; limitation of our insurance coverage; our inability to realize expected benefits from investment in our infrastructure or from recent or future acquisitions, or our inability to successfully integrate recent or future acquisitions into our business; the underperformance of our pension assets resulting in additional cash contributions to our pension plans; and other factors detailed from time to time in the reports that NewMarket files with the Securities and Exchange Commission, including the risk factors in Item 1A. “Risk Factors” of our 2020 Annual Report on Form 10-K, which is available to shareholders upon request.

You should keep in mind that any forward-looking statement made by NewMarket in the foregoing discussion speaks only as of the date on which such forward-looking statement is made. New risks and uncertainties arise from time to time, and it is impossible for us to predict these events or how they may affect the Company. We have no duty to, and do not intend to, update or revise the forward-looking statements in this discussion after the date hereof, except as may be required by law. In light of these risks and uncertainties, you should keep in mind that the events described in any forward-looking statement made in this discussion, or elsewhere, might not occur.

NEWMARKET CORPORATION AND SUBSIDIARIES

SEGMENT RESULTS AND OTHER FINANCIAL INFORMATION

(In thousands, except per-share amounts, unaudited)


Second Quarter Ended
June 30,


Six Months Ended
June 30,


2021


2020


2021


2020

Revenue:


Petroleum additives


$

586,587


$

408,703


$

1,151,485


$

966,075


All other


4,134


2,161


5,851


4,206


Total


$

590,721


$

410,864


$

1,157,336


$

970,281


Segment operating profit:


Petroleum additives


$

74,200


$

33,061


$

168,271


$

146,732


All other


17


(399

)


(647

)


(64

)

Segment operating profit


74,217


32,662


167,624


146,668


Corporate unallocated expense


(3,548

)


(5,467

)


(7,860

)


(9,698

)

Interest and financing expenses


(8,869

)


(7,005

)


(15,212

)


(14,109

)

Other income (expense), net


5,258


7,078


11,876


14,485


Income before income tax expense


$

67,058


$

27,268


$

156,428


$

137,346


Net income


$

51,952


$

22,349


$

121,664


$

107,890


Earnings per share - basic and diluted


$

4.75


$

2.05


$

11.13


$

9.78


NEWMARKET CORPORATION AND SUBSIDIARIES

CONSOLIDATED STATEMENTS OF INCOME

(In thousands, except per-share amounts, unaudited)


Second Quarter Ended
June 30,


Six Months Ended
June 30,


2021


2020


2021


2020

Net sales


$

590,721


$

410,864


$

1,157,336


$

970,281


Cost of goods sold


449,722


314,126


854,584


692,636


Gross profit


140,999


96,738


302,752


277,645


Selling, general, and administrative expenses


34,735


35,432


71,650


71,147


Research, development, and testing expenses


35,517


33,549


71,854


69,055


Operating profit


70,747


27,757


159,248


137,443


Interest and financing expenses, net


8,869


7,005


15,212


14,109


Other income (expense), net


5,180


6,516


12,392


14,012


Income before income tax expense


67,058


27,268


156,428


137,346


Income tax expense


15,106


4,919


34,764


29,456


Net income


$

51,952


$

22,349


$

121,664


$

107,890


Earnings per share - basic and diluted


$

4.75


$

2.05


$

11.13


$

9.78


Cash dividends declared per share


$

1.90


$

1.90


$

3.80


$

3.80


NEWMARKET CORPORATION AND SUBSIDIARIES

CONSOLIDATED BALANCE SHEETS

(In thousands except share amounts, unaudited)


June 30,
2021


December 31,
2020

ASSETS


Current assets:


Cash and cash equivalents


$

153,864


$

125,172


Marketable securities


376,295


0


Trade and other accounts receivable, less allowance for credit losses


399,373


336,395


Inventories


457,957


401,031


Prepaid expenses and other current assets


35,982


35,480


Total current assets


1,423,471


898,078


Property, plant, and equipment, net


680,315


665,147


Intangibles (net of amortization) and goodwill


128,531


129,944


Prepaid pension cost


141,151


137,069


Operating lease right-of-use assets


64,980


61,329


Deferred charges and other assets


40,264


42,308


Total assets


$

2,478,712


$

1,933,875


LIABILITIES AND SHAREHOLDERS' EQUITY


Current liabilities:


Accounts payable


$

259,209


$

189,937


Accrued expenses


69,185


78,422


Dividends payable


18,613


15,184


Income taxes payable


5,242


3,760


Operating lease liabilities


14,460


13,410


Other current liabilities


5,416


11,742


Total current liabilities


372,125


312,455


Long-term debt


990,551


598,848


Operating lease liabilities - noncurrent


50,489


48,324


Other noncurrent liabilities


216,337


214,424


Total liabilities


1,629,502


1,174,051


Shareholders' equity:


Common stock and paid-in capital (with no par value; issued and outstanding shares - 10,928,129 at June 30, 2021 and 10,921,377 at December 31, 2020)


1,748


717


Accumulated other comprehensive loss


(164,947

)


(173,164

)

Retained earnings


1,012,409


932,271


Total shareholders' equity


849,210


759,824


Total liabilities and shareholders' equity


$

2,478,712


$

1,933,875


NEWMARKET CORPORATION AND SUBSIDIARIES

SELECTED CONSOLIDATED CASH FLOW DATA

(In thousands, unaudited)


Six Months Ended
June 30,


2021


2020

Net income


$

121,664


$

107,890


Depreciation and amortization


41,719


42,356


Unrealized (gain) loss on marketable securities


2,314


0


Cash pension and postretirement contributions


(5,184

)


(5,152

)

Working capital changes


(59,484

)


(60,072

)

Deferred income tax expense


6,654


3,322


Purchases of marketable securities


(387,653

)


0


Proceeds from sales and maturities of marketable securities


9,894


0


Capital expenditures


(44,394

)


(40,088

)

Issuance of 2.70% senior notes


395,052


0


Debt issuance costs


(3,897

)


(1,348

)

Net borrowings under revolving credit facility


0


47,059


Repurchases of common stock


0


(100,000

)

Dividends paid


(41,526

)


(41,916

)

All other


(6,467

)


5,616


Increase (decrease) in cash and cash equivalents


$

28,692


$

(42,333

)

NEWMARKET CORPORATION AND SUBSIDIARIES

NON-GAAP FINANCIAL INFORMATION

(In thousands, unaudited)


Second Quarter Ended
June 30,


Six Months Ended
June 30,


2021


2020


2021


2020

Net Income


$

51,952


$

22,349


$

121,664


$

107,890


Add:


Interest and financing expenses, net


8,869


7,005


15,212


14,109


Income tax expense


15,106


4,919


34,764


29,456


Depreciation and amortization


20,594


20,709


40,918


41,568


EBITDA


$

96,521


$

54,982


$

212,558


$

193,023


Contacts

FOR INVESTOR INFORMATION:
Brian D. Paliotti
Investor Relations
Phone: 804.788.5555
Fax: 804.788.5688
Email: This email address is being protected from spambots. You need JavaScript enabled to view it.

DALLAS--(BUSINESS WIRE)--Eagle Materials Inc. (NYSE: EXP) today reported financial results for the first quarter of fiscal 2022 ended June 30, 2021. Notable items for the quarter are highlighted below. (Unless otherwise noted, all comparisons are with the prior year’s fiscal first quarter):


First Quarter Fiscal 2022 Highlights

  • Record revenue of $476 million, up 11%
  • Net earnings per diluted share of $2.25, down 3%
    • Prior year results benefitted from a $52.0 million, or $0.93 per share, gain on the sale of our northern California concrete and aggregates businesses
  • Eagle repurchased approximately 426,000 shares of its common stock

Commenting on the first quarter results, Michael Haack, President and CEO, said, “Fiscal 2022 is off to a good start for Eagle. In the first quarter we achieved record revenue of $476 million and net earnings per diluted share of $2.25. These results reflect strong market demand in both of our major business lines and exceptional operational execution by our team. Our Wallboard business continues to benefit from robust residential construction activity across our markets, and our Cement business benefited from sustained high levels of infrastructure spending. Gross margin increased to 26.6%, an improvement of 260 basis points over the prior year, in spite of heavy rainfall in our Texas markets, which resulted in lower Cement sales volume, and additional Cement maintenance costs this quarter compared with a year ago.”

Mr. Haack continued, “We expect underlying market conditions to remain strong as the US economy recovers, and we are well-positioned to continue to benefit from this growth. On July 1, 2021, we completed the issuance of $750 million of 10-year senior notes with an interest rate of 2.50%, which further strengthened our capital structure. We also restarted our share repurchase program and repurchased approximately 426,000 shares of our common stock during the quarter. With Eagle’s excellent balance sheet and steadfast execution of our operating strategies, we are extremely well-positioned for a strong fiscal 2022.”

Segment Financial Results

Heavy Materials: Cement, Concrete and Aggregates

Revenue in the Heavy Materials sector, which includes Cement, Concrete and Aggregates, Joint Venture and intersegment Cement revenue, was $315.0 million, a 3% improvement. Heavy Materials operating earnings also increased 3% to $67.9 million primarily because of improved Cement sales prices.

Cement revenue, including Joint Venture and intersegment revenue, was up 3% to $270.3 million. Operating earnings were also up 3% to a record $62.5 million. These increases reflect improved Cement quarterly sales prices, partially offset by lower Cement sales volume. The average net Cement sales price for the quarter was up 7% to $116.34 per ton. Cement sales volume for the quarter was down 2% to 2.0 million tons, mainly because of heavy rainfall in Texas during the quarter.

Concrete and Aggregates revenue increased 2% to $44.8 million, reflecting improved Concrete and Aggregates prices, partially offset by lower Aggregates sales volume. First quarter operating earnings decreased 1% to $5.3 million, reflecting lower Aggregates sales volume partially offset by improved Concrete and Aggregates net sales prices.

Light Materials: Gypsum Wallboard and Paperboard

Revenue in the Light Materials sector, which includes Gypsum Wallboard and Paperboard, increased 25% to $191.3 million, reflecting higher Wallboard sales volume and prices. Gypsum Wallboard sales volume increased 8% to 763 million square feet (MMSF), while the average Gypsum Wallboard net sales price increased 21% to $176.79 per MSF.

Paperboard sales volume increased 9% to a record 84,000 tons. The average Paperboard net sales price in the quarter was $498.49 per ton, up 8%, consistent with the pricing provisions in our long-term sales agreements.

Operating earnings were $66.6 million in the sector, an increase of 51%, reflecting increased Wallboard sales volume and pricing.

Details of Financial Results

We conduct one of our cement plant operations through a 50/50 joint venture, Texas Lehigh Cement Company LP (the Joint Venture). We use the equity method of accounting for our 50% interest in the Joint Venture. For segment reporting purposes only, we proportionately consolidate our 50% share of the Joint Venture’s revenue and operating earnings, which is consistent with the way management organizes the segments within the Company for making operating decisions and assessing performance.

In addition, for segment reporting purposes, we report intersegment revenue as a part of a segment’s total revenue. Intersegment sales are eliminated on the income statement. Refer to Attachment 3 for a reconciliation of these amounts.

On September 18, 2020, the Company sold its Oil and Gas Proppants business to Smart Sand, Inc. The prior-year financial results of the Oil and Gas Proppants segment have been classified as Discontinued Operations on the Consolidated Statement of Earnings. The assets and liabilities of the Oil and Gas Proppants segment have been reflected on separate lines for Discontinued Operations on the Consolidated Balance Sheet.

About Eagle Materials Inc.

Eagle Materials Inc. manufactures and distributes Portland Cement, Gypsum Wallboard, Recycled Gypsum Paperboard, and Concrete and Aggregates from more than 70 facilities across the US. Eagle’s corporate headquarters is in Dallas, Texas.

Eagle’s senior management will conduct a conference call to discuss the financial results, forward looking information and other matters at 8:30 a.m. Eastern Time (7:30 a.m. Central Time) on Wednesday, July 28, 2021. The conference call will be webcast simultaneously on the Eagle website, eaglematerials.com. A replay of the webcast and the presentation will be archived on the site for one year.

###

Forward-Looking Statements. This press release contains forward-looking statements within the meaning of Section 27A of the Securities Act of 1933, Section 21E of the Securities Exchange Act of 1934 and the Private Securities Litigation Reform Act of 1995. Forward-looking statements may be identified by the context of the statement and generally arise when the Company is discussing its beliefs, estimates or expectations. These statements are not historical facts or guarantees of future performance but instead represent only the Company’s belief at the time the statements were made regarding future events which are subject to certain risks, uncertainties and other factors, many of which are outside the Company’s control. Actual results and outcomes may differ materially from what is expressed or forecast in such forward-looking statements. The principal risks and uncertainties that may affect the Company’s actual performance include the following: the cyclical and seasonal nature of the Company’s businesses; public infrastructure expenditures; adverse weather conditions; the fact that our products are commodities and that prices for our products are subject to material fluctuation due to market conditions and other factors beyond our control; availability of raw materials; changes in the costs of energy, including, without limitation, natural gas, coal and oil, and the nature of our obligations to counterparties under energy supply contracts, such as those related to market conditions (such as fluctuations in spot market prices), governmental orders and other matters; changes in the cost and availability of transportation; unexpected operational difficulties, including unexpected maintenance costs, equipment downtime and interruption of production; material nonpayment or non-performance by any of our key customers; fluctuations in or changes in the nature of activity in the oil and gas industry; inability to timely execute announced capacity expansions; difficulties and delays in the development of new business lines; governmental regulation and changes in governmental and public policy (including, without limitation, climate change and other environmental regulation); possible outcomes of pending or future litigation or arbitration proceedings; changes in economic conditions specific to any one or more of the Company’s markets; severe weather conditions (such as winter storms, tornados and hurricanes) on our facilities, operations and contractual arrangements with third parties; competition; cyber-attacks or data security breaches; announced increases in capacity in the gypsum wallboard and cement industries; changes in the demand for residential housing construction or commercial construction or construction projects undertaken by state or local governments; risks related to pursuit of acquisitions, joint ventures and other transactions or the execution or implementation of such transactions, including the integration of operations acquired by the Company; general economic conditions; and interest rates. For example, increases in interest rates, decreases in demand for construction materials or increases in the cost of energy (including, without limitation, natural gas, coal and oil) could affect the revenue and operating earnings of our operations. In addition, changes in national or regional economic conditions and levels of infrastructure and construction spending could also adversely affect the Company’s result of operations. Finally, any forward-looking statements made by the Company are subject to the risks and impacts associated with natural disasters, pandemics or other unforeseen events, including, without limitation, the COVID-19 pandemic and responses thereto designed to contain its spread and mitigate its public health effects, as well as their impact on economic conditions, capital and financial markets. The COVID-19 pandemic and responses thereto may disrupt our business and are likely to have an adverse effect on demand for our products, attributable to, among other things, reductions in consumer spending, increases in unemployment and decreases in revenues and construction budgets of state or local governments. These and other factors are described in the Company’s Annual Report on Form 10-K for the fiscal year ended March 31, 2021 and subsequent quarterly and annual reports upon filing. These reports are filed with the Securities and Exchange Commission. All forward-looking statements made herein are made as of the date hereof, and the risk that actual results will differ materially from expectations expressed herein will increase with the passage of time. The Company undertakes no duty to update any forward-looking statement to reflect future events or changes in the Company’s expectations.

Attachment 1 Consolidated Statement of Earnings
Attachment 2 Revenue and Earnings by Lines of Business
Attachment 3 Sales Volume, Net Sales Prices and Intersegment and Cement Revenue
Attachment 4 Consolidated Balance Sheets
Attachment 5 Depreciation, Depletion and Amortization by Lines of Business


Attachment 1

Eagle Materials Inc.

Consolidated Statement of Earnings

(dollars in thousands, except per share data)

(unaudited)


Quarter Ended
June 30,


2021


2020


Revenue

$

475,770


$

426,989


Cost of Goods Sold


349,259


324,692


Gross Profit


126,511


102,297


Equity in Earnings of Unconsolidated JV


7,970


7,796


Corporate General and Administrative Expenses


(9,468

)


(17,789

)

Gain on Sale of Businesses


-


51,973


Other Non-Operating Income


3,678


(309

)


Earnings from Continuing Operations before Interest and Income Taxes


128,691


143,968


Interest Expense, net


(6,972

)


(14,041

)


Earnings from Continuing Operations before Income Taxes


121,719


129,927


Income Tax Expense


(26,392

)


(32,836

)


Net Earnings from Continuing Operations

$

95,327


$

97,091


Loss from Discontinued Operations, net of tax

$

-


$

(885

)


Net Earnings

$

95,327


$

96,206


BASIC EARNINGS (LOSS) PER SHARE


Continuing Operations

$

2.27


$

2.34


Discontinued Operations

$

-


$

(0.02

)

Net Earnings

$

2.27


$

2.32


DILUTED EARNINGS (LOSS) PER SHARE


Continuing Operations

$

2.25


$

2.33


Discontinued Operations

$

-


$

(0.02

)

Net Earnings

$

2.25


$

2.31


AVERAGE SHARES OUTSTANDING


Basic


42,028,619


41,410,794


Diluted


42,437,366


41,563,268


Attachment 2

Eagle Materials Inc.

Revenue and Earnings by Lines of Business

(dollars in thousands)

(unaudited)


Quarter Ended
June 30,


2021


2020

Revenue*


Heavy Materials:


Cement (Wholly Owned)

$

239,731


$

230,080


Concrete and Aggregates


44,754


44,084


284,485


274,164


Light Materials:


Gypsum Wallboard

$

166,267


$

130,150


Gypsum Paperboard


25,018


22,675


191,285


152,825


Total Revenue

$

475,770


$

426,989


Segment Operating Earnings


Heavy Materials:


Cement (Wholly Owned)

$

54,577


$

52,659


Cement (Joint Venture)


7,970


7,796


Concrete and Aggregates


5,344


5,418


67,891


65,873


Light Materials:


Gypsum Wallboard

$

63,253


$

41,325


Gypsum Paperboard


3,337


2,895


66,590


44,220


Sub-total


134,481


110,093


Corporate General and Administrative Expense


(9,468

)


(17,789

)

Gain on Sale of Businesses


-


51,973


Other Non-Operating Income


3,678


(309

)


Earnings from Continuing Operations before Interest and Income Taxes

$

128,691


$

143,968


* Excluding Intersegment and Joint Venture Revenue listed on Attachment 3

Attachment 3

Eagle Materials Inc.

Sales Volume, Net Sales Prices and Intersegment and Cement Revenue

(dollars in thousands, except per ton data)

(unaudited)


Sales Volume


Quarter Ended
June 30,


2021


2020


Change

Cement (M Tons):


Wholly Owned

1,852


1,866


-1%

Joint Venture

184


219


-16%


2,036


2,085


-2%


Concrete (M Cubic Yards)

348


348


-%


Aggregates (M Tons)

361


475


-24%


Gypsum Wallboard (MMSFs)

763


704


+8%


Paperboard (M Tons):


Internal

36


30


+20%

External

48


47


+2%


84


77


+9%


Average Net Sales Price*


Quarter Ended
June 30,


2021


2020


Change

Cement (Ton)

$ 116.34

$ 109.10

+7%

Concrete (Cubic Yard)

$ 118.19

$ 113.61

+4%

Aggregates (Ton)

$ 9.93

$ 9.77

+2%

Gypsum Wallboard (MSF)

$ 176.79

$ 146.28

+21%

Paperboard (Ton)

$ 498.49

$ 461.87

+8%


*Net of freight and delivery costs billed to customers


Intersegment and Cement Revenue


Quarter Ended
June 30,


2021


2020

Intersegment Revenue:


Cement

$

7,833


$

6,031

Concrete and Aggregates


-


106

Paperboard


18,249


14,069


$

26,082


$

20,206


Cement Revenue:


Wholly Owned

$

239,731


$

230,080

Joint Venture


22,691


25,300


$

262,422


$

255,380

Attachment 4

Eagle Materials Inc.

Consolidated Balance Sheets

(dollars in thousands)

(unaudited)


June 30,


March 31,


2021


2020


2021*

ASSETS


Current Assets –


Cash and Cash Equivalents


$

306,542


$

199,441


$

263,520


Restricted Cash


5,000


-


5,000


Accounts and Notes Receivable, net


187,411


193,733


147,133


Inventories


217,052


242,658


235,749


Federal Income Tax Receivable


-


123,709


2,838


Prepaid and Other Assets


15,298


10,614


7,449


Current Assets of Discontinued Operations


-


1,438


-


Total Current Assets


731,303


771,593


661,689


Property, Plant and Equipment, net


1,641,063


1,720,791


1,659,100


Investments in Joint Venture


76,369


72,254


75,399


Operating Lease Right-of-Use Asset


24,776


28,949


25,811


Notes Receivable


8,485


9,068


8,419


Goodwill and Intangibles


391,211


395,673


392,315


Assets from Discontinued Operations


-


6,527


-


Other Assets


17,623


10,309


15,948


$

2,890,830


$

3,015,164


$

2,838,681


LIABILITIES AND STOCKHOLDERS’ EQUITY


Current Liabilities –


Accounts Payable and Accrued Liabilities


$

171,870


$

153,682


$

163,011


Income Taxes Payable


11,016


32,130


Operating Lease Liabilities


6,127


6,899


6,343


Current Liabilities of Discontinued Operations


-


7,322


-


Total Current Liabilities


189,013


200,033


169,354


Long-term Liabilities


73,665


77,597


75,735


Bank Credit Facility


-


485,000


-


Bank Term Loan


662,487


661,160


662,186


4.500% Senior Unsecured Notes due 2026


346,548


345,928


346,430


Deferred Income Taxes


227,785


162,940


225,986


Liabilities from Discontinued Operations


-


14,548


-


Stockholders’ Equity –


Preferred Stock, Par Value $0.01; Authorized 5,000,000 Shares; None Issued


-


-


-


Common Stock, Par Value $0.01; Authorized 100,000,000 Shares; Issued and Outstanding 42,101,619; 41,756,684 and 42,370,878 Shares, respectively


421


418


424


Capital in Excess of Par Value


10,035


14,571


62,497


Accumulated Other Comprehensive Losses


(3,413

)


(3,302

)


(3,440

)

Retained Earnings


1,384,289


1,056,271


1,299,509


Total Stockholders’ Equity


1,391,332


1,067,958


1,358,990


$

2,890,830


$

3,015,164


$

2,838,681


*From audited financial statements

Attachment 5


Eagle Materials Inc.


Depreciation, Depletion and Amortization by Lines of Business


(dollars in thousands)


(unaudited)


The following table presents Depreciation, Depletion and Amortization by lines of business for the quarters ended June 30, 2021 and 2020:


Depreciation, Depletion and Amortization


Quarter Ended
June 30,


2021


2020


Cement

$

19,531


$

19,243


Concrete and Aggregates


2,578


2,721


Gypsum Wallboard


5,396


5,200


Paperboard


3,668


3,352


Corporate and Other


771


1,300


$

31,944


$

31,816


Contacts

For additional information, contact at 214-432-2000.

Michael R. Haack
President and Chief Executive Officer

D. Craig Kesler
Executive Vice President and Chief Financial Officer

Robert S. Stewart
Executive Vice President, Strategy, Corporate Development and Communications

HOUSTON--(BUSINESS WIRE)--Cactus, Inc. (NYSE: WHD) (“Cactus” or the “Company”) today announced financial and operating results for the second quarter of 2021 and an increase to its quarterly cash dividend.

Second Quarter Highlights

  • Revenue of $108.9 million, up 29% sequentially;
  • Income from operations of $17.3 million, up 49% sequentially;
  • Net income of $14.8 million(1) and diluted earnings per Class A share of $0.18(1);
  • Net income, as adjusted(2) of $12.3 million and diluted earnings per share, as adjusted(2) of $0.16;
  • Adjusted EBITDA(3) and related margin(4) of $28.9 million and 26.5%, respectively;
  • Cash flow from operations of $27.5 million;
  • Cash balance of $309.1 million and no bank debt outstanding as of June 30, 2021; and
  • The Board of Directors (“the Board”) approved an 11% increase in the quarterly cash dividend to $0.10 per share.

Financial Summary


Three Months Ended


June 30,


March 31,


June 30,


2021


2021


2020


(in thousands)

Revenues

$

108,893


$

84,417


$

66,548


Income from operations

$

17,314


$

11,635


$

8,875


Operating income margin

15.9

%


13.8

%


13.3

%

Net income(1)

$

14,774


$

15,136


$

9,095


Net income, as adjusted(2)

$

12,336


$

8,612


$

7,367


Adjusted EBITDA(3)

$

28,908


$

22,831


$

22,483


Adjusted EBITDA margin(4)

26.5

%


27.0

%


33.8

%

(1)

Net income during the second quarter of 2021 is inclusive of a $3.0 million income tax benefit associated with a partial release of a valuation allowance in connection with the redemption of units in Cactus Wellhead, LLC (“Cactus LLC”) by Cadent and other members during the period, $0.6 million of income tax expense related to changes in our foreign tax credit position and $1.0 million in other expense related to the revaluation of the tax receivable agreement liability. Net income during the first quarter of 2021 is inclusive of a $5.1 million income tax benefit associated with a partial release of a valuation allowance and $0.4 million in non-routine fees and expenses recorded in connection with the offering of Class A common stock in March 2021 by certain selling stockholders. Net income during the second quarter of 2020 is inclusive of $0.9 million in non-routine charges related to severance and $1.3 million in additional income related to the revaluation of the tax receivable agreement liability.

(2)

Net income, as adjusted and diluted earnings per share, as adjusted are non-GAAP financial measures. These figures assume Cactus, Inc. held all units in Cactus LLC, its operating subsidiary, at the beginning of the period. Additional information regarding net income, as adjusted and diluted earnings per share, as adjusted and the reconciliation of GAAP to non-GAAP financial measures are in the Supplemental Information tables.

(3)

Adjusted EBITDA is a non-GAAP financial measure. See definition of Adjusted EBITDA and the reconciliation of GAAP to non-GAAP financial measures in the Supplemental Information tables.

(4)

The percentage of Adjusted EBITDA to Revenues.

Scott Bender, President and CEO of Cactus, commented, “We were pleased to achieve significant revenue growth during the quarter, meaningfully outpacing that of the U.S. rig count. In our Product business line, Cactus maintained market share(1) above 40% during the period despite continued disproportionate activity growth by private operators. Additionally, our Product revenues per rig followed was up approximately 20% on a sequential basis and we were able to improve Product margins despite inflationary cost pressures. In our Rental business line, we were pleased to see a significant increase in the uptake of our innovations, which drove above market growth in this revenue category. In addition, we delivered free cash flow well in excess of our dividend and related distributions.

Looking ahead to the third quarter, we anticipate further gains in Product revenue and rigs followed. Additionally, we expect Rental revenues to outpace the change in U.S. completion activity for the period. Internationally, we anticipate generating our first revenue in the Middle East, where we now have Associates deployed.”

Mr. Bender concluded, “The last twelve months have showcased the Company’s ability to execute despite difficult market conditions and to generate significant free cash flow through the cycle. Based on this and our strong balance sheet, I am pleased to announce that our board has authorized an 11% increase to the regular quarterly cash dividend to $0.10 per share, highlighting our ability to increase capital returns to shareholders. We will continue to maintain our focus on generating attractive returns on capital employed.”

(1)

Additional information regarding market share and rigs followed is located in the Supplemental Information tables.

Revenue Categories

Product


Three Months Ended


June 30,


March 31,


June 30,


2021


2021


2020


(in thousands)

Product revenue

$

70,345


$

51,956


$

40,893


Gross profit

$

22,245


$

15,435


$

14,931


Gross margin

31.6

%


29.7

%


36.5

%

Second quarter 2021 product revenue increased $18.4 million, or 35.4%, sequentially, as sales of wellhead and production related equipment increased primarily due to higher drilling activity in the U.S. and increased production tree sales. Gross profit increased $6.8 million, or 44.1%, sequentially, with margins increasing 190 basis points despite continued supply chain headwinds.

Rental


Three Months Ended


June 30,


March 31,


June 30,


2021


2021


2020


(in thousands)

Rental revenue

$

14,644


$

12,489


$

11,535


Gross profit

$

241


$

318


$

860


Gross margin

1.6

%


2.5

%


7.5

%

Second quarter 2021 rental revenue increased $2.2 million, or 17.3%, sequentially, due to a combination of higher customer completion activity and improved uptake in the use of our innovative technologies. Gross profit decreased $0.1 million sequentially and margins decreased 90 basis points due to increased equipment reactivation costs in relation to revenue.

Field Service and Other


Three Months Ended


June 30,


March 31,


June 30,


2021


2021


2020


(in thousands)

Field service and other revenue

$

23,904


$

19,972


$

14,120


Gross profit

$

6,212


$

5,509


$

2,634


Gross margin

26.0

%


27.6

%


18.7

%

Second quarter 2021 field service and other revenue increased $3.9 million, or 19.7%, sequentially, as higher customer activity drove an increase in associated billable hours and ancillary services. Gross profit increased $0.7 million, or 12.8%, sequentially, with margins decreasing by 160 basis points sequentially due to higher labor costs associated with wage reinstatements instituted during the quarter as well as labor inefficiencies associated with significant onboarding of new Associates during the period.

Selling, General and Administrative Expenses (“SG&A”)

SG&A expense for the second quarter of 2021 was $11.4 million (10.5% of revenues), compared to $9.6 million (11.4% of revenues) for the first quarter of 2021 and $8.7 million (13.1% of revenues) for the second quarter of 2020. The sequential increase was primarily due to higher payroll expenses, including an increase in non-cash performance-based stock compensation expense and a larger bonus accrual.

Liquidity, Capital Expenditures and Other

As of June 30, 2021, the Company had $309.1 million of cash and no bank debt outstanding. Operating cash flow was $27.5 million for the second quarter of 2021. During the second quarter, the Company made dividend payments and associated distributions of $6.8 million.

Net cash used in investing activities was $2.3 million during the second quarter of 2021, driven largely by additions to the Company’s fleet of rental equipment. For the full year 2021, the Company expects capital expenditures to be in the range of $10 to $15 million.

On June 17, 2021, Cadent Energy Partners II, L.P. (“Cadent”) transferred 0.9 million units representing limited liability company interests (“CW Units”) in Cactus Wellhead, LLC, together with the same number of shares of the Company’s Class B common stock, to various Cadent-affiliated entities. Following this, Cadent redeemed approximately 3.3 million CW Units for an equal number of shares of Class A common stock in the Company and distributed such shares to its limited partners. In connection with these events, 3.3 million CW Units and an equal number of shares of Class B common stock were cancelled. The Company received no proceeds from these events, and there was no change in the combined number of voting shares of Cactus, Inc. outstanding.

As of June 30, 2021, Cactus had 58,038,349 shares of Class A common stock outstanding (representing 76.7% of the total voting power) and 17,665,021 shares of Class B common stock outstanding (representing 23.3% of the total voting power).

Quarterly Dividend

The Board has approved an increase in the quarterly cash dividend to $0.10 per share of Class A common stock with payment to occur on September 16, 2021 to holders of record of Class A common stock at the close of business on August 30, 2021. A corresponding distribution of up to $0.10 per CW Unit has also been approved for holders of CW Units of Cactus Wellhead, LLC.

Conference Call Details

The Company will host a conference call to discuss financial and operational results tomorrow, Thursday, July 29, 2021 at 9:00 a.m. Central Time (10:00 a.m. Eastern Time).

The call will be webcast on Cactus’ website at www.CactusWHD.com. Institutional investors and analysts may participate by dialing (833) 665-0603. International parties may dial (929) 517-0394. The access code is 1488997. Please access the webcast or dial in for the call at least 10 minutes ahead of start time to ensure a proper connection.

An archived webcast of the conference call will be available on the Company’s website shortly after the end of the call.

About Cactus, Inc.

Cactus designs, manufactures, sells and rents a range of highly engineered wellhead and pressure control equipment. Its products are sold and rented principally for onshore unconventional oil and gas wells and are utilized during the drilling, completion and production phases of its customers’ wells. In addition, it provides field services for all its products and rental items to assist with the installation, maintenance and handling of the wellhead and pressure control equipment. Cactus operates service centers in the United States, which are strategically located in the key oil and gas producing regions, including the Permian, SCOOP/STACK, Marcellus, Utica, Haynesville, Eagle Ford and Bakken, among other areas, and in Eastern Australia.

Cautionary Statement Concerning Forward-Looking Statements

Certain statements contained in this press release constitute “forward-looking statements” within the meaning of the Private Securities Litigation Reform Act of 1995. These forward-looking statements are subject to risks, uncertainties and other factors, many of which are outside of Cactus’ control, that could cause actual results to differ materially from the results discussed in the forward-looking statements.

Forward-looking statements can be identified by the use of forward-looking terminology including “may,” “believe,” “expect,” “intend,” “anticipate,” “estimate,” “continue,” “potential,” “will,” “hope” or other similar words and include the Company’s expectation of future performance contained herein. These statements discuss future expectations, contain projections of results of operations or of financial condition, or state other “forward-looking” information. You are cautioned not to place undue reliance on any forward-looking statements, which can be affected by assumptions used or by known risks or uncertainties. Consequently, no forward-looking statements can be guaranteed. When considering these forward-looking statements, you should keep in mind the risk factors and other factors noted in the Company’s Annual Report on Form 10-K, any Quarterly Reports on Form 10-Q and the other documents that the Company files with the Securities and Exchange Commission. The risk factors and other factors noted therein could cause actual results to differ materially from those contained in any forward-looking statement.

Cactus, Inc.

Condensed Consolidated Statements of Income

(unaudited)


Three Months Ended

June 30,


Six Months Ended

June 30,


2021


2020


2021


2020


(in thousands, except per share data)

Revenues


Product revenue

$

70,345


$

40,893


$

122,301


$

127,924

Rental revenue

14,644


11,535


27,133


47,698

Field service and other revenue

23,904


14,120


43,876


45,065

Total revenues

108,893


66,548


193,310


220,687


Costs and expenses


Cost of product revenue

48,100


25,962


84,621


82,097

Cost of rental revenue

14,403


10,675


26,574


30,014

Cost of field service and other revenue

17,692


11,486


32,155


35,297

Selling, general and administrative expenses

11,384


8,693


21,011


22,355

Severance expenses


857


1,864

Total costs and expenses

91,579


57,673


164,361


171,627

Income from operations

17,314


8,875


28,949


49,060


Interest income (expense), net

(181

)


223


(333

)


633

Other income (expense), net

(1,004

)


1,310


(1,410

)


1,310

Income before income taxes

16,129


10,408


27,206


51,003

Income tax expense (benefit)

1,355


1,313


(2,704

)


8,810

Net income

$

14,774


$

9,095


$

29,910


$

42,193

Less: net income attributable to non-controlling interest

4,381


3,067


7,958


17,182

Net income attributable to Cactus, Inc.

$

10,393


$

6,028


$

21,952


$

25,011


Earnings per Class A share - basic

$

0.19


$

0.13


$

0.42


$

0.53

Earnings per Class A share - diluted (a)

$

0.18


$

0.11


$

0.37


$

0.51


Weighted average shares outstanding - basic

55,048


47,436


52,124


47,353

Weighted average shares outstanding - diluted (a)

75,997


75,367


75,955


75,347

(a)

Dilution for the three and six months ended June 30, 2021 includes $4.6 million and $8.5 million, respectively, of additional pre-tax income attributable to non-controlling interest adjusted for a corporate effective tax rate of 28% and 20.7 and 23.5 million weighted average shares of Class B common stock outstanding, respectively, plus the effect of dilutive securities. Dilution for the three and six months ended June 30, 2020 includes $3.4 million and $18.5 million, respectively, of additional pre-tax income attributable to non-controlling interest adjusted for a corporate effective tax rate of 26%, and 27.9 million weighted average shares of Class B common stock outstanding plus the dilutive effect of restricted stock unit awards.

Cactus, Inc.

Condensed Consolidated Balance Sheets

(unaudited)


June 30,


December 31,


2021


2020


(in thousands)

Assets


Current assets


Cash and cash equivalents

$

309,082


$

288,659

Accounts receivable, net

71,825


44,068

Inventories

88,382


87,480

Prepaid expenses and other current assets

4,490


4,935

Total current assets

473,779


425,142


Property and equipment, net

136,183


142,825

Operating lease right-of-use assets, net

22,662


21,994

Goodwill

7,824


7,824

Deferred tax asset, net

303,187


216,603

Other noncurrent assets

1,115


1,206

Total assets

$

944,750


$

815,594


Liabilities and Equity


Current liabilities


Accounts payable

$

33,505


$

20,163

Accrued expenses and other current liabilities

21,379


11,392

Current portion of liability related to tax receivable agreement

9,290


9,290

Finance lease obligations, current portion

4,770


3,823

Operating lease liabilities, current portion

4,616


4,247

Total current liabilities

73,560


48,915


Deferred tax liability, net

587


786

Liability related to tax receivable agreement, net of current portion

275,883


195,061

Finance lease obligations, net of current portion

5,328


2,240

Operating lease liabilities, net of current portion

18,217


17,822

Total liabilities

373,575


264,824


Equity

571,175


550,770

Total liabilities and equity

$

944,750


$

815,594

Cactus, Inc.

Condensed Consolidated Statements of Cash Flows

(unaudited)


Six Months Ended June 30,


2021


2020


(in thousands)

Cash flows from operating activities


Net income

$

29,910


$

42,193


Reconciliation of net income to net cash provided by operating activities


Depreciation and amortization

18,352


21,500


Deferred financing cost amortization

84


84


Stock-based compensation

4,438


4,204


Provision for expected credit losses

149


574


Inventory obsolescence

1,566


2,322


Gain on disposal of assets

(613

)


(438

)

Deferred income taxes

(4,506

)


5,565


(Gain) loss from revaluation of liability related to tax receivable agreement

1,004


(1,310

)

Changes in operating assets and liabilities:


Accounts receivable

(27,858

)


42,039


Inventories

(2,569

)


17,076


Prepaid expenses and other assets

499


2,619


Accounts payable

12,774


(25,686

)

Accrued expenses and other liabilities

9,999


(8,193

)

Net cash provided by operating activities

43,229


102,549


Cash flows from investing activities


Capital expenditures and other

(5,461

)


(18,902

)

Proceeds from sale of assets

1,108


2,352


Net cash used in investing activities

(4,353

)


(16,550

)


Cash flows from financing activities


Payments on finance leases

(2,479

)


(3,265

)

Dividends paid to Class A common stock shareholders

(9,426

)


(8,568

)

Distributions to members

(3,560

)


(4,712

)

Repurchase of shares

(3,174

)


(1,385

)

Net cash used in financing activities

(18,639

)


(17,930

)


Effect of exchange rate changes on cash and cash equivalents

186


1


Net increase in cash and cash equivalents

20,423


68,070


Cash and cash equivalents


Beginning of period

288,659


202,603


End of period

$

309,082


$

270,673


Cactus, Inc. – Supplemental Information

Reconciliation of GAAP to non-GAAP Financial Measures

Net income, as adjusted and diluted earnings per share, as adjusted

(unaudited)

Net income, as adjusted and diluted earnings per share, as adjusted are not measures of net income as determined by GAAP. Net income, as adjusted and diluted earnings per share, as adjusted are supplemental non-GAAP financial measures that are used by management and external users of the Company’s consolidated financial statements. Cactus defines net income, as adjusted as net income assuming Cactus, Inc. held all units in Cactus LLC, its operating subsidiary, at the beginning of the period, with the resulting additional income tax expense related to the incremental income attributable to Cactus, Inc. Net income, as adjusted, also includes certain other adjustments described below. Cactus defines diluted earnings per share, as adjusted as net income, as adjusted divided by weighted average shares outstanding, as adjusted. The Company believes this supplemental information is useful for evaluating performance period over period.


Three Months Ended


June 30,


March 31,


June 30,


2021


2021


2020


(in thousands, except per share data)

Net income

$

14,774


$

15,136


$

9,095


Adjustments:


Severance expenses, pre-tax(1)


857


Other non-operating (income) expense, pre-tax(2)

1,004


(1,310

)

Secondary offering related expenses, pre-tax(3)


406


Income tax expense differential(4)

(3,442

)


(6,930

)


(1,275

)

Net income, as adjusted

$

12,336


$

8,612


$

7,367


Diluted earnings per share, as adjusted

$

0.16


$

0.11


$

0.10


Weighted average shares outstanding, as adjusted(5)

75,997


75,774


75,367


(1)

Represents non-routine charges related to severance benefits.

(2)

Represents non-cash adjustments for the revaluation of the liability related to the tax receivable agreement.

(3)

Reflects fees and expenses recorded in the first quarter of 2021 in connection with the offering of Class A common stock by certain selling stockholders, excluding underwriting discounts and selling commissions incurred by the selling stockholders.

(4)

Represents the increase or decrease in tax expense as though Cactus, Inc. owned 100% of Cactus LLC at the beginning of the period, calculated as the difference in tax expense recorded during each period and what would have been recorded, adjusted for pre-tax items listed above, based on a corporate effective tax rate of 28% on income before income taxes for the three months ended June 30, 2021, 25% for the three months ended March 31, 2021 and 26% for the three months ended June 30, 2020.

(5)

Reflects 55.0, 49.2, and 47.4 million weighted average shares of basic Class A common stock outstanding and 20.7, 26.3 and 27.9 million of additional shares for the three months ended June 30, 2021, March 31, 2021 and June 30, 2020, respectively, as if the weighted average shares of Class B common stock were exchanged and cancelled for Class A common stock at the beginning of the period, plus the effect of dilutive securities.

Cactus, Inc. – Supplemental Information

Reconciliation of GAAP to non-GAAP Financial Measures

EBITDA and Adjusted EBITDA

(unaudited)

EBITDA and Adjusted EBITDA are not measures of net income as determined by GAAP. EBITDA and Adjusted EBITDA are supplemental non-GAAP financial measures that are used by management and external users of the Company’s consolidated financial statements, such as industry analysts, investors, lenders and rating agencies. Cactus defines EBITDA as net income excluding net interest, income tax and depreciation and amortization. Cactus defines Adjusted EBITDA as EBITDA excluding the other items outlined below.

Cactus management believes EBITDA and Adjusted EBITDA are useful because they allow management to more effectively evaluate the Company’s operating performance and compare the results of its operations from period to period without regard to financing methods or capital structure, or other items that impact comparability of financial results from period to period. EBITDA and Adjusted EBITDA should not be considered as alternatives to, or more meaningful than, net income or any other measure as determined in accordance with GAAP. The Company’s computations of EBITDA and Adjusted EBITDA may not be comparable to other similarly titled measures of other companies. Cactus presents EBITDA and Adjusted EBITDA because it believes they provide useful information regarding the factors and trends affecting the Company’s business.


Three Months Ended


Six Months Ended


June 30,


March 31,


June 30,


June 30,


2021


2021


2020


2021


2020


(in thousands)


(in thousands)

Net income

$

14,774


$

15,136


$

9,095


$

29,910


$

42,193

Interest expense (income), net

181


152


(223)


333


(633)

Income tax expense (benefit)

1,355


(4,059)


1,313


(2,704)


8,810

Depreciation and amortization

9,159


9,193


10,520


18,352


21,500

EBITDA

25,469


20,422


20,705


45,891


71,870

Severance expenses(1)


857


1,864

Other non-operating (income) expense(2)

1,004


(1,310)


1,004


(1,310)

Secondary offering related expenses(3)


406


406


Stock-based compensation

2,435


2,003


2,231


4,438


4,204

Adjusted EBITDA

$

28,908


$

22,831


$

22,483


$

51,739


$

76,628

(1)

Represents non-routine charges related to severance benefits.

(2)

Represents non-cash adjustments for the revaluation of the liability related to the tax receivable agreement.

(3)

Reflects fees and expenses recorded in the first quarter of 2021 in connection with the offering of Class A common stock by certain selling stockholders, excluding underwriting discounts and selling commissions incurred by the selling stockholders.

Cactus, Inc. – Supplemental Information

Depreciation and Amortization by Category

(unaudited)


Three Months Ended


Six Months Ended


June 30,


March 31,


June 30,


June 30,


2021


2021


2020


2021


2020


(in thousands)


(in thousands)

Cost of product revenue

$

814


$

806


$

863


$

1,620


$

1,891

Cost of rental revenue

6,491


6,625


7,121


13,116


14,463

Cost of field service and other revenue

1,753


1,655


2,286


3,408


4,671

Selling, general and administrative expenses

101


107


250


208


475

Total depreciation and amortization

$

9,159


$

9,193


$

10,520


$

18,352


$

21,500


Contacts

Cactus, Inc.
John Fitzgerald, 713-904-4655
Director of Corporate Development and Investor Relations
This email address is being protected from spambots. You need JavaScript enabled to view it.


Read full story here

DUBLIN--(BUSINESS WIRE)--The "Wind Turbine Market Research Report , by Region (Americas, Asia-Pacific, and Europe, Middle East & Africa) - Global Forecast to 2026 - Cumulative Impact of COVID-19" report has been added to ResearchAndMarkets.com's offering.


The Global Wind Turbine Market size was estimated at USD 88.46 Billion in 2020 and expected to reach USD 98.42 Billion in 2021, at a Compound Annual Growth Rate (CAGR) 11.59% to reach USD 170.84 Billion by 2026.

In this report, the years 2018 and 2019 are considered historical years, 2020 as the base year, 2021 as the estimated year, and years from 2022 to 2026 are considered the forecast period.

Cumulative Impact of COVID-19:

COVID-19 is an incomparable global public health emergency that has affected almost every industry, and the long-term effects are projected to impact the industry growth during the forecast period. This ongoing research amplifies this research framework to ensure the inclusion of underlying COVID-19 issues and potential paths forward.

The report delivers insights on COVID-19 considering the changes in consumer behavior and demand, purchasing patterns, re-routing of the supply chain, dynamics of current market forces, and the significant interventions of governments. The updated study provides insights, analysis, estimations, and forecasts, considering the COVID-19 impact on the market.

Competitive Strategic Window:

The Competitive Strategic Window analyses the competitive landscape in terms of markets, applications, and geographies to help the vendor define an alignment or fit between their capabilities and opportunities for future growth prospects. It describes the optimal or favorable fit for the vendors to adopt successive merger and acquisition strategies, geography expansion, research & development, and new product introduction strategies to execute further business expansion and growth during a forecast period.

FPNV Positioning Matrix:

The FPNV Positioning Matrix evaluates and categorizes the vendors in the Wind Turbine Market based on Business Strategy (Business Growth, Industry Coverage, Financial Viability, and Channel Support) and Product Satisfaction (Value for Money, Ease of Use, Product Features, and Customer Support) that aids businesses in better decision making and understanding the competitive landscape.

Market Share Analysis:

The Market Share Analysis offers the analysis of vendors considering their contribution to the overall market. It provides the idea of its revenue generation into the overall market compared to other vendors in the space. It provides insights into how vendors are performing in terms of revenue generation and customer base compared to others. Knowing market share offers an idea of the size and competitiveness of the vendors for the base year. It reveals the market characteristics in terms of accumulation, fragmentation, dominance, and amalgamation traits.

Company Usability Profiles:

The report profoundly explores the recent significant developments by the leading vendors and innovation profiles in the

  • Acciona Energia SA
  • Bergey Windpower Co.
  • Clipper Windpower, LLC
  • E.ON SE
  • Eaton Corporation
  • EDF SA
  • Enercon GmbH
  • Envision Energy Limited
  • General Electric Company
  • Guodian United Power Technology Company Limited
  • Hitachi, Ltd.
  • Ming Yang Wind Power Group Limited
  • NextEra Energy Inc.
  • Nordex SE
  • Orient Green Power Company Limited
  • Orsted AS
  • Senvion SA
  • Suzlon Energy Ltd
  • Vestas Wind Systems A/S
  • Xinjiang Goldwind Science & Technology Co. Ltd.

Key Topics Covered:

1. Preface

1.1. Objectives of the Study

1.2. Market Segmentation & Coverage

1.3. Years Considered for the Study

1.4. Currency & Pricing

1.5. Language

1.6. Limitations

1.7. Assumptions

1.8. Stakeholders

2. Research Methodology

2.1. Define: Research Objective

2.2. Determine: Research Design

2.3. Prepare: Research Instrument

2.4. Collect: Data Source

2.5. Analyze: Data Interpretation

2.6. Formulate: Data Verification

2.7. Publish: Research Report

2.8. Repeat: Report Update

3. Executive Summary

3.1. Introduction

3.2. Market Outlook

3.3. Geography Outlook

3.4. Competitor Outlook

4. Market Overview

4.1. Introduction

4.2. Cumulative Impact of COVID-19

5. Market Insights

5.1. Market Dynamics

5.1.1. Drivers

5.1.1.1. Increasing demand for economical and efficient renewable energy source such as zero greenhouse gas emission

5.1.1.2. Growing investment for the adoption of offshore wind energy globally

5.1.1.3. Favorable government policies in the implementation of renewable sources

5.1.2. Restraints

5.1.2.1. Relatively high cost of production and maintenance

5.1.3. Opportunities

5.1.3.1. Ongoing integration of technology such as internet of things, artificial intelligence, and data analytics in turbines

5.1.3.2. Rapid technological advancements such as 3D printing, high capacity of wind turbines, and floating wind turbines

5.1.4. Challenges

5.1.4.1. Availability of alternative renewable resource such as solar

5.2. Porters Five Forces Analysis

5.2.1. Threat of New Entrants

5.2.2. Threat of Substitutes

5.2.3. Bargaining Power of Customers

5.2.4. Bargaining Power of Suppliers

5.2.5. Industry Rivalry

6. Americas Wind Turbine Market

7. Asia-Pacific Wind Turbine Market

8. Europe, Middle East & Africa Wind Turbine Market

9. Competitive Landscape

9.1. FPNV Positioning Matrix

9.1.1. Quadrants

9.1.2. Business Strategy

9.1.3. Product Satisfaction

9.2. Market Ranking Analysis

9.3. Market Share Analysis, By Key Player

9.4. Competitive Scenario

9.4.1. Merger & Acquisition

9.4.2. Agreement, Collaboration, & Partnership

9.4.3. New Product Launch & Enhancement

9.4.4. Investment & Funding

9.4.5. Award, Recognition, & Expansion

10. Company Usability Profiles

For more information about this report visit https://www.researchandmarkets.com/r/qmvshj


Contacts

ResearchAndMarkets.com
Laura Wood, Senior Press Manager
This email address is being protected from spambots. You need JavaScript enabled to view it.
For E.S.T Office Hours Call 1-917-300-0470
For U.S./CAN Toll Free Call 1-800-526-8630
For GMT Office Hours Call +353-1-416-8900

IRVING, Texas--(BUSINESS WIRE)--The Board of Directors of Exxon Mobil Corporation today declared a cash dividend of $0.87 per share on the Common Stock, payable on September 10, 2021 to shareholders of record of Common Stock at the close of business on August 13, 2021.


This third quarter dividend is at the same level as the dividend paid in the second quarter of 2021.

Through its dividends, the corporation has shared its success with its shareholders for more than 100 years.


Contacts

CONTACT: Media Relations
972-940-6007

  • Significant new oil discovery located southeast of Uaru and west of Yellowtail
  • Could form the basis for a future development in the Stabroek Block
  • Adds to the previous recoverable resource estimate of approximately 9 billion oil equivalent barrels
  • More than 2,600 Guyanese supporting oil and gas activities in country

IRVING, Texas--(BUSINESS WIRE)--ExxonMobil today said it made a discovery at Whiptail in the Stabroek Block offshore Guyana. The Whiptail-1 well encountered 246 feet (75 meters) of net pay in high quality oil bearing sandstone reservoirs. Drilling is also ongoing at the Whiptail-2 well, which has encountered 167 feet (51 meters) of net pay in high quality oil bearing sandstone reservoirs. Drilling continues at both wells to test deeper targets, and results will be evaluated for future development.


The Whiptail discovery is located approximately 4 miles southeast of the Uaru-1 discovery that was announced in January 2020 and approximately 3 miles west of the Yellowtail field. Whiptail-1 is being drilled in 5,889 feet (1,795 meters) of water by the Stena DrillMAX. Whiptail-2, which is located 3 miles northeast of Whiptail-1, is currently being drilled in 6,217 feet (1,895 meters) of water by the Noble Don Taylor.

“This discovery increases our confidence in the resource size and quality in the southeast area of the Stabroek Block and could form the basis for a future development as we continue to evaluate the best sequence of development opportunities within the block,” said Mike Cousins, senior vice president of exploration and new ventures at ExxonMobil.

ExxonMobil envisions at least six projects online by 2027 and sees potential for up to 10 projects to develop its current recoverable resource base.

The Liza Destiny floating production storage and offloading (FPSO) vessel is currently producing about 120,000 barrels of oil per day.

The startup of Liza Phase 2 remains on target for early 2022, and the Liza Unity FPSO expects to sail from Singapore to Guyana in late August 2021. The Unity has a production capacity of approximately 220,000 barrels of oil per day.

The hull for the Prosperity FPSO vessel is complete, and topsides construction activities are ongoing in Singapore with a startup target of 2024. The first Payara development well was spudded in June 2021, and the offshore SURF installation will begin in 3Q 2021.

Yellowtail has been identified as the fourth development project in the Stabroek Block offshore Guyana with anticipated startup in 2025. Following necessary government approvals and a final investment decision, this project will develop the Yellowtail and Redtail fields, which are located about 19 miles (30 kilometers) southeast of the Liza developments, and potentially adjacent resources.

These new projects continue to contribute to the advancement of the Guyanese economy. More than 2,600 Guyanese are now supporting project activities on and offshore, which reflects an increase of more than 20 percent since the end of 2019. ExxonMobil and its key contractors have spent approximately US$388 million with more than 800 local companies since 2015.

The Stabroek Block is 6.6 million acres (26,800 square kilometers). ExxonMobil affiliate Esso Exploration and Production Guyana Limited is operator and holds 45 percent interest in the Stabroek Block. Hess Guyana Exploration Ltd. holds 30 percent interest and CNOOC Petroleum Guyana Limited, a wholly-owned subsidiary of CNOOC Limited, holds 25 percent interest.

About ExxonMobil

ExxonMobil, one of the largest publicly traded international energy companies, uses technology and innovation to help meet the world’s growing energy needs. ExxonMobil holds an industry-leading inventory of resources, is one of the largest refiners and marketers of petroleum products, and its chemical company is one of the largest in the world. To learn more, visit exxonmobil.com and the Energy Factor.

Follow us on Twitter and LinkedIn.

Cautionary Statement: Statements of future events or conditions in this release are forward-looking statements. Actual future results, including project plans, schedules, capacities, production rates, and resource recoveries could differ materially due to: changes in market conditions affecting the oil and gas industry or long-term oil and gas price levels; political or regulatory developments including obtaining necessary regulatory permits; restrictions in trade, travel or other government responses to current or future outbreaks of COVID-19; reservoir performance; the outcome of future exploration efforts; timely completion of development and construction projects; technical or operating factors; the outcome of commercial negotiations; unexpected technological breakthroughs or challenges; and other factors cited under the caption “Factors Affecting Future Results” on the Investors page of our website at exxonmobil.com and under Item 1A. Risk Factors in our annual report on Form 10-K and quarterly reports on Form 10-Q. References to “recoverable resources,” “oil-equivalent barrels,” and other quantifies of oil and gas include estimated quantities that are not yet classified as proved reserves under SEC definitions but are expected to be ultimately recoverable. The term “project” can refer to a variety of different activities and does not necessarily have the same meaning as in any government payment transparency reports.


Contacts

ExxonMobil Media Relations
(972) 940-6007

BETHESDA, Md.--(BUSINESS WIRE)--Enviva Partners, LP (NYSE: EVA) (“Enviva,” the “Partnership,” “we,” “us,” or “our”) today announced the declaration of its 24th consecutive quarterly distribution increase and reported financial and operating results for the second quarter of 2021. Additionally, the Partnership reaffirmed its previously announced full-year 2021 and 2022 guidance.

Highlights:

  • For the second quarter of 2021, the Partnership declared a distribution of $0.815 per common unit, a 6.5% increase over the second quarter of 2020 and its 24th consecutive quarterly distribution increase since its IPO
  • For the second quarter of 2021, the Partnership reported net income of $2.6 million, adjusted net income of $9.8 million, and adjusted EBITDA of $48.9 million. Adjusted EBITDA increased by 30.7% over the same period in 2020
  • The Partnership completed the previously announced acquisitions of the fully contracted Lucedale plant and Pascagoula terminal and associated equity financing
  • The Partnership reaffirmed full-year 2021 and 2022 financial guidance, which includes per-unit distributions of at least $3.30 and $3.62, respectively, each before considering the benefit of any additional drop-downs or other acquisitions
  • The Partnership’s sponsor announced the signing of a new 17-year take-or-pay off-take contract to supply a major Japanese trading house with 210,000 metric tons per year (“MTPY”) of wood pellets. Deliveries under the contract are expected to commence in 2025
  • The Partnership’s sponsor also announced the signing of a memorandum of understanding (“MOU”) with a major European utility for the supply of approximately 60,000 MTPY of wood pellets to a facility in the Netherlands for a term of 12 years starting in early 2024

“During the second quarter of 2021, Enviva delivered results in line with our expectations for the quarter and laid the foundation for a very strong back half of the year,” said John Keppler, Chairman and Chief Executive Officer. “With the benefit of the commissioning and ramp of our Northampton, Southampton, and Greenwood plant expansions, continued progress on our Multi-Plant Expansions, and the substantial contracted cash flow acquired with the drop-downs of the Lucedale plant and Pascagoula terminal, we were pleased to increase our guidance for 2021, announce guidance for 2022, and complete a sizeable equity raise. We believe Enviva is firmly on track to deliver a strong full-year 2021 and an even more robust 2022.”

Second-Quarter 2021 Financial Results

$ millions, unless noted

Second Quarter 2021

Second Quarter 2020

% Change

Net Revenue

285.0

167.7

70.0

Gross Margin

27.3

27.7

(1.3)

Adjusted Gross Margin

56.1

42.0

33.4

Net Income

2.6

8.5

(69.4)

Adjusted Net Income

9.8

8.7

12.7

Adjusted EBITDA

48.9

37.4

30.7

Distributable Cash Flow Attributable to Enviva Partners, LP

32.9

25.9

27.1

Adjusted Gross Margin $/metric ton

41.02

49.55

(17.2)

The financial results for the second quarter of 2021 outlined above, which were substantially in line with management's expectations, benefited from incremental production and sales related to acquisitions and operational improvements executed in 2020. Similar to previous years, the Partnership expects net income, adjusted EBITDA, and distributable cash flow attributable to Enviva Partners, LP (“DCF”) for the second half of 2021 to be significantly higher than for the first half of the year and for the fourth quarter to be a significant step up from the third. Select financial highlights for the second quarter include:

  • Net revenue increased by $117.3 million, or 70.0%, for the second quarter of 2021 as compared to the second quarter of 2020, substantially as a result of an increase in product sales
  • Gross margin for the second quarter of 2021 decreased by $0.4 million, or 1.3%, as compared to the second quarter of 2020 principally due to higher revenue being offset by higher cost of goods sold. The Partnership recognized higher cost of goods sold during the second quarter of 2021 as compared to the second quarter of 2020 primarily as a result of (i) higher finished product costs given increased sales volumes, (ii) a greater percentage of the sales volumes being volumes procured from third parties, (iii) costs incurred during the commissioning of expansion projects, and (iv) an increase in depreciation and amortization expense associated with the Greenwood plant drop-down and Waycross plant acquisition in July of 2020
  • Adjusted gross margin for the second quarter of 2021 increased by $14.1 million, or 33.4%, as compared to the second quarter of 2020. The increase in adjusted gross margin is primarily attributable to higher sales volumes and higher pricing due to customer contract mix, which were partially offset by higher cost of goods sold as described above
  • Adjusted gross margin per metric ton (“MT”) for the second quarter of 2021 decreased by $8.53, or 17.2%, as compared to the second quarter of 2020. The decrease in adjusted gross margin per MT is primarily attributable to the factors impacting adjusted gross margin noted above
  • The Partnership generated net income of $2.6 million for the second quarter of 2021 as compared to net income of $8.5 million for the corresponding period in 2020. Adjusted net income for the second quarter of 2021 increased by $1.1 million, or 12.7%, as compared to the corresponding period in 2020
  • Adjusted EBITDA for the second quarter of 2021 increased by $11.5 million, or 30.7%, as compared to the second quarter of 2020, primarily due to higher sales volumes. DCF increased by $7.0 million, or 27.1%, for the second quarter of 2021 as compared to the corresponding period in 2020
  • The Partnership’s liquidity as of June 30, 2021, which included cash on hand and availability under our $525.0 million revolving credit facility, was $567.6 million
  • The Partnership continues to report that, during the first half of 2021 and to date, our operating and financial results have not been materially impacted by the ongoing coronavirus pandemic (“COVID-19”) and all of our customers have performed in accordance with their contracts with us

Acquisition and Financing Activities

On July 1, 2021, the Partnership completed the previously announced transaction to purchase from Enviva Holdings, LP (our “sponsor”) a wood pellet production plant in Lucedale, Mississippi (the “Lucedale plant”), a deep-water marine terminal in Pascagoula, Mississippi (the “Pascagoula terminal”), and three long-term, take-or-pay off-take contracts with creditworthy Japanese counterparties (the “Associated Off-Take Contracts”), which we refer to collectively as the “Acquisitions.”

The Partnership purchased the Lucedale plant for cash consideration of $156 million and expects to further invest $59 million in remaining construction capital expenditures. The Lucedale plant is expected to commence operations during the second half of 2021. The acquisition of the Lucedale plant includes an embedded, fully permitted option to expand production capacity by approximately 300,000 MTPY for around $60 million in estimated capital costs. This expansion project, if executed by the Partnership, is expected to generate incremental annual adjusted EBITDA of approximately $15 million, which represents an attractive adjusted EBITDA investment multiple of approximately four times.

The Partnership purchased the Pascagoula terminal for cash consideration of $104 million and expects to further invest $26 million in remaining construction capital expenditures and for the terminal to commence operations during the third quarter of 2021. The Pascagoula terminal is expected to have total throughput capacity of 3 million MTPY when fully constructed, allowing for throughput from multiple plants.

Three long-term, take-or-pay off-take contracts were assigned to the Partnership as part of the Acquisitions. These contracts are with creditworthy Japanese counterparties, have maturities ranging between 2034 and 2045, represent aggregate annual deliveries of 630,000 MTPY, and add a total of $1.9 billion to Enviva’s fully contracted sales backlog.

To support the Partnership during completion and ramp-up of the Acquisitions, our sponsor has agreed to (i) waive $53 million of certain management services and other fees that otherwise would be owed by the Partnership from the third quarter of 2021 through the fourth quarter of 2023, (ii) provide protection against construction delays, cost overruns, and production shortfalls, and (iii) guarantee a minimum throughput volume at the Pascagoula terminal for 20 years. Similar to the previously executed drop-down transactions of our Hamlet and Greenwood plants, we expect this support will significantly de-risk the financial performance of the Acquisitions and provide us with enhanced cash flow certainty.

In 2022, we expect the Acquisitions to generate a net loss in the range of $6.4 million to $8.4 million and adjusted EBITDA in the range of $40.0 million to $42.0 million. Once the Associated Off-Take Contracts are fully ramped in 2025, we expect the Acquisitions to generate net income in the range of $18.9 million to $20.9 million and adjusted EBITDA in the range of $43.0 million to $45.0 million.

Consistent with Enviva’s conservative financial policy of financing acquisitions and growth initiatives with 50% equity and 50% debt, the Partnership issued a total of 4,925,000 common units for approximately $224 million of gross proceeds to partially finance the Acquisitions as well as the Partnership’s previously announced expansions of its wood pellet production plants in Sampson, North Carolina, Hamlet, North Carolina, and Cottondale, Florida (collectively the “Multi-Plant Expansions”). The Partnership expects to fund the remainder of the total investment in the Acquisitions and Multi-Plant Expansions with borrowings under its revolving credit facility.

Distribution

On July 27, 2021, the board of directors of the Partnership’s general partner (the “Board”) declared a distribution of $0.815 per common unit for the second quarter of 2021, an increase of 6.5% over the corresponding period in 2020. This distribution represents the 24th consecutive distribution increase since the Partnership’s IPO. The Partnership’s DCF, net of amounts attributable to incentive distribution rights, of $22.2 million for the second quarter of 2021 covered the distribution for the quarter at 0.61 times. The quarterly distribution will be paid on Friday, August 27, 2021, to unitholders of record as of the close of business on Friday, August 13, 2021.

When determining the distribution for a quarter, the Board evaluates the Partnership’s distribution coverage ratio on a forward-looking annual basis, after taking into consideration its expected DCF, net of expected amounts attributable to incentive distribution rights, for the full year. On this basis, the Partnership continues to target a distribution coverage ratio of 1.2 times on a forward-looking annual basis.

2021 and 2022 Guidance Reaffirmed

On the basis of the financial results of the first six months of 2021 and the Partnership’s expectations for full-year 2021 and 2022, the Partnership reaffirms the guidance previously issued on June 3, 2021 in conjunction with the announcement of the Acquisitions. Specifically, after accounting for the expected benefit of the Acquisitions, the Partnership expects:

$ millions, unless noted

2021

2022

Net Income

29.4 - 49.4

96.0 - 116.0

Adjusted EBITDA

250.0 - 270.0

310.0 - 330.0

DCF

180.0 - 200.0

242.0 - 262.0

Distribution per Common Unit

≥$3.30/unit

≥$3.62/unit

Distribution Coverage Ratio (on a forward-looking annual basis)

≥1.2 times

≥1.2 times

The guidance amounts provided above include the benefit of the recently completed Acquisitions, but do not include the impact of any additional acquisitions by the Partnership from our sponsor or third parties.

The Partnership’s quarterly income and cash flow are subject to seasonality and the mix of customer shipments made, which vary from period to period. Similar to previous years, the Partnership expects net income, adjusted EBITDA, and DCF for the second half of 2021 to be significantly higher than for the first half of the year, and for the fourth quarter to be a significant step up from the third quarter. Drivers of this expected growth are primarily comprised of (i) increased revenue generated from Japanese customers as deliveries commence under previously signed contracts, (ii) increased adjusted gross margin per MT due to seasonality benefits, (iii) increased production capabilities as the Mid-Atlantic and Greenwood expansions continue to ramp, and (iv) the adjusted EBITDA contribution from the Acquisitions.

Market and Contracting Update

Global commitments and significant progress made by regulators, policymakers, utilities, and power generators to achieve net-zero emissions, combined with favorable legislative and policy recommendations supporting incremental utilization of sustainably sourced biomass, continue to reinforce the growing long-term market opportunity for the Partnership’s product around the world.

Global Market

In May of 2021, the International Energy Agency (“IEA”) released the world’s first comprehensive study of how to transition to a net-zero energy system by 2050. The “Net Zero by 2050 Roadmap” sets out more than 400 milestones to achieve carbon neutrality by 2050, including an immediate end to new fossil fuel supply projects and a phase-out of all coal-fired power plants by 2040. The report once again highlights the pivotal role to be played by biomass in achieving the target. The IEA foresees modern bioenergy (of which solid biomass is a subset) meeting almost 20% of total global energy supply by 2050, with solid bioenergy (of which woody biomass is a subset) growing to the equivalent of 14% of total global energy supply. In the electricity sector alone, solid biomass is forecasted to contribute 5% of total global power generation.

European Market

On July 14, 2021, the European Commission (the “Commission”) proposed an update to the 2018 Renewable Energy Directive. This is part of the “Fit for 55” package, which is intended to deliver a 55% reduction in carbon dioxide (“CO2”) emissions from 1990 levels by 2030, a key milestone needed to reach carbon neutrality by 2050. In the package, the Commission continues to recognize the importance of sustainable biomass in meeting aggressive emissions-reductions goals and its indispensable role in mitigating climate change. As drafted, the proposals for further defining sustainability criteria for biomass are generally in line with Enviva’s existing practices and, as the political process progresses towards binding legislation, we will work with key stakeholders to ensure the European Union (“EU”) only sources biomass that provides a positive contribution to our climate and sustainable forest growth and management.

The EU’s commitment to ambitious emissions-reductions goals continues to drive higher carbon prices, and new EU Emissions Trading System (“EU-ETS”) reforms included in the Fit for 55 package suggest that trend will continue. Since November 2020, EU-ETS prices have more than doubled, allowing biomass to be more profitable in energy generation than carbon-intensive feedstocks such as coal and natural gas, even in markets where there are no direct incentives or subsidies for renewable energy generation. Today, prices have stabilized around the 50 €/MT mark and, given this attractive economic backdrop, we have seen increased momentum around fuel-switching decisions.

In Germany, regulations for long-term financial support to decarbonize district heating networks with renewable alternatives including biomass are expected to be finalized during the third quarter as part of the priority initiatives of the Federal Ministry for Economic Affairs and Energy, with similar regulations for electricity generation conversions from fossil fuels to biomass expected thereafter. The finalization of these regulations should provide a clear path for Enviva and its sponsor to complete commercial discussions currently underway with multiple major utility operators of heating networks and power generation facilities. As noted above, with current carbon pricing at levels where energy generated with biomass can be more profitable than fossil fuel alternatives, additional subsidy frameworks potentially will become less influential on end-user’s decisions to transition to biomass usage.

In the Netherlands, where the Partnership and our sponsor have been serving customers since 2012, we continue to advance new long-term contracts with European utilities and generators to deliver wood pellets into the Dutch power and heating markets. Recently, the Partnership’s sponsor signed an MOU with a major European utility regarding the supply of approximately 60,000 MTPY, for a term of 12 years starting in early 2024, to an industrial customer in the Netherlands.

Utilities have long been the prime consumers of biomass in Europe, but the global industrial sector is becoming an emerging market for the Partnership and our sponsor, where energy-intensive industrial companies are evaluating both coal-to-biomass conversions and adding carbon capture and storage infrastructure to their energy supply chain. We recently delivered test volumes to a number of large European industrial companies to pilot biomass as a solution for reducing their enterprise-wide carbon footprint.

Poland, which has one of the highest per-capita rates of coal usage in the EU, is moving swiftly to decarbonize in order to meet 2030 and 2050 renewable energy targets. In the Polish National Energy and Climate Plan, the government declared that “by 2030, the consumption of biomass for heat production in heating plants must grow almost 10 times.” The government is consolidating coal plants to manage the transformation of its asset base, and is in the process of amending renewable energy regulation, which we believe will support the conversion of coal plants to biomass usage. Following a similar approach employed to develop the Japanese market, our sponsor has formed a local business development team in Warsaw.

United Kingdom Market

According to recent research conducted by Imperial College London and Drax, biomass accounted for 11% of the United Kingdom’s (“U.K.”) power generation in 2020, the highest of any country in the world. Citing conversion to biomass as one of the key factors contributing to coal plant closures, the report estimates that coal-to-biomass conversions reduced carbon emissions by 10 million tons of CO2 in 2019 compared to 2012, even surpassing the carbon-emissions reduction achieved by the eight gigawatts of onshore wind farms installed during the same period. The report added that bioenergy with carbon capture and storage (“BECCS”) could remove up to 40 million tons of CO2 per year by the middle of this decade. The U.K. government is currently evaluating a new biomass strategy, which is the first step in the process for developing a support framework for BECCS projects that could be a prerequisite for the U.K. to meet its commitment to net zero by 2050, prompting further long-term demand for our product in this market.

Asian Market

Today, our sponsor announced the signing of a new 17-year take-or-pay off-take contract to supply a major Japanese trading house with 210,000 MTPY of wood pellets. The contract is subject to certain conditions precedent, which our sponsor expects to be met during 2021. Deliveries related to the contract are expected to commence in 2025. This contract brings the total contracted volumes for long-term deliveries to Japanese customers to approximately 4 million MTPY under agreements which extend out in many cases to the 2040s. The rapidly growing Japanese market remains a core growth segment for the Partnership and our sponsor. We remain in ongoing negotiations for additional long-term volumes with customers in the industrial segment as well as in other key market segments, which include projects that benefit from the 20-year government-sponsored feed-in-tariff in Japan and other projects designed to utilize biomass to improve overall thermal efficiency in co-firing power plant opportunities.

Along with Japan, Taiwan is currently one of the largest coal consumers in Asia. Taiwan has implemented the Renewable Energy Act and the Greenhouse Gas Reduction and Management Act (the “GHG Act”), which provide financial and tax incentives to encourage the development of renewable energy sources needed to achieve carbon-neutrality goals. A forthcoming update to the GHG Act is expected to include biomass as a solution to reduce coal consumption. As with Japan and recently Poland, our sponsor has engaged a local business development team based in Taipei to develop this emerging biomass market.

Corporate Summary

As of July 1, 2021, the Partnership’s current production capacity is matched with a portfolio of firm, take-or-pay off-take contracts that has a total weighted-average remaining term of approximately 13.2 years and a total product sales backlog of approximately $16.0 billion. Assuming all volumes under the firm and contingent off-take contracts held by our sponsor and the Partnership were included, our total weighted-average remaining term and product sales backlog would increase to approximately 14.4 years and approximately $20.4 billion, respectively.

Sustainability

Sustainability is the core of our value proposition in our mission to displace coal, grow more trees, and fight climate change. This is because healthy, growing forests remain one of the most critical tools in the fight to mitigate climate change, and sustainable forest management is part of every plan outlined by the UN Intergovernmental Panel on Climate Change (the “IPCC”) to limit global warming to less than 1.5 degrees Celsius. Specifically, the IPCC’s Special Report on Climate Change and Land, which is considered by global policymakers to be one of the key science-based blueprints for climate change mitigation, declared that “a sustainable forest management strategy aimed at maintaining or increasing forest carbon stocks, while producing an annual sustained yield of timber, fiber, or energy from the forest, will generate the largest sustained [climate change] mitigation benefit.”

One of the ways in which we demonstrate leadership in sustainable forestry is through rigorous third-party audits of our forestry activities and supply chain and maintenance of stringent, internationally recognized sustainable forestry certifications like Forest Stewardship Council (FSC®), Sustainable Forestry Initiative (SFI®), Programme for the Endorsement of Forest Certification (PEFC®), and the Sustainable Biomass Program (SBP). These certifications have been consistently reviewed and renewed and we have never had a notable deficiency under these audits or certifications. Every customer delivery we have made since we commenced shipments over a decade ago has arrived within the agreed upon timeframe and has met or exceeded the sustainability specifications required. This unparalleled track record is a result of our intense and ongoing investment in supply chain management and transparency to ensure that our procurement activities do the right thing, the right way, all of the time. We maintain the data set to demonstrate this commitment, which we then share transparently on our website and directly with key stakeholders.

For instance, our proprietary, industry-leading Tr


Contacts

Investor Contact:

Kate Walsh
Vice President, Investor Relations
This email address is being protected from spambots. You need JavaScript enabled to view it.


Read full story here

Company reports record second quarter revenue and operating income

SCHAFFHAUSEN, Switzerland--(BUSINESS WIRE)--Garmin® Ltd. (NASDAQ: GRMN), today announced results for the second quarter ended June 26, 2021.


Highlights for second quarter 2021 include:

  • Total revenue of $1.33 billion, a 53% increase over the prior year quarter with double-digit growth in all segments
  • Gross margin of 58.8% compared to 59.3% in the prior year quarter
  • Operating margin improved to 28.0% compared to 21.7% in the prior year quarter
  • Operating income of $371 million, a 97% increase over the prior year quarter
  • GAAP EPS was $1.64 and pro forma EPS(1) was $1.68, representing 85% growth in pro forma EPS over the prior year quarter
  • Garmin Autoland was awarded the 2020 Robert J. Collier Trophy, which recognizes the greatest achievements in aeronautics or astronautics in America
  • Expanded our family of health and fitness smartwatches with the launch of Venu 2 and Venu 2S
  • Launched Descent Mk2S, our smallest watch-style dive computer

(In thousands, except per share information)

13-Weeks Ended

26-Weeks Ended


June 26,


June 27,


YoY


June 26,


June 27,


YoY


2021


2020


Change


2021


2020


Change

Net sales

$

1,326,905


$

869,867


53

%

$

2,399,232


$

1,725,975


39

%

Fitness


413,201


294,642


40

%


721,326


518,242


39

%

Outdoor


323,405


206,200


57

%


579,859


381,302


52

%

Aviation


180,832


126,140


43

%


354,721


314,739


13

%

Marine


261,790


157,827


66

%


471,163


320,832


47

%

Auto


147,677


85,058


74

%


272,163


190,860


43

%


Gross margin %


58.8

%


59.3

%


59.3

%


59.2

%


Operating income %


28.0

%


21.7

%


25.9

%


21.2

%


GAAP diluted EPS

$

1.64


$

0.96


71

%

$

2.78


$

1.80


54

%

Pro forma diluted EPS(1)

$

1.68


$

0.91


85

%

$

2.85


$

1.82


57

%


(1) See attached Non-GAAP Financial Information for discussion and reconciliation of non-GAAP financial measures, including pro forma diluted EPS

Executive Overview from Cliff Pemble, President and Chief Executive Officer:

“Strong demand for active lifestyle products continued, and we experienced solid recovery within our aviation and auto segments resulting in record revenue and profits in the second quarter,” said Cliff Pemble, President and CEO of Garmin. “We are very pleased with the results we have delivered thus far, giving us confidence to raise our full year 2021 revenue and EPS guidance.”

Fitness:

Revenue from the fitness segment grew 40% in the second quarter driven by strong demand for our cycling and advanced wearable products. Gross margin and operating margin were 54% and 28%, respectively, resulting in 62% operating income growth. During the quarter, we launched the Forerunner 945 LTE, bringing safety and real-time tracking features to our premium GPS running smartwatch. This watch is designed to allow runners to send for help, if necessary, and stay connected without their phones. In addition, we celebrated Global Running Day with the launch of the Forerunner 55, an easy-to-use smartwatch that encourages runners of all skill levels to get out and run.

Outdoor:

Revenue from the outdoor segment grew 57% in the second quarter with growth across all categories led by strong demand for adventure watches. Gross margin and operating margin were 64% and 38%, respectively, resulting in 81% operating income growth. During the quarter, we launched Descent Mk2S, a stylish smartwatch featuring multiple dive modes, multisport training and smart features. We also debuted our children’s book, “Women of Adventure: Being Brave in a Big World,” featuring six stories from our Women of Adventure series. The book captures the traits that make each woman unique while touching on the science behind her sport or passion, to encourage readers to explore the world and find ways to be brave every day.

Aviation:

Revenue from the aviation segment grew 43% in the second quarter with contributions from both OEM and aftermarket product categories. Gross margin and operating margin were 73% and 28%, respectively, resulting in 226% operating income growth. During the quarter, Garmin Autoland won the prestigious Robert J. Collier Trophy, for the world’s first autonomous system designed to activate during an emergency to safely fly and land an aircraft without human interaction. In addition, we announced the acquisition of AeroData, a leading provider of performance data solutions for commercial aircraft.

Marine:

Revenue from the marine segment grew 66% in the second quarter with growth across multiple categories, led by strong demand for our chartplotters. Gross margin and operating margin were 58% and 34%, respectively, resulting in 106% operating income growth. During the quarter, we announced the integration of our displays on Mercury-powered boats which can receive engine performance data via Mercury’s new SmartCraft Connect gateway, which enables monitoring of up to four engines simultaneously. We launched the MSC 10 marine satellite compass, a GPS-based navigation tool with multi-band GNSS and a fully integrated attitude and heading reference system for a smooth and accurate GPS-derived heading and position on the water. Also, with the assistance of our innovative marine electronics, Hank Cherry, a Garmin sponsored angler, won the Bassmaster Classic.

Auto:

Revenue from the auto segment grew 74% during the second quarter driven by both auto OEM programs and consumer auto products. Gross margin was 43%, and we recorded an operating loss of $8 million in the quarter driven by investments in auto OEM programs. During the quarter, we launched the dezl OTR500, truck navigator that adds PrePass weigh station bypass notifications saving drivers time, fuel and money. Also, we launched our first connected dash cam with automatic video storage and Live View monitoring options.

Additional Financial Information:

Total operating expenses in the second quarter were $410 million, a 25% increase over the prior year. Research and development increased by 21%, primarily due to engineering personnel costs across all segments. Selling, general and administrative expenses increased 26%, driven primarily by personnel related expenses and information technology costs. Advertising increased 47% driven primarily by higher spend in the fitness and outdoor segments.

The effective tax rate in the second quarter of 2021 was 14.8%.

In the second quarter of 2021, we generated approximately $120 million of free cash flow(1) and paid a quarterly dividend of approximately $117 million. We ended the quarter with cash and marketable securities of approximately $3.2 billion.


(1)


See attached Non-GAAP Financial Information for discussion and reconciliation of non-GAAP financial measures, including pro forma effective tax rate and free cash flow.

2021 Guidance(2):

Based on our strong performance in the first half of 2021, we are updating our full year guidance. We now anticipate revenue of approximately $4.9 billion with projected growth in all segments. We anticipate our full year pro forma EPS will be approximately $5.50 based on a gross margin of approximately 58.5%, operating margin of approximately 23.8% and a full year pro forma effective tax rate of approximately 11.5%.


2021 Guidance


Segment


Revenue Growth Estimates


Updated


Prior


Updated


Prior

Revenue


$4.9B


$4.6B


Fitness


17%


10%

Gross Margin


58.5%


59.2%


Outdoor


17%


10%

Operating Margin


23.8%


23.5%


Aviation


10%


5%

Tax Rate


11.5%


10.5%


Marine


27%


15%

EPS


$5.50


$5.15


Auto


15%


5%


(2) All amounts and %s in the above 2021 Guidance tables are approximate. Also, see attached discussion on Forward-looking Financial Measures

Webcast Information/Forward-Looking Statements:

The information for Garmin Ltd.’s earnings call is as follows:

When:

Wednesday, July 28, 2021 at 10:30 a.m. Eastern

Where:

https://www.garmin.com/en-US/investors/events/

How:

Simply log on to the web at the address above or call to listen in at 855-757-3897

An archive of the live webcast will be available until July 27, 2022 on the Garmin website at www.garmin.com. To access the replay, click on the Investors link and click over to the Events Calendar page.

This release includes projections and other forward-looking statements regarding Garmin Ltd. and its business that are commonly identified by words such as “anticipates,” “would,” “may,” “expects,” “estimates,” “plans,” “intends,” “projects,” and other words or phrases with similar meanings. Any statements regarding the Company’s expected fiscal 2021 GAAP and pro forma estimated earnings, EPS, and effective tax rate, and the Company’s expected segment revenue growth rates, consolidated revenue, gross margins, operating margins, potential future acquisitions, currency movements, expenses, pricing, new products launches, market reach, statements relating to possible future dividends, statements related to the ongoing impact of the COVID-19 pandemic, and the Company’s plans and objectives are forward-looking statements. The forward-looking events and circumstances discussed in this release may not occur and actual results could differ materially as a result of risk factors and uncertainties affecting Garmin, including, but not limited to, the risk factors that are described in both the Annual Report on Form 10-K for the year ended December 26, 2020 and the Quarterly Report on Form 10-Q for the quarter ended June 26, 2021 filed by Garmin with the Securities and Exchange Commission (Commission file number 0-31983). A copy of Garmin’s 2020 Form 10-K and the Q2 2021 Form 10-Q can be downloaded from https://www.garmin.com/en-US/investors/sec/. All information provided in this release and in the attachments is as of June 26, 2021. Undue reliance should not be placed on the forward-looking statements in this press release, which are based on information available to us on the date hereof. We undertake no duty to update this information unless required by law.

This release and the attachments contain non-GAAP financial measures. A reconciliation to the nearest GAAP measure and a discussion of the Company's use of these measures are included in the attachments.

Garmin, the Garmin logo, the Garmin delta, Forerunner are trademarks of Garmin Ltd. or its subsidiaries and are registered in one or more countries, including the U.S. Descent and dezl are trademarks of Garmin Ltd. or its subsidiaries. All other brands, product names, company names, trademarks and service marks are the properties of their respective owners. All rights reserved

Garmin Ltd. and Subsidiaries


Condensed Consolidated Statements of Income (Unaudited)


(In thousands, except per share information)


13-Weeks Ended


26-Weeks Ended


June 26,


June 27,


June 26,


June 27,


2021


2020


2021


2020


Net sales


$

1,326,905


$

869,867


$

2,399,232


$

1,725,975


Cost of goods sold


546,054


354,437


976,825


703,605


Gross profit


780,851


515,430


1,422,407


1,022,370


Advertising expense


42,939


29,285


74,000


56,165


Selling, general and administrative expense


165,759


132,016


323,381


269,202


Research and development expense


200,981


165,740


404,195


331,131


Total operating expense


409,679


327,041


801,576


656,498


Operating income


371,172


188,389


620,831


365,872


Other income (expense):


Interest income


7,018


10,455


14,670


22,481


Foreign currency losses


(7,326

)


(4,493

)


(15,607

)


(19,916

)

Other income


1,195


3,241


2,679


6,789


Total other income (expense)


887


9,203


1,742


9,354


Income before income taxes


372,059


197,592


622,573


375,226


Income tax provision


55,062


13,412


85,548


29,866


Net income


$

316,997


$

184,180


$

537,025


$

345,360


Net income per share:


Basic


$

1.65


$

0.96


$

2.80


$

1.81


Diluted


$

1.64


$

0.96


$

2.78


$

1.80


Weighted average common shares outstanding:


Basic


192,150


191,024


192,023


190,914


Diluted


192,871


191,597


192,840


191,640


Garmin Ltd. and Subsidiaries


Condensed Consolidated Balance Sheets (Unaudited)


(In thousands, except per share information)


June 26,
2021


December 26,
2020


Assets


Current assets:


Cash and cash equivalents


$

1,639,447


$

1,458,442


Marketable securities


330,567


387,642


Accounts receivable, net


737,268


849,469


Inventories


938,607


762,084


Deferred costs


16,966


20,145


Prepaid expenses and other current assets


220,910


191,569


Total current assets


3,883,765


3,669,351


Property and equipment, net


957,924


855,539


Operating lease right-of-use assets


93,097


94,626


Marketable securities


1,203,705


1,131,175


Deferred income taxes


250,230


245,455


Noncurrent deferred costs


13,814


16,510


Intangible assets, net


820,116


828,566


Other assets


180,073


190,151


Total assets


$

7,402,724


$

7,031,373


Liabilities and Stockholders’ Equity


Current liabilities:


Accounts payable


$

303,947


$

258,885


Salaries and benefits payable


160,815


181,937


Accrued warranty costs


44,575


42,643


Accrued sales program costs


97,213


109,891


Deferred revenue


85,888


86,865


Accrued advertising expense


31,481


31,950


Other accrued expenses


140,807


149,817


Income taxes payable


78,797


68,585


Dividend payable


515,307


233,644


Total current liabilities


1,458,830


1,164,217


Deferred income taxes


124,149


116,844


Noncurrent income taxes


97,556


92,810


Noncurrent deferred revenue


43,554


49,934


Noncurrent operating lease liabilities


74,336


75,958


Other liabilities


20,051


15,494


Stockholders’ equity:


Shares, CHF 0.10 par value, 198,077 shares authorized and issued; 192,321 shares outstanding at June 26, 2021 and 191,571 shares outstanding at December 26, 2020


17,979


17,979


Additional paid-in capital


1,927,137


1,880,354


Treasury stock


(303,369

)


(320,016

)

Retained earnings


3,775,874


3,754,372


Accumulated other comprehensive income


166,627


183,427


Total stockholders’ equity


5,584,248


5,516,116


Total liabilities and stockholders’ equity


$

7,402,724


$

7,031,373


Garmin Ltd. and Subsidiaries


Condensed Consolidated Statements of Cash Flows (Unaudited)


(In thousands)


26-Weeks Ended


June 26, 2021


June 27, 2020


Operating Activities:


Net income


$

537,025


$

345,360


Adjustments to reconcile net income to net cash provided by operating activities:


Depreciation


48,776


37,030


Amortization


25,903


20,502


Loss (gain) on sale or disposal of property and equipment


207


(1,807

)

Unrealized foreign currency losses


12,205


16,678


Deferred income taxes


5,560


272


Stock compensation expense


45,301


31,484


Realized gain on marketable securities


(374

)


(331

)

Changes in operating assets and liabilities, net of acquisitions:


Accounts receivable, net of allowance for doubtful accounts


103,928


178,120


Inventories


(177,193

)


(57,126

)

Other current and non-current assets


(27,279

)


(10,427

)

Accounts payable


44,144


(51,463

)

Other current and non-current liabilities


(39,377

)


(58,662

)

Deferred revenue


(7,317

)


(19,301

)

Deferred costs


5,863


7,817


Income taxes payable


20,670


(13,035

)

Net cash provided by operating activities


598,042


425,111


Investing activities:


Purchases of property and equipment


(146,542

)


(98,270

)

Proceeds from sale of property and equipment


8


1,916


Purchase of intangible assets


(1,170

)


(1,374

)

Purchase of marketable securities


(755,360

)


(346,129

)

Redemption of marketable securities


720,937


566,688


Acquisitions, net of cash acquired


(15,893

)


(7,893

)

Net cash (used in) provided by investing activities


(198,020

)


114,938


Financing activities:


Dividends


(233,860

)


(217,450

)

Proceeds from issuance of treasury stock related to equity awards


35,733


15,202


Purchase of treasury stock related to equity awards


(17,604

)


(11,883

)

Net cash used in financing activities


(215,731

)


(214,131

)


Effect of exchange rate changes on cash and cash equivalents


(2,819

)


1,651


Net increase in cash, cash equivalents, and restricted cash


181,472


327,569


Cash, cash equivalents, and restricted cash at beginning of period


1,458,748


1,027,638


Cash, cash equivalents, and restricted cash at end of period


$

1,640,220


$

1,355,207


The following table includes supplemental financial information for the consumer auto and auto OEM operating segments that management believes is useful.

Garmin Ltd. and Subsidiaries


Net Sales, Gross Profit and Operating Income by Segment


(In thousands)


Auto


Fitness


Outdoor


Aviation


Marine


Total
Auto


Consumer
Auto


Auto
OEM


Total


13-Weeks Ended June 26, 2021


Net sales


$

413,201


$

323,405


$

180,832


$

261,790


$

147,677


$

86,278


$

61,399


$

1,326,905


Gross profit


225,192


208,158


131,934


152,609


62,958


42,261


20,697


780,851


Operating income (loss)


116,966


122,056


50,810


89,752


(8,412

)


15,684


(24,096

)


371,172


13-Weeks Ended June 27, 2020


Net sales


$

294,642


$

206,200


$

126,140


$

157,827


$

85,058


$

55,270


$

29,788


$

869,867


Gross profit


156,817


133,189


92,036


93,470


39,918


26,917


13,001


515,430


Operating income (loss)


71,981


67,414


15,566


43,553


(10,125

)


4,237


(14,362

)


188,389


26-Weeks Ended June 26, 2021


Net sales


$

721,326


$

579,859


$

354,721


$

471,163


$

272,163


$

148,673


$

123,490


$

2,399,232


Gross profit


398,737


379,833


258,116


273,989


111,732


74,225


37,507


1,422,407


Operating income (loss)


190,702


215,085


95,679


151,315


(31,950

)


24,084


(56,034

)


620,831


26-Weeks Ended June 27, 2020


Net sales


$

518,242


$

381,302


$

314,739


$

320,832


$

190,860


$

114,283


$

76,577


$

1,725,975


Gross profit


269,142


245,447


230,844


187,680


89,257


55,029


34,228


1,022,370


Operating income (loss)


102,992


114,581


74,887


83,712


(10,300

)


7,450


(17,750

)


365,872


Garmin Ltd. and Subsidiaries


Net Sales by Geography


(In thousands)


13-Weeks Ended


26-Weeks Ended


June 26,


June 27,


YoY


June 26,


June 27,


YoY


2021


2020


Change


2021


2020


Change


Net sales


$

1,326,905


$

869,867


53%


$

2,399,232


$

1,725,975


39%


Americas


646,393


423,091


53%


1,150,085


850,491


35%


EMEA


488,724


335,201


46%


888,232


635,069


40%


APAC


191,788


111,575


72%


360,915


240,415


50%


EMEA - Europe, Middle East and Africa; APAC - Asia Pacific and Australian Continent


Non-GAAP Financial Information

To supplement our financial results presented in accordance with GAAP, this release includes the following measures defined by the Securities and Exchange Commission as non-GAAP financial measures: pro forma effective tax rate, pro forma net income (earnings) per share and free cash flow. These non-GAAP measures are not based on any comprehensive set of accounting rules or principles and should not be considered a substitute for, or superior to, financial measures calculated in accordance with GAAP, and may be different from non-GAAP measures used by other companies, limiting the usefulness of the measures for comparison with other companies. Management believes providing investors with an operating view consistent with how it manages the Company provides enhanced transparency into the operating results of the Company, as described in more detail by category below.

The tables below provide reconciliations between the GAAP and non-GAAP measures.

Pro forma effective tax rate

The Company’s income tax expense is periodically impacted by discrete tax items that are not reflective of income tax expense incurred as a result of current period earnings. Therefore, management believes disclosure of the effective tax rate and income tax provision before the effect of certain discrete tax items are important measures to permit investors' consistent comparison between periods. In the first and second quarter 2021, there were no such discrete tax items identified.

(In thousands)

13-Weeks Ended


26-Weeks Ended


June 26,


June 27,


June 26,


June 27,


2021


2020


2021


2020


$


ETR(1)


$


ETR(1)


$


ETR(1)


$


ETR(1)


GAAP income tax provision

$

55,062

14.8

%

$

13,412

6.8

%

$

85,548

13.7

%

$

29,866

8.0

%

Pro forma discrete tax item:


Uncertain tax reserve release(2)


14,308


14,308


Pro forma income tax provision

$

55,062

14.8

%

$

27,720

14.0

%

$

85,548

13.7

%

$

44,174

11.8

%


(1) Effective tax rate is calculated by taking the income tax provision divided by income before taxes, as presented on the face of the Condensed Consolidated Statements of Income.


(2) In second quarter 2020, the Company recognized a $14.3 million income tax benefit due to the release of uncertain tax position reserves associated with the 2014 intercompany restructuring, which was a pro forma adjustment in 2014. The second quarter 2020 impact of the reserve release is not reflective of income tax expense incurred as a result of current period earnings and therefore affects period-to-period comparability.


Pro forma net income (earnings) per share

Management believes that net income (earnings) per share before the impact of foreign currency gains or losses and certain discrete income tax items, as discussed above, is an important measure in order to permit a consistent comparison of the Company’s performance between periods.

(In thousands, except per share information)


13-Weeks Ended


26-Weeks Ended


June 26,


June 27,


June 26,


June 27,


2021


2020


2021


2020


GAAP net income


$

316,997


$

184,180


$

537,025


$

345,360


Foreign currency losses(1)


7,326


4,493


15,607


19,916


Tax effect of foreign currency losses(2)


(1,084

)


(630

)


(2,145

)


(2,345

)

Pro forma discrete tax item(3)


(14,308

)


(14,308

)

Pro forma net income


$

323,239


$

173,735


$

550,487


$

348,623


GAAP net income per share:


Basic


$

1.65


$

0.96


$

2.80


$

1.81


Diluted


$

1.64


$

0.96


$

2.78


$

1.80


Pro forma net income per share:


Basic


$

1.68


$

0.91


$

2.87


$

1.83


Diluted


$

1.68


$

0.91


$

2.85


$

1.82


Weighted average common shares outstanding:


Basic


192,150


191,024


192,023


190,914


Diluted


192,871


191,597


192,840


191,640


(1) Foreign currency gains and losses for the Company are driven by movements of a number of currencies in relation to the U.S. Dollar and the related exchange rate impact on the significant cash, receivables, and payables held in a currency other than the functional currency at a given legal entity. However, there is minimal cash impact from such foreign currency gains and losses.


(2) The tax effect of foreign currency gains and losses was calculated using the effective tax rate of 14.8% and 13.7% for the 13-weeks and 26-weeks ended June 26, 2021, respectively, and a pro forma effective tax rate of 14.0% and 11.8% for the 13-weeks and 26-weeks ended June 27, 2020, respectively.


(3) The discrete tax item is discussed in the pro forma effective tax rate section above.


Contacts

Investor Relations Contact:
Teri Seck
913/397-8200
This email address is being protected from spambots. You need JavaScript enabled to view it.

Media Relations Contact:
Krista Klaus
913/397-8200
This email address is being protected from spambots. You need JavaScript enabled to view it.


Read full story here

BOULDER, Colo.--(BUSINESS WIRE)--Rubicon Technology Partners, a private equity firm specializing in enterprise software investments, announced that it has completed the sale of its majority stake in Uplight to a consortium of investors, co-led by Schneider Electric, AES, and a group of investors led by Huck Capital, including Coatue and Inclusive Capital Partners. Uplight is valued at $1.5 billion in the transaction. The deal was first announced in March 2021.

Uplight, a certified B Corp, is the leading software partner of energy providers transitioning to the clean energy ecosystem. Using data-driven insights to personalize and simplify the customer experience, Uplight solutions help utilities to reduce their baseload by changing consumer behavior, orchestrate grid connected devices that keep customers' bills low while adjusting in real time to changing grid conditions, and speed customer adoption of renewables, electric vehicles, and energy management solutions.

Following its investment in November 2018, Rubicon was instrumental in helping Uplight become the market leader by completing five strategic acquisitions, investing in cutting edge product development, and enhancing the company’s go-to-market capabilities, all contributing to a significant acceleration of the company’s growth as it became the leading software provider to North America’s largest electric and gas utilities.

“Rubicon has been a great partner, supporting our ambitious vision to build the leading software provider supporting the transition to the clean energy ecosystem," said Adrian Tuck, CEO at Uplight. “We greatly appreciate Rubicon's help over these past few years in guiding Uplight's success.”

Rubicon will remain a minority investor in Uplight.

“We have been fortunate to have the opportunity to build a market-leading business in partnership with Adrian and the Uplight team," said Alex Kleiner, Partner at Rubicon Technology Partners. "We are excited about Uplight's continued growth and success.”

Goldman, Sachs & Co. LLC served as Exclusive Advisor to Uplight.

About Rubicon Technology Partners

Rubicon Technology Partners invests in enterprise software companies with proven products and talented management teams to help grow and scale their businesses. Rubicon enables companies to adapt to the changing requirements of their businesses as they grow and scale using a proven set of proprietary processes, best practices and a portfolio-wide engagement model. Rubicon has over $2 billion in assets under management and is headquartered in Boulder, Colorado with additional offices in New Haven, Connecticut and Palo Alto, California. For more information, please visit www.rubicontp.com.

About Uplight

Uplight is the technology partner for energy providers and the clean energy ecosystem. Uplight’s software solutions connect energy customers to the decarbonization goals of power providers while helping customers save energy and lower costs, creating a more sustainable future for all. Using the industry’s only comprehensive customer-centric technology suite and critical energy expertise across disciplines, Uplight is streamlining the complex transition to the clean energy ecosystem for more than 80 electric and gas utilities around the world. By empowering energy providers to achieve critical outcomes through data-driven customer experiences, delivering control at the grid edge, creating new revenue streams and optimizing existing load and assets, Uplight shares a mission with its clients to make energy more sustainable for every community. Uplight is a certified B Corporation. To learn more, visit us at www.uplight.com, find us on Twitter @Uplight or on LinkedIn at Linkedin.com/company/uplightenergy.


Contacts

Caleigh Bourgeois
This email address is being protected from spambots. You need JavaScript enabled to view it.

  • Significant new oil discovery located southeast of Uaru and west of Yellowtail
  • Could form the basis for a future oil development in the Stabroek Block
  • Adds to previous recoverable resource estimate of approximately 9 billion barrels of oil equivalent

NEW YORK--(BUSINESS WIRE)--Hess Corporation (NYSE: HES) today announced a significant oil discovery on the Stabroek Block offshore Guyana at Whiptail. The Whiptail-1 well encountered 246 feet (75 meters) of net pay in high quality oil bearing sandstone reservoirs. Drilling is also ongoing at the Whiptail-2 well, which is located 3 miles northeast of Whiptail-1 and has encountered 167 feet (51 meters) of net pay in high quality oil bearing sandstone reservoirs. Drilling continues at both wells to test deeper targets, and results will be evaluated for future development.


The Whiptail discovery is located approximately 4 miles southeast of the Uaru-1 discovery that was announced in January 2020 and approximately 3 miles west of the Yellowtail field. Whiptail-1 is being drilled in 5,889 feet (1,795 meters) of water by the Stena DrillMAX. Whiptail-2 is currently being drilled in 6,217 feet (1,895 meters) of water by the Noble Don Taylor.

CEO John Hess said: “Whiptail is a significant new oil discovery that will add to the discovered recoverable resource estimate of approximately 9 billion barrels of oil equivalent and could underpin a future oil development in the southeast area of the Stabroek Block.”

The Liza Destiny FPSO is currently producing about 120,000 gross barrels of oil per day. Startup of Liza Phase 2 remains on target for early 2022 utilizing the Liza Unity FPSO with production capacity of approximately 220,000 gross barrels of oil per day. The Unity is expected to sail from Singapore to Guyana in late August.

A third development at the Payara Field was sanctioned in September 2020 that will utilize the Prosperity FPSO with production capacity of 220,000 gross barrels of oil per day; first oil is expected in 2024. The first Payara development well was spudded in June 2021, and the offshore SURF installation will begin in the third quarter. The hull for the Prosperity FPSO is complete, and topsides construction activities are underway in Singapore.

A fourth development, Yellowtail, is planned with anticipated startup in 2025, pending government approvals and project sanctioning. This project will develop the Yellowtail and Redtail fields, which are located approximately 19 miles (30 kilometers) southeast of the Liza developments, and potentially adjacent resources.

The Stabroek Block is 6.6 million acres. ExxonMobil affiliate Esso Exploration and Production Guyana Limited is operator and holds 45 percent interest in the Stabroek Block. Hess Guyana Exploration Ltd. holds 30 percent interest and CNOOC Petroleum Guyana Limited, a wholly-owned subsidiary of CNOOC Limited, holds 25 percent interest.

Hess Corporation is a leading global independent energy company engaged in the exploration and production of crude oil and natural gas. More information on Hess Corporation is available at http://www.hess.com.

Cautionary Statements

This news release contains “forward-looking statements” within the meaning of Section 27A of the Securities Act of 1933, as amended, and Section 21E of the Securities Exchange Act of 1934, as amended. Words such as “anticipate,” “estimate,” “expect,” “forecast,” “guidance,” “could,” “may,” “should,” “would,” “believe,” “intend,” “project,” “plan,” “predict,” “will,” “target” and similar expressions identify forward-looking statements, which are not historical in nature. Our forward-looking statements may include, without limitation, the expected number, timing and completion of our development projects and estimates of capital and operating costs for these projects; estimates of our crude oil and natural gas resources and levels of production; and our future financial and operational results. Forward-looking statements are based on our current understanding, assessments, estimates and projections of relevant factors and reasonable assumptions about the future. Forward-looking statements are subject to certain known and unknown risks and uncertainties that could cause actual results to differ materially from our historical experience and our current projections or expectations of future results expressed or implied by these forward-looking statements. The following important factors could cause actual results to differ materially from those in our forward-looking statements: fluctuations in market prices or demand for crude oil, NGLs and natural gas, including due to the global COVID-19 pandemic or the outbreak of any other public health threat, or due to the impact of competing or alternative energy products and political conditions and events; potential failures or delays in increasing oil and gas reserves and in achieving expected production levels, including as a result of unsuccessful exploration activity, drilling risks and unforeseen reservoir conditions; inherent uncertainties in estimating quantities of proved reserves and resources; changes in laws, regulations and governmental actions applicable to our business, including legislative and regulatory initiatives regarding environmental concerns, such as measures to limit greenhouse gas emissions and flaring; the ability of our contractual counterparties to satisfy their obligations to us, including the operation of joint ventures which we may not control; unexpected changes in technical requirements for constructing, modifying or operating exploration and production facilities and/or the inability to timely obtain or maintain necessary permits; potential disruption or interruption of our operations due to catastrophic events, including the global COVID-19 pandemic; and other factors described in Item 1A—Risk Factors in our Annual Report on Form 10-K and any additional risks described in our other filings with the Securities and Exchange Commission. As and when made, we believe that our forward-looking statements are reasonable. However, given these risks and uncertainties, caution should be taken not to place undue reliance on any such forward-looking statements since such statements speak only as of the date when made and there can be no assurance that such forward-looking statements will occur and actual results may differ materially from those contained in any forward-looking statement we make. Except as required by law, we undertake no obligation to publicly update or revise any forward-looking statements, whether because of new information, future events or otherwise.

We use certain terms in this release relating to resources other than proved reserves, such as unproved reserves or resources. Investors are urged to consider closely the oil and gas disclosures in Hess Corporation’s Form 10-K, File No. 1-1204, available from Hess Corporation, 1185 Avenue of the Americas, New York, New York 10036 c/o Corporate Secretary and on our website at www.hess.com. You can also obtain this form from the SEC on the EDGAR system.


Contacts

Investor Contact:
Jay Wilson
(212) 536-8940
This email address is being protected from spambots. You need JavaScript enabled to view it.

Media Contact:
Lorrie Hecker
(212) 536-8250
This email address is being protected from spambots. You need JavaScript enabled to view it.

Second Quarter 2021 Highlights

  • Net loss of $1.9 million, or $(0.04) per diluted Class A share, for the quarter ended June 30, 2021; Adjusted pro forma net loss of $1.4 million, or $(0.03) per diluted share for the quarter ended June 30, 2021 (see below for a reconciliation of Adjusted pro forma net income to net income attributable to Solaris)
  • Adjusted EBITDA of $6.5 million for the quarter ended June 30, 2021
  • Net cash provided by operating activities of $1.3 million for the quarter ended June 30, 2021
  • Paid a regular quarterly dividend of $0.105 per share on June 25, 2021

HOUSTON--(BUSINESS WIRE)--Solaris Oilfield Infrastructure, Inc. (NYSE:SOI) (“Solaris” or the “Company”), a leading independent provider of supply chain management and logistics solutions designed to drive efficiencies and reduce costs for the oil and natural gas industry, today reported financial results for the second quarter 2021.

Operational Update and Outlook

During the second quarter of 2021, an average of 53 mobile proppant management systems were fully utilized, which was up slightly from average first quarter 2021 levels and up over 25% from average fourth quarter 2020 levels.

“The Solaris team continues to execute well and help our customers drive efficiencies through our core products and services,” Solaris’ Chairman and Chief Executive Officer Bill Zartler commented. “While we continue to prioritize investments in new innovations, including our new integrated electric blender, we remain committed to doing so only when we can deliver compelling shareholder returns. We believe our debt-free balance sheet, strong liquidity and dividend allow us to sustain those commitments, and we look forward to sharing progress on additional opportunities through the remainder of 2021.”

Second Quarter 2021 Financial Review

Solaris reported net loss of $1.9 million, or $(0.04) per diluted Class A share, for second quarter 2021, compared to second quarter 2020 net loss of $9.5 million, or $(0.20) per diluted Class A share. Adjusted pro forma net loss for second quarter 2021 was $1.4 million, or $(0.03) per fully diluted share, compared to second quarter 2020 adjusted pro forma net loss of $7.0 million, or $(0.16) per fully diluted share. A description of adjusted pro forma net income and a reconciliation to net income attributable to Solaris, its most directly comparable generally accepted accounting principles (“GAAP”) measure, and the computation of adjusted pro forma earnings per fully diluted share are provided below.

Revenues were $35.2 million for second quarter 2021, which were up 23% from first quarter 2021.

Adjusted EBITDA for second quarter 2021 was $6.5 million, compared to first quarter 2021 Adjusted EBITDA of $6.1 million. A description of Adjusted EBITDA and a reconciliation to net income, its most directly comparable GAAP measure, is provided below.

Capital Expenditures, Free Cash Flow and Liquidity

Capital expenditures in the second quarter 2021 were $5.1 million compared to capital expenditures of $2.6 million during first quarter 2021. Previous capital expenditure guidance for the full year 2021 of $10.0 to $15.0 million included approximately $5.0 million for investments in new technology, which are now expected to be between $5.0 and $10.0 million. As a result, the Company now expects capital expenditures for the full year 2021 to be between $15.0 and $20.0 million.

Free cash flow (defined as net cash provided by operating activities less investment in property, plant and equipment) during second quarter 2021 was $(3.8) million.

As of June 30, 2021, the Company had approximately $46.3 million of cash on the balance sheet, which reflects about $1.00 per fully diluted share of available cash. The Company’s credit facility remains undrawn, and total liquidity, including availability under the credit facility, was $96.3 million as of the end of the second quarter 2021.

Shareholder Returns

On June 5, 2021, the Company’s Board of Directors declared a cash dividend of $0.105 per share of Class A common stock, which was paid on June 25, 2021 to holders of record as of June 15, 2021. A distribution of $0.105 per unit was also approved for holders of units in Solaris Oilfield Infrastructure, LLC (“Solaris LLC”). Since initiating the dividend in December 2018, the Company has paid 11 consecutive quarterly dividends. Cumulatively, the Company has returned approximately $83 million in cash to shareholders through dividends and share repurchases since December 2018.

Conference Call

The Company will host a conference call to discuss its second quarter 2021 results on Thursday, July 29, 2021 at 7:30 a.m. Central Time (8:30 a.m. Eastern Time). To join the conference call from within the United States, participants may dial (844) 413-3978. To join the conference call from outside of the United States, participants may dial (412) 317-6594. When instructed, please ask the operator to be joined to the Solaris Oilfield Infrastructure, Inc. call. Participants are encouraged to log in to the webcast or dial in to the conference call approximately ten minutes prior to the start time. To listen via live webcast, please visit the Investor Relations section of the Company’s website at http://www.solarisoilfield.com.

An audio replay of the conference call will be available shortly after the conclusion of the call and will remain available for approximately seven days. It can be accessed by dialing (877) 344-7529 within the United States or (412) 317-0088 outside of the United States. The conference call replay access code is 10157781. The replay will also be available in the Investor Relations section of the Company’s website shortly after the conclusion of the call and will remain available for approximately seven days.

About Solaris Oilfield Infrastructure, Inc.

Solaris Oilfield Infrastructure, Inc. (NYSE:SOI) provides mobile equipment that drives supply chain and execution efficiencies in the completion of oil and natural gas wells. Solaris’ patented mobile proppant and chemical systems are deployed in many of the most active oil and natural gas basins in the United States. Additional information is available on the Solaris website, www.solarisoilfield.com.

Website Disclosure

We use our website (www.solarisoilfield.com) as a routine channel of distribution of company information, including news releases, analyst presentations, and supplemental financial information, as a means of disclosing material non-public information and for complying with our disclosure obligations under the U.S. Securities and Exchange Commission’s (the “SEC”) Regulation FD. Accordingly, investors should monitor our website in addition to following press releases, SEC filings and public conference calls and webcasts. Additionally, we provide notifications of news or announcements on our investor relations website. Investors and others can receive notifications of new information posted on our investor relations website in real time by signing up for email alerts.

None of the information provided on our website, in our press releases, public conference calls and webcasts, or through social media channels is incorporated by reference into, or deemed to be a part of, this Current Report on Form 8-K or will be incorporated by reference into any other report or document we file with the SEC unless we expressly incorporate any such information by reference, and any references to our website are intended to be inactive textual references only.

Forward Looking Statements

This press release contains forward-looking statements within the meaning of Section 27A of the Securities Act of 1933, as amended and Section 21E of the Securities Exchange Act of 1934, as amended. Examples of forward-looking statements include, but are not limited to, our business strategy, our industry, our future profitability, the various risks and uncertainties associated with the extraordinary market environment and impacts resulting from the volatility in global oil markets and the COVID-19 pandemic, expected capital expenditures and the impact of such expenditures on performance, management changes, current and potential future long-term contracts and our future business and financial performance. Forward-looking statements are based on our current expectations and assumptions regarding our business, the economy and other future conditions. Because forward-looking statements relate to the future, by their nature, they are subject to inherent uncertainties, risks and changes in circumstances that are difficult to predict. As a result, our actual results may differ materially from those contemplated by the forward-looking statements. Factors that could cause our actual results to differ materially from the results contemplated by such forward-looking statements include, but are not limited to the factors discussed or referenced in our filings made from time to time with the SEC. Readers are cautioned not to place undue reliance on forward-looking statements, which speak only as of the date hereof. Factors or events that could cause our actual results to differ may emerge from time to time, and it is not possible for us to predict all of them. We undertake no obligation to publicly update or revise any forward-looking statement, whether as a result of new information, future developments or otherwise, except as may be required by law.

SOLARIS OILFIELD INFRASTRUCTURE, INC AND SUBSIDIARIES

CONSOLIDATED STATEMENTS OF OPERATIONS

(In thousands, except per share data)

(Unaudited)


Three Months Ended


Six Months Ended


June 30,


March 31,


June 30,


2021


2020


2021


2021


2020


Revenue


System rental


$

14,323


$

5,463


$

13,648


$

27,971


$

31,522


System services


20,616


3,419


14,710


35,326


24,376


Transloading services


38


264


114


152


729


Inventory software services


202


192


197


399


542


Total revenue


35,179


9,339


28,669


63,848


57,169


Operating costs and expenses


Cost of system rental (excluding depreciation and amortization)


1,556


823


1,608


3,164


2,836


Cost of system services (excluding depreciation and amortization)


23,282


6,013


17,252


40,534


30,143


Cost of transloading services (excluding depreciation and amortization)

197

202


244


441

540

Cost of inventory software services (excluding depreciation and amortization)


100

122

102


202

267

Depreciation and amortization


6,752


6,671


6,693


13,445


13,785


Selling, general and administrative (excluding depreciation and amortization)

4,964

3,967

4,606

9,570

8,373

Impairment loss


47,828


Other operating expenses (1)


360


2,274


253


613


3,472


Total operating costs and expenses


37,211


20,072


30,758


67,969


107,244


Operating income (loss)


(2,032

)


(10,733

)


(2,089

)


(4,121

)


(50,075

)

Interest income (expense), net


(55

)


(35

)


(49

)


(104

)


76


Total other income (expense)


(55

)


(35

)


(49

)


(104

)


76


Income (loss) before income tax expense


(2,087

)


(10,768

)


(2,138

)


(4,225

)


(49,999

)

Provision (benefit) for income taxes


(217

)


(1,272

)


(213

)


(430

)


(7,350

)

Net income (loss)


(1,870

)


(9,496

)


(1,925

)


(3,795

)


(42,649

)

Less: net (income) loss related to non-controlling interests


659


3,956


756


1,415


18,026


Net income (loss) attributable to Solaris


$

(1,211

)


$

(5,540

)


$

(1,169

)


$

(2,380

)


$

(24,623

)


Earnings per share of Class A common stock - basic


$

(0.04

)


$

(0.20

)


$

(0.04

)


$

(0.08

)


$

(0.85

)

Earnings per share of Class A common stock - diluted


$

(0.04

)


$

(0.20

)


$

(0.04

)


$

(0.08

)


$

(0.85

)


Basic weighted average shares of Class A common stock outstanding


30,984


28,638


29,957


30,473


28,975


Diluted weighted average shares of Class A common stock outstanding


30,984


28,638


29,957


30,473


28,975

1)

Other operating expenses are primarily related to credit losses, loss on sale of assets and costs associated with workforce reductions.

SOLARIS OILFIELD INFRASTRUCTURE, INC AND SUBSIDIARIES

CONSOLIDATED BALANCE SHEETS

(In thousands, except per share amounts)

(Unaudited)


June 30,


December 31,


2021


2020

Assets


Current assets:


Cash and cash equivalents


$

46,276


$

60,366

Accounts receivable, net of allowances for credit losses of $920 and $1,099, respectively


31,341


18,243

Prepaid expenses and other current assets


3,813


2,169

Inventories


1,939


954

Total current assets


83,369


81,732

Property, plant and equipment, net


241,048


245,884

Non-current inventories


2,882


3,318

Operating lease right-of-use assets


4,449


4,708

Goodwill


13,004


13,004

Intangible assets, net


2,593


2,982

Deferred tax assets


63,842


59,805

Other assets


381


463

Total assets


$

411,568


$

411,896

Liabilities and Stockholders' Equity


Current liabilities:


Accounts payable


$

14,145


$

6,863

Accrued liabilities


12,006


11,986

Current portion of payables related to Tax Receivable Agreement


606


606

Current portion of lease liabilities


693


647

Current portion of finance lease liabilities


30


30

Other current liabilities


813


75

Total current liabilities


28,293


20,207

Lease liabilities, net of current


6,981


7,419

Finance lease liabilities, net of current


85


100

Payables related to Tax Receivable Agreement


72,908


68,097

Other long-term liabilities


587


594

Total liabilities


108,854


96,417

Stockholders' equity:


Preferred stock, $0.01 par value, 50,000 shares authorized, none issued and outstanding


Class A common stock, $0.01 par value, 600,000 shares authorized, 30,984 shares issued and outstanding as of June 30, 2021 and 28,943 shares issued and outstanding as of December 31, 2020


310


290

Class B common stock, $0.00 par value, 180,000 shares authorized, 13,820 shares issued and outstanding as of June 30, 2021 and 15,685 issued and outstanding as of December 31, 2020


Additional paid-in capital


194,690


180,415

Retained earnings


11,137


20,549

Total stockholders' equity attributable to Solaris and members' equity


206,137


201,254

Non-controlling interest


96,577


114,225

Total stockholders' equity


302,714


315,479

Total liabilities and stockholders' equity


$

411,568


$

411,896

SOLARIS OILFIELD INFRASTRUCTURE, INC AND SUBSIDIARIES

CONSOLIDATED STATEMENTS OF CASH FLOWS

(In thousands)

(Unaudited)


Six Months Ended
June 30,


Three
Months
Ended June
30,


Three
Months
Ended
March 31,


2021


2020


2021


2021


Cash flows from operating activities:


Net (loss) income


$

(3,795

)


$

(42,649

)


$

(1,870

)


$

(1,925

)

Adjustment to reconcile net (loss) income to net cash provided by operating activities:


Depreciation and amortization


13,445


13,785


6,752


6,693


Impairment loss


47,828


Loss on disposal of asset


117


1,402


99


18


Stock-based compensation


2,552


2,656


1,353


1,199


Amortization of debt issuance costs


88


88


40


48


Allowance for credit losses


599


1,633


316


283


Deferred income tax expense


(607

)


(7,369

)


(305

)


(302

)

Other


(146

)


(145

)


(151

)


5


Changes in assets and liabilities:


Accounts receivable


(13,697

)


25,760


(10,237

)


(3,460

)

Prepaid expenses and other assets


(742

)


(217

)


(977

)


235


Inventories


(1,085

)


(533

)


(463

)


(622

)

Accounts payable


7,239


147


2,184


5,055


Accrued liabilities


72


(8,063

)


4,533


(4,461

)

Net cash provided by operating activities


4,040


34,323


1,275


2,766


Cash flows from investing activities:


Investment in property, plant and equipment


(7,716

)


(1,558

)


(5,070

)


(2,647

)

Proceeds from disposal of assets


40


713


40


Cash received from insurance proceeds


6


6


Net cash used in investing activities


(7,670

)


(845

)


(5,064

)


(2,607

)

Cash flows from financing activities:


Distribution and dividend paid to Solaris LLC unitholders and Class A common shareholders


(9,594

)


(9,507

)


(4,797

)


(4,797

)

Share repurchases


(26,717

)


Payments under finance leases


(12

)


(18

)


(5

)


(7

)

Payments under insurance premium financing


(164

)


(164

)


Proceeds from stock option exercises


12


64


12


Payments for shares withheld for taxes from RSU vesting and cancelled


(702

)


(96

)


(29

)


(673

)

Payments related to purchase of treasury stock


(454

)


Net cash used in financing activities


(10,460

)


(36,728

)


(4,995

)


(5,465

)

Net (decrease) increase in cash and cash equivalents


(14,090

)


(3,250

)


(8,784

)


(5,306

)

Cash and cash equivalents at beginning of period


60,366


66,882


55,060


60,366


Cash and cash equivalents at end of period


$

46,276


$

63,632


$

46,276


$

55,060


Non-cash activities


Investing:


Capitalized depreciation in property, plant and equipment


$

289


$

316


$

146


$

143


Capitalized stock based compensation


151


135


78


73


Property and equipment additions incurred but not paid at period-end


612


6


612


604


Property, plant and equipment additions transferred from inventory


536


356


536


392


Financing:


Insurance premium financing


738


738


Cash paid for:


Interest


66


66


33


33


Income taxes


325


813


325


SOLARIS OILFIELD INFRASTRUCTURE, INC AND SUBSIDIARIES

RECONCILIATION OF GAAP TO NON-GAAP FINANCIAL INFORMATION — ADJUSTED EBITDA

(In thousands)

(Unaudited)

We view EBITDA and Adjusted EBITDA as important indicators of performance. We define EBITDA as net income, plus (i) depreciation and amortization expense, (ii) interest expense and (iii) income tax expense, including franchise taxes. We define Adjusted EBITDA as EBITDA plus (i) stock-based compensation expense and (ii) certain non-cash items and extraordinary, unusual or non-recurring gains, losses or expenses.

We believe that our presentation of EBITDA and Adjusted EBITDA provides useful information to investors in assessing our financial condition and results of operations. Net income is the GAAP measure most directly comparable to EBITDA and Adjusted EBITDA. EBITDA and Adjusted EBITDA should not be considered alternatives to net income presented in accordance with GAAP. Because EBITDA and Adjusted EBITDA may be defined differently by other companies in our industry, our definitions of EBITDA and Adjusted EBITDA may not be comparable to similarly titled measures of other companies, thereby diminishing their utility. The following table presents a reconciliation of net income to EBITDA and Adjusted EBITDA for each of the periods indicated.


Three months ended


Six months ended


June 30,


March 31,


June 30,


2021


2020


2021


2021


2020


Net income (loss)


$

(1,870

)


$

(9,496

)


$

(1,925

)


$

(3,795

)


$

(42,649

)

Depreciation and amortization


6,752


6,671


6,693


13,445


13,785


Interest (income) expense, net


55


35


49


104


(76

)

Income taxes (1)


(217

)


(1,272

)


(213

)


(430

)


(7,350

)

EBITDA


$

4,720


$

(4,062

)


$

4,604


$

9,324


$

(36,290

)

Stock-based compensation expense (2)


1,353


1,326


1,199


2,552


2,656


Loss on disposal of assets


99


1,345


18


117


1,413


Impairment loss


47,828


Severance expense


211


542


Credit losses


316


740


283


599


1,451


Transaction costs (3)


10


14


24


Adjusted EBITDA


$

6,498


$

(440

)


$

6,118


$

12,616


$

17,600


______________________________

1)

Federal and state income taxes.


2)

Represents stock-based compensation expense related to restricted stock awards.


3)

Costs related to the evaluation of acquisitions.

SOLARIS OILFIELD INFRASTRUCTURE, INC AND SUBSIDIARIES

RECONCILIATION OF GAAP TO NON-GAAP FINANCIAL INFORMATION — ADJUSTED PRO FORMA NET INCOME AND ADJUSTED PRO FORMA EARNINGS PER FULLY DILUTED SHARE

(In thousands)

(Unaudited)

Adjusted pro forma net income represents net income attributable to Solaris assuming the full exchange of all outstanding membership interests in Solaris LLC not held by Solaris Oilfield Infrastructure, Inc. for shares of Class A common stock, adjusted for certain non-recurring items that the Company doesn't believe directly reflect its core operations and may not be indicative of ongoing business operations. Adjusted pro forma earnings per fully diluted share is calculated by dividing adjusted pro forma net income by the weighted-average shares of Class A common stock outstanding, assuming the full exchange of all outstanding units of Solaris LLC (“Solaris LLC Units”), after giving effect to the dilutive effect of outstanding equity-based awards.

When used in conjunction with GAAP financial measures, adjusted pro forma net income and adjusted pro forma earnings per fully diluted share are supplemental measures of operating performance that the Company believes are useful measures to evaluate performance period over period and relative to its competitors. By assuming the full exchange of all outstanding Solaris LLC Units, the Company believes these measures facilitate comparisons with other companies that have different organizational and tax structures, as well as comparisons period over period because it eliminates the effect of any changes in net income attributable to Solaris as a result of increases in its ownership of Solaris LLC, which are unrelated to the Company's operating performance, and excludes items that are non-recurring or may not be indicative of ongoing operating performance.

Adjusted pro forma net income and adjusted pro forma earnings per fully diluted share are not necessarily comparable to similarly titled measures used by other companies due to different methods of calculation. Presentation of adjusted pro forma net income and adjusted pro forma earnings per fully diluted share should not be considered alternatives to net income and earnings per share, as determined under GAAP. While these measures are useful in evaluating the Company's performance, it does not account for the earnings attributable to the non-controlling interest holders and therefore does not provide a complete understanding of the net income attributable to Solaris. Adjusted pro forma net income and adjusted pro forma earnings per fully diluted share should be evaluated in conjunction with GAAP financial results. A reconciliation of adjusted pro forma net income to net income attributable to Solaris, the most directly comparable GAAP measure, and the computation of adjusted pro forma earnings per fully diluted share are set forth below.


Three months ended


Six months ended


June 30,


March 31,


June 30,


2021


2020


2021


2021


2020


Numerator:


Net income (loss) attributable to Solaris


$

(1,211

)


$

(5,540

)


$

(1,169

)


$

(2,380

)


$

(24,623

)

Adjustments:


Reallocation of net income (loss) attributable to non-controlling interests from the assumed exchange of LLC Interests (1)


(659


)


(3,956


)


(756


)


(1,415

)


(18,026

)

Loss on disposal of assets


99


1,345


18


117


1,413


Credit losses


316


740


283


599


1,451


Impairment loss


47,828


Severance expense


211


542


Transaction costs (2)


10


14


24


Income tax (benefit) expense


47


182


11


58


(7,920

)

Adjusted pro forma net income (loss)


$

(1,398

)


$

(7,018

)


$

(1,599

)


$

(2,997

)


$

665


Denominator:


Weighted average shares of Class A common stock outstanding - diluted


30,984


28,638


29,957


30,473


28,975


Adjustments:


Assumed exchange of Solaris LLC Units for shares of Class A common stock (1)


14,701


16,616


15,494


15,095


16,615


Adjusted pro forma fully weighted average shares of Class A common stock outstanding - diluted


45,685


45,254


45,451


45,568


45,590


Adjusted pro forma earnings per share - diluted


$

(0.03

)


$

(0.16

)


$

(0.04

)


$

(0.07

)


$

0.01


Contacts

Yvonne Fletcher
Senior Vice President, Finance and Investor Relations
(281) 501-3070
This email address is being protected from spambots. You need JavaScript enabled to view it.


Read full story here

  • Increased quarterly distribution to $0.5042 per Class A share for the quarter ended June 30, 2021, an approximate 11% increase compared to the quarterly distribution per Class A share for the first quarter of 2021, reflecting a 10% increase in the per share distribution level in addition to the 5% annual distribution per share growth target
  • Reiterated annual distribution per share growth target of at least 5% through 2023 from this new higher per share distribution level
  • Announced agreement by Hess Midstream Operations LP to repurchase $750 million of Class B units from affiliates of Hess Corporation and Global Infrastructure Partners in a transaction that increases Class A Shareholder percentage ownership and delivers immediate distributable cash flow per share accretion
  • Continued financial flexibility for potential future accretive opportunities, including additional return of capital to shareholders

HOUSTON--(BUSINESS WIRE)--Hess Midstream LP (NYSE: HESM) (“Hess Midstream”), today announced that the Board of Directors of its general partner (the “Board”) approved an approximate 11% increase in its quarterly distribution per Class A share for the second quarter of 2021 as compared to the first quarter of 2021. This increase consists of a 10% immediate increase in Hess Midstream’s distribution level per Class A share in addition to its targeted 5% annualized increase in distributions per Class A share. The Board also approved a $750 million unit repurchase by Hess Midstream’s subsidiary, Hess Midstream Operations LP, from affiliates of Hess Corporation and Global Infrastructure Partners, Hess Midstream’s sponsors, at a price of $24.00 per unit.


With this announcement, we are demonstrating our financial flexibility to deliver immediate, accretive and meaningful return of capital to our shareholders,” said Jonathan Stein, Chief Financial Officer of Hess Midstream. “The unit repurchase optimizes our capital structure to our conservative 3.0x Debt/Adjusted EBITDA target by providing accretion to shareholders, while the distribution increase returns free cash flow to our shareholders on an ongoing basis while maintaining 1.4x coverage. Following the distribution increase and the unit repurchase, we expect to continue to have financial flexibility, including expected ongoing free cash flow after distributions and leverage declining below our 3.0x Debt/Adjusted EBITDA target as early as 2022, allowing for potential future accretive opportunities, including incremental return of capital to shareholders.”

The distribution increase represents an increase in distributions per Class A share by 10% relative to previously targeted distributions. The $750 million unit repurchase is consistent with Hess Midstream’s targeted 3.0x Debt / Adjusted EBITDA level on a full-year 2021 basis and is expected to be approximately 8% accretive on a distributable cash flow per Class A share basis. The unit repurchase is expected to result in distribution savings to Hess Midstream of approximately $30 million in the second half of 2021 on a consolidated basis.

Distribution Increase Summary

The Board declared a quarterly cash distribution of $0.5042 per Class A share for the quarter ended June 30, 2021. The distribution represents an approximate 11% increase compared to the distribution for the first quarter of 2021, consisting of a 10% announced increase in addition to a quarterly increase consistent with Hess Midstream’s targeted 5% growth in annual distributions per Class A share.

Hess Midstream continues to target annual distribution per Class A share growth of at least 5% through 2023 from this new higher level and expected annual distribution coverage of greater than 1.4x.

The quarterly distribution will be payable on August 13, 2021 to Class A shareholders of record as of the close of business on August 9, 2021.

Unit Repurchase Summary

Hess Midstream Operations LP, Hess Midstream’s consolidated subsidiary, agreed to repurchase approximately 31 million Class B units of Hess Midstream Operations LP, equal to approximately 11% of the consolidated company, held by affiliates of Hess Corporation and Global Infrastructure Partners for an aggregate purchase price of $750 million. The purchase price per Class B unit is $24.00, representing an approximate 4% discount to the 30-day volume weighted average trading price of Hess Midstream Class A shares through July 27, 2021. As a result of the unit repurchase transaction, public ownership of Hess Midstream on a consolidated basis will increase to approximately 9.5%. The terms of the proposed unit repurchase transaction was unanimously approved by the Board, based on the approval and recommendation of its conflicts committee composed solely of independent directors. The unit repurchase is anticipated to close in August 2021, following the record date for the quarterly distribution for the quarter ended June 30, 2021, such that Sponsors will receive the quarterly distribution on their currently outstanding Class B units. Hess Midstream expects to fund the unit repurchase through debt financing.

About Hess Midstream

Hess Midstream LP is a fee-based, growth-oriented midstream company that operates, develops and acquires a diverse set of midstream assets to provide services to Hess Corporation and third-party customers. Hess Midstream owns oil, gas and produced water handling assets that are primarily located in the Bakken and Three Forks Shale plays in the Williston Basin area of North Dakota. More information is available at www.hessmidstream.com.

Cautionary Note Regarding Forward-looking Information

This press release contains “forward-looking statements” within the meaning of U.S. federal securities laws. Words such as “anticipate,” “estimate,” “expect,” “forecast,” “guidance,” “could,” “may,” “should,” “would,” “believe,” “intend,” “project,” “plan,” “predict,” “will,” “target” and similar expressions identify forward-looking statements, which are not historical in nature. Our forward-looking statements may include, without limitation: our future financial and operational results, including our ability to increase our distributions or achieve our targeted distribution growth rate or reduce leverage below our debt/Adjusted EBITDA target; our business strategy and profitability; the expected timing and completion of the Class B unit repurchase from Hess and GIP; and our ability to execute future accretive opportunities, including incremental return of capital to shareholders.

Forward-looking statements are based on our current understanding, assessments, estimates and projections of relevant factors and reasonable assumptions about the future. Forward-looking statements are subject to certain known and unknown risks and uncertainties that could cause actual results to differ materially from our historical experience and our current projections or expectations of future results expressed or implied by these forward-looking statements. The following important factors could cause actual results to differ materially from those in our forward-looking statements: the direct and indirect effects of the COVID-19 global pandemic and other public health developments on our business and those of our business partners, suppliers and customers, including Hess; the ability of Hess and other parties to satisfy their obligations to us, including Hess’ ability to meet its drilling and development plans on a timely basis or at all and the operation of joint ventures that we may not control; our ability to generate sufficient cash flow to pay current and expected levels of distributions; reductions in the volumes of crude oil, natural gas, natural gas liquids (“NGLs”) and produced water we gather, process, terminal or store; fluctuations in the prices and demand for crude oil, natural gas and NGLs, including as a result of the COVID-19 global pandemic; changes in global economic conditions and the effects of a global economic downturn on our business and the business of our suppliers, customers, business partners and lenders; our ability to comply with government regulations or make capital expenditures required to maintain compliance, including our ability to obtain or maintain permits necessary for capital projects in a timely manner, if at all, or the revocation or modification of existing permits; our ability to successfully identify, evaluate and timely execute our capital projects, investment opportunities and growth strategies, whether through organic growth or acquisitions; our ability to satisfy the closing conditions of the Class B unit repurchase, including obtaining necessary debt financing; costs or liabilities associated with federal, state and local laws, regulations and governmental actions applicable to our business, including legislation and regulatory initiatives relating to environmental protection and safety, such as spills, releases, pipeline integrity and measures to limit greenhouse gas emissions; our ability to comply with the terms of our credit facility, indebtedness and other financing arrangements, which, if accelerated, we may not be able to repay; reduced demand for our midstream services, including the impact of weather or the availability of the competing third-party midstream gathering, processing and transportation operations; potential disruption or interruption of our business due to catastrophic events, such as accidents, severe weather events, labor disputes, information technology failures, constraints or disruptions and cyber-attacks; any limitations on our ability to access debt or capital markets on terms that we deem acceptable, including as a result of weakness in the oil and gas industry or negative outcomes within commodity and financial markets; liability resulting from litigation; and other factors described in Item 1A—Risk Factors in our Annual Report on Form 10-K and any additional risks described in our other filings with the Securities and Exchange Commission.

As and when made, we believe that our forward-looking statements are reasonable. However, given these risks and uncertainties, caution should be taken not to place undue reliance on any such forward-looking statements since such statements speak only as of the date when made and there can be no assurance that such forward-looking statements will occur and actual results may differ materially from those contained in any forward-looking statement we make. Except as required by law, we undertake no obligation to publicly update or revise any forward-looking statements, whether because of new information, future events or otherwise.

Non-GAAP Measures

In addition to our financial information presented in accordance with U.S. generally accepted accounting principles (“GAAP”), management utilizes certain additional non GAAP measures to facilitate comparisons of past performance and future periods. “Adjusted EBITDA” presented in this release is defined as reported net income (loss) before net interest expense, income tax expense, depreciation and amortization and our proportional share of depreciation of our equity affiliates, as further adjusted to eliminate the impact of certain items that we do not consider indicative of our ongoing operating performance, such as transaction costs, other income and other non-cash, non-recurring items, if applicable. “Distributable cash flow” or “DCF” is defined as Adjusted EBITDA less net interest, excluding amortization of deferred financing costs, cash paid for federal and state income taxes and maintenance capital expenditures. DCF does not reflect changes in working capital balances. We believe that investors’ understanding of our performance is enhanced by disclosing these measures as they may assist in assessing our operating performance as compared to other publicly traded companies in the midstream energy industry, without regard to historical cost basis or, in the case of Adjusted EBITDA, financing methods, and assessing the ability of our assets to generate sufficient cash flow to make distributions to our shareholders. These measures are not, and should not be viewed as, a substitute for GAAP net income or cash flow from operating activities and should not be considered in isolation.


Contacts

Investor Contact:
Jennifer Gordon
(212) 536-8244

Media Contact:
Robert Young
(346) 319 8783

  • Shareholder conference call with Ian Robertson, Co-Chair of the Board of Directors, Paulo Misk, President and CEO, Ernest Cleave, CFO, and Paul Vollant, VP of Commercial, will be conducted at 10:00 a.m. ET on Wednesday, August 11, 2021

TORONTO--(BUSINESS WIRE)--$LGO #VRFB--Largo Resources Ltd. ("Largo" or the "Company") (TSX: LGO) (NASDAQ: LGO) will release its second quarter 2021 financial results on Tuesday, August 10, 2021 after the close of market trading. Additionally, the Company will host a conference call to discuss second quarter 2021 operating and financial results on Wednesday, August 11 at 10:00 a.m. ET.


Details of the conference call are listed below:

Date:

Wednesday, August 11, 2021

Time:

10:00 a.m. ET

Dial-in Number:

Local / International: +1 (416) 764-8688

North American Toll Free: (888) 390-0546

Brazil Toll Free: 08007621359

Conference ID:

24539693

Replay Number:

Local / International: + 1 (416) 764-8677

North American Toll Free: (888) 390-0541

Replay Passcode: 539693 #

Website:

To view press releases or any additional financial information, please visit the Investor Relations section of the Largo Resources website at: www.largoresources.com/English/investor-resources

About Largo Resources

Largo Resources is an industry preferred, vertically integrated vanadium company. It services multiple vanadium market applications through the supply of its unrivaled VPURE™ and VPURE+™ products, from one of the world’s highest-grade vanadium deposits at the Company’s Maracás Menchen Mine located in Brazil. Largo is also focused on the advancement of renewable energy storage solutions through its vertically integrated VCHARGE± vanadium redox flow battery technology. The Company's common shares are listed on the Toronto Stock Exchange and on the Nasdaq Stock Market under the symbol "LGO".

For more information on Largo and VPURE™, please visit www.largoresources.com and www.largoVPURE.com.

For additional information on Largo Clean Energy, please visit www.largocleanenergy.com.


Contacts

Investor Relations:
Alex Guthrie
Senior Manager, External Relations
This email address is being protected from spambots. You need JavaScript enabled to view it.
Tel: +1 416-861-9797

  • Allego has entered into a definitive agreement with Spartan Acquisition Corp. III (NYSE: SPAQ); upon closing, the combined company will trade on the NYSE under the symbol “ALLG".
  • The transaction will raise a total of $7021 million (assuming no redemptions), including $150 million from a fully committed PIPE, which will be used, among other things, to fund the combined company’s expansion plans.
  • The PIPE is anchored by institutional investors, including Hedosophia and funds and accounts managed by ECP as well as strategic partners, including Fisker and Landis+Gyr. Funds managed by affiliates of Apollo Global Management, Inc., as sponsor behind Spartan Acquisition Corp. III, and Meridiam, as long-term owner of Allego, also participated in the PIPE.
  • Allego has over 26,000 public EV charging ports across 12,000 public and private locations in 12 European countries, with leading utilization rates and a substantial recurring user base, as well as a secured backlog of 500 premium sites providing near-term visibility on network development.
  • The pro forma implied equity value of the combined company is $3.14 billion. The transaction is expected to close in the fourth quarter of 2021, subject to customary closing conditions.

PARIS & ARNHEM, the Netherlands & NEW YORK--(BUSINESS WIRE)--Allego Holding B.V. (“Allego” or “the “Company”), a leading pan-European electric vehicle charging network, today announced a business combination with Spartan Acquisition Corp. III (“Spartan”) (NYSE: SPAQ), a publicly-listed special purpose acquisition company. The transaction will create a leading publicly traded pan-European electric vehicle (EV) charging company.


Upon completion of the proposed transaction, the combined company will operate under the Allego name, and will be listed on the New York Stock Exchange under the ticker symbol “ALLG”. The transaction values Allego at a pro forma equity value of approximately $3.14 billion. Expected total gross proceeds of $702 million will fund the Company’s future growth through the deployment of additional public EV charging sites, as it focuses on delivering fast and ultra-fast chargers and continues to build its technology moat.

Overview of Allego

Founded in 2013, Allego is a leading electric vehicle, or EV, charging company in Europe and has deployed over 26,000 charging ports across 12,000 public and private locations, spanning 12 European countries. In 2018, the Company was acquired by Meridiam, a global long-term sustainable infrastructure developer and investor, which provided necessary capital to enable the expansion of Allego’s existing global network, services and technologies. The Company’s charging network includes fast, ultra-fast, and AC charging equipment. The Company takes a two-pronged approach to delivering charging solutions, providing an owned and operated public charging network with 100% renewable energy in addition to charging solutions for business to business customers, including leading retail and auto brands. The Company’s charging solutions business provides design, installation, operations and maintenance of chargers owned by third parties. Allego’s chargers are open to all EV brands, with the ability to charge light vehicles, vans and e-trucks, which promotes increasing utilization rates across its locations. Allego has developed a rich portfolio of partnerships with strategic partners, including municipalities, more than 50 real estate owners and 15 OEMs. As additional fleets shift to EVs, Allego expects to leverage its expansive network of fast and ultra-fast chargers to service these customers, which see above average use-rates.

Allego’s proprietary suite of software, developed to help identify and assess locations and provide uptime optimization with payment solutions, underpins the Company’s competitive advantage. Allamo™ allows the Company to select premium charging sites to add to its network by analyzing traffic statistics and proprietary databases to forecast EV charging demand using over 100 factors, including local EV density, driving behavior and EV technology development. This allows a predictable, cutting-edge tool to optimize those locations that are best positioned for higher utilization rates.

Allego EV Cloud™ is a sophisticated customer payment tool that provides essential services to owned and third-party customers, including authorization and billing, smart charging and load balancing, analysis and customer support. This service offering is integral to fleet operators’ operations and enables the Company to provide insight and value to the customer, in addition to driving increased margins through third-party service contracts and operational and maintenance margins.

Allego continues to benefit from a European EV market that is nearly twice the size of the United States’ EV market, with an expected 46% CAGR from 2020 to 2025. Based on this projection, the number of EVs in Europe is expected to grow to nearly 20 million by 2025, as compared to 3 million today. The combination of a high urbanization rate and a scarcity of in-home parking means European EV drivers require fast, public EV charging locations that provide reliable and convenient charging. As part of the Company’s expansion plans, Allego will focus on fast and ultra-fast charging locations, which maximize utilization rates, carry higher gross margins and are required for fleet operators and EV drivers.

Additionally, stringent European CO2 regulations for internal combustion engines (ICE) and highly favorable incentives for electric vehicle purchases are expected to continue to drive adoption rates of EV over ICE vehicles. With a first mover advantage, a robust pipeline of over 500 committed premium sites to be equipped with fast and ultra-fast chargers, and an additional pipeline of another 500 sites, the Company is well positioned to execute its growth objectives and drive value creation for shareholders.

Through a diverse set of partnerships with leading OEMs, fleets, corporations, municipalities, and hosts, the Company has delivered significant revenue growth in recent years, including a 100% revenue CAGR from 2017-2020, and achieved positive operational EBITDA2 at the end of 2020.

Management Commentary

Mathieu Bonnet, Chief Executive Officer of Allego, commented, “We are excited to announce our strategic partnership with Spartan, which will provide capital to accelerate our leadership position within the European charging market, all while maintaining a strong financial position throughout the growth phase. Europe has one of the largest populations of EVs in the world, which is continuing to grow at a greater pace than many other major growth markets, including the United States. Supported by these tailwinds and bolstered by the capital we are raising, we are well positioned to expand our footprint as EVs increasingly replace traditional internal combustion engines.”

Olivia Wassenaar, Director of Spartan and Senior Partner and Co-Lead of Natural Resources at Apollo Global Management, Inc. (“Apollo”) added, “At Spartan and Apollo, we are committed to advancing ESG-focused business models. We are excited to work with Allego as they execute against their compelling pipeline of growth opportunities and help eliminate emissions from the environment.”

Geoffrey Strong, Chairman and Chief Executive Officer of Spartan and Senior Partner and Co-Lead of Infrastructure and Natural Resources at Apollo added, “We are excited to work together with Mathieu, Meridiam and the entire Allego team. We believe Europe is an extremely attractive market for EV charging and Allego is well-positioned to capitalize on its innovative technology, a strong leadership position in Europe, and supportive macro trends buoying the EV charging market.”

Transaction Summary

The business combination values Allego at an implied $3.14 billion pro forma equity value. The combined company is expected to receive approximately $702 million of gross proceeds from a combination of a fully committed common stock PIPE offering of $150 million at $10.00 per share, along with approximately $552 million of cash held in trust, assuming no redemptions. The proceeds from the business combination will be used to fund EV station capex and for general corporate purposes.

Fisker, designer of advanced sustainable electric vehicles and mobility solutions, will make a $10 million private investment in the PIPE. Fisker is the exclusive electric vehicle automaker in the PIPE and, in parallel, has agreed to terms on a strategic partnership to deliver a range of charging options for its customers in Europe.

The PIPE is anchored by additional strategic partners, including Landis+Gyr, as well as institutional investors, including funds and accounts managed by Hedosophia and ECP. Investment funds managed by affiliates of Apollo Global Management, Inc., which own the sponsor behind Spartan, and by Meridiam, as long-term owner of Allego, also participated in the PIPE.

The boards of directors of both Allego and Spartan have unanimously approved the proposed business combination, which is expected to be completed in the fourth quarter of 2021 subject to, among other things, the approval by Spartan stockholders and the satisfaction or waiver of other customary closing conditions.

Meridiam, the existing shareholder of Allego, will roll 100% of its equity and, together with management and former advisors, will retain 75% of the combined entity. Meridiam will continue to be a long-term strategic partner to the combined company. Additionally, the European Investment Bank will maintain its role as capital provider to Allego.

Additional information about the proposed transaction, including a copy of the business combination agreement and investor presentation, will be provided in a Current Report on Form 8-K to be filed by Spartan today with the Securities and Exchange Commission and will be available at www.sec.gov.

Advisors

Credit Suisse is serving as sole financial advisor and capital markets advisor to Allego. Weil, Gotshal & Manges LLP and NautaDutilh are serving as legal advisors to Allego. Barclays is serving as sole financial advisor and capital markets advisor to Spartan. Credit Suisse and Barclays are serving as co-lead placement agent on the PIPE offering. Citi and Apollo Global Securities are serving as co-placement agents. Vinson & Elkins L.L.P. is serving as legal advisor to Spartan. Latham & Watkins LLP is serving as legal advisor to the placement agents.

Webcast and Conference Call Information

Allego and Spartan will host a joint investor conference call to discuss the business and the proposed transaction today, July 28, 2021 at 8:30 AM ET.

To listen to the conference call via telephone dial (877) 407-9716 (U.S.) or (201) 493-6779 (international callers/U.S. toll) and enter the conference ID number 13722064. To listen to the webcast, please click here. A telephone replay will be available until Wednesday, August 11, 2021 at (844) 512-2921 and Conference ID number 13722064.

About Allego

Allego delivers charging solutions for electric cars, motors, buses and trucks, for consumers, businesses and cities. Allego’s end-to-end charging solutions make it easier for businesses and cities to deliver the infrastructure drivers need, while the scalability of our solutions makes us the partner of the future. Founded in 2013, Allego is a leader in charging solutions, with an international charging network comprised of more than 26,000 charge points operational throughout Europe – and growing rapidly. Our charging solutions are connected to our proprietary platform, EV-Cloud, which gives us and our customers a full portfolio of features and services to meet and exceed market demands. We are committed to providing independent, reliable and safe charging solutions, agnostic of vehicle model or network affiliation. At Allego, we strive every day to make EV charging easier, more convenient and more enjoyable for all.

About Spartan Acquisition Corp. III

Spartan Acquisition Corp. III is a special purpose acquisition entity focused on the energy value-chain and was formed for the purpose of entering into a merger, amalgamation, capital stock exchange, asset acquisition, stock purchase, reorganization or similar business combination with one or more businesses. Spartan is sponsored by Spartan Acquisition Sponsor III LLC, which is owned by a private investment fund managed by an affiliate of Apollo Global Management, Inc. (NYSE: APO). For more information, please visit www.spartanspaciii.com.

Forward-Looking Statements.

This communication includes “forward-looking statements” within the meaning of the “safe harbor” provisions of the United States Private Securities Litigation Reform Act of 1995. These forward-looking statements are provided for illustrative purposes only and are not intended to serve as, and must not be relied on by any investor as, a guarantee, an assurance, a prediction or a definitive statement of fact or probability. Spartan Acquisition Corp. III’s (“Spartan”) and Allego Holding B.V.’s, a Dutch private limited liability company (“Allego”), actual results may differ from their expectations, estimates, and projections and, consequently, you should not rely on these forward-looking statements as predictions of future events. Words such as “expect,” “estimate,” “project,” “budget,” “forecast,” “anticipate,” “intend,” “plan,” “may,” “will,” “could,” “should,” “believes,” “predicts,” “potential,” “continue,” and similar expressions (or the negative versions of such words or expressions) are intended to identify such forward-looking statements. These forward-looking statements include, without limitation, Spartan’s and Allego’s expectations with respect to future performance and anticipated financial impacts of the proposed business combination, the satisfaction or waiver of the closing conditions to the proposed business combination, and the timing of the completion of the proposed business combination.

These forward-looking statements involve significant risks and uncertainties that could cause the actual results to differ materially, and potentially adversely, from those expressed or implied in the forward-looking statements. Most of these factors are outside Spartan’s and Allego’s control and are difficult to predict. Factors that may cause such differences include, but are not limited to: (i) the occurrence of any event, change, or other circumstances that could give rise to the termination of the Business Combination Agreement and Plan of Reorganization (the “BCA”); (ii) the outcome of any legal proceedings that may be instituted against Athena Pubco B.V., a Dutch limited liability company (the “Company”) and/or Allego following the announcement of the BCA and the transactions contemplated therein; (iii) the inability to complete the proposed business combination, including due to failure to obtain approval of the stockholders of Spartan, certain regulatory approvals, or the satisfaction of other conditions to closing in the BCA; (iv) the occurrence of any event, change, or other circumstance that could give rise to the termination of the BCA or could otherwise cause the transaction to fail to close; (v) the impact of the COVID-19 pandemic on Allego’s business and/or the ability of the parties to complete the proposed business combination; (vi) the inability to obtain or maintain the listing of the Company’s common shares on the New York Stock Exchange following the proposed business combination; (vii) the risk that the proposed business combination disrupts current plans and operations as a result of the announcement and consummation of the proposed business combination; (viii) the ability to recognize the anticipated benefits of the proposed business combination, which may be affected by, among other things, competition, the ability of Allego to grow and manage growth profitably, and to retain its key employees; (ix) costs related to the proposed business combination; (x) changes in applicable laws or regulations; and (xi) the possibility that Allego, Spartan or the Company may be adversely affected by other economic, business, and/or competitive factors. The foregoing list of factors is not exclusive. Additional information concerning certain of these and other risk factors is contained in Spartan’s most recent filings with the SEC and will be contained in the registration statement on Form F-4 (the “Form F-4”), including the proxy statement/prospectus forming a part thereof expected to be filed in connection with the proposed business combination. All subsequent written and oral forward-looking statements concerning Spartan, Allego or the Company, the transactions described herein or other matters and attributable to Spartan, Allego, the Company or any person acting on their behalf are expressly qualified in their entirety by the cautionary statements above. Readers are cautioned not to place undue reliance upon any forward-looking statements, which speak only as of the date made. Each of Spartan, Allego and the Company expressly disclaims any obligations or undertaking to release publicly any updates or revisions to any forward-looking statements contained herein to reflect any change in their expectations with respect thereto or any change in events, conditions, or circumstances on which any statement is based, except as required by law.

No Offer or Solicitation.

This communication is not a proxy statement or solicitation of a proxy, consent, or authorization with respect to any securities or in respect of the proposed business combination and shall not constitute an offer to sell or a solicitation of an offer to buy the securities of Spartan, the Company or Allego, nor shall there be any sale of any such securities in any state or jurisdiction in which such offer, solicitation, or sale would be unlawful prior to registration or qualification under the securities laws of such state or jurisdiction. No offer of securities shall be made except by means of a prospectus meeting the requirements of Section 10 of the Securities Act of 1933, as amended, or exemptions therefrom.

Important Information About the Proposed Business Combination and Where to Find It.

In connection with the proposed business combination, a registration statement on Form F-4 is expected to be filed by the Company with the SEC. The Form F-4 will include preliminary and definitive proxy statements to be distributed to holders of Spartan’s common stock in connection with Spartan’s solicitation for proxies for the vote by Spartan’s stockholders in connection with the proposed business combination and other matters as described in the Form F-4, as well as a prospectus of the Company relating to the offer of the securities to be issued in connection with the completion of the business combination. Spartan, Allego and the Company urge investors, stockholders and other interested persons to read, when available, the Form F-4, including the proxy statement/prospectus incorporated by reference therein, as well as other documents filed with the SEC in connection with the proposed business combination, as these materials will contain important information about Allego, Spartan, and the proposed business combination. Such persons can also read Spartan’s final prospectus dated February 8, 2021 (SEC File No. 333-252866), for a description of the security holdings of Spartan’s officers and directors and their respective interests as security holders in the consummation of the proposed business combination. After the Form F-4 has been filed and declared effective, the definitive proxy statement/prospectus will be mailed to Spartan’s stockholders as of a record date to be established for voting on the proposed business combination. Stockholders will also be able to obtain copies of such documents, without charge, once available, at the SEC’s website at www.sec.gov, or by directing a request to: Spartan Acquisition Corp. III, 9 West 57th Street, 43rd Floor, New York, NY 10019, or (212) 515-3200. These documents, once available, can also be obtained, without charge, at the SEC’s web site (http://www.sec.gov).

INVESTMENT IN ANY SECURITIES DESCRIBED HEREIN HAS NOT BEEN APPROVED OR DISAPPROVED BY THE SEC OR ANY OTHER REGULATORY AUTHORITY NOR HAS ANY AUTHORITY PASSED UPON OR ENDORSED THE MERITS OF THE OFFERING OR THE ACCURACY OR ADEQUACY OF THE INFORMATION CONTAINED HEREIN. ANY REPRESENTATION TO THE CONTRARY IS A CRIMINAL OFFENSE.

Participants in the Solicitation.

Spartan, Allego, the Company and their respective directors, executive officers and other members of their management and employees, under SEC rules, may be deemed to be participants in the solicitation of proxies of Spartan’s stockholders in connection with the proposed business combination. Investors and security holders may obtain more detailed information regarding the names, affiliations and interests of Spartan’s directors and executive officers in Spartan’s final prospectus dated February 8, 2021 (SEC File No. 333-252866), which was filed with the SEC on February 10, 2021. Information regarding the persons who may, under SEC rules, be deemed participants in the solicitation of proxies of Spartan’s stockholders in connection with the proposed business combination will be set forth in the proxy statement/prospectus for the proposed business combination when available. Information concerning the interests of Spartan’s, the Company’s and Allego’s participants in the solicitation, which may, in some cases, be different than those of Spartan’s, the Company’s and Allego’s equity holders generally, will be set forth in the proxy statement/prospectus relating to the proposed business combination when it becomes available.

1 Gross proceeds; not inclusive of estimated transaction expenses

2 Operational EBITDA means EBITDA further adjusted for reorganization costs, certain business optimization costs, lease buyouts, anticipated board compensation costs and director and officer insurance costs and anticipated transaction costs.


Contacts

For Allego
Investors
This email address is being protected from spambots. You need JavaScript enabled to view it.
Media
This email address is being protected from spambots. You need JavaScript enabled to view it.

For Spartan Acquisition Corp. III
Investors
This email address is being protected from spambots. You need JavaScript enabled to view it.
Media
This email address is being protected from spambots. You need JavaScript enabled to view it.

PUNE, India--(BUSINESS WIRE)--#DeepakGarg--Sany, a leading manufacturer of the construction equipment and heavy machinery space, has become the world’s number one company in excavators’ sales by selling 98,705 excavators in the year 2020 globally. The brand registered a 15% market share in 2020 across the globe. Through their facility in Pune, India, the company operates in four Business verticals viz: Excavator, Heavy Equipment, Mining Machinery, and Renewable Energy.


On this remarkable feat, elated Deepak Garg, Managing Director of Sany India and South Asia said, “Indeed it's a proud moment for all of us. After all the hardships and struggle, the milestone that Sany has achieved on a global platform is absolutely commendable. We would like to thank our customers for reposing immense faith in our brand and making Sany the No. 1 Excavator brand globally. This accomplishment is the clear validation of a strong bond with our customers that Sany has made over the years.”

“On this momentous occasion, I want to congratulate all our employees for making this possible in the midst of uncertainty. The achievement illustrates Sany’s unwavering vision and commitment towards its goals. It also further encourages us to continue adding new technologies into our upcoming product range and deliver the best construction equipment and heavy machinery solutions to the customers,” exulted Garg.

Sany's South Asia head office, India, has more than 18,000 machines delivered on the ground, contributing to infrastructure development projects in India & other South Asian countries. Owing to its widest product range, superior build quality, service commitment, innovative solutions, and global expertise, Sany India has achieved market leadership in various construction equipment segments.

Notably, in India the company commands a leadership position in the Cranes and Piling Rigs segments. Also in the Excavator segment, the company is making steady progress and has come a long way from manufacturing just 3 models of excavators in 2014 to 26 models of excavators in India today. From 2 ton to 80 ton operating weight – Sany India offers a wide range of advanced excavators, which are manufactured at the state-of-the-art manufacturing plant at Chakan in Pune, supporting the government’s ‘Make In India’ initiative. Sany India has been a strong advocate of “Vocal for Local” since its inception. And since day one localization has been a prime focus of the company. The company has its offices also in Egypt, Maldives, Sri Lanka, Nepal, Bhutan and Bangladesh.

For more details follow:

http://bit.ly/SanyIndia_FB

http://bit.ly/SanyIndia_Twitter

http://bit.ly/SanyIndia_Instagram

http://bit.ly/SanyIndia_YouTube


Contacts

Media contact : Richa Sharma
Conversations
+91 70170 22799

  • Fisker to invest $10 million into PIPE supporting the planned merger of Allego with Spartan Acquisition Corp III
  • Pro forma equity value of the merger is approximately $3.14 billion, at the $10.00 per share PIPE price, and assuming minimal Spartan shareholder redemptions
  • Allego has more than 26,000 public EV charging ports across 12,000 public and private locations in 12 European countries – with leading utilization rates and a substantial recurring user base, as well as a secured backlog of 500 premium sites
  • Fisker to partner with Allego on specific period free charging offer for its customers in Europe

LOS ANGELES--(BUSINESS WIRE)--#EVs--Fisker Inc. (NYSE: FSR) ("Fisker") – passionate creator of the world's most sustainable electric vehicles and advanced mobility solutions – today announced it will make a $10 million private investment in public equity (PIPE) supporting the planned merger of leading European EV charging network, Allego B.V. (“Allego”) with Spartan Acquisition Corp. III (NYSE: SPAQ), a publicly-listed special purpose acquisition company. Fisker is the exclusive electric vehicle automaker in the PIPE and, in parallel, has agreed to terms on a strategic partnership to deliver a range of charging options for its customers in Europe.


"Allego has been a long-standing pioneer in the push to create a seamless pan-European electric vehicle charging network," said Fisker Chairman and CEO, Henrik Fisker. "Our investment in the PIPE is motivated by strategic and tactical considerations, ensuring we have a stake in the future of EV charging networks while delivering tangible benefits to our customers."

Through the Fisker-Allego partnership announced today, the two companies are collaborating on offering electric vehicle charging and related services across multiple European markets. Included in that partnership is the provision that fleet and private customers buying or leasing a Fisker Ocean SUV between Jan. 1, 2023 and March 31, 2024 will benefit from one year of free charging (from original date of registration) on the Allego network. Further, the two companies are working on future plans to deliver a seamless charging experience for Fisker customers using the Allego ‘Plug & Charge’ service that utilizes the Allego Fast and Ultra-Fast charger network.

“Having Fisker both invest in our PIPE, and at the same time form a commercial partnership is a significant vote of confidence in our growth plans,” said Mathieu Bonnet, CEO of Allego. “Both Fisker and Allego have a common connection through the 'Spartan' franchise of SPACs sponsored by funds managed by affiliates of Apollo Global Management, and I want to recognize the leadership of Geoffrey Strong and his team at Spartan who are constantly creating new investment opportunities across the clean mobility sector.”

Founded in 2013, Allego is a leading EV charging network in Europe and has deployed more than 26,000 charging ports across 12,000 public and private locations, spanning 12 European countries. Allego’s charging network includes fast, ultra-fast and AC charging solutions delivered through either owned or operated public charging networks, in addition to charging solutions for B2B customers. Allego has developed a rich portfolio of partnerships with strategic partners including municipalities, more than 50 real estate owners and more than 15 automakers.

Fisker intends to start production and deliveries on its first vehicle, the Ocean electric SUV, from Nov. 17, 2022 – and unveil a production-intent prototype at the LA Auto Show® later this year. The Fisker Ocean will enter the U.S. market at a starting MSRP of $37,499 (excluding EV-related subsidies) and below €32,000 in Germany (including taxes and EV-related subsidies). Including fleet orders from companies such as Credit Agricole Consumer Finance, Onto and Viggo, Fisker has more than 62,000 hand-raisers and 17,300 paid reservations for the Ocean.

“With this new funding, we are confident that Allego will be well equipped to introduce the most advanced charging technologies, continue to expand their network and be able to deliver a seamless charging experience for our customers,” added Mr. Fisker.

For more information or interview inquiries, contact This email address is being protected from spambots. You need JavaScript enabled to view it..

About Fisker Inc.
California-based Fisker Inc. is revolutionizing the automotive industry by developing the most emotionally desirable and eco-friendly electric vehicles on Earth. Passionately driven by a vision of a clean future for all, the company is on a mission to become the No. 1 e-mobility service provider with the world's most sustainable vehicles. To learn more, visit www.FiskerInc.com – and enjoy exclusive content across Fisker's social media channels: Facebook, Instagram, Twitter, YouTube and LinkedIn.

Download the revolutionary new Fisker mobile app from the App Store or Google Play store.

About Allego
Allego delivers charging solutions for electric cars, motors, buses and trucks, for consumers, businesses and cities. Allego’s end-to-end charging solutions make it easier for businesses and cities to deliver the infrastructure drivers need, while the scalability of our solutions makes us the partner of the future. Founded in 2013, Allego is a leader in charging solutions, with an international charging network comprised of more than 26,000 charge points operational throughout Europe – and growing rapidly. Our charging solutions are connected to our proprietary platform, EV-Cloud, which gives us and our customers a full portfolio of features and services to meet and exceed market demands. We are committed to providing independent, reliable and safe charging solutions, agnostic of vehicle model or network affiliation. At Allego, we strive every day to make EV charging easier, more convenient and more enjoyable for all.

Forward-Looking Statements
This press release includes forward-looking statements, which are subject to the "safe harbor" provisions of the US Private Securities Litigation Reform Act of 1995. These statements may be identified by words such as "feel," "believes," expects," "estimates," "projects," "intends," "should," "is to be," or the negative of such terms, or other comparable terminology and include, among other things, the quotations of our Chief Executive Officer and statements regarding the planned start of production and MSRP of the Ocean, the Company's future performance and other future events that involve risks and uncertainties. Such forward-looking statements are not guarantees of future performance and are subject to risks and uncertainties, which could cause actual results to differ materially from the forward-looking statements contained herein due to many factors, including, but not limited to: Fisker's limited operating history; Fisker's ability to enter into additional manufacturing and other contracts with Magna, or other OEMs or tier-one suppliers in order to execute on its business plan; the risk that OEM and supply partners do not meet agreed upon timelines or experience capacity constraints; Fisker may experience significant delays in the design, manufacture, regulatory approval, launch and financing of its vehicles; Fisker's ability to execute its business model, including market acceptance of its planned products and services; Fisker's inability to retain key personnel and to hire additional personnel; competition in the electric vehicle market; Fisker's inability to develop a sales distribution network; and the ability to protect its intellectual property rights; and those factors discussed in Fisker's Annual Report on Form 10-K, as amended, under the heading "Risk Factors," filed with the Securities and Exchange Commission (the "SEC"), as supplemented by Quarterly Reports on Form 10-Q, and other reports and documents Fisker files from time to time with the SEC. Any forward-looking statements speak only as of the date on which they are made, and Fisker undertakes no obligation to update any forward-looking statement to reflect events or circumstances after the date of this press release.


Contacts

Simon Sproule, SVP, Communications
310.374.6177 | This email address is being protected from spambots. You need JavaScript enabled to view it.

Rebecca Lindland, Director, Communications
This email address is being protected from spambots. You need JavaScript enabled to view it.

Dan Galves, VP, Investor Relations
This email address is being protected from spambots. You need JavaScript enabled to view it. / This email address is being protected from spambots. You need JavaScript enabled to view it.
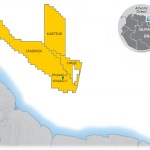

HOUSTON--(BUSINESS WIRE)--Enterprise Products Partners L.P. (“Enterprise”) (NYSE: EPD) today announced its financial results for the three and six months ended June 30, 2021.


Enterprise reported net income attributable to common unitholders of $1.1 billion, or $0.50 per unit on a fully diluted basis, for the second quarter of 2021, compared to $1.0 billion, or $0.47 per unit on a fully diluted basis, for the second quarter of 2020. Net income for the second quarters of 2021 and 2020 was reduced by non-cash, asset impairment charges of $18 million, or $0.01 per fully diluted unit, and $12 million, or $0.01 per fully diluted unit, respectively.

Net cash flow provided by operating activities, or cash flow from operations (“CFFO”), was $2.0 billion for the second quarter of 2021 compared to $1.2 billion for the second quarter of 2020. CFFO for the second quarter of 2021 included $300 million of net cash provided by changes in working capital accounts, while CFFO for the second quarter of 2020 was reduced by $431 million of net cash used for working capital. Distributions declared with respect to the second quarter of 2021 increased 1.1 percent to $0.45 per unit, or $1.80 per unit annualized, compared to distributions declared for the second quarter of 2020. Enterprise’s payout ratio of distributions to common unitholders and partnership unit buybacks for the twelve months ended June 30, 2021 was 60 percent of CFFO. For the twelve months ended June 30, 2021, Free Cash Flow (“FCF”) was $4.2 billion compared to $2.7 billion for the twelve months ended June 30, 2020.

Distributable Cash Flow (“DCF”) was $1.6 billion for both the second quarters of 2021 and 2020. DCF provided 1.6 times coverage of the distribution declared with respect to the second quarter of 2021. Enterprise retained $607 million of DCF for the second quarter of 2021, and $2.7 billion for the twelve months ended June 30, 2021.

Second Quarter Highlights


Three Months Ended June 30,

($ in millions, except per unit amounts)


2021


2020

Operating income


$

1,493


$

1,437

Net income (1)


$

1,146


$

1,061

Fully diluted earnings per common unit (1)


$

0.50


$

0.47

Net cash provided by operating activities (CFFO) (2)


$

1,994


$

1,182

Total gross operating margin (3)


$

2,061


$

1,998

Adjusted EBITDA (3)


$

2,008


$

1,961

FCF (3)


$

1,386


$

305

DCF (3)


$

1,599


$

1,577


(1)


Net income and fully diluted earnings per common unit for the second quarters of 2021 and 2020 include non-cash, asset impairment charges of $18 million or $0.01 per unit, and $12 million, or $0.01 per unit, respectively.  For the six months ended June 30, 2021 and 2020, net income and fully diluted earnings per common unit include $84 million, or $0.04 per unit, and $13 million, or $0.01 per unit, respectively, of non-cash, asset impairment charges.

(2)


CFFO reflects the timing of cash receipts and payments related to operations along with other changes in working capital accounts. The net effect of changes in operating accounts, which are a component of CFFO, was a net increase of $300 million in the second quarter of 2021 compared to a net decrease of $431 million in the second quarter of 2020. 

(3)


Total gross operating margin, adjusted earnings before interest, taxes, depreciation and amortization (“Adjusted EBITDA”), FCF and DCF are non-generally accepted accounting principle (“non-GAAP”) financial measures that are defined and reconciled later in this press release.

  • Gross operating margin, operating income and net income attributable to common unitholders included non-cash, mark-to-market (“MTM”) gains on financial instruments used in our commodity hedging activities of $23 million for the second quarter of 2021 and $62 million for the second quarter of 2020.
  • Capital investments were $634 million in the second quarter of 2021 and $1.3 billion for the first six months of 2021. Included in these investments were sustaining capital expenditures of $117 million in the second quarter of 2021 and $261 million in the first six months of 2021.

Second Quarter Volume Highlights


Three Months Ended June 30,


2021


2020

NGL, crude oil, refined products & petrochemical

 pipeline volumes (million BPD)


6.4


6.2

Marine terminal volumes (million BPD)


1.6


1.7

Natural gas pipeline volumes (TBtus/d)


14.2


13.0

NGL fractionation volumes (million BPD)


1.2


1.2

Propylene plant production volumes (MBPD)


113


72

Fee-based natural gas processing volumes (Bcf/d)


4.2


4.1

Equity NGL production volumes (MBPD)


198


188

As used in this press release, “NGL” means natural gas liquids, “BPD” means barrels per day, “MBPD” means thousand barrels per day, “MMcf/d” means million cubic feet per day, “Bcf/d” means billion cubic feet per day, “BBtus/d” means billion British thermal units per day, and “TBtus/d” means trillion British thermal units per day.

“Enterprise’s second quarter results reflected the ongoing recovery in demand for crude oil, NGLs, primary petrochemicals and refined products as the global economy continues to reopen from COVID-related lockdowns,” said A.J. “Jim” Teague, co-chief executive officer of Enterprise’s general partner. “Our liquids pipelines transported 6.4 million BPD for the second quarter of 2021, which is within four percent of our 2019 volumes of 6.7 million BPD. Enterprise’s natural gas pipelines transported 14.2 TBtus/d for the second quarter, equaling our 2019 volumes. NGL fractionation volumes for the second quarter of 2021 remained strong at near record levels of 1.2 million BPD. Our propylene production for the second quarter of 2021 was a record 113 MBPD. Liquid volumes handled by our marine terminals for the second quarter of this year were 1.6 million BPD, which still lagged 2019 volumes of 1.9 million BPD, primarily due to weakness in crude oil and refined product exports.”

“The partnership generated $2.1 billion of gross operating margin for the second quarter of 2021, primarily attributable to record results for our propylene business, improved natural gas processing margins and volumes, higher product values across our system and $66 million of payments received from the Texas Load Resources Demand Response Program. Cash flow from operations for the second quarter of 2021 was $2 billion, which more than fully funded our capital expenditures and cash distributions to common unitholders for the quarter of $634 million and $991 million, respectively,” stated Teague.

“Our commercial teams continue to make progress with certain of our downstream customers regarding growth projects under development. Enterprise’s newly formed energy evolution technology team has made remarkable early progress in researching and identifying areas that are complementary to our existing competencies and assets such as carbon capture and sequestration, hydrogen and renewable fuels,” continued Teague.

“Enterprise’s major construction projects remain on-time and on-budget. The next two growth projects scheduled for completion in the fourth quarter of 2021 are the Gillis natural gas pipeline that will connect Haynesville Shale production with the LNG markets in southwest Louisiana and a natural gasoline treater in Chambers County, Texas. The partnership completed the quarter with a strong balance sheet and $5.4 billion in liquidity, which gives us the flexibility to fund energy evolution-type projects as they develop and to continue to return capital to our investors,” said Teague.

Review of Second Quarter 2021 Results

Enterprise reported total gross operating margin of $2.1 billion for the second quarter of 2021 compared to $2.0 billion for the second quarter of 2020. Below is a review of each business segment’s performance for the second quarter of 2021.

NGL Pipelines & Services – Gross operating margin from the NGL Pipelines & Services segment increased 13 percent to $1.1 billion for the second quarter of 2021 from $968 million for the second quarter of 2020. Gross operating margin for the second quarter of 2021 and 2020 included non-cash, mark-to-market gains of $15 million and $36 million, respectively, from hedging activities.

Enterprise’s natural gas processing and related NGL marketing business reported gross operating margin of $286 million for the second quarter of 2021 compared to $199 million for the second quarter of 2020. Higher average gas processing margins, including contributions from hedging activities, from the partnership’s Rocky Mountain, South Texas and Louisiana and Mississippi processing plants accounted for a $79 million increase in gross operating margin. A 106 percent increase in composite NGL prices contributed to the improvement in average processing margins. Partially offsetting these benefits was a $17 million decrease in gross operating margin attributable to the partnership’s South Texas gas processing facilities from lower average processing fees and a 49 MMcf/d decrease in fee-based processing volumes.

Total fee-based processing volumes were 4.2 Bcf/d in the second quarter of 2021 compared to 4.1 Bcf/d in the second quarter of 2020. The partnership’s equity NGL production increased to 198 MBPD this quarter from 188 MBPD in the second quarter of last year.

Gross operating margin from NGL marketing activities increased $25 million, primarily due to higher average sales margins, partially offset by lower sales volumes.

Gross operating margin from the partnership’s NGL pipelines and storage business decreased $51 million to $555 million for the second quarter of 2021 from $606 million for the second quarter of 2020. NGL pipeline transportation volumes were 3.4 million BPD in the second quarter of 2021 compared to 3.5 million BPD in the second quarter of 2020. NGL marine terminal volumes were 665 MBPD for the second quarter of 2021 compared to 701 MBPD for the same quarter last year.

Gross operating margin from Enterprise’s Dixie Pipeline and related terminals decreased $19 million for the second quarter of 2021 versus the second quarter of 2020, primarily due to lower transportation volumes of 74 MBPD and higher operating costs associated with downtime for pipeline assessment and integrity activities.

Enterprise’s NGL pipelines that serve the Permian Basin and Rocky Mountain producers, including the Mid-America and Seminole NGL Pipeline Systems, Shin Oak NGL Pipeline and Chaparral NGL pipeline, on a combined basis had a $7 million decrease in gross operating margin for the second quarter of 2021 compared to the second quarter of last year. The primary reason for the decrease was higher operating costs, partially offset by higher average transportation fees on the Mid-America Pipeline System.

Gross operating margin from the partnership’s NGL storage complex in Chambers County, Texas decreased $15 million for the second quarter of 2021 compared to the second quarter of last year, primarily due to higher operating costs and lower throughput fee revenues. The Enterprise Hydrocarbons Terminal (“EHT”) and related Channel pipeline had a $12 million decrease in gross operating margin for the second quarter of this year compared to the second quarter of 2020, primarily due to a 62 MBPD decrease in export volumes.

The South Texas NGL Pipeline System had a $14 million increase in gross operating margin, primarily due to higher pipeline capacity fees and a 27 MBPD increase in transportation volumes.

Enterprise’s NGL fractionation business reported a $94 million increase in gross operating margin for the second quarter of 2021 compared to the second quarter of 2020. Total NGL fractionation volumes were 1.2 million BPD for both the second quarters of 2021 and 2020.

Gross operating margin from the partnership’s Chambers County NGL fractionation complex reported a $102 million increase in gross operating margin for the second quarter of 2021 compared to the second quarter of last year, primarily due to gains from the optimization of our power supply arrangements and payments received for voluntarily reducing power consumption in February 2021 under the Texas Load Resource Demand Response Program (“LaaR”). NGL fractionation volumes increased 137 MBPD, net to our interest, primarily due to contributions from Frac XI that began operations in September 2020.

Enterprise’s Norco fractionator in Louisiana had an $11 million decrease in gross operating margin for the second quarter of this year versus the same quarter in 2020, primarily due to 36 days of downtime and expense associated with planned major maintenance activities completed in the second quarter of 2021. NGL fractionation volumes decreased 34 MBPD in the second quarter of 2021 compared to the same quarter in 2020.

Crude Oil Pipelines & Services – Gross operating margin from the partnership’s Crude Oil Pipelines & Services segment was $419 million for the second quarter of 2021 compared to $634 million for the second quarter of 2020. Gross operating margin for the second quarter of 2021 included $10 million of non-cash, mark-to-market losses related to hedging activities compared to $8 million of non-cash, mark-to-market gains for the second quarter of 2020. Total crude oil pipeline transportation volumes were 2.0 million BPD for the second quarter of this year compared to 1.9 million BPD for the second quarter of 2020. Total crude oil marine terminal volumes were 770 MBPD for the second quarter of 2021 compared to 726 MBPD for the second quarter of 2020.

Gross operating margin from crude oil marketing activities for the second quarter of 2021 decreased $219 million compared to the second quarter of 2020, primarily due to lower average sales margins, including the impact of hedging activities. Results for the second quarter of 2020 benefited from higher margins attributable to strategies that optimized our crude oil storage and transportation assets.

The partnership’s West Texas Pipeline System had an $8 million decrease in gross operating margin for the second quarter of 2021 compared to the second quarter of last year, primarily due to lower average transportation fees. Volumes transported on this pipeline for the second quarter of 2021 increased by 20 MBPD compared to the same quarter of last year. An 18 MBPD decrease in transportation volumes for the second quarter of 2021 versus the second quarter of 2020 led to a $6 million decrease in gross operating margin from the South Texas Crude Oil Pipeline System.

Gross operating margin from crude oil activities at EHT decreased $8 million for the second quarter of 2021 compared to the same quarter of 2020 due to lower storage revenues and other fees.

Enterprise’s share of gross operating margin associated with the Seaway Pipeline increased $23 million for the second quarter of this year compared to the same quarter in 2020, primarily due to our share of payments received associated with the LaaR program in connection with the winter storms in February 2021. Transportation volumes decreased 50 MBPD, net to our interest, this quarter compared to the second quarter of 2020.

Gross operating margin from Enterprise’s Midland-to-ECHO System increased $4 million for the second quarter of 2021 compared to the second quarter of 2020, primarily due to higher transportation volumes of 206 MBPD, net to our interest, partially offset by lower average sales margins from marketing activities and higher operating costs. The increase in transportation volumes was primarily due to the Midland-to-ECHO 3 pipeline, which began operations in October 2020.

Natural Gas Pipelines & Services – Enterprise’s Natural Gas Pipelines & Services segment reported gross operating margin of $202 million for the second quarter of 2021 compared to $209 million for the second quarter of 2020. Total natural gas transportation volumes were 14.2 TBtus/d for the second quarter of 2021 compared to 13.0 TBtus/d for the second quarter of 2020.

Gross operating margin from the partnership’s Permian Basin Gathering System increased $32 million for the second quarter of 2021 compared to the second quarter of 2020, primarily due to higher average condensate sales prices and volumes, and higher natural gas gathering volumes of 534 BBtus/d. The increase in gathering volumes correspond to deliveries to Enterprise’s Orla and Mentone processing facilities.

Gross operating margin from Enterprise’s natural gas marketing business decreased $27 million for the second quarter of 2021 compared to the second quarter of 2020, primarily due to lower average sales margins.

Gross operating margin from the partnership’s Texas Intrastate System decreased $7 million for the second quarter of this year compared to the same quarter in 2020. This decrease in gross operating margin was primarily attributable to lower capacity reservation fees, which accounted for a $25 million decrease, partially offset by a combined $18 million increase in gross operating margin from higher storage and other fees, and higher transportation volumes. Natural gas pipeline volumes for this system were 5.1 TBtus/d in the second quarter of 2021 compared to 4.1 TBtus/d in the second quarter of 2020.

Petrochemical & Refined Products Services – Gross operating margin for the Petrochemical & Refined Products Services segment increased $134 million to $326 million for the second quarter of 2021 compared to $192 million for the second quarter of 2020. Total segment pipeline transportation volumes were a record 977 MBPD this quarter compared to 786 MBPD for the same quarter of last year.

Gross operating margin from the partnership’s propylene production and related activities was a record $204 million for the second quarter of 2021 compared to $61 million for the second quarter of 2020. Gross operating margin generated by Enterprise’s propylene facilities at the Chambers County complex increased $141 million, primarily due to higher average sales margins, propylene and associated by-product sales volumes, and fractionation fees. Partially offsetting these increases in gross operating margin was higher utility and other operating expenses. Total propylene production and associated by-product volumes for the second quarter of 2021 increased 41 MBPD to a record 113 MBPD compared to 72 MBPD for the second quarter of 2020. This includes a 16 MBPD increase from the partnership’s propane dehydrogenation (“PDH”) facility. The PDH facility had 46 days of unplanned downtime in the second quarter of 2020 for major maintenance activities.

Gross operating margin from butane isomerization and related operations increased $4 million for the second quarter of 2021 compared to the same quarter of last year, primarily due to higher by-product sales and isomerization and standalone DIB production volumes, which increased by 16 MBPD and 43 MBPD, respectively. These increases in revenues were partially offset by higher utility and maintenance costs.

Gross operating margin from refined products pipelines and related activities for the second quarter of 2021 increased $3 million compared to the second quarter of last year. Gross operating margin from the TE Products Pipeline System increased $15 million primarily due to a 52 MBPD increase in interstate refined product transportation volumes. Total transportation volumes on the TE Products Pipeline System increased by a net 146 MBPD for the second quarter of this year compared to the same quarter in 2020, primarily due to recovering demand for motor fuels. Partially offsetting this increase was a $12 million decrease in gross operating margin from refined products marketing activities due to lower sales volumes and average sales margins.

The partnership’s octane enhancement business and related operations had a $19 million decrease in gross operating margin this quarter compared to the second quarter of 2020, primarily due to higher operating costs and lower sales volumes. Production volumes at our octane enhancement facility were 4 MBPD lower primarily due to 30 days of downtime during the second quarter of 2021 related to planned major maintenance activities that were completed in early May 2021.

Capitalization

Total debt principal outstanding at June 30, 2021 was $28.8 billion, including $2.6 billion of junior subordinated notes, to which the debt rating agencies ascribe partial equity content. At June 30, 2021, Enterprise had consolidated liquidity of approximately $5.4 billion, comprised of unrestricted cash on hand and available borrowing capacity under its revolving credit facilities.

Capital Investments

Total capital spending in the second quarter of 2021 was $634 million, which includes $117 million of sustaining capital expenditures. For the first six months of 2021, Enterprise’s capital spending was $1.3 billion, including $261 million of sustaining capital expenditures. Included in sustaining capital expenditures for the first six months were $97 million associated with the planned turnarounds of the PDH, octane enhancement and high-purity isobutylene facilities.

Our current expectation for growth capital investments associated with sanctioned projects for 2021 and 2022 is $1.7 billion and $800 million, respectively. These estimates do not include capital investments associated with Enterprise’s proposed deepwater Seaport Oil Terminal (“SPOT”), which remains subject to governmental approval. We currently expect sustaining capital expenditures to be approximately $440 million for 2021.

Conference Call to Discuss Second Quarter 2021 Earnings

Today, Enterprise will host a conference call to discuss second quarter 2021 earnings. The call will be broadcast live over the Internet beginning at 9:00 a.m. CT and may be accessed by visiting the partnership’s website at www.enterpriseproducts.com.

Use of Non-GAAP Financial Measures

This press release and accompanying schedules include the non-GAAP financial measures of total gross operating margin, FCF, DCF and Adjusted EBITDA. The accompanying schedules provide definitions of these non-GAAP financial measures and reconciliations to their most directly comparable financial measure calculated and presented in accordance with GAAP. Our non-GAAP financial measures should not be considered as alternatives to GAAP measures such as net income, operating income, net cash flow provided by operating activities or any other measure of financial performance calculated and presented in accordance with GAAP. Our non-GAAP financial measures may not be comparable to similarly titled measures of other companies because they may not calculate such measures in the same manner as we do.

Company Information and Use of Forward-Looking Statements

Enterprise Products Partners L.P. is one of the largest publicly traded partnerships and a leading North American provider of midstream energy services to producers and consumers of natural gas, NGLs, crude oil, refined products and petrochemicals. Services include: natural gas gathering, treating, processing, transportation and storage; NGL transportation, fractionation, storage and export and import terminals; crude oil gathering, transportation, storage and export and import terminals; petrochemical and refined products transportation, storage, export and import terminals and related services; and a marine transportation business that operates primarily on the United States inland and Intracoastal Waterway systems. The partnership’s assets include approximately 50,000 miles of pipelines; 260 million barrels of storage capacity for NGLs, crude oil, refined products and petrochemicals; and 14 billion cubic feet of natural gas storage capacity.

This press release includes forward-looking statements. Except for the historical information contained herein, the matters discussed in this press release are forward-looking statements that involve certain risks and uncertainties, such as the partnership’s expectations regarding future results, capital expenditures, project completions, liquidity and financial market conditions.


Contacts

Randy Burkhalter, Vice President, Investor Relations, (713) 381-6812
Rick Rainey, Vice President, Media Relations, (713) 381-3635


Read full story here

EVANSVILLE, Ind.--(BUSINESS WIRE)--Today, Berry Global Group, Inc. (NYSE: BERY) announced the approval of projects that will help the Company achieve its new milestone goal to eliminate 100 million kilowatt hours (kWh) of electricity from its operations. Berry surpassed its initial target to eliminate 1 million kWh from the Company’s operations in 2020 and is leveraging that success to reach its 100 million kWh goal. With an original deadline of September 2021, Berry is ahead of schedule in achieving these project approvals.


Through the sharing of best practices, Berry team members collaborated across 324 energy saving projects to achieve record energy reduction. In addition, five million kWh were saved through improvements that did not require capital investment. These reductions in energy directly reduce Berry’s scope 1 and 2 emissions, which inherently reduce customer’s scope 3 emissions.

The emissions saved from this remarkable reduction in energy is equal to the CO2 emissions to power over 8,500 homes for one year, charge 8.6 billion smartphones, and greenhouse gas emissions of 15,000 passenger vehicles for one year.1

“In line with our Science-Based Targets to minimize our environmental impacts, we are closely evaluating our energy usage as an important step toward a net-zero economy. Achieving a goal such as this requires the collective expertise of team members at all of our 285 facilities working toward the same goal of lower carbon emissions,” said Tom Salmon, Chairman and CEO of Berry Global.

Accomplished through hundreds of small projects, team members from around the world led initiatives to decrease energy use in Berry’s facilities. Just one example can be seen in Berry’s Terno d’Isola, Italy, facility, where team members implemented programming to automatically shut off equipment when not needed, eliminating 70 minutes of energy every day. Through implementation of the Terno d’Isola’s energy project, the site saved a total of 45,000 kWh, equaling a total of 31.9 MT in carbon emissions, or enough energy to fuel 7 cars for one year.1

“The one million kWh challenge was just a reminder of the little things we can all do in our plants and offices to reduce kWh consumption, like turning off the lights, turning off conveyors, and taking advantage of free cooling, but the transition to the 100 million kWh challenge in 2021 was an effort to highlight the results we can realize when we work together with the specific purpose of reducing energy consumption,” said Rodgers Greenawalt, EVP Operations for Berry Global.

Combining its global presence and local agility to solve this 285 site-wide challenge, Berry leveraged employee ideas for saving energy and brought them to life on a global scale, highlighting what can be accomplished when working together toward a common goal.

1Calculated using: https://www.epa.gov/energy/greenhouse-gas-equivalencies-calculator

About Berry

At Berry Global Group, Inc. (NYSE:BERY), we create innovative packaging and engineered products that we believe make life better for people and the planet. We do this every day by leveraging our unmatched global capabilities, sustainability leadership, and deep innovation expertise to serve customers of all sizes around the world. Harnessing the strength in our diversity and industry leading talent of 47,000 global employees across more than 285 locations we partner with customers to develop, design, and manufacture innovative products with an eye toward the circular economy. The challenges we solve and the innovations we pioneer benefit our customers at every stage of their journey. For more information, visit our website, or connect with us on LinkedIn or Twitter.


Contacts

Berry Media Contact:
Amy Waterman
+1 812 306 2435
This email address is being protected from spambots. You need JavaScript enabled to view it.

The Fund Looks to Expand Access and Opportunities for Underrepresented Entrepreneurs and Communities Advancing the Low Carbon Economy of the Future 

NEW YORK--(BUSINESS WIRE)--Energy Impact Partners LP (“EIP”), a global investment platform leading the transition to a sustainable energy future, announced today its Elevate Future Fund (“Elevate” or “Fund”), which aims to create a more diverse founder community and inclusive venture capital ecosystem within the broader energy transition. Elevate is targeting $120 million in commitments and has already closed on more than half of this goal through strong support from its existing corporate investor network. Elevate has made three investments in companies led or founded by diverse talent and has a strong pipeline of additional opportunities.


The Fund will be focused on investing in companies founded or run by diverse talent that are driving innovation within EIP’s core mission of advancing the low carbon economy, including supply decarbonization, electrification, tech enabled infrastructure, reliability and resilience, and intelligent demand. In addition to its direct investments, the Elevate team will form partnerships with technology accelerators, and universities, including historically black colleges to nurture talent, promote infrastructure and support systems to retain talent from underrepresented groups. The Fund will work closely with its strategic corporate investors to leverage their considerable resources to jointly advance this important mission.

“As we reshape the low carbon economy of the future, it is important that this future is equitable, diverse and inclusive. We have a lot to improve upon and formed Elevate to help advance this important cause,” said Hans Kobler, Founder and CEO of EIP.

Elevate features an industry leading group of founding corporate partners and investors who are committed to working alongside EIP including: Alliant Energy (NASDAQ: LNT), Ameren Corp. (NYSE: AEE), Duke Energy (NYSE: DUK), Emera Inc. (OTCMKTS: EMRAF), FirstEnergy Corp. (NYSE: FE), Fortis Inc. (TSX/NYSE: FTS), Microsoft (NASDAQ: MSFT), through its Climate Innovation Fund, OGE Energy Corp. (NYSE: OGE), Pinnacle West Capital Corporation (NYSE: PNW), PPL Corporation (NYSE: PPL), Southern Company (NYSE: SO), Tennessee Valley Authority Asset Retirement Trust, and Xcel Energy (NASDAQ: XEL).

“With the creation of the Elevate Future Fund we are addressing the need for the venture capital community to come together to provide better opportunities for underserved communities in our industry,” said Anthony Oni, Managing Partner of the Elevate Future Fund. “We look forward to working closely with our incredible corporate partners to help advance a more equitable ecosystem and provide better opportunities for underrepresented people.”

“We’re excited to apply EIP’s model and leadership in climate impact to take a more proactive role in fostering diversity in the venture and energy tech space. Elevate provides another dynamic vehicle for us to proactively support the development of diverse businesses in our industry and the communities we serve,” said Chris Cummiskey, Chief Commercial & Customer Solutions Officer for Southern Company.

“Xcel Energy is deeply committed to building an energy future that reflects the rich diversity of the communities that we serve. As a long-time investor in Energy Impact Partners, we are pleased and proud to have the opportunity to both invest in and co-chair the Elevate Fund,” said Ben Fowke, CEO and chairman of Xcel Energy. “The goals of this fund align with our own and we are excited to support both the development of clean energy technologies and the diverse founders of the companies doing this critical work.”

The Fund has already made three investments in diverse companies focused on the energy transition. This includes the Los Angeles-based company, ChargerHelp! a Black women-owned startup that has developed a mobile application and web-based platform for rapid, on-demand repair of electric vehicle charging stations. The Elevate investment will help ChargerHelp! expand its service and improve its technology. Elevate has also invested in Project Canary, an international environmental standards company based in Denver, and HopSkipDrive, the innovative, safe, and dependable youth transportation solutions for schools, districts, government agencies and families.

“Our partnership supports the bright minds and diverse entrepreneurs who are key as our industry transitions to a cleaner energy future. Through the Elevate Future Fund, Fortis is taking purposeful action to support the up-and-coming innovators and underrepresented talent in our industry. Fortis is proud to be a partner,” said David G. Hutchens, President and CEO, Fortis Inc.

“We look forward to partnering with EIP to advance the clean energy transition and foster greater diversity, equity and inclusion,” said Vincent Sorgi, PPL President and Chief Executive Officer. “We recognize that it will take new ideas, technology and systems to achieve a net-zero emissions future that preserves energy reliability and affordability. PPL believes cultivating diversity will help to fuel that innovation and deliver positive outcomes for the people and communities we serve.”

“Microsoft is investing in EIP’s Elevate Future Fund through our Climate Innovation Fund because of their support for climate solutions driven by a diverse talent base. Our Climate Innovation Fund aims to accelerate technology development and the deployment of new climate innovations that demonstrate impact and equity to help deliver a more sustainable, just, and prosperous future for everyone,” said Brandon Middaugh, Director of Microsoft’s Climate Innovation Fund.

“We are proud to be an investor in Energy Impact Partners,” said Diane Cooke, VP of Human Resources at Alliant Energy. “We are excited about the promising opportunities this partnership creates for inclusiveness, locally and nationally. We especially appreciate the chance to work together on innovative ways to build a more diverse and inclusive workforce that advances our collective efforts for creating a carbon free future. Through partnership, we’ll continue advancing our efforts to generate a healthier, more sustainable environment, which truly benefits our customers and the communities we proudly serve.”

Please email This email address is being protected from spambots. You need JavaScript enabled to view it. for more information on the Elevate Future Fund.
About Energy Impact Partners
Energy Impact Partners, LP (EIP) is a global investment platform leading the transition to a sustainable energy future. EIP brings together entrepreneurs and the world's most forward-looking energy and industrial companies to advance innovation. With over $2.0 billion in assets under management, EIP invests globally across venture, growth, credit, and infrastructure – and has a team of more than 50 professionals based in its offices in New York, San Francisco, Palm Beach, London, Cologne, and soon Oslo. For more information on EIP, please visit www.energyimpactpartners.com.


Contacts

Tori McDonnell
Silverline Communications – on behalf of EIP
703-338-2362
This email address is being protected from spambots. You need JavaScript enabled to view it.
Key Developments:


  • Increased quarterly cash distribution to $0.5042 per Class A share for the second quarter of 2021, an approximate 11% increase compared with the first quarter of 2021, resulting in a 1.4x coverage ratio relative to distributions.
  • Announced agreement by Hess Midstream Operations LP to repurchase $750 million of Class B units from Hess Corporation and Global Infrastructure Partners, expected to be completed in August 2021.

Second Quarter 2021 Highlights:

  • Net income was $162.0 million. Net cash provided by operating activities was $224.6 million.
  • Net income attributable to Hess Midstream LP was $11.0 million, or $0.44 per Class A share, after deduction for noncontrolling interests.
  • Adjusted EBITDA1 was $230.2 million, Distributable Cash Flow1 was $207.5 million and Adjusted Free Cash Flow1 was $162.6 million.

Guidance:

  • Following strong year-to-date 2021 results, Hess Midstream LP is updating its full year 2021 net income guidance to $590 - $610 million and raising its full year 2021 Adjusted EBITDA guidance to $880 - $900 million.
  • Following Hess Corporation’s announcement of increasing rig count in the Bakken to 3 rigs in September 2021, Hess Midstream LP is increasing its full year 2021 expansion capital guidance to $165 million.
  • Hess Midstream LP is reiterating its annual distribution per share growth target of at least 5% through 2023 from the new higher per share distribution level with expected annual distribution coverage greater than 1.4x.
  • Hess Midstream LP is reaffirming its previously announced expectation of continued growth in Adjusted EBITDA in 2022 and 2023 and continued Adjusted Free Cash Flow generation sufficient to fully fund growing distributions, creating additional capital allocation flexibility.

HOUSTON--(BUSINESS WIRE)--$HESM--Hess Midstream LP (NYSE: HESM) (“Hess Midstream”) today reported second quarter 2021 net income of $162.0 million compared with net income of $107.8 million for the second quarter of 2020. After deduction for noncontrolling interests, net income attributable to Hess Midstream was $11.0 million, or $0.44 per Class A share. Hess Midstream generated Adjusted EBITDA of $230.2 million. Distributable Cash Flow (“DCF”) for the second quarter of 2021 was $207.5 million and Adjusted Free Cash Flow was $162.6 million.

Hess Midstream delivered another strong quarter, marked by higher gas capture and lower than expected costs,” said John Gatling, President and Chief Operating Officer of Hess Midstream. “Looking ahead, we are poised for organic growth and continued adjusted free cash flow as Hess Corporation adds a third rig in September. Furthermore, our decision to return capital to shareholders underscores our confidence in Hess Midstream’s financial stability and trajectory for future volume growth.”

Hess Midstream’s results contained in this release are consolidated to include the noncontrolling interests in Hess Midstream Operations LP owned by affiliates of Hess Corporation (“Hess”) and Global Infrastructure Partners (“GIP”). We refer to certain results as “attributable to Hess Midstream LP,” which exclude the noncontrolling interests in Hess Midstream Operations LP owned by Hess and GIP.

Financial Results

Revenues and other income in the second quarter of 2021 were $294.8 million compared with $269.8 million in the prior-year quarter. Second quarter 2021 revenues included $18.6 million of pass-through rail transportation, electricity, produced water trucking and disposal costs and $18.7 million of shortfall fee payments related to minimum volume commitments compared with $46.0 million and $3.1 million, respectively, in the prior-year quarter. Second quarter 2021 revenues and other income were up $25.0 million compared to the prior-year quarter primarily due to higher minimum volume commitment levels and tariff rates, partially offset by lower pass-through transportation revenues. Total costs and expenses in the second quarter of 2021 were $109.2 million, down from $138.0 million in the prior-year quarter. The decrease was primarily attributable to lower pass-through transportation costs.

Net income for the second quarter of 2021 was $162.0 million, or $0.44 per Class A share, after deduction for noncontrolling interests. Substantially all of income tax expense was attributed to earnings of Class A shares reflective of our organizational structure. Net cash provided by operating activities for the second quarter of 2021 was $224.6 million.

Adjusted EBITDA for the second quarter of 2021 was $230.2 million. Relative to distributions, DCF for the second quarter of 2021 of $207.5 million resulted in an approximately 1.4x distribution coverage ratio. Adjusted Free Cash Flow for the second quarter of 2021 was $162.6 million.

Operational Highlights

Throughput volumes increased 6% for gas gathering and 5% for gas processing in the second quarter of 2021 compared with the second quarter of 2020 driven by higher gas capture of Hess volumes. Throughput volumes decreased 21% for crude oil gathering and 19% for crude oil terminaling in the second quarter of 2021 compared with the second quarter of 2020 due to reduced drilling activity. The impact of the reduction in crude oil physical volumes in the second quarter of 2021 compared to the second quarter of 2020 was offset by higher tariff rates and shortfall fee payments related to minimum volume commitments. Water gathering volumes increased 12% compared with the year-ago quarter reflecting continued steady organic growth of our water handling business. Third parties comprised approximately 15% of crude oil gathering and 10% of gas gathering volumes for the second quarter of 2021.

Capital Expenditures

Capital expenditures for the second quarter of 2021 totaled $46.4 million, including $44.9 million of expansion capital expenditures and $1.5 million of maintenance capital expenditures, and were primarily attributable to continued expansion of our compression capacity. Capital expenditures in the prior-year quarter were $78.8 million, including $77.8 million of expansion capital expenditures and $1.0 million of maintenance capital expenditures, and were primarily attributable to construction and fabrication activities for the Tioga Gas Plant expansion.

Quarterly Cash Distributions

Our general partner’s board of directors declared a quarterly cash distribution of $0.5042 per Class A share for the second quarter of 2021. The distribution represents an approximate 11% increase compared to the distribution for the first quarter of 2021, consisting of a 10% announced increase in addition to a quarterly increase consistent with Hess Midstream’s targeted 5% growth in annual distribution per Class A share. The distribution is expected to be paid on August 13, 2021 to shareholders of record as of the close of business on August 9, 2021.

Unit Repurchase

As separately announced today, Hess Midstream Operations LP, Hess Midstream’s consolidated subsidiary, agreed to repurchase approximately 31 million Class B units of Hess Midstream Operations LP from Hess and GIP for an aggregate purchase price of $750 million, resulting in public ownership of Hess Midstream, on a consolidated basis, increasing to approximately 9.5%. The unit repurchase is expected to close in August 2021 and is expected to be funded through debt financing, maintaining targeted leverage of 3x debt / Adjusted EBITDA on a full-year 2021 basis.

Updated 2021 Guidance

Hess Midstream continues to target annual distribution per share growth of at least 5% through 2023 from the new higher distribution per share level with expected annual distribution coverage greater than 1.4x. In 2021 and 2022, Hess Midstream expects revenues that are 95% protected by minimum volume commitments. Hess Midstream is updating its full year 2021 guidance based primarily on strong year-to-date results as follows:


Year Ending


December 31, 2021


(Unaudited)

Financials (in millions)


Net income


$

590 - 610

Adjusted EBITDA


$

880 - 900

Distributable cash flow


$

765 - 785

Expansion capital expenditures


$

165

Maintenance capital expenditures


$

15

Adjusted free cash flow


$

600 - 620


Year Ending


December 31, 2021


(Unaudited)

Throughput volumes


Gas gathering - MMcf of natural gas per day


300 - 310

Crude oil gathering - MBbl of crude oil per day


110 – 120

Gas processing - MMcf of natural gas per day


285 - 295

Crude terminals - MBbl of crude oil per day


120 – 130

Water gathering - MBbl of liquids per day


70 - 80

Investor Webcast

Hess Midstream will review second quarter financial and operating results and other matters on a webcast today at 12:00 p.m. Eastern Time. The live audio webcast is accessible on the Investor page of our website www.hessmidstream.com. Conference call numbers for participation are 866-395-9624, or 213-660-0871 for international callers. The passcode number is 7419849. A replay of the conference call will be available at the same location following the event.

About Hess Midstream

Hess Midstream LP is a fee‑based, growth-oriented midstream company that operates, develops and acquires a diverse set of midstream assets to provide services to Hess and third‑party customers. Hess Midstream owns oil, gas and produced water handling assets that are primarily located in the Bakken and Three Forks Shale plays in the Williston Basin area of North Dakota. More information is available at www.hessmidstream.com.

Reconciliation of U.S. GAAP to Non‑GAAP Measures

In addition to our financial information presented in accordance with U.S. generally accepted accounting principles (“GAAP”), management utilizes certain additional non‑GAAP measures to facilitate comparisons of past performance and future periods. “Adjusted EBITDA” presented in this release is defined as reported net income (loss) before net interest expense, income tax expense, depreciation and amortization and our proportional share of depreciation of our equity affiliates, as further adjusted to eliminate the impact of certain items that we do not consider indicative of our ongoing operating performance, such as transaction costs, other income and other non‑cash, non‑recurring items, if applicable. “Distributable Cash Flow” or “DCF” is defined as Adjusted EBITDA less net interest, excluding amortization of deferred financing costs, cash paid for federal and state income taxes and maintenance capital expenditures. DCF does not reflect changes in working capital balances. We define “Adjusted Free Cash Flow” as DCF less expansion capital expenditures and ongoing contributions to equity investments. We believe that investors’ understanding of our performance is enhanced by disclosing these measures as they may assist in assessing our operating performance as compared to other publicly traded companies in the midstream energy industry, without regard to historical cost basis or, in the case of Adjusted EBITDA, financing methods, and assessing the ability of our assets to generate sufficient cash flow to make distributions to our shareholders. These measures are not, and should not be viewed as, a substitute for GAAP net income or cash flow from operating activities and should not be considered in isolation. Reconciliations of Adjusted EBITDA, DCF and Adjusted Free Cash Flow to reported net income (GAAP) and net cash provided by operating activities (GAAP), are provided below. Hess Midstream is unable to project net cash provided by operating activities with a reasonable degree of accuracy because this metric includes the impact of changes in operating assets and liabilities related to the timing of cash receipts and disbursements that may not relate to the period in which the operating activities occur. Therefore, Hess Midstream is unable to provide projected net cash provided by operating activities, or the related reconciliation of projected Adjusted Free Cash Flow to projected net cash provided by operating activities without unreasonable effort.


Second Quarter


(unaudited)


2021


2020


(in millions, except ratio and per-share data)


Reconciliation of Adjusted EBITDA and

Distributable Cash Flow to net income:


Net income


$

162.0


$

107.8


Plus:


Depreciation expense


40.4


38.9


Proportional share of equity affiliates' depreciation


1.3


1.2


Interest expense, net


22.9


23.3


Income tax expense (benefit)


3.6


1.7


Loss (gain) on sale of property, plant and equipment


-


(0.1

)

Adjusted EBITDA


230.2


172.8


Less:


Interest, net(1)


21.2


21.8


Maintenance capital expenditures


1.5


1.0


Distributable cash flow


$

207.5


$

150.0


Reconciliation of Adjusted EBITDA,

Distributable Cash Flow and Adjusted

Free Cash Flow to net cash provided

by operating activities:


Net cash provided by operating activities


$

224.6


$

177.4


Changes in assets and liabilities


(15.5

)


(24.4

)

Amortization of deferred financing costs


(1.7

)


(1.7

)

Proportional share of equity affiliates' depreciation


1.3


1.2


Interest expense, net


22.9


23.3


Earnings from equity investments


2.9


0.9


Distribution from equity investments


(4.0

)


(3.8

)

Other


(0.3

)


(0.1

)

Adjusted EBITDA


$

230.2


$

172.8


Less:


Interest, net(1)


21.2


21.8


Maintenance capital expenditures


1.5


1.0


Distributable cash flow


$

207.5


$

150.0


Less:


Expansion capital expenditures


44.9


77.8


Adjusted free cash flow(2)


$

162.6


$

72.2


Distributed cash flow


143.5


124.1


Distribution coverage ratio


1.4

x


1.2

x

Distribution per Class A share


$

0.5042


$

0.4363


(1) Excludes amortization of deferred financing costs.

(2) Adjusted Free Cash Flow as reported in this release reflects Hess Midstream’s definition of Adjusted Free Cash Flow, which is DCF less expansion capital expenditures and ongoing contributions to equity investments, adopted in the fourth quarter of 2020 to conform to definitions used by other publicly traded midstream energy companies. Prior period calculations of Adjusted Free Cash Flow have been recast to conform to the new presentation, as applicable.


Guidance


Year Ending


December 31, 2021


(Unaudited)


(in millions)


Reconciliation of Adjusted EBITDA, Distributable Cash Flow

and Adjusted Free Cash Flow to net income:


Net income

$

590 – 610


Plus:


Depreciation expense*


165


Interest expense, net


110


Income tax expense


15


Adjusted EBITDA

$

880 – 900


Less:


Interest, net, and maintenance capital expenditures


115


Distributable cash flow

$

765 – 785


Less:


Expansion capital expenditures


165


Adjusted free cash flow

$

600 – 620


*Includes proportional share of equity affiliates' depreciation


Cautionary Note Regarding Forward-looking Information

This press release contains “forward-looking statements” within the meaning of U.S. federal securities laws. Words such as “anticipate,” “estimate,” “expect,” “forecast,” “guidance,” “could,” “may,” “should,” “would,” “believe,” “intend,” “project,” “plan,” “predict,” “will,” “target” and similar expressions identify forward-looking statements, which are not historical in nature. Our forward-looking statements may include, without limitation: our future financial and operational results; our business strategy; our industry; our expected revenues; our future profitability; our maintenance or expansion projects; our projected budget and capital expenditures and the impact of such expenditures on our performance; the expected timing and completion of the Class B unit repurchase from Hess and GIP; and future economic and market conditions in the oil and gas industry.

Forward-looking statements are based on our current understanding, assessments, estimates and projections of relevant factors and reasonable assumptions about the future. Forward-looking statements are subject to certain known and unknown risks and uncertainties that could cause actual results to differ materially from our historical experience and our current projections or expectations of future results expressed or implied by these forward-looking statements. The following important factors could cause actual results to differ materially from those in our forward-looking statements: the direct and indirect effects of the COVID-19 global pandemic and other public health developments on our business and those of our business partners, suppliers and customers, including Hess; the ability of Hess and other parties to satisfy their obligations to us, including Hess’ ability to meet its drilling and development plans on a timely basis or at all and the operation of joint ventures that we may not control; our ability to generate sufficient cash flow to pay current and expected levels of distributions; reductions in the volumes of crude oil, natural gas, natural gas liquids (“NGLs”) and produced water we gather, process, terminal or store; fluctuations in the prices and demand for crude oil, natural gas and NGLs, including as a result of the COVID-19 global pandemic; changes in global economic conditions and the effects of a global economic downturn on our business and the business of our suppliers, customers, business partners and lenders; our ability to comply with government regulations or make capital expenditures required to maintain compliance, including our ability to obtain or maintain permits necessary for capital projects in a timely manner, if at all, or the revocation or modification of existing permits; our ability to successfully identify, evaluate and timely execute our capital projects, investment opportunities and growth strategies, whether through organic growth or acquisitions; our ability to satisfy the closing conditions of the Class B unit repurchase, including obtaining necessary debt financing; costs or liabilities associated with federal, state and local laws, regulations and governmental actions applicable to our business, including legislation and regulatory initiatives relating to environmental protection and safety, such as spills, releases, pipeline integrity and measures to limit greenhouse gas emissions; our ability to comply with the terms of our credit facility, indebtedness and other financing arrangements, which, if accelerated, we may not be able to repay; reduced demand for our midstream services, including the impact of weather or the availability of the competing third-party midstream gathering, processing and transportation operations; potential disruption or interruption of our business due to catastrophic events, such as accidents, severe weather events, labor disputes, information technology failures, constraints or disruptions and cyber-attacks; any limitations on our ability to access debt or capital markets on terms that we deem acceptable, including as a result of weakness in the oil and gas industry or negative outcomes within commodity and financial markets; liability resulting from litigation; and other factors described in Item 1A—Risk Factors in our Annual Report on Form 10-K and any additional risks described in our other filings with the Securities and Exchange Commission.

As and when made, we believe that our forward-looking statements are reasonable. However, given these risks and uncertainties, caution should be taken not to place undue reliance on any such forward-looking statements since such statements speak only as of the date when made and there can be no assurance that such forward-looking statements will occur and actual results may differ materially from those contained in any forward-looking statement we make. Except as required by law, we undertake no obligation to publicly update or revise any forward-looking statements, whether because of new information, future events or otherwise.


HESS MIDSTREAM LP

SUPPLEMENTAL FINANCIAL DATA (UNAUDITED)

(IN MILLIONS)


Second


Second


First


Quarter


Quarter


Quarter


2021


2020


2021


Statement of operations


Revenues


Affiliate services


$

294.8


$

269.8


$

288.8


Total revenues


294.8


269.8


288.8


Costs and expenses


Operating and maintenance expenses

(exclusive of depreciation shown separately below)


63.6


95.0


59.8


Depreciation expense


40.4


38.9


40.2


General and administrative expenses


5.2


4.1


6.3


Total costs and expenses


109.2


138.0


106.3


Income from operations


185.6


131.8


182.5


Income from equity investments


2.9


0.9


2.7


Interest expense, net


22.9


23.3


23.1


Gain from sale of property, plant and equipment


-


0.1


-


Income before income tax expense (benefit)


165.6


109.5


162.1


Income tax expense (benefit)


3.6


1.7


2.5


Net income


$

162.0


$

107.8


$

159.6


Less: Net income attributable to noncontrolling

interest


151.0


102.5


151.0


Net income attributable to Hess Midstream LP


$

11.0


$

5.3


$

8.6


Net income attributable to Hess Midstream LP

per Class A share:


Basic


$

0.44


$

0.29


$

0.45


Diluted


$

0.44


$

0.29


$

0.43


Weighted average Class A shares outstanding


Basic


25.0


18.0


19.3


Diluted


25.1


18.1


19.4


HESS MIDSTREAM LP

SUPPLEMENTAL FINANCIAL DATA (UNAUDITED)

(IN MILLIONS)


Six Months Ended June 30,


2021


2020


Statement of operations


Revenues


Affiliate services


$

583.6


$

560.4


Other income


-


0.2


Total revenues


583.6


560.6


Costs and expenses


Operating and maintenance expenses

(exclusive of depreciation shown separately below)


123.4


186.9


Depreciation expense


80.6


77.4


General and administrative expenses


11.5


11.7


Total costs and expenses


215.5


276.0


Income from operations


368.1


284.6


Income from equity investments


5.6


3.6


Interest expense, net


46.0


48.1


Gain on sale of property, plant and equipment


-


0.1


Income before income tax expense (benefit)


327.7


240.2


Income tax expense (benefit)


6.1


3.4


Net income


$

321.6


$

236.8


Less: Net income attributable to noncontrolling interest


302.0


225.0


Net income attributable to Hess Midstream LP


$

19.6


$

11.8


Net income attributable to Hess Midstream LP

per Class A share:


Basic:


$

0.89


$

0.66


Diluted:


$

0.87


$

0.64


Weighted average Class A shares outstanding:


Basic


22.2


18.0


Diluted


22.3


18.1


HESS MIDSTREAM LP

SUPPLEMENTAL FINANCIAL DATA (UNAUDITED)

(IN MILLIONS)


Second Quarter 2021


Gathering


Processing
and
Storage


Terminaling
and Export


Interest
and Other


Total


Statement of operations


Revenues


Affiliate services


$

154.6


$

105.3


$

34.9


$

-


$

294.8


Total revenues


154.6


105.3


34.9


-


294.8


Costs and expenses


Operating and maintenance expenses (exclusive of

depreciation shown separately below)


34.8


24.2


4.6


-


63.6


Depreciation expense


25.2


11.2


4.0


-


40.4


General and administrative expenses


2.2


1.2


0.2


1.6


5.2


Total costs and expenses


62.2


36.6


8.8


1.6


109.2


Income (loss) from operations


92.4


68.7


26.1


(1.6

)


185.6


Income from equity investments


-


2.9


-


-


2.9


Interest expense, net


-


-


-


22.9


22.9


Income before income tax expense (benefit)


92.4


71.6


26.1


(24.5

)


165.6


Income tax expense (benefit)


-


-


-


3.6


3.6


Net income (loss)


92.4


71.6


26.1


(28.1

)


162.0


Less: Net income (loss) attributable to

noncontrolling interest


84.3


65.3


23.7


(22.3

)


151.0


Net income (loss) attributable to

Hess Midstream LP


$

8.1


$

6.3


$

2.4


$

(5.8

)


$

11.0


Contacts

For Hess Midstream LP
Investor:
Jennifer Gordon
(212) 536-8244

Media:
Robert Young
(713) 496-6076


Read full story here
Offshore Source Logo

Offshore Source keeps you updated with relevant information concerning the Offshore Energy Sector.

Any views or opinions represented on this website belong solely to the author and do not represent those of the people, institutions or organizations that Offshore Source or collaborators may or may not have been associated with in a professional or personal capacity, unless explicitly stated.

Corporate Offices

Technology Systems Corporation
8502 SW Kansas Ave
Stuart, FL 34997

info@tscpublishing.com