Business Wire News

ABERDEEN, Scotland--(BUSINESS WIRE)--Highlights

For the three months ended June 30, 2020, KNOT Offshore Partners LP (“KNOT Offshore Partners” or the “Partnership”):

  • Generated total revenues of $70.3 million, operating income of $33.4 million and net income of $21.7 million.
  • Generated Adjusted EBITDA of $55.8 million (1)
  • Generated distributable cash flow of $30.7 million (1)
  • Reported a distribution coverage ratio of 1.70 (2)
  • Fleet operated with 99.7% utilization for scheduled operations.

Other events:

  • On April 20, 2020, Eni exercised two of its one-year options to extend the time charter of the Torill Knutsen until November 2022. In connection with the early exercise by Eni of its options, the Partnership granted Eni a further option to extend the time charter by one additional one-year period. Eni now has the option to extend the time charter by two one-year periods until November 2024.
  • The charterer of the Windsor Knutsen, a subsidiary of Royal Dutch Shell (“Shell”), did not notify the Partnership by the due date of its intention to exercise its option to extend the time charter for the vessel. The charter will therefore expire in or around October 2020, the precise date to be fixed in accordance with the redelivery window as specified in the charter. As a result, the Partnership is currently exploring other options to recharter the vessel with a number of potential charterers, including a subsidiary of Knutsen NYK Offshore Tankers AS, the owner of the Partnership’s general partner (“Knutsen NYK”) for a potential charter term of six months, with an option for Knutsen NYK to extend for an additional six months.
  • On August 13, 2020, the Partnership paid a quarterly cash distribution of $0.52 per common unit with respect to the quarter ended June 30, 2020 to all common unitholders of record on July 30, 2020. On August 13, 2020, the Partnership paid a cash distribution to holders of Series A Preferred Units with respect to the quarter ended June 30, 2020 in an aggregate amount equal to $1.8 million.

Financial Results Overview

Total revenues were $70.3 million for the three months ended June 30, 2020 (the “second quarter”) compared to $67.8 million for the three months ended March 31, 2020 (the “first quarter”). The increase was mainly related to receipt of full earnings from the Raquel Knutsen in the second quarter compared to reduced earnings in the first quarter as a result of 64 offhire days for the vessel to finish its scheduled first special survey drydocking.

Vessel operating expenses for the second quarter of 2020 were $13.1 million, a decrease of $2.5 million from $15.6 million in the first quarter of 2020. The decrease was mainly due to lower operating cost on average for the fleet due to the strengthening of the U.S Dollar against the Norwegian Kroner (NOK) and decreased expenses for bunkers consumption, which were higher in the first quarter as a result of the drydocking of the Raquel Knutsen.

General and administrative expenses were $1.3 million for the second quarter compared to $1.4 million for the first quarter.

(1) EBITDA, Adjusted EBITDA and distributable cash flow are non-GAAP financial measures used by management and external users of the Partnership’s financial statements. Please see Appendix A for definitions of EBITDA, Adjusted EBITDA and distributable cash flow and a reconciliation to net income, the most directly comparable GAAP financial measure.

(2) Distribution coverage ratio is equal to distributable cash flow divided by distributions declared for the period presented.

Depreciation was $22.5 million for the second quarter, an increase of $0.1 from $22.4 million in the first quarter. The increase is mainly due to increased drydock depreciation for the Raquel Knutsen after the drydocking in the first quarter.

As a result, operating income for the second quarter was $33.4 million compared to $28.4 million in the first quarter.

Interest expense for the second quarter was $8.5 million, a decrease of $2.0 million from $10.5 million for the first quarter. The decrease was mainly due to lower LIBOR on average for all credit facilities.

Realized and unrealized loss on derivative instruments was $3.1 million in the second quarter, compared to $23.7 million in the first quarter. The unrealized non-cash element of the mark-to-market loss was $2.8 million for the second quarter of 2020 compared to $23.9 million for the first quarter of 2020. Of the unrealized loss for the second quarter of 2020, $3.5 million is related to a mark-to-market loss on interest rate swaps due to a decrease in the US swap rate and a gain of $0.7 million is related to foreign exchange contracts.

As a result, net income for the second quarter of 2020 was $21.7 million compared to a net loss of $6.1 million for the first quarter of 2020.

Net income for the second quarter of 2020 increased by $13.5 million to $21.7 million from net income of $8.2 million for the three months ended June 30, 2019. Operating income for the second quarter of 2020 increased by $1.4 million to $33.4 million compared to operating income of $31.9 million in the second quarter of 2019, mainly due to lower operating cost on average for the fleet. Total finance expense for the second quarter of 2020 decreased by $12.0 million to $11.7 million compared to finance expense of $23.7 million for the second quarter of 2019. The decrease was mainly due to lower unrealized losses on derivative instruments and lower average interest costs, mainly due to a decrease in the US LIBOR rate.

Distributable cash flow was $30.7 million for the second quarter of 2020 compared to $23.9 million for the first quarter of 2020. The increase in distributable cash flow is mainly due to full earnings from the Raquel Knutsen due to its scheduled drydocking which was finished in the first quarter and lower average operating cost for the fleet. The distribution declared for the second quarter of 2020 was $0.52 per common unit, equivalent to an annualized distribution of $2.08.

COVID-19

The outbreak of the coronavirus (“COVID-19”) has negatively affected global economic activity, including the demand for oil and oil shipping, which may materially impact the Partnership’s operations and the operations of its customers and suppliers.

Although the Partnership's operations have not been materially affected by the COVID-19 outbreak to date, the ultimate length and severity of the COVID-19 outbreak and its potential impact on the Partnership's business, financial condition and results of operations is uncertain at this time. The virus outbreak has increased uncertainty in a number of areas of the Partnership’s business, including operational, commercial and financial activities.

The Partnership’s focus continues to be on ensuring the health and safety of employees while providing safe and reliable operations for customers. All crew on board and staff onshore are taking precautions with respect to social distancing, personal hygiene and other measures and following all local guidelines and regulations to minimize the spread of the virus. To date, the Partnership has not had any material service interruptions on its vessels as a result of COVID-19 and none of its vessels are planned to drydock in 2020.

Due to international travel restrictions, there have been challenges in respect of crew changes and maintenance support; however the Partnership has been able to carry out crew changes in both Europe and Brazil, crew changes continue to occur with regularity and maintenance has continued to be performed, or in some cases postponed, where it is safe and possible to do so. The majority of such difficulties are a result of either local lockdowns or transportation or logistical restrictions. The Partnership expects that it will incur somewhat higher crewing expenses to ensure appropriate mitigation actions are in place to minimize risks of outbreaks. The closure of, or restricted access to, ports and terminals in regions affected by the virus may lead to further operational impacts that result in higher costs. It is possible that an outbreak onboard a vessel could prevent the Partnership from meeting its obligations under a charter, resulting in an off-hire claim and loss of revenue. Any outbreak of COVID-19 on board one of the Partnership's vessels or that affects any of the Partnership’s main suppliers could cause an inability to replace critical supplies or parts, maintain adequate crewing or fulfill the Partnership's obligations under its time charter contracts which in turn could result in off-hire or claims for the impacted period.

COVID-19 has placed downward pressure on economic activity and energy demand during the first and second quarters of 2020, and there remains significant uncertainty regarding near-term future oil demand and, therefore, shipping requirements. The fall in oil prices since the end of 2019 has caused many oil exploration and production companies, including certain of our customers, to cut their production forecasts for 2020 and beyond and / or reduce or delay planned future capital expenditures, particularly on new projects. This could have an impact on the demand for shuttle tankers in the short and medium term and, given the uncertainty around the continuation of the COVID-19 situation, this dampening of demand could persist in the long term. Such developments could affect the number of new offshore projects and the overall outlook for oil production, which could eventually and in turn impact the demand and pricing for shuttle tankers. Furthermore, the Partnership may be unable to re-charter its vessels at attractive rates in the future, particularly for vessels that are coming off charter in the next two years.

Although the Partnership is exposed to the uncertainty of cash flows from its time charter contracts arising from the credit risk associated with the individual charterers, the Partnership believes that its charter contracts, all with subsidiaries of national oil companies and oil majors, largely insulates the Partnership from this risk in most scenarios. Notwithstanding, any extended period of non-payment or idle time between charters could adversely affect the Partnership’s future liquidity, results of operations and cash flows. The Partnership has not so far experienced any reduced or non-payments for obligations under the Partnership's time charter contracts and the Partnership has not provided concessions or made changes to the terms of payment for customers.

COVID-19 has had a sustained impact on global capital and bank credit markets, affecting access, timing and cost of capital. The responses of governments around the world to manage the impact of the virus have led to lower interest rates and volatility in the prices of equities, bonds, commodities and their respective derivatives. The Partnership’s common unit price has declined significantly this year, mainly due to the impact of COVID-19 on the wider economy and sentiment in the energy and shipping sectors. In these current market conditions with lower unit prices, issuing new common equity is a less viable and more expensive option for accessing liquidity. The Partnership does not have long term debt maturing before August 2021. Should the Partnership be unable to obtain refinancing for this debt or other debt in the future, it may not have sufficient funds or other assets to satisfy all of its obligations, which would have a material adverse effect on its business, results of operations and financial condition.

Operational Review

The Partnership’s vessels operated throughout the second quarter of 2020 with 99.7% utilization for scheduled operations.

On April 20, 2020, Eni exercised two of its one-year options to extend the time charter of the Torill Knutsen until November 2022. In connection with the early exercise by Eni of its options, the Partnership granted Eni a further option to extend the time charter by one additional one-year period. Eni now has the option to extend the time charter by two one-year periods until November 2024.

The charterer of the Windsor Knutsen, a subsidiary of Shell, did not notify the Partnership by the due date of its intention to exercise its option to extend the time charter for the vessel. The charter will therefore expire in or around October 2020, the precise date to be fixed in accordance with the redelivery window as specified in the charter. As a result, the Partnership is currently exploring other options to recharter the vessel with a number of potential charterers, including a subsidiary of Knutsen NYK for a potential charter term of six months, with an option for Knutsen NYK to extend for an additional six months.

Financing and Liquidity

As of June 30, 2020, the Partnership had $70.1 million in available liquidity, which consisted of cash and cash equivalents of $41.4 million and $28.7 million of capacity under its revolving credit facilities. The revolving credit facilities mature in August 2021 and September 2023. The Partnership’s total interest-bearing debt outstanding as of June 30, 2020 was $959.8 million ($953.7 million net of debt issuance cost). The average margin paid on the Partnership’s outstanding debt during the second quarter of 2020 was approximately 2.1% over LIBOR.

As of June 30, 2020, the Partnership had entered into various interest rate swap agreements for a total notional amount of $627.1 million to hedge against the interest rate risks of its variable rate borrowings. As of June 30, 2020, the Partnership receives interest based on three or six-month LIBOR and pays a weighted average interest rate of 1.74% under its interest rate swap agreements, which have an average maturity of approximately 3.6 years. The Partnership does not apply hedge accounting for derivative instruments, and its financial results are impacted by changes in the market value of such financial instruments.

As of June 30, 2020, the Partnership’s net exposure to floating interest rate fluctuations on its outstanding debt was approximately $291.3 million based on total interest-bearing debt outstanding of $959.8 million, less interest rate swaps of $627.1 million and less cash and cash equivalents of $41.4 million. The Partnership’s outstanding interest-bearing debt of $959.8 million as of June 30, 2020 is repayable as follows:

(U.S. Dollars in thousands)

Period repayment

Balloon repayment

Remaining 2020

$

42,973


$ —

2021

86,546

95,811

2022


71,210


236,509

2023

55,535

202,185

2024


13,873


123,393

2025 and thereafter

1,307

30,500

Total

$

271,444


$

688,398

Distributions

On August 13, 2020, the Partnership paid a quarterly cash distribution of $0.52 per common unit with respect to the quarter ended June 30, 2020 to all common unitholders of record on July 30, 2020. On August 13, 2020, the Partnership paid a cash distribution to holders of Series A Preferred Units with respect to the quarter ended June 30, 2020 in an aggregate amount equal to $1.8 million.

Outlook

There are no dry dockings scheduled for any of the Partnership’s vessels during the remainder of 2020.

As of June 30, 2020, the Partnership’s fleet of sixteen vessels had charters with an average remaining fixed duration of 2.4 years. In addition, the charterers of the Partnership’s time charter vessels have options to extend their charters by an additional 3.9 years on average.

During the second quarter, Knutsen NYK entered into two new long-term time charters for newbuildings to be constructed by the Cosco (Zhoushan) Shipyard. The first is a 5-year fixed time charter with Galp Sinopec Brazil Services B.V., which may be extended by the charterer for up to two three-year periods. The vessel will operate in Brazil and delivery is scheduled for March 2021. The second is a 5-year fixed time charter with Petro China International (America) Inc., a subsidiary of PetroChina Company Limited, which may be extended by the charterer for up to five one-year periods. The vessel will operate in Brazil and delivery is scheduled for June 2022.

Knutsen NYK has five additional newbuilding shuttle tankers under construction, all of which are under contract for long-term charter. Two of these vessels will be chartered to Equinor, with deliveries scheduled from the shipyard in September 2020 and November 2020. The vessels are expected to operate in Brazil under time charters with a fixed term of 7 and 5 years with options to extend for up to 20 years.

Pursuant to the omnibus agreement the Partnership entered into with Knutsen NYK at the time of its initial public offering, the Partnership has the option to acquire from Knutsen NYK any offshore shuttle tankers that Knutsen NYK acquires or owns that are employed under charters for periods of five or more years.

There can be no assurance that the Partnership will acquire any additional vessels from Knutsen NYK.

The Board believes that demand for existing and for newbuild shuttle tankers will continue to be driven over the long term based on the requirement to replace older tonnage in the North Sea and Brazil and by further expansion into deep water offshore oil production areas such as in Pre-salt Brazil and the Barents Sea.

Although the Partnership’s operations have not yet been materially impacted by the outbreak of COVID-19 or the recent decline in oil prices, the length and severity of the COVID-19 outbreak and the persistence of a low oil price environment still cannot be estimated at this time. Such developments could affect the number of new offshore projects and the overall outlook for the production of oil, which could eventually and in turn impact the demand and pricing for shuttle tankers.

The Partnership acknowledges the announcements made by its charterers and the oil industry with respect to near-term capital expenditure cuts that are expected to cause certain new developments in Brazil and the North Sea to be delayed. However the Partnership remains positive with respect to the mid to long term outlook for the growth in demand for shuttle tankers and this view is supported by the significant developments that continue to be announced in Brazil, in particular, and the foreseeable delivery pipeline of floating, production, storage and offloading (FPSO) units.

About KNOT Offshore Partners LP

KNOT Offshore Partners owns operates and acquires shuttle tankers under long-term charters in the offshore oil production regions of the North Sea and Brazil. KNOT Offshore Partners owns and operates a fleet of sixteen offshore shuttle tankers with an average age of 7.0 years.

KNOT Offshore Partners is structured as a publicly traded master limited partnership. KNOT Offshore Partners’ common units trade on the New York Stock Exchange under the symbol “KNOP.”

The Partnership plans to host a conference call on Thursday, August 27, 2020 at 11 AM (Eastern Time) to discuss the results for the second quarter of 2020, and invites all unitholders and interested parties to listen to the live conference call by choosing from the following options:

  • By dialing 1-855-209-8259 from the US, dialing 1-855-669-9657 from Canada or 1-412-542-4105 if outside North America (please ask to be joined into the KNOT Offshore Partners LP call).
  • By accessing the webcast, which will be available for the next seven days on the Partnership’s website: www.knotoffshorepartners.com.

August 26, 2020

KNOT Offshore Partners L.P.

Aberdeen, United Kingdom

UNAUDITED CONDENSED CONSOLIDATED STATEMENTS OF OPERATIONS


Three Months Ended

Six Months Ended

(U.S. Dollars in thousands)


June 30, 2020


March 31, 2020


June 30, 2019

June 30, 2020

June 30, 2019

Time charter and bareboat revenues


$

70,250

$

67,226

$

70,908

$

137,476

$

141,456

Other income (1)

9


598


14

607

15

Total revenues


70,259


67,824


70,922


138,083


141,471

Vessel operating expenses

13,112

15,634

15,301

28,746

29,757

Depreciation


22,451


22,373


22,429


44,824


44,860

General and administrative expenses

1,337

1,387

1,264

2,724

2,561

Total operating expenses


36,900


39,394


38,994


76,294


77,178

Operating income


33,359


28,430

31,928

61,789


64,293

Finance income (expense):


Interest income

3

118

233

121

471

Interest expense


(8,512)


(10,462)


(13,186)


(18,974)


(26,844)

Other finance expense

(199)

(108)

(286)

(307)

(404)

Realized and unrealized gain (loss) on derivative instruments (2)


(3,092)


(23,690)


(10,318)


(26,782)


(16,247)

Net gain (loss) on foreign currency transactions

127

(424)

(192)

(297)

(218)

Total finance expense


(11,673)


(34,566)


(23,749)


(46,239)


(43,242)

Income (loss) before income taxes

21,686

(6,136)

8,179

15,550

21,051

Income tax benefit (expense)


(3)


(3)


(3)


(6)


(6)

Net income (loss)


21,683


(6,139)


8,176

15,544


21,045

Weighted average units outstanding (in thousands of units):


Common units

32,694

32,694

32,694

32,694

32,694

General Partner units


615


615


615


615


615

(1) Other income for the first quarter of 2020 is mainly related to cargo carried from Brazil to Europe on the drydocking voyage for the Raquel Knutsen scheduled drydocking. As a result the Partnership received $0.6 million for this extra voyage and the additional revenue has been classified as other income.

(2) Realized gains (losses) on derivative instruments relate to amounts the Partnership actually received (paid) to settle derivative instruments, and the unrealized gains (losses) on derivative instruments related to changes in the fair value of such derivative instruments, as detailed in the table below:

Three Months Ended

Six Months Ended

(U.S. Dollars in thousands)

June 30,

2020

March 31,

2020

June 30,

2019

June 30,

2020

June 30,

2019

Realized gain (loss):


Interest rate swap contracts

$

(191)

$

203

$

1,168

$

12

$

2,246

Foreign exchange forward contracts


(109)


(658)


(109)


(1,446)

Total realized gain (loss):


(300)


203


510

(97)


800

Unrealized gain (loss):


Interest rate swap contracts

(3,457)

(22,982)

(11,521)

(26,438)

(18,619)

Foreign exchange forward contracts


665


(911)


693


(247)


1,572

Total unrealized gain (loss):


(2,792)


(23,893)


(10,828)

(26,685)


(17,047)

Total realized and unrealized gain (loss) on derivative instruments:


$

(3,092)


$

(23,690)


$

(10,318)


$

(26,782)


$

(16,247)

UNAUDITED CONDENSED CONSOLIDATED BALANCE SHEET

(U.S. Dollars in thousands)

At June 30, 2020

At December 31, 2019

ASSETS


Current assets:


Cash and cash equivalents


$

41,436


$

43,525

Amounts due from related parties


1,728

2,687

Inventories


2,242


2,292

Derivative assets

39

920

Other current assets


4,072


3,386

Total current assets


49,517


52,810


Long-term assets:


Vessels, net of accumulated depreciation


1,635,546


1,677,488

Right-of-use assets

1,516

1,799

Intangible assets, net


983


1,286

Derivative assets


648

Accrued income


3,424


3,976

Total Long-term assets


1,641,469


1,685,197

Total assets


$

1,690,986


$

1,738,007


LIABILITIES AND EQUITY


Current liabilities:


Trade accounts payable


$

2,496


$

2,730

Accrued expenses


4,755


6,617

Current portion of long-term debt


83,523


83,453

Current lease liabilities

585

572

Current portion of derivative liabilities


7,211


910

Income taxes payable


18

98

Current portion of contract liabilities


1,518


1,518

Prepaid charter


3,776

6,892

Amount due to related parties


1,250


1,212

Total current liabilities


105,132


104,002


Long-term liabilities:


Long-term debt


870,150


911,943

Lease liabilities

931

1,227

Derivative liabilities


23,987


5,133

Contract liabilities


2,927

3,685

Deferred tax liabilities


323


357

Total long-term liabilities


898,318


922,345

Total liabilities


1,003,450


1,026,347

Commitments and contingencies


Series A Convertible Preferred Units


89,264


89,264

Equity:


Partners’ capital:


Common unitholders


587,562

611,241

General partner interest


10,710


11,155

Total partners’ capital


598,272


622,396

Total liabilities and equity


$

1,690,986


$

1,738,007


Contacts

Questions should be directed to:
Gary Chapman
+44 7496 170 620


Read full story here

Largest Non-Profit Natural Gas Joint-Action Agency in the U.S. adopts Field Service Management to support an Automated Digital Market Experience to Better Serve and Engage with Customers.

SUNNYVALE, Calif.--(BUSINESS WIRE)--The Municipal Gas Authority of Georgia (Gas Authority) has selected KloudGin, the leading provider of AI cloud-based field service and asset management solutions, to deliver an automated digital market experience that creates new revenue opportunities for members and expands services to better serve and engage with customers.


Serving 80 members in five states totaling 246,000 customers, the Gas Authority’s new business unit, Natural Gas Connection (NGC), built an integrated online platform to make it easier for consumers to purchase natural gas appliances for their homes, as well as acquire related services.

NGC selected KloudGin to design a logistical framework to manage their highly automated e-commerce retail appliance business to make the consumer purchasing process seamless. By offering a one-stop shopping experience with a fully integrated and automated customer-facing webstore.

KloudGin solution and integration with other software running in the background, customers can check on appliance inventory availability, obtain financing and manage logistics with third-party installers all in one place. NGC has a pool of contractors that it uses for installations. Once customers place an order for appliances, KloudGin pushes a notification offer to the appropriate contractor to accept the service activity. The notified contractor has 24 hours to respond. Upon acceptance, KloudGin confirms the service activity based on the expected appliance availability pickup date. KloudGin then notifies Shopify of the install date, cost, and contact info for the installer.

NGC also uses the KloudGin Mobile App for their contractors to manage the installation process. The app provides the contractor with all the details of the work order and allows him or her to take pictures, access documents, take notes and get customer signatures electronically.

“Our objective was to help our members build their retail business by retaining and adding customers and volume. What could have been a logistical nightmare evolved into a partnership with KloudGin helping us bring our vision to life,” said Chris Howell, Director of Finance at the Gas Authority. Mike Mihalick, Manager of Business Development at the Gas Authority added, “Working with KloudGin we created a solution that helps improve quality of life for our members’ customers by providing access to natural gas which is more efficient, cost effective and environmentally friendly.”

According to Tara LeCroy, Manager of Information Technology at the Gas Authority, “KloudGin has brought in a modern cloud and mobile based platform that was seamlessly integrated into our existing infrastructure and the team worked with us to develop a full end-to-end solution that we needed to effectively engage and retain our customers.”

“We worked with NGC to improve the customer experience, create alternate revenue streams, and help them retain and grow their customer base for gas usage,” said Vikram Takru, co-founder and CEO of KloudGin. “Our platform will help members respond to a dynamically shifting environment and provide high quality products and digital services that will enhance customer loyalty and manage retention.”

For more information on the case study, click here.

For more information MGAG webstore: https://naturalgasconnection.com/

About The Municipal Gas Authority of Georgia

The Municipal Gas Authority of Georgia is the largest non-profit natural gas joint action agency in the United States, serving 80 members in Georgia, Alabama, Pennsylvania, Tennessee, and Florida that meet the gas needs of more than 246,000 customers. The Gas Authority is committed to helping its members provide safe, clean, reliable, low cost natural gas service to their customers and communities.

About KloudGin

KloudGin is the only combined one-cloud industry-focused field service and asset management solution that automates work management processes, enables customer self-service, increases worker productivity, unlocking new revenue streams and business models. Serving companies with complex, asset management and field service requirements, KloudGin connects customers, employees, sub-contractors and assets with AI-powered access to information on any device. Visit www.kloudgin.com.


Contacts

Joe Volat
This email address is being protected from spambots. You need JavaScript enabled to view it.
877-256-8303

Company will use funding to build on its successful software platform and meet customer demand


BOSTON--(BUSINESS WIRE)--#renewables--Raptor Maps, a solar software company, announced that it has raised a $5 million Series A, co-led by Blue Bear Capital, Data Point Capital, and Buoyant Ventures. Other participants include notable clean energy investors Congruent Ventures, Powerhouse Ventures, and the Massachusetts Clean Energy Center, along with Y Combinator.

Raptor Maps solves major growing pains for solar project finance, development, and asset management across an industry experiencing a 49% annual growth rate over the past decade. The current approach to developing and operating solar farms is increasingly untenable, resulting in demand for software and standardization of required processes and documentation.

“Our mission is to build software that enables the solar industry to scale,” explains Raptor Maps co-founder and CEO Nikhil Vadhavkar. “We are on track to be the system of record, and we already serve as the source of truth that our customers rely on for collaborative decision-making. The diversity of our investor base, including those that have experienced these pains firsthand, underscores that we cannot afford to take a reactive approach in the climate fight.”

To date, Raptor Maps has improved the project finance and asset management of over 25 GW in 35 countries. Its diverse and growing customer base includes global utility Enel Green Power, asset owner Greenbacker Renewable Energy, construction company McCarthy Building Companies, operations and maintenance (O&M) providers QE Solar and SOLV, and several publicly traded solar panel manufacturers.

“People think of solar as being just panels and wires,” says Ernst Sack of Blue Bear Capital, an investor specialized in energy, infrastructure, and climate solutions. “The industry has evolved to rely on a tremendously rich and complicated supply chain, with dozens of operations and hundreds of counterparties involved in any given plant—just as one would expect for other energy and infrastructure asset of this scale. Raptor Maps is building the digital operating system to coordinate and manage all of this activity for maximum productivity, efficiency, and safety.”

Raptor Maps attests that its deliverables are ten-fold more accurate, human and machine readable, and lower cost than traditional methods. The company has built a strong reputation for its software and aerial intelligence, and it will deploy this investment to build additional capabilities into its state-of-the-art solar data model.

“Raptor Maps is leading the charge to digitize the solar industry, resulting in both immediate and long-term benefit,” explains Daniel Hullah of Buoyant Ventures, a fund that invests in early stage, digital solutions that address climate risk. “The company makes solar power more valuable and accelerates the transition to clean energy.”

Several of Raptor Maps’ customers, such as Madison Energy Investments, require solar construction companies to use Raptor Maps at commissioning, and the O&M teams to use Raptor Maps annually. Other customers, such as solar panel manufacturers, direct asset owners to use Raptor Maps to create documentation for warranty claims.

“We’re thrilled to be investing behind the Raptor Maps founders and team,” says Mike Majors, Managing Partner at Data Point Capital. “Their deep experience in building cutting-edge software has positioned the company as the leader in the multi-billion dollar solar lifecycle management space.”


Contacts

Nikhil Vadhavkar
Raptor Maps, Inc.
This email address is being protected from spambots. You need JavaScript enabled to view it.

TULSA, Okla.--(BUSINESS WIRE)--Williams (NYSE: WMB) announced today its climate commitment, setting a near-term goal of 56% absolute reduction from 2005 levels in company-wide greenhouse gas (GHG) emissions by 2030, putting the company on a positive trajectory to be net zero carbon emissions by 2050. By setting a near-term goal for 2030, the company plans to leverage its natural gas-focused strategy and technology that is available today to focus on immediate opportunities to reduce emissions, scale renewables and build a clean energy economy – while looking forward and anticipating future innovations and technologies.


“As one of the largest energy infrastructure companies in the U.S., we see firsthand the important role natural gas plays today in a viable and sustainable low-carbon future, and we know that natural gas is critical to addressing climate change. It creates a practical and affordable solution for immediately reducing emissions both here and around the world. It also is key to maintaining reliability and enabling scaled use of renewable energy,” said Alan Armstrong, president and chief executive officer at Williams. “With our climate commitment encompassing both near- and long-term targets, we hope to challenge others to establish similar goals based on what we can reduce right here, right now – while also supporting the development of emerging technologies that will ultimately contribute to our aspiration to be net zero by 2050.”

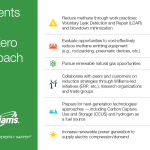
To reach its 2030 target, Williams is pursuing common sense methane emissions reduction opportunities through leak detection and repair, work practice improvements, and evaluating equipment upgrades on a site-specific basis. This near-term phase also includes collaborating with peers and customers to uncover and implement innovative emissions reduction strategies through Williams-led initiatives, research organizations and trade groups. In addition, Williams will continue to support Colorado State University’s Methane Emissions Technology Evaluation Center and fund methane emissions reduction projects at Pipeline Research Council International.

Other near-term efforts will focus on exploring renewable energy opportunities, including renewable natural gas (RNG) and solar energy. Currently, Williams delivers RNG by partnering with energy companies in Washington, Idaho, Ohio, and Texas to transport methane emissions captured from landfills or dairy farms where the methane is a byproduct of the waste decomposition process. Methane produced from the waste is a renewable fuel because it is captured as biogas rather than being released directly into the atmosphere. Williams’ Northwest Pipeline is interconnected with four RNG facilities, of which two were brought online in the past seven months, and looking ahead, the company plans to aggressively pursue additional RNG partnership opportunities.

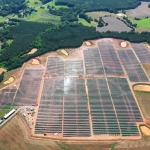
These efforts are in addition to the company’s previously announced $400 million solar initiative across nine states spanning Williams’ footprint. Williams is identifying locations where solar power installations are both economically viable and can be located on company-owned land that is adjacent to existing facilities. Initial sites identified are in Alabama, Colorado, Georgia, Louisiana, New Jersey, North Carolina, Ohio, Pennsylvania, and Virginia. These facilities are expected to be placed into service beginning late 2021.

Williams’ long-term path to net zero by 2050 includes preparing for future breakthrough technologies in carbon capture, synthetic gas and hydrogen as a fuel source.

“We are proud to lead the midstream space in meeting the growing demand for American-made energy while outlining clear steps toward a clean energy future,” said Armstrong. “We believe we can successfully sustain and evolve our natural gas-focused business as the world moves to a low-carbon future, while also helping our customers and stakeholders meet their climate goals.”

This vision for a viable and sustainable low-carbon future is supported by the active role low-cost natural gas plays in the clean energy mix, particularly when it comes to displacing higher-emission fuels such as coal and heating oil. Natural gas generates up to 60% fewer GHG emissions than coal and is a reliable fuel source, making it the ideal partner for intermittent renewable energy sources like wind and solar power.

The company will provide updates on its progress toward these goals in its annual Sustainability Report. To read the recently published 2019 Sustainability Report, visit www.williams.com.

To learn more about Williams’ climate commitment visit www.williams.com/climate-commitment.

About Williams

Williams (NYSE: WMB) is committed to being the leader in providing infrastructure that safely delivers natural gas products to reliably fuel the clean energy economy. Headquartered in Tulsa, Oklahoma, Williams is an industry-leading, investment grade C-Corp with operations across the natural gas value chain including gathering, processing, interstate transportation and storage of natural gas and natural gas liquids. With major positions in top U.S. supply basins, Williams connects the best supplies with the growing demand for clean energy. Williams owns and operates more than 30,000 miles of pipelines system wide – including Transco, the nation’s largest volume and fastest growing pipeline – and handles approximately 30 percent of the natural gas in the United States that is used every day for clean-power generation, heating and industrial use. www.williams.com

Portions of this document may constitute “forward-looking statements” as defined by federal law. Although the company believes any such statements are based on reasonable assumptions, there is no assurance that actual outcomes will not be materially different. Any such statements are made in reliance on the “safe harbor” protections provided under the Private Securities Reform Act of 1995. Additional information about issues that could lead to material changes in performance is contained in the company’s annual and quarterly reports filed with the Securities and Exchange Commission.


Contacts

MEDIA:
This email address is being protected from spambots. You need JavaScript enabled to view it.
(800) 945-8723

INVESTOR CONTACTS:
Brett Krieg
(918) 573-4614

Grace Scott
(918) 573-1092


National EPC energy firm, majority owned by funds managed by Ares Management Corporation, achieved significant milestone in August 2020

EDISON, N.J.--(BUSINESS WIRE)--CS Energy, LLC, a leading integrated energy firm that designs and builds optimized projects in the solar, storage and emerging energy industries, announced today that it has reached a major milestone: completing the installation of 1 gigawatt of solar energy projects.


The 1 GW achievement puts CS Energy in a distinguished category. According to Solar Power World’s Top Solar Contractors* rankings, fewer than 10 EPCs have installed 1 GW of solar as of 2020, but with CS Energy’s consistent 20 percent annual growth rate, the milestone was reached quickly. The company closed 2018 with 650 MW of completed solar projects and ended 2019 with 820 MW. In 2020, CS Energy reached 1,000 MW, despite industry contractions resulting from the COVID-19 pandemic.

“This is an incredible milestone, and one only possible because of the hard work and dedication of our team,” shared Matthew Skidmore, CEO of CS Energy. “I am so proud of our talented workforce, which has completed CS Energy projects to the highest standards of quality and safety across the country. We’re excited to put our deep experience to work for our clients as we begin installing the next gigawatt.”

CS Energy has completed nearly 200 solar projects across 16 states, in a mix of utility-scale solar projects and energy storage projects. Much of the 1 GW has been completed in the last three years as the firm manages increasingly larger projects, such as a recent 29 MW solar project in New Jersey. The growth coincides with funds managed by the Infrastructure and Power strategy of Ares Management Corporation taking majority ownership of the company in 2018.

“We made a strategic investment in CS Energy knowing the firm had the capabilities to expand its impact on renewable energy projects across the country,” shared Keith Derman, Partner and Co-Head of Ares Infrastructure and Power. “We are thrilled that CS Energy has been able to achieve such a substantial milestone and consider it a testament to the company’s legacy of experience and reliability.”

The 1 GW accomplishment comes as CS Energy garners additional recognition from the solar industry. CS Energy was named the nation’s number-one commercial solar installer in 2019 by global research firm Wood Mackenzie. With more than 10 percent of the U.S. market share, CS Energy installed as much as the second- and third-ranked companies combined. In 2020, CS Energy once again made Solar Power World magazine’s annual list of Top Solar Contractors, ranking in the Top 10 for national EPCs, and as the #1 solar contractor in both New York and New Jersey.

Additionally, the company utilizes its expertise to lead a variety of solar industry subsectors. CS Energy is considered an expert in landfill solar installations, having installed more than 160 MW on top of closed capped landfills. CS Energy is also on the forefront of Solar + Storage projects: the company has installed more than 135 MWh of energy storage projects and is ranked as the #2 Solar + Storage installer in the nation by Solar Power World.

Starting with just 12 employees in 2004, the company has grown to a highly skilled team of more than 160 people. CS Energy began in the solar industry as part of The Conti Group, a construction and engineering firm that has been operating for more than 115 years. Building on the organic success in the solar industry, the group branched out into Conti Solar, a wholly owned subsidiary of The Conti Group, in 2017. Conti Solar was majority acquired by funds managed by the Infrastructure and Power strategy of Ares Management Corporation in 2018 the company rebranded as CS Energy.

“CS Energy is thriving from the roots planted at The Conti Group—roots in skilled construction, quality customer service, and an educated leadership group. It’s been a pleasure to see CS Energy deliver on our shared vision of creating a nation-leading integrated energy company,” said Kurt Conti, Chairman of the Board of The Conti Group.

* https://www.solarpowerworldonline.com/2020-top-solar-contractors/

About CS Energy

CS Energy is an industry-leading engineering, procurement and construction (EPC) energy firm that designs and builds optimized projects in solar, energy storage, and emerging energy industries. CS Energy’s attention to detail, flawless execution and highly talented workforce has enabled the company to successfully design and install over 1 GW of solar projects across the United States. CS Energy leverages strong relationships with solar developers, IPPs, utilities, off-takers, suppliers, and landowners to help our customers streamline the project development process, lower project costs, and create value for all stakeholders. Majority-owned by Ares Infrastructure and Power, CS Energy has an experienced and committed management team and the financial resources required to continue expanding its solar and energy storage business as a trusted and long-term partner.

About Ares Management Corporation

Ares Management Corporation (NYSE: ARES) is a leading global alternative investment manager operating integrated businesses across Credit, Private Equity and Real Estate. Ares Management’s investment groups collaborate to deliver innovative investment solutions and consistent and attractive investment returns for fund investors throughout market cycles. Ares Management's global platform had approximately $165 billion of assets under management as of June 30, 2020 with more than 1,300 employees operating across North America, Europe, Asia and Australia, pro forma for the acquisition of SSG Capital Holdings Limited which closed on July 1, 2020.

About Ares Infrastructure and Power

Ares Infrastructure and Power (“AIP”) strategy seeks to provide flexible capital for cash-generating assets across the climate infrastructure, natural gas generation, and energy transportation sectors. AIP leverages a broadly skilled and cohesive team of more than 25 investment professionals with deep domain experience and has deployed nearly $9 billion of capital in more than 200 different infrastructure and power assets and companies.

About The Conti Group

The Conti Group is a privately held group of companies spanning the construction, engineering, renewable energy, real estate, technology and biotech markets whose mission is to create positive impact and great value for customers, partners, employees, and society.


Contacts

CS Energy Media:
Dianaliz Santiago-Borcan
732.520.5143
This email address is being protected from spambots. You need JavaScript enabled to view it.

DAYTON, Ohio--(BUSINESS WIRE)--In table "Consolidated Balance Sheets," first column header should read July 31, 2020 and second column header should read January 31, 2020.


The updated release reads: 

REX AMERICAN RESOURCES REPORTS FISCAL 2020 SECOND QUARTER RESULTS

REX American Resources Corporation (NYSE: REX) (“REX” or “the Company”) today reported financial results for its fiscal 2020 second quarter (“Q2 ‘20”) ended July 31, 2020. REX management will host a conference call and webcast today at 11:00 a.m. ET.

Conference Call:

212/231-2900

Webcast / Replay URL:

www.rexamerican.com/Corp/Page4.aspx


The webcast will be available for replay for 30 days.

REX American Resources’ Q2 ‘20 results principally reflect its interests in six ethanol production facilities and its refined coal operation. The One Earth Energy, LLC (“One Earth”) and NuGen Energy, LLC (“NuGen”) ethanol production facilities are consolidated, as is the refined coal entity, while those of its four other ethanol plants are reported as equity in income of unconsolidated ethanol affiliates. The Company reports results for its two business segments as ethanol and by-products, and refined coal.

REX’s Q2 ‘20 net sales and revenue were $39.3 million, compared with $105.9 million in Q2 ‘19. The year-over-year net sales and revenue decline was primarily due to lower ethanol production levels as the Company temporarily idled its NuGen Energy and One Earth Energy plants, which led to a 56% decrease in ethanol gallons sold. The Q2 ‘20 net sales and revenue also reflects an 11% decline in ethanol pricing on a year-over-year basis. Primarily reflecting these factors, Q2 ‘20 gross profit for the Company’s ethanol and by-products segment declined to $0.6 million, compared with $6.2 million in Q2 ‘19. As a result, the ethanol and by-products segment incurred a loss before income taxes of $3.3 million in Q2 ‘20, compared to income of $3.1 million in Q2 ‘19. The Company’s refined coal operation incurred a $1.9 million gross loss and a $2.1 million loss before income taxes in Q2 ‘20, compared to a $2.2 million gross loss and a loss before income taxes of $2.0 million in Q2 ‘19. REX reported a Q2 ‘20 loss before income taxes and non-controlling interests of $6.1 million, compared with income before income taxes and non-controlling interests of $0.7 million in the comparable year ago period. While the refined coal operation negatively impacted gross profit and income before income taxes, it contributed a tax benefit of $2.9 million and $3.2 million for Q2 ‘20 and Q2 ‘19, respectively.

Net loss attributable to REX shareholders in Q2 ‘20 was $1.7 million, compared to net income of $2.3 million in Q2 ‘19. Q2 ‘20 basic and diluted net loss per share attributable to REX common shareholders was $0.28, compared to net income per share of $0.36 in Q2 ‘19. Per share results in Q2 ‘20 and Q2 ‘19 are based on 6,216,000 and 6,318,000 diluted weighted average shares outstanding, respectively.

Segment Income Statement Data:


Three Months
Ended


Six Months
Ended

($ in thousands)

July 31,


July 31,


2020


2019


2020


2019

Net sales and revenue:


Ethanol & By-Products (1)

$

39,242

$

105,770

$

122,477

$

210,223

Refined coal (2) (3)


85


98


100


220

Total net sales and revenue

$

39,327

$

105,868

$

122,577

$

210,443


Gross (loss) profit:


Ethanol & By-Products (1)

$

553

$

6,169

$

(7,670)

$

12,284

Refined coal (2)


(1,884)


(2,165)


(2,991)


(4,634)

Total gross (loss) profit

$

(1,331)

$

4,004

$

(10,661)

$

7,650


(Loss) income before income taxes:


Ethanol & By-Products (1)

$

(3,259)

$

3,111

$

(15,610)

$

6,313

Refined coal (2)


(2,118)


(2,028)


(2,965)


(4,703)

Corporate and other


(702)


(352)


(1,247)


(712)

Total (loss) income before income taxes

$

(6,079)

$

731

$

(19,822)

$

898


Benefit (provision) for income taxes:


Ethanol & By-Products

$

893

$

(619)

$

5,054

$

(1,105)

Refined coal


2,919


3,155


3,878


7,101

Corporate and other


234


86


427


174

Total benefit for income taxes

$

4,046

$

2,622

$

9,359

$

6,170


Segment (loss) profit:


Ethanol & By-Products

$

(2,178)

$

1,305

$

(9,611)

$

3,014

Refined coal


898


1,216


1,048


2,602

Corporate and other


(468)


(265)


(820)


(539)

Net (loss) income attributable to REX common shareholders

$

(1,748)

$

2,256

$

(9,383)

$

5,077

(1)


Includes results attributable to non-controlling interests of approximately 25% for One Earth and approximately 1% for NuGen.

(2)


Includes results attributable to non-controlling interests of approximately 5%.

(3)


Refined coal sales are reported net of the cost of coal.

REX American Resources’ Chief Executive Officer, Zafar Rizvi, commented, “As we indicated at the time we reported the fiscal 2020 first quarter, the second quarter saw a continuation of the challenging operating environment due to the severe disruptions related to the COVID-19 pandemic and its impact on fuel demand and the economy at large. In order to preserve our financial liquidity and flexibility, we made the strategic decision to temporarily idle our two consolidated plants thus significantly reducing our ethanol output while mitigating operating losses.

“As we enter the second half of fiscal 2020, the operating environment has improved and we’ve re-opened the NuGen Energy and One Earth Energy plants based on the increase in ethanol demand. However, we expect ethanol crush spread margins and distillers grains pricing to remain volatile.“

Balance Sheet

At July 31, 2020, REX had cash and cash equivalents and short-term investments of $185.4 million, $55.9 million of which was at the parent company, and $129.5 million of which was at its consolidated production facilities. This compares with cash, cash equivalents and short-term investments at January 31, 2020, of $205.7 million, $62.3 million of which was at the parent company, and $143.4 million of which was at its consolidated ethanol production facilities.

The following table summarizes select data related to REX’s consolidated alternative energy interests:


Three Months
Ended


Six Months
Ended


July 31,


July 31,


2020


2019


2020


2019


Average selling price per gallon of ethanol

$

1.23

$

1.38

$

1.25

$

1.32


Average selling price per ton of dried distillers grains

$

135.54

$

135.46

$

143.24

$

138.92


Average selling price per pound of non-food grade corn oil

$

0.24

$

0.25

$

0.25

$

0.25


Average selling price per ton of modified distillers grains

$

31.87

$

53.01

$

49.32

$

60.12


Average cost per bushel of grain

$

3.63

$

3.80

$

3.86

$

3.65


Average cost of natural gas (per mnbtu)

$

2.92

$

2.63

$

3.60

$

3.16


Supplemental data related to REX’s alternative energy interests:

REX American Resources Corporation
Ethanol Ownership Interests/Effective Annual Gallons Shipped as of July 31, 2020
(gallons in millions)

Entity

Trailing
Twelve
Months
Gallons
Shipped

Current
REX
Ownership
Interest

REX’s Current Effective
Ownership of Trailing Twelve
Month Gallons Shipped

One Earth Energy, LLC
Gibson City, IL

115.7

75.3%

87.1

NuGen Energy, LLC
Marion, SD

72.6

99.5%

72.2

Big River Resources West Burlington, LLC
West Burlington, IA

103.8

10.3%

10.7

Big River Resources Galva, LLC
Galva, IL

112.0

10.3%

11.5

Big River United Energy, LLC
Dyersville, IA

117.9

5.7%

6.7

Big River Resources Boyceville, LLC
Boyceville, WI

54.3

10.3%

5.6

 Total

576.3

n/a

193.8

Second Quarter Conference Call

REX will host a conference call at 11:00 a.m. ET today. Senior management will discuss the quarterly financial results and host a question and answer session. The dial in number for the audio conference call is 212/231-2900 (domestic and international callers).

Participants can also listen to a live webcast of the call on the Company’s website, www.rexamerican.com/Corp/Page4.aspx. A webcast replay will be available for 30 days following the live event at www.rexamerican.com/Corp/Page4.aspx.

About REX American Resources Corporation

REX American Resources has interests in six ethanol production facilities, which in aggregate shipped approximately 576 million gallons of ethanol over the twelve-month period ended July 31, 2020. REX’s effective ownership of the trailing twelve-month gallons shipped (for the twelve months ended April 30, 2020) by the ethanol production facilities in which it has ownership interests was approximately 194 million gallons. In addition, the Company acquired a refined coal operation in August 2017. Further information about REX is available at www.rexamerican.com.

This news announcement contains or may contain forward-looking statements within the meaning of the Private Securities Litigation Reform Act of 1995. Such statements can be identified by use of forward-looking terminology such as “may,” “expect,” “believe,” “estimate,” “anticipate” or “continue” or the negative thereof or other variations thereon or comparable terminology. Readers are cautioned that there are risks and uncertainties that could cause actual events or results to differ materially from those referred to in such forward-looking statements. These risks and uncertainties include the risk factors set forth from time to time in the Company’s filings with the Securities and Exchange Commission and include among other things: the effect of pandemics such as COVID-19 on the Company’s business operations, including impacts on supplies, demand, personnel and other factors, the impact of legislative and regulatory changes, the price volatility and availability of corn, distillers grains, ethanol, non-food grade corn oil, gasoline and natural gas, ethanol and refined coal plants operating efficiently and according to forecasts and projections, changes in the international, national or regional economies, weather, results of income tax audits, changes in income tax laws or regulations, the impact of U.S. foreign trade policy, changes in foreign currency exchange rates and the effects of terrorism or acts of war. The Company does not intend to update publicly any forward-looking statements except as required by law.

- statements of operations follow -

REX AMERICAN RESOURCES CORPORATION AND SUBSIDIARIES

Consolidated Statements of Operations

(in thousands, except per share amounts)

Unaudited


Three Months
Ended


Six Months
Ended


July 31,


July 31,


2020


2019


2020


2019

Net sales and revenue

$39,327

$105,868

$122,577

$210,443

Cost of sales

40,658

101,864

133,238

202,793

Gross (loss) profit

(1,331)

4,004

(10,661)

7,650

Selling, general and administrative expenses

(4,438)

(4,764)

(9,043)

(9,496)

Equity in (loss) income of unconsolidated ethanol affiliates

(507)

239

(984)

365

Interest and other income, net

197

1,252

866

2,379

(Loss) income before income taxes and non-controlling interests

(6,079)

731

(19,822)

898

Benefit for income taxes

4,046

2,622

9,359

6,170

Net (loss) income including non-controlling interests

(2,033)

3,353

(10,463)

7,068

Net loss (income) attributable to non-controlling interests

285

(1,097)

1,080

(1,991)

Net (loss) income attributable to REX common shareholders

$(1,748)

$2,256

($9,383)

$5,077


Weighted average shares outstanding – basic and diluted

6,216

6,318

6,261

6,317


Basic and diluted net (loss) income per share attributable to REX common shareholders

$(0.28)

$0.36

($1.50)

$0.80


- balance sheets follow -

REX AMERICAN RESOURCES CORPORATION AND SUBSIDIARIES

Consolidated Balance Sheets

(in thousands)

Unaudited


July 31,


January 31,

ASSETS


2020


2020

CURRENT ASSETS:


Cash and cash equivalents


$

152,708


$

179,658

Restricted cash


950


1,113

Short-term investments


32,656


26,073

Accounts receivable


9,744


12,969

Inventory


30,383


35,634

Refundable income taxes


10,620


6,029

Prepaid expenses and other


9,878


9,659

Total current assets


246,939


271,135

Property and equipment-net


158,513


163,327

Operating lease right-of-use assets


15,345


16,173

Deferred taxes


21,182


17,061

Other assets


884


342

Equity method investment


29,475


32,464

TOTAL ASSETS


$

472,338


$

500,502

LIABILITIES AND EQUITY 


CURRENT LIABILITIES:


Accounts payable – trade


$

8,584


$

18,900

Current operating lease liabilities


5,310


4,935

Accrued expenses and other current liabilities


7,295


7,764

Total current liabilities


21,189


31,599

LONG TERM LIABILITIES:


Deferred taxes


3,670


4,334

Long-term operating lease liabilities


9,600


10,688

Other long-term liabilities


140


275

Total long-term liabilities


13,410


15,297

COMMITMENTS AND CONTINGENCIES


EQUITY:


REX shareholders’ equity:


Common stock, 45,000 shares authorized, 29,853 shares issued at par


299


299

Paid in capital


149,044


148,789

Retained earnings


577,602


586,985

Treasury stock, 23,655 and 23,561 shares, respectively


(340,591)


(335,066)

Total REX shareholders’ equity


386,354


401,007

Non-controlling interests


51,385


52,599

Total equity


437,739


453,606

TOTAL LIABILITIES AND EQUITY


$

472,338


$

500,502

- statements of cash flows follow -

REX AMERICAN RESOURCES CORPORATION AND SUBSIDIARIES

Consolidated Statements of Cash Flows

(in thousands)

Unaudited


Six Months Ended


July 31,


2020


2019

CASH FLOWS FROM OPERATING ACTIVITIES:


Net (loss) income


$

(10,463)


$

7,068

Adjustments to reconcile net (loss) income to net cash (used in) provided by operating activities:


Depreciation


10,491


12,425

Amortization of operating lease right-of-use assets


2,691


2,992

Stock based compensation expense


80


248

Loss (income) from equity method investments


984


(365)

Dividends received from equity method investments


2,005


-

Interest income from investments


(179)


(25)

Deferred income tax


(4,784)


(6,294)

Gain on disposal of property and equipment


(22)


-

Changes in assets and liabilities:


Accounts receivable


3,225


3,696

Inventory


5,251


(3,594)

Refundable income taxes


(4,591)


12

Prepaid expenses and other assets


(481)


(153)

Accounts payable-trade


(10,301)


1,409

Other liabilities


(2,940)


(4,927)

Net cash (used in) provided by operating activities


(9,034)


12,492

CASH FLOWS FROM INVESTING ACTIVITIES:


Capital expenditures


(5,692)


(1,449)

Purchases of short-term investments


(45,450)


-

Sales of short-term investments


39,046


15,000

Other


(259)


12

Net cash (used in) provided by investing activities


(12,355)


13,563

CASH FLOWS FROM FINANCING ACTIVITIES:


Treasury stock acquired


(5,590)


-

Payments to noncontrolling interests holders


(157)


(2,598)

Capital contributions from minority investor


23


185

Net cash used in financing activities


(5,724)


(2,413)

NET DECREASE IN CASH, CASH EQUIVALENTS  AND RESTRICTED CASH


(27,113)


23,642

CASH, CASH EQUIVALENTS AND RESTRICTED CASH-Beginning of period


180,771


188,812

CASH, CASH EQUIVALENTS AND RESTRICTED CASH-End of period


$

153,658


$

212,454

Non cash financing activities – Stock awards issued


$

240


$

487

Non cash financing activities – Stock awards accrued


$

-


$

171

Non cash investing activities – Accrued capital expenditures


$

22


$

5

Initial operating lease right-of-use assets and liabilities recorded  upon adoption of ASC 842


$

-


$

20,918

Operating lease right-of-use assets acquired and liabilities assumed upon lease execution 


$

1,863


$

432


Contacts

Douglas Bruggeman
Chief Financial Officer
(937) 276‑3931

Joseph Jaffoni, Norberto Aja
JCIR
(212) 835-8500
This email address is being protected from spambots. You need JavaScript enabled to view it.

RICHMOND, Va.--(BUSINESS WIRE)--Synalloy Corporation (Nasdaq: SYNL) (the “Company”), announced today that, as expected, it received a standard notification letter dated August 20, 2020, from Nasdaq stating that, as a result of not having timely filed its quarterly report on Form 10-Q for the period ended June 30, 2020, the Company no longer complies with Nasdaq Listing Rule 5250(c)(1), which requires timely filing of periodic financial reports with the Securities and Exchange Commission (the “SEC”).


This notice has no immediate effect on the listing of the Company’s common stock on the Nasdaq Global Select Market. Although Nasdaq’s listing rules provide the Company with 60 calendar days from the date of the notice to submit a plan to regain compliance, the Company expects to file its Form 10-Q within the 60-calendar day period.

The Company has completed its work related to the amount of the impairment charges resulting from the suspension of manufacturing operations at Palmer of Texas Tanks, Inc. and the goodwill impairment analysis of its Welded Pipe & Tube reporting unit. Additionally, the independent law firm’s investigation, referenced in the Company’s Form 12b-25 filing dated August 11, 2020, is complete. The investigation concluded that there was no evidence of intentional misconduct, bad faith or criminal acts. However, the Company’s analysis of its internal control over financial reporting is ongoing. The current delay in preparing and filing the Form 10-Q is due exclusively to this continuing analysis regarding internal control over financial reporting.

About Synalloy Corporation

Synalloy Corporation (Nasdaq: SYNL) is a growth oriented company that engages in a number of diverse business activities including the production of stainless steel and galvanized pipe and tube, the master distribution of seamless carbon pipe and tube, and the production of specialty chemicals. For more information about Synalloy Corporation, please visit our website at www.synalloy.com.

Forward-Looking Statements

This press release may include “forward-looking statements” within the meaning of the federal securities laws. All statements that are not historical facts are “forward-looking statements.” The words “estimate,” “project,” “intend,” “expect,” “believe,” “should,” “anticipate,” “hope,” “optimistic,” “plan,” “outlook,” “should,” “could,” “may” and similar expressions identify forward-looking statements. The forward-looking statements are subject to certain risks and uncertainties, including without limitation those identified below, which could cause actual results to differ materially from historical results or those anticipated. Readers are cautioned not to place undue reliance on these forward-looking statements. The following factors could cause actual results to differ materially from historical results or those anticipated: adverse economic conditions; the impact of competitive products and pricing; product demand and acceptance risks; raw material and other increased costs; raw materials availability; employee relations; ability to maintain workforce by hiring trained employees; labor efficiencies; customer delays or difficulties in the production of products; new fracking regulations; a prolonged decrease in oil and nickel prices; unforeseen delays in completing the integrations of acquisitions; risks associated with mergers, acquisitions, dispositions and other expansion activities; financial stability of our customers; environmental issues; unavailability of debt financing on acceptable terms and exposure to increased market interest rate risk; inability to comply with covenants and ratios required by our debt financing arrangements; ability to weather an economic downturn; loss of consumer or investor confidence and other risks detailed from time-to-time in the Company’s SEC filings. The Company assumes no obligation to update the information included in this release.

For more information about Synalloy Corporation, please visit our web site at www.synalloy.com.


Contacts

Sally Cunningham at (804) 822-3267

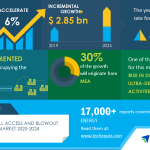
LONDON--(BUSINESS WIRE)--#GlobalSubseaWellAccessandBlowoutPreventerSystemMarket--Technavio has been monitoring the subsea well access and blowout preventer system market and it is poised to grow by $ 2.85 bn during 2020-2024, progressing at a CAGR of 6% during the forecast period. The report offers an up-to-date analysis regarding the current market scenario, latest trends and drivers, and the overall market environment.


Technavio suggests three forecast scenarios (optimistic, probable, and pessimistic) considering the impact of COVID-19. Please Request Latest Free Sample Report on COVID-19 Impact

The market is fragmented, and the degree of fragmentation will accelerate during the forecast period. Aker Solutions ASA, Baker Hughes a GE Co., Dril-Quip Inc., Eaton Corp. Plc, Halliburton Co., National Oilwell Varco Inc., Oceaneering International Inc., Schlumberger Ltd., TechnipFMC Plc, and Weatherford International Plc are some of the major market participants. To make the most of the opportunities, market vendors should focus more on the growth prospects in the fast-growing segments, while maintaining their positions in the slow-growing segments.

The rise in deepwater and ultra-deepwater E&P activities has been instrumental in driving the growth of the market. However, fluctuations in the price of crude oil might hamper the market growth.

Subsea Well Access and Blowout Preventer System Market 2020-2024 : Segmentation

Subsea Well Access and Blowout Preventer System Market is segmented as below:

  • Product
    • Subsea BOP
    • Subsea WAS
  • Geographic Landscape
    • APAC
    • Europe
    • MEA
    • North America
    • South America

To learn more about the global trends impacting the future of market research, download a free sample: https://www.technavio.com/talk-to-us?report=IRTNTR41579

Subsea Well Access and Blowout Preventer System Market 2020-2024 : Scope

Technavio presents a detailed picture of the market by the way of study, synthesis, and summation of data from multiple sources. Our subsea well access and blowout preventer system market report covers the following areas:

  • Subsea Well Access and Blowout Preventer System Market size
  • Subsea Well Access and Blowout Preventer System Market trends
  • Subsea Well Access and Blowout Preventer System Market industry analysis

This study identifies the growing demand for oil and natural gas as one of the prime reasons driving the subsea well access and blowout preventer system market growth during the next few years.

Subsea Well Access and Blowout Preventer System Market 2020-2024 : Vendor Analysis

We provide a detailed analysis of around 25 vendors operating in the subsea well access and blowout preventer system market, including some of the vendors such as Aker Solutions ASA, Baker Hughes a GE Co., Dril-Quip Inc., Eaton Corp. Plc, Halliburton Co., National Oilwell Varco Inc., Oceaneering International Inc., Schlumberger Ltd., TechnipFMC Plc, and Weatherford International Plc. Backed with competitive intelligence and benchmarking, our research reports on the subsea well access and blowout preventer system market are designed to provide entry support, customer profile and M&As as well as go-to-market strategy support.

Register for a free trial today and gain instant access to 17,000+ market research reports.

Technavio's SUBSCRIPTION platform

Subsea Well Access and Blowout Preventer System Market 2020-2024 : Key Highlights

  • CAGR of the market during the forecast period 2020-2024
  • Detailed information on factors that will assist subsea well access and blowout preventer system market growth during the next five years
  • Estimation of the subsea well access and blowout preventer system market size and its contribution to the parent market
  • Predictions on upcoming trends and changes in consumer behavior
  • The growth of the subsea well access and blowout preventer system market
  • Analysis of the market’s competitive landscape and detailed information on vendors
  • Comprehensive details of factors that will challenge the growth of subsea well access and blowout preventer system market vendors

Table Of Contents :

Executive Summary

  • Market Overview

Market Landscape

  • Market ecosystem
  • Value chain analysis

Market Sizing

  • Market definition
  • Market segment analysis
  • Market size 2019
  • Market outlook: Forecast for 2019 - 2024

Five Forces Analysis

  • Bargaining power of buyers
  • Bargaining power of suppliers
  • Threat of new entrants
  • Threat of substitutes
  • Threat of rivalry
  • Market condition

Market Segmentation by Product

  • Market segments
  • Comparison by Product placement
  • Subsea BOP - Market size and forecast 2019-2024
  • Subsea WAS - Market size and forecast 2019-2024
  • Market opportunity by Product

Customer landscape

  • Overview

Geographic Landscape

  • Geographic segmentation
  • Geographic comparison
  • MEA - Market size and forecast 2019-2024
  • APAC - Market size and forecast 2019-2024
  • Europe - Market size and forecast 2019-2024
  • North America - Market size and forecast 2019-2024
  • South America - Market size and forecast 2019-2024
  • Key leading countries
  • Market opportunity by geography

Drivers, Challenges, and Trends

  • Market drivers
  • Volume driver - Demand led growth
  • Volume driver - Supply led growth
  • Volume driver - External factors
  • Volume driver - Demand shift in adjacent markets
  • Price driver - Inflation
  • Price driver - Shift from lower to higher-priced units
  • Market challenges
  • Market trends

Vendor Landscape

  • Overview
  • Landscape disruption
  • Vendor Analysis

Vendors covered

  • Market positioning of vendors
  • Aker Solutions ASA
  • Baker Hughes, a GE Co.
  • Dril-Quip Inc.
  • Eaton Corp. Plc
  • Halliburton Co.
  • National Oilwell Varco Inc.
  • Oceaneering International Inc.
  • Schlumberger Ltd.
  • TechnipFMC Plc
  • Weatherford International Plc

Appendix

  • Scope of the report
  • Currency conversion rates for US$
  • Research methodology
  • List of abbreviations

About Us

Technavio is a leading global technology research and advisory company. Their research and analysis focus on emerging market trends and provides actionable insights to help businesses identify market opportunities and develop effective strategies to optimize their market positions. With over 500 specialized analysts, Technavio’s report library consists of more than 17,000 reports and counting, covering 800 technologies, spanning across 50 countries. Their client base consists of enterprises of all sizes, including more than 100 Fortune 500 companies. This growing client base relies on Technavio’s comprehensive coverage, extensive research, and actionable market insights to identify opportunities in existing and potential markets and assess their competitive positions within changing market scenarios.


Contacts

Technavio Research
Jesse Maida
Media & Marketing Executive
US: +1 844 364 1100
UK: +44 203 893 3200
Email: This email address is being protected from spambots. You need JavaScript enabled to view it.
Website: www.technavio.com/

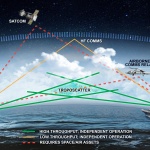
SAN DIEGO--(BUSINESS WIRE)--TrellisWare Technologies, Inc. announced today that they have been awarded a contract from the Office of Naval Research (ONR) to build and test a new tropospheric scatter (troposcatter) radio prototype to address the Navy’s communications challenges. The ONR goal is to employ a robust Beyond Line of Sight (BLoS) troposcatter communications capability supporting mobile naval operations for both ship-to-ship and ship-to-shore links as an alternative to satellite communications (SATCOM).


TrellisWare’s prototype troposcatter radio will use a new waveform that has been optimized to maintain reliable and robust troposcatter communications, even in challenging and highly variable propagation conditions. This waveform was developed and successfully tested over-the-air between San Diego and Los Angeles County in late 2019 under a prior ONR contract to TrellisWare.

“TrellisWare has been working with ONR since 2017 to study the feasibility of mobile naval troposcatter communications,” said Marcus Urie, manager of technology development. “Over the last several years, the engineering team has done an excellent job evaluating the additional system complexities that will be required to maintain reliable troposcatter communications during mobile at-sea operations. Our team is excited to continue working with ONR to take the next step in the evolution of this naval capability.”

TrellisWare’s troposcatter radio will provide reliable over-the-horizon communication with significantly lower Size, Weight, and Power (SWaP) relative to traditional troposcatter capabilities. The combination of a more robust waveform with a lower SWaP terminal will enable better integration with antenna pointing (acquisition), tracking, and stabilization (PTS) techniques, leading the way for a mobile troposcatter capability.

As a leading provider of robust communications solutions for the Department of Defense (DoD), TrellisWare is well positioned to build and test a reliable solution for the Navy’s communications challenges. TrellisWare will validate the prototype troposcatter radio performance in over-the-air test and demonstration campaigns in late 2021.

About TrellisWare Technologies, Inc.

TrellisWare Technologies, Inc. is a global leader in highly advanced algorithms, waveforms, and communications systems that range from small form factor radio products to fully integrated solutions. Our TSM™ waveform is incorporated into a wide range of systems, including TrellisWare radios and trusted industry partner radios, as well as multiple government and commercial solutions. TrellisWare is delivering the next generation of communications for military and commercial markets When Nothing Else Works™. For more information on TrellisWare’s products and solutions, visit www.trellisware.com.


Contacts

Media Contact: Tina Bachman
Marketing Communications Manager
TrellisWare Technologies, Inc.
PH: +1 858-753-1603
This email address is being protected from spambots. You need JavaScript enabled to view it.

  • Enchanted Rock’s managed microgrids ensure power resiliency for critical facilities such as hospitals, water treatment plants, and grocery stores during power outages.
  • Enchanted Rock will use the Sitetracker platform to gain operational efficiencies that support rapid growth of their microgrid portfolio.
  • Enchanted Rock sees Sitetracker as essential to ensuring their continued leadership in this breakout industry.

PALO ALTO, Calif.--(BUSINESS WIRE)--Sitetracker, the global standard for managing high-volume infrastructure projects for telecom, utilities, and distributed energy resources, is proud to announce their partnership with Enchanted Rock, LLC. Enchanted Rock provides affordable, long duration backup power to commercial, industrial, and institutional customers by delivering proven, full-service resiliency microgrids leveraging the cleanest available technology.


“Critical facilities such as data centers, hospitals, water treatment plants, and grocery stores rely on continuous power to keep communities safe and maintain operations,” said Thais Grossi, COO of Enchanted Rock. “We provide managed power resiliency to help our customers eliminate outages and focus on what matters most – their core business. Sitetracker will automate our project management processes to help accelerate our project completion.”

“Sitetracker is the standard for managing high-volume projects, and we very quickly understood the platform’s value,” stated Eric Meyer, Director of Microgrid EPC at Enchanted Rock. “But we are also impressed by their world-class customer support, dedication to their partner’s success, and commitment to deliver value to our business.”

Sitetracker’s industry-leading capabilities such as intelligent project templates, trackers for bulk project updates, efficient closeout with automated document generation, out-of-the-box reporting and dashboarding, a powerful mobile app, and predictive analytics will help Enchanted Rock to roll out their assets with ease, efficiency, and speed.

“Much like how Enchanted Rock’s mission is about keeping businesses in business, Sitetracker innovates to empower innovators,“ said Giuseppe Incitti, CEO of Sitetracker. “We are very excited to partner a visionary company like Enchanted Rock. Their dedication to keeping our most critical institutions operational is not only commendable but essential now more than ever before.”

To learn more about Enchanted Rock, visit https://enchantedrock.com/. For more information on Sitetracker, visit www.sitetracker.com.

About Sitetracker

Sitetracker, Inc. powers the successful deployment of critical infrastructure. As the global standard for managing high-volume projects, the Sitetracker Platform enables growth-focused innovators to optimize the entire asset lifecycle. From the field to the C-suite, Sitetracker enables stakeholders to optimize how they plan, deploy, maintain, and grow their capital asset portfolios. Market leaders in the telecommunications, utility, smart cities, and energy industries — such as Verizon, Ericsson, Fortis, Alphabet, British Telecom, and Vodafone — rely on Sitetracker to manage millions of sites and projects representing over $23 billion of portfolio holdings globally. For more information, visit www.sitetracker.com.

About Enchanted Rock

Enchanted Rock provides affordable, long duration backup power to commercial, industrial, and institutional customers by delivering a proven, full-service solution with the cleanest available technology. Enchanted Rock handles the design, construction, commissioning, operations, and maintenance so utilities can provide their customers with reliable backup power without the expense and challenges that come with maintaining a backup generation system. To learn more about electrical resiliency using Enchanted Rock solutions, visit www.enchantedrock.com.


Contacts

Brett Chester
+1 (408) 477-4461
This email address is being protected from spambots. You need JavaScript enabled to view it.

Paves the way for Advanced Monitoring System and Digital Twin-Ready Capabilities

ROANOKE, Va.--(BUSINESS WIRE)--#CETENA--Luna Innovations Incorporated (NASDAQ: LUNA), a global leader in advanced fiber optic-based technology, today announced that it has partnered with CETENA and GHT Photonics to help design, build and implement a full-scale, fiber-optic structural health monitoring system for the recently re-opened Polcevera Viaduct bridge, which is a critical traffic artery for the city of Genoa in northern Italy.


The innovative bridge, which is over a kilometer long featuring 19 spans, is equipped with an advanced health monitoring system based on a network of Luna’s HYPERION® measurement systems and advanced fiber optic sensors installed by Luna’s integration partner GHT photonics. The system will monitor the structural response of the bridge, as well as conditions including the number and weight of vehicles, water stagnation, weather and other important variables helpful for bridge monitoring, control and inspection. The sensors installed on the infrastructure will capture the data necessary to create a digital twin of the bridge, that reproduces all the viaduct’s physical characteristics, in real time.

“The re-building of this bridge was a national priority for Italy and stands as a symbol of progress for using our fiber in all smart infrastructures. Luna is proud to partner with disruptors like GHT Photonics and CETENA to work on this significant and historic project,” said Scott Graeff, President and Chief Executive Officer of Luna Innovations. “Our alliance has helped pave the way for innovative growth in how we operate, inspect, monitor and manage all infrastructure in the future.”

CETENA guided the development of groundbreaking software, Cymon, that connects to the Luna fiber-optic sensing system for data acquisition, analysis, and comparison with bridge design data and storage. “The goal of the structural monitoring system is to ensure that the condition of the bridge can be monitored closely, consistently and continuously,” said Paolo Ceni, CEO of CETENA. “By assessing in real-time the bridge conditions and correlating them with load factors, any maintenance or operational needs will be addressed swiftly so the working performance and safety of the structure and passengers will be ensured. In the next stage, acquired data will offer the possibility to construct a digital twin of the bridge and to review structural loads and environmental factors with augmented reality (AR) technology, in which CETENA has acquired deep experience in the maritime and naval simulation field.”

In order to meet the demanding requirements for micro seismic monitoring and operational modal analysis (OMA), Luna provided best-in-class fiber-optic interrogators and instrumented the entire bridge with an extensive network of fiber-optic accelerometers, the only optical solution available on the market that fit the project’s OMA requirements. Combined with Luna’s HYPERION® instrument platform, the os7500 family of accelerometers can be easily distributed and synchronized with other sensors. The fully fiber-optic solution, which forms the basis of an internal “nerve” network for the structure, was easily deployed across the large structure and is now ready to be centrally operated, producing data critical to the health and maintenance of the structure for decades to come.

About Luna

Luna Innovations Incorporated (www.lunainc.com) is a leader in optical technology, providing unique capabilities in high-performance, fiber optic-based, test products for the telecommunications industry and distributed fiber optic-based sensing for the aerospace and automotive industries. Luna is organized into two business segments, which work closely together to turn ideas into products: a Lightwave segment and a Luna Labs segment. Luna’s business model is designed to accelerate the process of bringing new and innovative technologies to market.

About CETENA

CETENA SpA (www.cetena.it), is the engineering and technical consultancy and R&D center of Fincantieri Group, operating both in the traditional fields of maritime and naval engineering (structures, hydrodynamics, safety, sea trials, ship performances, …) and in transversal ones (monitoring systems, simulation and augmented reality environments, green energy technologies, air and underwater noise emission reduction).CETENA is organized into several Business Units working together to develop advanced consultancy services and products, based on knowledge, applied R&D, experimental laboratories and on-field experience.


Contacts

Media Contact:
Jane Bailey
Phone: 540.525.0364
Email: This email address is being protected from spambots. You need JavaScript enabled to view it.

Investor Contact:
Allison Woody
Phone: 540.769.8465
Email: This email address is being protected from spambots. You need JavaScript enabled to view it.

PG&E to Contribute $150,000 to American Red Cross and California Association of Food Banks

The PG&E Corporation Foundation to Match up to $50,000 in Employee Donations to Select Nonprofits, for a Total of Up To $100,000

SAN FRANCISCO--(BUSINESS WIRE)--Pacific Gas and Electric Company (PG&E) announced today an initial set of charitable commitments totaling $150,000 to support residents displaced and impacted by recent wildfires across Northern California. PG&E’s charitable funding will be allocated to the following organizations to support shelter activations, food bank operations, and other relief programs:

Additionally, The PG&E Corporation Foundation (The Foundation) has committed to matching up to $50,000 in PG&E employee contributions to wildfire relief. The Foundation will match employee contributions to five featured charities supporting wildfire assistance. The employee contributions and 1:1 matching funds total up to $100,000 in support. The featured nonprofits include local community foundations and other organizations that are providing ongoing support to wildfire impacted communities throughout PG&E’s service area.

In total, the PG&E, employee and The Foundation contributions will provide up to $250,000 in charitable funding in this first phase of emergency relief to communities impacted by wildfires in 2020.

“There are so many people in our communities who need help right now as these devastating wildfires continue to burn,” said Robert Kenney, PG&E Vice President, Regulatory and External Affairs. “PG&E is grateful for the services that the American Red Cross, the California Association of Food Banks, and other organizations are providing, and we are here to support them. We also appreciate our employees who have a long and generous history of giving back to communities in need.”

In PG&E’s service area, the Red Cross has opened more than a dozen facilities in the Santa Cruz area, and portions of the North and Central Valleys. Customers can visit www.redcross.org/shelter to find available locations near them.

For the past week, PG&E has been onsite and working around the clock with first responders, local agencies and CAL FIRE in communities impacted by wildfires.

These charitable donations will come from PG&E shareholders, employees and The Foundation, not PG&E’s customers.

PG&E Reminds Customers to Prepare for Emergencies

PG&E is reminding its customers to get ready for natural disasters before they happen. Among the actions PG&E encourages its customers to take:

  • Prepare an emergency plan and conduct an emergency drill with your family.
  • Prepare an evacuation plan for your home. Each room should have at least two ways to escape in case one is blocked. Establish a place where your family can reunite.
  • Update your contact information with PG&E so the company can contact you with important safety alerts and updates during wildfire season.
  • Establish an alternative way to contact others who are not home, such as an out-of-the-area telephone contact.
  • Prepare and maintain an emergency preparedness kit with enough supplies on hand to be self-sufficient for at least three days, and preferably up to one week.
  • Know where the main electric switch is and how to turn off your electric supply.

Customers can find more tips at www.pge.com/wildfiresafety.

About PG&E

Pacific Gas and Electric Company, a subsidiary of PG&E Corporation (NYSE:PCG), is one of the largest combined natural gas and electric energy companies in the United States. Based in San Francisco, with more than 23,000 employees, the company delivers some of the nation's cleanest energy to 16 million people in Northern and Central California. For more information, visit pge.com and pge.com/news


Contacts

MEDIA RELATIONS:
415-973-5930

HOUSTON--(BUSINESS WIRE)--National Oilwell Varco, Inc. (the “Company”) (NYSE: NOV) announced today the closing of the previously announced cash tender offer (the “Tender Offer”) to purchase any and all of the outstanding 2.600% Senior Unsecured Notes due 2022 (the “Notes”) issued by the Company. The Tender Offer expired at 5:00 p.m., New York City time, on August 25, 2020 (the “Expiration Time”). The complete terms and conditions of the Tender Offer were set forth in an Offer to Purchase, dated August 19, 2020 (the “Offer to Purchase”), and the related Notice of Guaranteed Delivery.


As of the Expiration Time, $217,068,000 aggregate principal amount of Notes had been validly tendered and not validly withdrawn. This amount excludes $2,963,000 aggregate principal amount of the Notes expected to be tendered pursuant to the guaranteed delivery procedures described in the Offer to Purchase. Notes tendered pursuant to the guaranteed delivery procedures must be provided no later than 5:00 p.m., New York City time, on August 27, 2020.

The Company has accepted for payment all the Notes validly tendered and not validly withdrawn prior to the Expiration Time and, in accordance with the terms of the Offer to Purchase, has paid all holders of such Notes $1,035 per $1,000 principal amount of Notes tendered plus accrued and unpaid interest from the last interest payment date to, but not including, today, August 26, 2020 (the “Payment Date”). The Company intends to accept for payment all of the Notes that are tendered pursuant to the guaranteed delivery procedures. Payment for Notes validly tendered pursuant to the guaranteed delivery procedures is expected to be made on August 28, 2020, as described in the Offer to Purchase.

The Company funded the purchase of the Notes with cash on hand. Barclays Capital Inc. and J.P. Morgan Securities LLC acted as dealer managers for the Tender Offer. D.F. King & Co., Inc. was the information agent and tender agent for the Tender Offer.

About NOV

NOV is a leading provider of technology, equipment, and services to the global oil and gas industry that supports customers’ full-field drilling, completion, and production needs. Since 1862, NOV has pioneered innovations that improve the cost-effectiveness, efficiency, safety, and environmental impact of oil and gas operations. NOV powers the industry that powers the world.

Visit www.nov.com for more information. Information on the Company’s website is not part of this release.

Cautionary Notice Regarding Forward-Looking Statements

Statements made in this press release that are forward-looking in nature are intended to be “forward-looking statements” within the meaning of Section 27A of the Securities Act of 1933, as amended, and Section 21E of the Securities Exchange Act of 1934, as amended, and may involve risks and uncertainties. Such statements include plans, projections and estimates regarding the completion of the Tender Offer. Such forward-looking statements are subject to certain risks, uncertainties and assumptions, including prevailing market conditions and other factors. Should one or more of these risks or uncertainties materialize, or should underlying assumptions prove incorrect, actual results may vary materially from those expected. Readers are referred to documents filed by NOV with the SEC, including the Annual Report on Form 10-K and Quarterly Report on Form 10-Q, which identify significant risk factors that could cause actual results to differ from those contained in the forward-looking statements. The Company undertakes no obligation to update forward-looking statements, except as required by law.


Contacts

Blake McCarthy
(713) 815-3535

DUBLIN--(BUSINESS WIRE)--The "Transformative Trends and Innovative Business Models Powering the Indian Electric Bus Market, 2019" report has been added to ResearchAndMarkets.com's offering.


This study on the Indian electric bus (eBus) market discusses the key influencing trends that are driving the growth in this segment.

Government Initiatives in India to promote electric buses, state government initiatives, and FAME-II overview and incentive schemes are discussed in this study. The tenders in different cities for procuring the electric buses are compared and analyzed, and the differences between the gross cost contract (GCC) purchase model and the outright purchase model are explained.

State-wise EV policies that have been announced and are in the implementation phase are discussed along with future government plans in India for electric buses. The key market drivers and restraints influencing electric buses in India are discussed in detail.

A complete total cost of ownership (TCO) analysis is done with a scenario comparing diesel and CNG buses to electric buses, highlighting the cost differences between them if they are owned for a year. Similarly, forecasting is also done for the same scenario in 2025 with the effects of a decline in battery prices in India. The estimated differences between the 3 buses are studied for that timeline as well.

The major barriers in the adoption of electric buses and what are the solutions to overcome them are also explained through a detailed SWOT analysis on the implementation of electric buses in India. The key technological trends in India with electric buses (e.g., battery swapping) are also discussed. Charging infrastructures are explained in detail, including the different types used in different countries. Pantograph charging as an opportunity in India is explored through bus rapid transit system (BRTS) lanes.

The battery technology along with a pricing roadmap to the future and an estimated battery price in the future are also given. The limitless opportunities in recycling batteries and the different methods of recycling are discussed along with the possibilities of usage of secondary life applications with global examples of recycling and repurposing that have been implemented successfully as of now.

The driveline technology is explained with a detailed analysis of the different types of electric driveline architecture and definitions of key terminologies along with electric motor benchmarking. The electric motor roadmap is also discussed and the pricing analysis for the different types of motors and their forecasting is also given.

Finally, the future of electric buses in India is estimated with 3 different scenarios, and recommendations are provided for key stakeholders. The growth opportunities and strategic imperatives for success and growth in the electric bus market are also discussed.

Key Topics Covered

1. Executive Summary

  • Key Highlights

2. Research Scope, Objectives, Background and Methodology

  • Research Scope
  • Research Aims and Objectives
  • Key Questions this Study will Answer
  • Research Methodology

3. Electric Bus Market in India

  • Indian Electric Bus Market - Key Influencing Trends
  • Product Portfolio
  • Electric Buses Under FAME-I
  • FAME-I Tenders in Different Cities
  • FAME-I Bidding Prices - Comparison Between Different Cities
  • GCC Model and Outright Purchase Model Comparison
  • FAME-II - Buses Sanctioned
  • FAME-II - State-wise Penetration of Tenders Won for eBuses
  • Forecast of eBuses in India

4. Government Initiatives

  • FAME-II Incentives in India - An Overview
  • FAME-II - Incentive Structure
  • States Chipping in With EV Policies and Investments
  • State-wise Policies and Investments to Promote Electric Vehicles
  • Future Government Plans

5. Petroleum Import Bill and Its Impact

  • Petroleum Import Bill in India

6. Total Cost of Ownership Analysis

  • TCO Analysis - Comparison of Diesel, CNG, and Electric
  • Future Scenario

7. Market Drivers and Restraints

  • Market Drivers
  • Drivers Explained
  • Market Restraints
  • Restraints Explained
  • Major Barriers in eBus Implementation and Solution
  • SWOT Analysis

8. Technology Trends

  • Why Battery Swapping?
  • Technology Comparison
  • Battery Swapping Operations in China and India

9. Battery Technology

  • Battery Technology Roadmap
  • Battery Price Roadmap
  • Battery Thermal Management System (BTMS)
  • Battery Technology Roadmap and Price Outlook
  • Battery Demand and Manufacturing Capacity

10. Recycling and Reusing of Lithium-ion Batteries

  • Reuse of Batteries for Secondary Life Applications
  • Secondary Life Applications
  • Recycling of Batteries
  • Global Examples of Recycling and Repurposing

11. Charging Infrastructure

  • Electric Vehicle Supply Equipment (EVSE) Types with Various Connectors
  • Types of Charging Stations for Buses
  • Inductive Charging
  • Incentives for Charging Stations
  • Charging Strategies for eBuses
  • Pantograph Charging - Technology Roadmap
  • Opportunity for Pantograph Charging in BRTS
  • Charging Infrastructure in India - Challenges

12. Drivetrain Technology

  • Electric Driveline Architecture Benchmarking
  • Electric Motor Benchmarking
  • Electric Motor Roadmap

13. Growth Opportunities and Future Outlook

  • Growth Opportunity 1 - Battery Swapping Model will Significantly Bring Down the Cost of Electric Buses
  • Growth Opportunity 2 - Focusing on Improving the Charging Infrastructure and Increasing Localization of EV Components
  • Strategic Imperatives for Success and Growth

14. The Last Word

  • 3 Big Predictions

For more information about this report visit https://www.researchandmarkets.com/r/1lifl1


Contacts

ResearchAndMarkets.com
Laura Wood, Senior Press Manager
This email address is being protected from spambots. You need JavaScript enabled to view it.

For E.S.T Office Hours Call 1-917-300-0470
For U.S./CAN Toll Free Call 1-800-526-8630
For GMT Office Hours Call +353-1-416-8900

VESTAL, N.Y.--(BUSINESS WIRE)--#cleanenergy--SolarWindow Technologies, Inc. (Symbol: WNDW) today released scheduled video footage of its largest ultra-transparent SolarWindow™, discretely generating electricity to power lighting and drive a digital multimeter. Capable of generating current and voltage while maintaining the transparent nature of ordinary glass, the featured nine-square-foot SolarWindow™ was created using the Company’s patented LiquidElectricity™ coatings.


These coatings transform otherwise ordinary glass into high-value glass which generates power from sunlight, indoor lighting, and even in the shade.

Click here to see first-hand, your own clear view through our largest and most transparent SolarWindow™, generating electricity.

When installed on commercial buildings, SolarWindow™ products could achieve a one-year financial payback for building owners, according to independently-validated company power and financial modeling.

“Shareholders, building owners, developers, and architects have long-awaited the opportunity to witness first-hand our transparent SolarWindow™ products generating electricity,” stated Mr. Jay Bhogal, Chief Executive Officer of SolarWindow.

“Our largest ever SolarWindow™ provides a glimpse at the future of electrification. Beyond today’s success with electricity-generating glass, within reach is the promise of electrifying automotive windows and sunroofs, rail and marine applications and various consumer products and military uses.”

Today’s SolarWindow announcement is the result of the Company’s strong capital position, which has enabled an expanded Management Team and enhanced Board of Directors.

In recent months, the Company has augmented its Board of Directors with the appointment of Mr. John Rhee, former Executive Director at the SoftBank Alternative Investment and Venture Fund and bolstered its management team with Mr. Jay S. Bhogal as President and CEO. Mr. Bhogal has a history of rapidly accelerating the commercialization of breakthrough technologies and consummating commercial and institutional partnerships.

The Company has also established the SolarWindow Innovation Group, under the leadership of Mr. John Conklin, Chief Technology Officer.

“I’m extremely proud of John and his team, who have overcome stay-at-home mandates, travel constraints and physical distancing protocols to bring us the largest transparent electricity-window to date,” explained Mr. Harmel Rayat, Chairman of SolarWindow.

“As an owner of commercial properties, I envision a day when buildings everywhere become vertical power generators simply by installing electricity-generating SolarWindows.”

To follow ongoing SolarWindow™ news and press releases, sign up to receive our email updates by visiting https://solarwindow.com/join-our-email-list/.

About SolarWindow Technologies, Inc.

SolarWindow Technologies, Inc. (Symbol: WNDW; www.solarwindow.com) is a developer of transparent coatings that generate electricity when deposited onto glass or plastic. When applied to glass, for example, these coatings could convert passive windows into electricity-generating windows, which produce power under natural, artificial, low, shaded, and even reflected light conditions.

Other potential uses for transparent electricity-generating coatings include, but are not limited to, building facades, balcony railings, curtain walls, skylights, and shading systems, as well as automotive, truck, marine and aircraft applications, various consumer products and military uses.

For additional information, please call Amit Singh at 800-213-0689 or visit: www.solarwindow.com.

To receive future press releases via email, please visit: http://solarwindow.com/join-our-email-list/.

Follow us on Twitter @solartechwindow, or follow us on Facebook.

To view the full HTML text of this release, please visit: http://solarwindow.com/media/news-events/.

Social Media Disclaimer and Forward-Looking Statements

SolarWindow investors and others should note that we announce material information to the public about the Company through a variety of means, including our website (https://www.solarwindow.com/investors), through press releases, SEC filings, public conference calls, via our corporate Twitter account (@solartechwindow), Facebook page (https://www.facebook.com/SolarWindowTechnologies) and LinkedIn page (https://www.linkedin.com/company/solar-window-technology/) in order to achieve broad, non-exclusionary distribution of information to the public and to comply with our disclosure obligations under Regulation FD. We encourage our investors and others to monitor and review the information we make public in these locations as such information could be deemed to be material information. Please note that this list may be updated from time to time.

No statement herein should be considered an offer or a solicitation of an offer for the purchase or sale of any securities. This release contains forward-looking statements that are based upon current expectations or beliefs, as well as a number of assumptions about future events. Although SolarWindow Technologies, Inc. (the “company” or “SolarWindow Technologies”) believes that the expectations reflected in the forward-looking statements and the assumptions upon which they are based are reasonable, it can give no assurance that such expectations and assumptions will prove to have been correct. Forward-looking statements, which involve assumptions and describe our future plans, strategies, and expectations, are generally identifiable by use of the words “may,” “will,” “should,” “could,” “expect,” “anticipate,” “estimate,” “believe,” “our goals,” “our mission,” “intend,” or “project” or the negative of these words or other variations on these words or comparable terminology. The reader is cautioned not to put undue reliance on these forward-looking statements, as these statements are subject to numerous factors and uncertainties, including but not limited to adverse economic conditions, intense competition, lack of meaningful research results, entry of new competitors and products, adverse federal, state and local government regulation, inadequate capital, unexpected costs and operating deficits, increases in general and administrative costs, termination of contracts or agreements, technological obsolescence of the company’s products, technical problems with the company’s research and products, price increases for supplies and components, litigation and administrative proceedings involving the company, the possible acquisition of new businesses or technologies that result in operating losses or that do not perform as anticipated, unanticipated losses, the possible fluctuation and volatility of the company’s operating results, financial condition and stock price, losses incurred in litigating and settling cases, dilution in the company’s ownership of its business, adverse publicity and news coverage, inability to carry out research, development and commercialization plans, loss or retirement of key executives and research scientists, changes in interest rates, inflationary factors, and other specific risks. There can be no assurance that further research and development will validate and support the results of our preliminary research and studies. Further, there can be no assurance that the necessary regulatory approvals will be obtained or that SolarWindow Technologies, Inc. will be able to develop commercially viable products on the basis of its technologies. In addition, other factors that could cause actual results to differ materially are discussed in the company’s most recent Form 10-Q and Form 10-K filings with the Securities and Exchange Commission. These reports and filings may be inspected and copied at the Public Reference Room maintained by the U.S. Securities & Exchange Commission at 100 F Street, N.E., Washington, D.C. 20549. You can obtain information about operation of the Public Reference Room by calling the U.S. Securities & Exchange Commission at 1-800-SEC-0330. The U.S. Securities & Exchange Commission also maintains an Internet site that contains reports, proxy and information statements, and other information regarding issuers that file electronically with the U.S. Securities & Exchange Commission at http://www.sec.gov. The company undertakes no obligation to publicly release the results of any revisions to these forward-looking statements that may be made to reflect the events or circumstances after the date hereof or to reflect the occurrence of unanticipated events.


Contacts

Amit Singh
800-213-0689
www.solarwindow.com

~159% year-to-date growth in sales order backlog reflects successful contract wins~

VANCOUVER, British Columbia--(BUSINESS WIRE)--$GRN #RNG--Greenlane Renewables Inc. (“Greenlane” or the “Company”) (TSXV: GRN), today announced its interim financial results for the second quarter ended June 30, 2020. For further information on these results, please see Greenlane’s Condensed Consolidated Interim Financial Statements and Management Discussion and Analysis. All amounts are in Canadian dollars and in accordance with IFRS.


Second Quarter Highlights Include:

  • Revenue of $4.2 million in the quarter ended June 30, 2020 representing a 45% increase from $2.9 million reported in the first quarter ended March 31, 2020 (note one).
  • Gross profit of $1.1 million, or 26% of revenue.
  • Sales order backlog (note two) of $41.9 million, a 159% increase from the $16.2 million reported on December 31, 2019. The increase reflects the successful conversion and movement of sales pipeline opportunities into sales contracts.
  • Sales pipeline (note three) valued at approximately $694 million as at June 30, 2020, versus $680 million as at December 31, 2019 and $450 million as at December 31, 2018. The sales pipeline reflects both the expansion of the project bid universe and the movement of successful contract wins into the sales order backlog.
  • Net loss of $0.9 million and Adjusted EBITDA loss of $0.5 million* in the three month period ended June 30, 2020.
  • Cash and cash equivalents of $5.3 million compared with $6.7 million as at March 31, 2020. The cash balance excludes the $1.3 million in gross proceeds from warrant exercises and the framework agreement with Pressure Technologies plc to reduce outstanding debt, both announced subsequent to quarter end.

“We successfully grew our revenue this quarter by 45% on a sequential basis while facing some tough marketplace conditions as a result of the COVID19 backdrop,” said Brad Douville, President and CEO of Greenlane. “We also achieved a third consecutive quarter of rapid growth of our sales order backlog adding $21 million from the recent and significant contract wins for dairy farm projects in California. Our focus remains on a strong second half of 2020. This trend continues so far in the third quarter highlighted by a recent contract win in Brazil, and the launch of our joint venture with SWEN Impact Fund for Transition to accelerate deployment of Greenlane’s biogas upgrading systems and solutions in Europe.”

As a reminder, the Company’s revenues are largely derived from a relatively small number of large biogas upgrader orders accounted for on a stage of completion basis over typically a nine to eighteen-month period. Timing of new contract awards varies due to customer-related factors such as finalizing technical specifications and securing project funding, permits and RNG off-take and feedstock agreements. Some projects have built-in pause periods to allow customers to complete concurrent activities such as civil work. As a result, the Company’s revenue varies from month to month and quarter-to-quarter.

The Market Outlook

The energy transition continues to gain momentum and support as global economies chart a recovery from the COVID-19 pandemic that incorporates varying levels of green initiatives, including from unlikely participants. BP, one of the largest integrated global oil and gas companies, announced this year it intends to be a net zero carbon company by 2050 or sooner by drastically cutting the carbon intensity of the products it sells and increasing the proportion of its investment into non-oil and gas businesses as it reinvents itself. S&P Global Platts Analytics, a global data analytics and research firm, recently highlighted RNG as an emerging tool for the decarbonization of energy production and subsequent consumption in both the transportation and natural gas utility sectors.

RNG continues to gain traction with natural gas utilities in their quest to remain competitive with the electricity grid relative to driving renewable content and decarbonized energy offerings. Several large utilities in the United States have recently made RNG-specific announcements: Xcel Energy has announced an initiative to explore RNG options for up to 1.8 million natural gas customers, Chesapeake Utilities is set to inject RNG directly into its East Coast gas distribution pipeline system, and Duke Energy will be injecting RNG produced from dairy farms in the southeastern United States into its national gas distribution pipeline system.

Greenlane, with visibility to more than 100 new projects, remains well positioned to capture a growing share of the RNG value chain as a leading industry provider of biogas upgrading and project development solutions.

NON-IFRS FINANCIAL MEASURES

Management evaluates the Company’s performance using a variety of measures, including “operating profit” and “Adjusted EBITDA”. The non-IFRS measures should not be considered as an alternative to or more meaningful than revenue or net loss. These measures do not have a standardized meaning prescribed by IFRS and therefore they may not be comparable to similarly titled measures presented by other publicly traded companies and should not be construed as an alternative to other financial measures determined in accordance with IFRS. The Company believes these non-GAAP financial measures provide useful information to both management and investors in measuring the financial performance and financial condition of the Company. Management uses these and other non-IFRS financial measures to exclude the impact of certain expenses and income that must be recognized under IFRS when analyzing consolidated underlying operating performance, as the excluded items are not necessarily reflective of the Company’s underlying operating performance and make comparisons of underlying financial performance between periods difficult. From time to time, the Company may exclude additional items if it believes doing so would result in a more effective analysis of underlying operating performance. The exclusion of certain items does not imply that they are non-recurring.

*Reconciliation of net loss to Adjusted EBITDA loss


Three months ended

June 30, 2020

$’000s

Net loss

(940)

Add back:


Share based compensation

36

Depreciation and amortization

379

Finance expense

128

Foreign exchange gain

(113)

Adjusted EBITDA loss

(510)

Note one - Comparison to revenue in the same period of last year is not made because of a partial quarter, with the Company completing its qualifying transaction on June 3, 2019.

Note two - Order backlog refers to the balance of unrecognized revenue from contracted projects, where such revenue is recognized over time as completion of projects progress.

Note three - Greenlane maintains a sales pipeline of prospective projects that it updates regularly based on quote activity to ensure that it is reflective of sales opportunities that can convert into orders within approximately a rolling 24 month time horizon. Not all of these potential projects will proceed or proceed within the expected timeframe and not all of the projects that do proceed will be awarded to Greenlane. Additions to the amount in the sales pipeline come from situations where the Company provides a quote on a prospective project and reductions to the sales pipeline arise when the Company loses a prospective project to a competitor, a project does not proceed or, where a quote in the pipeline is converted to Greenlane’s sales order backlog.

All filings related to the second quarter ended June 30, 2020 are available on SEDAR at www.sedar.com.

About Greenlane Renewables

Greenlane is cleaning up two of the largest and most difficult-to-decarbonize sectors of the global energy system: the natural gas grid and the transportation sector. As a leading global provider of biogas upgrading systems, Greenlane’s solutions create clean, low-carbon renewable natural gas (RNG), suitable for injection into the natural gas grid and for direct use as vehicle fuel. Our systems, marketed and sold under the Greenlane Biogas™ brand, remove impurities and separate carbon dioxide from biomethane in the raw biogas created from organic waste at landfills, wastewater treatment plants, farms and food waste facilities. With multiple core technologies, more than 100 installations in 18 countries and counting, and 30+ years’ experience, Greenlane finds the right solution, whatever the specific project requirements. Whether we’re working with waste producers, gas utilities, or project developers, we’re doing more with biogas, helping to turn a low-value product into a high-value renewable resource. For further information, please visit www.greenlanerenewables.com.

FORWARD-LOOKING INFORMATION – This news release contains “forward-looking information” within the meaning of applicable securities laws. All statements contained herein that are not historical in nature contain forward-looking information. Forward-looking information can be identified by words or phrases such as “may”, “expect”, “likely”, “should”, “would”, “plan”, “anticipate”, “intend”, “potential”, “proposed”, “estimate”, “believe” or the negative of these terms, or other similar words, expressions and grammatical variations thereof, or statements that certain events or conditions "may" or "will" happen. The forward-looking information contained in this press release, includes, but is not limited to, the continued growth in sales pipeline and sales order backlog, the ability of the joint venture company with SWEN Impact Fund for Transition to accelerate deployment of Greenlane’s biogas upgrading systems, the continued revenue growth throughout 2020 as new contract wins move out of sales order backlog and into revenue, the taking advantage of project specific return on capital while providing potential customers with complete turnkey biogas upgrading solutions, the completion of discussions with new customers to add recurring revenue and profit streams, the strong long-term return on government investment in climate-positive policies, the promising growth outlook for RNG globally, the growing movement to focus fiscal recovery packages on climate-positive policies and target investment in green energy technology, and the growing trend of natural gas utilities starting to offer customers the option of choosing RNG as an energy source. The forward-looking information contained herein is made as of the date of this press release and is based on assumptions management believed to be reasonable at the time such statements were made, including management's perceptions of future growth, results of operations, operational matters, historical trends, current conditions and expected future developments, as well as other considerations that are believed to be appropriate in the circumstances. While we consider these assumptions to be reasonable based on information currently available to management, there is no assurance that such expectations will prove to be correct. By their nature, forward-looking information is subject to inherent risks and uncertainties that may be general or specific and which give rise to the possibility that expectations, forecasts, predictions, projections or conclusions will not prove to be accurate, that assumptions may not be correct and that objectives, strategic goals and priorities will not be achieved. A variety of factors, including known and unknown risks, many of which are beyond our control, could cause actual results to differ materially from the forward-looking information in this press release. Such factors include, without limitation: risks relating to order backlog being recognized in revenue, the sales pipeline resulting in orders, the achievement of greenhouse gas reductions from the supply of RNG, the market performing as expected by management, the Company benefiting from the increasing demand for RNG. Additional risk factors can also be found in the Company's Annual Information Form, which has been filed under the Company's SEDAR profile at www.sedar.com. Readers are cautioned not to put undue reliance on forward-looking information. The Company undertakes no obligation to update or revise any forward-looking information, whether as a result of new information, future events or otherwise, except as required by applicable law. Forward-looking statements contained in this news release are expressly qualified by this cautionary statement.

FINANCIAL OUTLOOK INFORMATION – This news release contains “financial outlook information” regarding Greenlane’s prospective revenue and results, which is subject to the same assumptions, risk factors, limitations, and qualifications as set forth in the above. Revenue and other estimates contained in this news release were made by Greenlane management as of the date of this news release and are provided for the purpose of describing anticipated changes, and are not an estimate of profitability or any other measure of financial performance. Investors are cautioned that the financial outlook information contained in this news release should not be used for purposes other than for which it is disclosed herein. THE COMPANY QUALIFIES ALL THE FORWARD LOOKING STATEMENTS AND FINANCIAL OUTLOOK INFORMATION CONTAINED IN THIS NEWS RELEASE BY THE FOREGOING CAUTIONARY STATEMENTS.

Neither the TSX Venture Exchange nor its Regulation Services Provider (as that term is defined in the policies of the TSX Venture Exchange) accepts responsibility for the adequacy or accuracy of this release or has in any way approved or disapproved of the contents of this news release.


Contacts

Incite Capital Markets
Eric Negraeff / Darren Seed
Greenlane Renewables Inc.
Brad Douville, President & CEO,
Ph: 604.493.2004
Email: This email address is being protected from spambots. You need JavaScript enabled to view it.

DOUGLAS COUNTY, Wash.--(BUSINESS WIRE)--Global technology and power solutions leader Cummins Inc. (NYSE: CMI) will provide its 5-megawatt PEM electrolyzer to enable renewable energy for the Douglas County Public Utility District (Douglas County PUD) in Washington state. The Cummins electrolyzer will be dedicated to producing hydrogen from renewable energy and will be the largest, as well as first of its kind in use by a public utility, in the United States.


Expected to be operational in 2021, the new renewable hydrogen facility allows the Douglas County PUD to manufacture commercial hydrogen using electrolysis to harvest hydrogen from water from Wells Dam on the Columbia River. The PEM electrolyzer system, which stands for proton exchange membrane, takes the excess renewable energy and through a chemical reaction splits water into hydrogen and oxygen. The hydrogen acts as an energy carrier and the oxygen is released into the air. The hydrogen can then be stored in a gas or liquid state to be used in a multitude of applications, including fuel cell electric mobility. The electrolyzer is powered by clean hydroelectricity, so the production of hydrogen does not generate any carbon emissions.

“At Cummins, we believe that scaling hydrogen technologies will continue to grow low-carbon solutions,” said Amy Davis, Cummins Vice President and President of New Power, the company’s alternative power business. “It takes enterprises, governments and utilities working together, like what we have done with Douglas County PUD, to make alternative power a reality and promote a more sustainable world. Douglas County PUD is just one example of how Cummins is expanding the energy market and driving new power solutions for our customers.”

The electrolyzer technology provides a means to address one of the largest dilemmas in the renewable energy industry, which is how to store the energy when it’s not in demand. Cummins’ PEM electrolyzers, like Douglas County PUD’s electrolyzer plant, enables utilities to store the excess energy that they would typically sell off to the market at a financial loss, or not harness at all, and instead store that energy to sell into a new green hydrogen market. Additionally, it creates a way for utilities to engage in new market opportunities outside of their typical service area, removing growth barriers often faced in the industry.

“Douglas County PUD is excited to work with Cummins’ Fuel Cell and Hydrogen Technologies on our 5-megawatt hydrogen electrolyzer project. This hydrogen plant will create efficiencies for our Wells Hydroelectric Project and create a new renewable hydrogen gas resource for our community,” said Gary Ivory, General Manager of Douglas County PUD. “As the first renewable hydrogen production plant in Washington State, we understand the importance of great partners, and we believe Cummins’ will help us build a successful project.”

This electrolyzer project is a part of an initial 5-megawatt project made possible by the passage of Senate Bill 5588 in Washington state last year, which authorized public utility districts to make and sell hydrogen. It will be built in the Baker Flats Industrial Park, which is located outside East Wenatchee and will use surplus hydropower from the Wells Dam Facility to produce renewable hydrogen.

“This project is a watershed, a first step into the huge economic and environmental opportunity that our growing use of clean power offers,” said Ken Dragoon, Executive Director of the Renewable Hydrogen Alliance. “For the first time, the Northwest will produce clean fuels from renewable electricity—and the Douglas County PUD’s innovative plan will use their electrolyzer’s flexibility to free up valuable capacity on their dam.”

Already a leader in advanced diesel, natural gas and battery technologies, Cummins is rapidly growing its hydrogen capabilities and the company continues to deepen its expertise in fuel cell technologies. Cummins uses fuel cell and hydrogen technologies to power a variety of applications, including transit buses, semi-trucks, delivery trucks, refuse trucks and passenger trains and has made several announcements in the past year related to hydrogen and fuel cell technologies. These include the acquisition of Hydrogenics Corporation in September 2019, providing Cummins with both PEM, alkaline fuel cells, and electrolyzers used to generate hydrogen. Cummins has also invested in LOOP Energy, signed a memo of understanding with Hyundai Motor Company, entered an agreement to form a joint venture with NPROXX, and invested in the development of solid oxide fuel cells. For more examples of how Cummins has supported new firsts in the fuel cell and hydrogen industry and for more information about Cummins Fuel Cell and Hydrogen Technologies, please visit www.cummins.com/hydrogen.

About Cummins Inc.

Cummins Inc., a global power leader, is a corporation of complementary business segments that design, manufacture, distribute and service a broad portfolio of power solutions. The company’s products range from diesel, natural gas, electric and hybrid powertrains and powertrain-related components including filtration, aftertreatment, turbochargers, fuel systems, controls systems, air handling systems, automated transmissions, electric power generation systems, batteries, electrified power systems, hydrogen generation and fuel cell products. Headquartered in Columbus, Indiana (U.S.), since its founding in 1919, Cummins employs approximately 61,600 people committed to powering a more prosperous world through three global corporate responsibility priorities critical to healthy communities: education, environment and equality of opportunity. Cummins serves its customers online, through a network of company-owned and independent distributor locations, and through thousands of dealer locations worldwide and earned about $2.3 billion on sales of $23.6 billion in 2019. See how Cummins is powering a world that’s always on by accessing news releases and more information at https://www.cummins.com/always-on.


Contacts

Jon Mills
Cummins Inc.
Phone: 317-658-4540
Email: This email address is being protected from spambots. You need JavaScript enabled to view it.

HAMILTON, Bermuda--(BUSINESS WIRE)--August 25, 2020 -- Triton International Limited (NYSE: TRTN) announced today that it has priced an offering of $1,300,000,000 Fixed Rate Asset-Backed Series 2020-1 Class A Notes at an annual yield of 2.123% and $65,800,000 Fixed Rate Asset-Backed Series 2020-1 Class B Notes at an annual yield of 3.773% (collectively, the “Notes”).


The net proceeds from the Notes offering will be used to repay at par all of the existing asset-backed notes issued by Triton Container Finance VI LLC, which have an outstanding principal balance of $1.2 billion and a weighted average coupon of 3.88%, and for general corporate purposes. The transaction is expected to close on or about September 21, 2020.

The Notes will be issued by Triton Container Finance VIII LLC, a wholly-owned subsidiary of Triton Container International Limited (the “Issuer”). The Notes will be secured by a pool of containers and related assets owned by the Issuer. The Issuer will be the sole obligor on the Notes; the Notes will not be obligations of or guaranteed by Triton International Limited or any of its other subsidiaries.

About the Notes

The Series 2020-1 Class A Notes, which are expected to be rated “A” by Standard & Poor’s, will be issued with a coupon of 2.11% per annum and an annual yield of 2.123%. The Series 2020-1 Class B Notes, which are expected to be rated “BBB” by Standard & Poor’s, will be issued with a coupon of 3.74% per annum and an annual yield of 3.773%. The Series 2020-1 Notes will have a legal final maturity date of September 20, 2045. The transaction documents contain customary affirmative and negative covenants, financial covenants, representations and warranties, and events of default, which are subject to various exceptions and qualifications.

The Notes were offered within the United States only to qualified institutional investors pursuant to Rule 144A under the Securities Act of 1933, as amended (the “Securities Act”), to institutional “accredited investors” as defined in Rule 501(a)(1), (2), (3) or (7) under the Securities Act and to persons outside the United States in compliance with Regulation S under the Securities Act. The Notes have not been registered under the Securities Act, or any state securities laws, and unless so registered, may not be offered or sold in the United States except pursuant to an exemption from, or in a transaction not subject to, the registration requirements of the Securities Act and applicable state securities laws.

This press release does not constitute an offer to sell or the solicitation of an offer to buy any security and shall not constitute an offer, solicitation or sale in any jurisdiction in which such offering would be unlawful.

About Triton International Limited

Triton International Limited is the world’s largest lessor of intermodal freight containers. Triton operates a container fleet of over six million twenty-foot equivalent units ("TEU"), and its global operations include acquisition, leasing, re-leasing and subsequent sale of multiple types of intermodal containers and chassis.

Important Cautionary Information Regarding Forward-Looking Statements

Certain statements in this release, other than purely historical information, including statements about the offering, the scheduled closing of the offering, the intended use of proceeds of the offering and the expected rating of the Notes, are "forward-looking statements" within the meaning of the Private Securities Litigation Reform Act of 1995, Section 27A of the Securities Act of 1933, as amended, and Section 21E of the Securities Exchange Act of 1934, as amended. Statements that include the words "expect," "intend," "plan," "believe," "project," "anticipate," "will," "may," "would" and similar statements of a future or forward-looking nature may be used to identify forward-looking statements. All forward-looking statements address matters that involve risks and uncertainties, many of which are beyond Triton's control. Accordingly, there are important factors that could cause actual results to differ materially from those indicated in such statements and, therefore, you should not place undue reliance on any such statements.

These factors include, without limitation, those risk factors included in the offering memorandum for the Notes, changes in the financial markets, including changes in credit markets, interest rates and securitization markets generally, economic, business, competitive, market and regulatory conditions and the following: the impact of COVID-19 on our business and financial results; decreases in the demand for leased containers; decreases in market leasing rates for containers; difficulties in re-leasing containers after their initial fixed-term leases; our customers' decisions to buy rather than lease containers; our dependence on a limited number of customers for a substantial portion of our revenues; customer defaults; decreases in the selling prices of used containers; extensive competition in the container leasing industry; difficulties stemming from the international nature of our business; decreases in the demand for international trade; disruption to our operations resulting from the political and economic policies of the United States and other countries, particularly China, including but not limited to the impact of trade wars and tariffs; disruption to our operations from failures of, or attacks on, our information technology systems; disruption to our operations as a result of natural disasters; our compliance or failure to comply with laws and regulations related to economic and trade sanctions, security, anti-terrorism, environmental protection and corruption; our ability to obtain sufficient capital to support our growth; restrictions imposed by the terms of our debt agreements; changes in tax laws in, Bermuda, the United States and other countries and other risks and uncertainties, including those risk factors set forth in the section entitled "Risk Factors" in our Form 10-K filed with the Securities and Exchange Commission ("SEC"), on February 14, 2020, in any Form 10-Q filed or to be filed by Triton, and in other documents we file with the SEC from time to time. Except to the extent required by applicable law, we undertake no obligation to update publicly or revise any forward-looking statement, whether as a result of new information, future developments or otherwise.


Contacts

Andrew Greenberg
Senior Vice President
Business Development & Investor Relations
(914) 697-2900

KANSAS CITY, Mo.--(BUSINESS WIRE)--Kansas City Southern (KCS) (NYSE: KSU) Executive Vice President and Chief Financial Officer, Michael W. Upchurch, will address three conferences in September, 2020:


  • Cowen’s 2020 Global Transportation & Sustainable Mobility Conference on Wednesday, September 9, 2020 at 10:00 a.m. eastern time
  • J.P. Morgan’s 11th Annual U.S. All Stars Conference on Wednesday, September 16, 2020 at 10:00 a.m. eastern time
  • Morgan Stanley’s Virtual 8th Annual Laguna Conference on Thursday, September 17, 2020 at 4:30 p.m. eastern time

All conference presentations will take place via webcast. Interested investors may access the webcast on KCS’ website at http://investors.kcsouthern.com. A link to the replay will be available following the event.

Headquartered in Kansas City, Mo., Kansas City Southern (KCS) (NYSE: KSU) is a transportation holding company that has railroad investments in the U.S., Mexico and Panama. Its primary U.S. holding is The Kansas City Southern Railway Company, serving the central and south central U.S. Its international holdings include Kansas City Southern de Mexico, S.A. de C.V., serving northeastern and central Mexico and the port cities of Lázaro Cárdenas, Tampico and Veracruz, and a 50 percent interest in Panama Canal Railway Company, providing ocean-to-ocean freight and passenger service along the Panama Canal. KCS' North American rail holdings and strategic alliances with other North American rail partners are primary components of a unique railway system, linking the commercial and industrial centers of the U.S., Mexico and Canada. More information about KCS can be found at www.kcsouthern.com


Contacts

KCS: Ashley Thorne, 816-983-1530, This email address is being protected from spambots. You need JavaScript enabled to view it.

Also Forms Element Resources, an Independent Recycling Company and Tolling Partner for the Battery Industry

GREENWICH, Conn.--(BUSINESS WIRE)--Atlas Holdings today announced the launch of standalone companies Stryten Manufacturing and Element Resources following its acquisition of substantially all the operating assets of the Americas business of Exide Technologies, LLC. The transaction completes a court-supervised sale process, pursuant to Section 363 of the U.S. Bankruptcy code.


The newly formed Stryten Manufacturing, www.stryten.com, headquartered in Milton, Georgia, is a leading provider of innovative energy storage solutions. The company combines more than 130 years of experience manufacturing high-quality, top-performing batteries with deep industry expertise, providing the marketplace with smart power solutions to keep people and industry moving every day. Stryten operates seven manufacturing plants strategically positioned across the United States to serve the evolving needs of its customers and partners. Stryten Manufacturing will be led by Tim Vargo, Chief Executive Officer and Mike Judd, President and Chief Operating Officer.

Also launched today is Element Resources, which owns and operates recycling plants in Canon Hollow, Missouri and Muncie, Indiana. These facilities provide environmentally responsible recycling services to Stryten Manufacturing and other battery manufacturers.

We are thrilled to officially launch Stryten Manufacturing with our new colleagues at Atlas Holdings,” said Tim Vargo, CEO of Stryten. “Atlas is the ideal partner for us as they believe in growing and strengthening manufacturing companies for the long-term. They provide us with stability, unique operational expertise and a shared commitment to superior customer service. Together with Atlas, we’ll start today in writing the next great chapter for our company.”

Stryten Manufacturing and Element Resources are well-positioned for a very strong future, led by teams of experienced leaders and dedicated associates, and we are very pleased to welcome them all to the Atlas Family,” said Jacob Hudson, Managing Partner of Atlas Holdings. “With the successful conclusion of the 363 sale process, they can now concentrate on doing what they do best – delivering innovative and reliable power solutions to a broad range of blue-chip customers.”

Stryten Manufacturing supplies car, truck, SUV, marine and lawn and garden battery needs for large consumer retail companies and battery distribution partners. The company’s GNB Industrial Power business underpins critical supply chains with motive power batteries and power management solutions for forklift manufacturers and operators in material handling applications, as well as railroad transportation companies. GNB network power batteries serve the uninterruptible power supply (UPS) and back-up energy storage needs of telecommunications and utility providers. For more than a century, GNB has also proudly provided the U.S. Navy submarine fleet with state-of-the-art battery systems.

About Stryten Manufacturing

Stryten Manufacturing, www.stryten.com, is a leading provider of stored electrical-energy solutions for the Transportation and Industrial markets. Headquartered in Milton, Georgia, the company operates transportation plants in Salina, Kansas, Manchester, Iowa and industrial facilities in Ft. Smith, Arkansas, Kansas City, Kansas, and Charlottesville, Virginia. Its manufacturing plants are located Kansas City, Missouri, and Lampeter, Pennsylvania. These locations produce a comprehensive portfolio of battery and energy storage systems and specialty applications for the Transportation, Network Power and Motive Power markets. Also served are industries such as agricultural, automotive, heavy-duty truck, marine, materials handling, military, mining, railroad, security, telecommunications, utility and uninterruptible power supply (UPS), among others.

About Element Resources

Element Resources is one of the nation’s largest secondary recyclers of lead batteries used to power Transportation and Industrial market applications. With recycling plants located in Canon Hollow, Missouri, and Muncie, Indiana, Element Resources is committed to operating in an environmentally responsible way to ensure more than 16 million lead batteries are safely recycled each year, contributing the sustainability of the lead battery industry.

About Atlas Holdings

Headquartered in Greenwich, Connecticut and founded in 2002, Atlas and its affiliates own and operate 21 platform companies, which employ approximately 22,000 associates at more than 150 facilities worldwide. Atlas operates in sectors such as aluminum processing, automotive, building materials, capital equipment, construction services, food manufacturing and distribution, packaging, paper, power generation, pulp, supply chain management and wood products. Atlas’ companies together generate more than 6 billion dollars in revenues annually. For additional information, please visit www.atlasholdingsllc.com.


Contacts

Emily D’Alberto
This email address is being protected from spambots. You need JavaScript enabled to view it.
(908) 789-1380

Offshore Source Logo

Offshore Source keeps you updated with relevant information concerning the Offshore Energy Sector.

Any views or opinions represented on this website belong solely to the author and do not represent those of the people, institutions or organizations that Offshore Source or collaborators may or may not have been associated with in a professional or personal capacity, unless explicitly stated.

Corporate Offices

Technology Systems Corporation
8502 SW Kansas Ave
Stuart, FL 34997

info@tscpublishing.com