Business Wire News

  • Reported net loss attributable to Valero stockholders of $464 million, or $1.14 per share.
  • Reported adjusted net loss attributable to Valero stockholders of $472 million, or $1.16 per share.
  • Issued $2.5 billion of Senior Notes for general corporate purposes.
  • 2020 and 2021 capital investments attributable to Valero forecasted at $2.0 billion for each year.
  • Returned $399 million in cash to stockholders through dividends.

SAN ANTONIO--(BUSINESS WIRE)--Valero Energy Corporation (NYSE: VLO, “Valero”) today reported a net loss attributable to Valero stockholders of $464 million, or $1.14 per share, for the third quarter of 2020 compared to net income of $609 million, or $1.48 per share, for the third quarter of 2019. Excluding the adjustments shown in the accompanying earnings release tables, the adjusted net loss attributable to Valero stockholders was $472 million, or $1.16 per share, for the third quarter of 2020, compared to third quarter 2019 adjusted net income attributable to Valero stockholders of $642 million, or $1.55 per share. Third quarter 2020 adjusted results primarily exclude the benefit from an after-tax lower of cost or market, or LCM, inventory valuation adjustment of $250 million and an after-tax loss of $218 million for an expected LIFO liquidation.


Refining

The refining segment reported a $629 million operating loss for the third quarter of 2020 compared to operating income of $1.1 billion for the third quarter of 2019. Excluding the LCM inventory valuation adjustment, the expected LIFO liquidation adjustment, and other operating expenses, the third quarter 2020 adjusted operating loss was $575 million. Refinery throughput volumes averaged 2.5 million barrels per day in the third quarter of 2020, which was 428 thousand barrels per day lower than the third quarter of 2019.

“As the global economy recovers, we are pleased to see a demand recovery for gasoline, diesel and jet fuel in the third quarter” said Joe Gorder, Valero Chairman and Chief Executive Officer. “Our unmatched execution, while being the lowest cost producer, and ample liquidity continue to position us well to manage a low margin environment.”

Renewable Diesel

The renewable diesel segment reported $184 million of operating income for the third quarter of 2020 compared to $65 million for the third quarter of 2019. After adjusting for the retroactive blender’s tax credit, renewable diesel operating income was $123 million for the third quarter of 2019. Renewable diesel sales volumes averaged 870 thousand gallons per day in the third quarter of 2020, an increase of 232 thousand gallons per day versus the third quarter of 2019. The third quarter of 2019 results and volumes were impacted by the planned downtime of the Diamond Green Diesel (DGD) plant for maintenance. DGD set a record for sales volumes in the third quarter of 2020.

Ethanol

The ethanol segment reported $22 million of operating income for the third quarter of 2020, compared to a $43 million operating loss for the third quarter of 2019. Third quarter 2020 adjusted operating income was $36 million. Ethanol production volumes averaged 3.8 million gallons per day in the third quarter of 2020, which was 206 thousand gallons per day lower than the third quarter of 2019. The increase in operating income was attributed primarily to higher margins resulting from lower corn prices.

Corporate and Other

General and administrative expenses were $186 million in the third quarter of 2020 compared to $217 million in the third quarter of 2019. The effective tax rate for the third quarter of 2020 was 47 percent, which was primarily impacted by an expected U.S. federal tax net operating loss that will be carried back to 2015 when the U.S. federal statutory tax rate was 35 percent.

Investing and Financing Activities

Capital investments totaled $517 million in the third quarter of 2020, of which $205 million was for sustaining the business, including costs for turnarounds, catalysts and regulatory compliance. Excluding capital investments attributable to our partner’s 50 percent share of DGD and those related to other variable interest entities, capital investments attributable to Valero were $393 million.

Net cash provided by operating activities was $165 million in the third quarter of 2020. Included in this amount was a $246 million favorable impact from working capital, as well as our joint venture partner’s share of DGD’s net cash provided by operating activities, excluding changes in its working capital. Excluding these items, adjusted net cash used by operating activities was $177 million.

Valero returned $399 million to stockholders through dividends in the third quarter of 2020, resulting in a year-to-date total payout ratio of 165 percent of adjusted net cash provided by operating activities. The year-to-date total payout ratio is higher than our long-term target due to the adverse economic impact of COVID-19.

Valero continues to target a long-term total payout ratio between 40 and 50 percent of adjusted net cash provided by operating activities. Valero defines total payout ratio as the sum of dividends and stock buybacks divided by net cash provided by operating activities adjusted for changes in working capital and DGD’s net cash provided by operating activities, excluding changes in its working capital, attributable to our joint venture partner’s ownership interest in DGD.

“The guiding principles underpinning our capital allocation strategy remain unchanged,” said Gorder. “There has been absolutely no change in our strategy, which prioritizes our investment grade ratings, sustaining investments and honoring our dividend.”

Liquidity and Financial Position

Valero ended the third quarter of 2020 with $15.2 billion of total debt and finance lease obligations and $4.0 billion of cash and cash equivalents. The debt to capitalization ratio, net of cash and cash equivalents, was 36 percent as of September 30, 2020.

Strategic Update

Capital investments attributable to Valero are forecasted at $2.0 billion per year in 2020 and 2021, of which approximately 60 percent is for sustaining the business and approximately 40 percent is for growth projects. Approximately 40 percent of Valero’s 2020 and 2021 growth capital is allocated to expanding the renewable diesel business.

The new St. Charles Alkylation Unit, which is designed to convert low-value feedstocks into a premium alkylate product, is on track to be completed in the fourth quarter of this year. The Diamond Pipeline expansion and the Pembroke Cogen project are expected to be completed in 2021 and the Port Arthur Coker project is expected to be completed in 2023.

Valero and its joint venture partner in DGD continue to pursue growth in the low-carbon renewable diesel business. The DGD plant expansion is still expected to be completed in 2021, and as previously announced, DGD continues to make progress on the advanced engineering and development cost review for a potential new 400 million gallons per year renewable diesel plant at Valero’s Port Arthur, Texas facility. If the project is approved, operations are expected to commence in 2024, increasing DGD’s production capacity to over 1.1 billion gallons annually.

“We remain steadfast in the execution of our strategy, pursuing excellence in operations, investing in earnings growth with lower volatility and honoring our commitment to shareholder returns,” said Gorder.

Conference Call

Valero’s senior management will hold a conference call at 10 a.m. ET today to discuss this earnings release and to provide an update on operations and strategy.

About Valero

Valero Energy Corporation, through its subsidiaries (collectively, “Valero”), is an international manufacturer and marketer of transportation fuels and petrochemical products. Valero is a Fortune 50 company based in San Antonio, Texas, and it operates 15 petroleum refineries with a combined throughput capacity of approximately 3.2 million barrels per day and 14 ethanol plants with a combined production capacity of approximately 1.73 billion gallons per year. The petroleum refineries are located in the United States (U.S.), Canada and the United Kingdom (U.K.), and the ethanol plants are located in the Mid-Continent region of the U.S. Valero is also a joint venture partner in Diamond Green Diesel, which operates a renewable diesel plant in Norco, Louisiana. Diamond Green Diesel is North America’s largest biomass-based diesel plant. Valero sells its products in the wholesale rack or bulk markets in the U.S., Canada, the U.K., Ireland and Latin America. Approximately 7,000 outlets carry Valero’s brand names. Please visit www.valero.com for more information.

Valero Contacts

Investors:

Homer Bhullar, Vice President – Investor Relations, 210-345-1982

Eric Herbort, Senior Manager – Investor Relations, 210-345-3331

Gautam Srivastava, Manager – Investor Relations, 210-345-3992

Media:

Lillian Riojas, Executive Director – Media Relations and Communications, 210-345-5002

Safe-Harbor Statement

Statements contained in this release that state the company’s or management’s expectations or predictions of the future are forward-looking statements intended to be covered by the safe harbor provisions of the Securities Act of 1933 and the Securities Exchange Act of 1934. The words “believe,” “expect,” “should,” “estimates,” “intend,” “target,” “will,” “plans,” and other similar expressions identify forward-looking statements. It is important to note that actual results could differ materially from those projected in such forward-looking statements based on numerous factors, including those outside of the company’s control, such as delays in construction timing and other factors, including but not limited to the impacts of COVID-19. For more information concerning factors that could cause actual results to differ from those expressed or forecasted, see Valero’s annual reports on Form 10-K, quarterly reports on Form 10-Q, and other reports filed with the Securities and Exchange Commission and available on Valero’s website at www.valero.com.

COVID-19 Disclosure

The global pandemic has significantly reduced global economic activity and resulted in airlines dramatically cutting back on flights and a decrease in motor vehicle use. As a result, there has also been a decline in the demand for, and thus also the market prices of, crude oil and certain of our products, particularly our refined petroleum products. Many uncertainties remain with respect to COVID-19, including its resulting economic effects and any future recovery, and we are unable to predict the ultimate economic impacts from COVID-19, how quickly national economies can recover once the pandemic subsides, or whether any recovery will ultimately experience a reversal or other setbacks. However, the adverse impact of the economic effects on us has been and will likely continue to be significant. We believe we have proactively addressed many of the known impacts of COVID-19 to the extent possible and will strive to continue to do so, but there can be no guarantee that these measures will be fully effective. For more information, see our quarterly reports on Form 10-Q and other reports filed with the Securities and Exchange Commission.

Use of Non-GAAP Financial Information

This earnings release and the accompanying earnings release tables include references to financial measures that are not defined under U.S. generally accepted accounting principles (GAAP). These non-GAAP measures include adjusted net income (loss) attributable to Valero stockholders, adjusted earnings (loss) per common share – assuming dilution, refining margin, renewable diesel margin, ethanol margin, adjusted refining operating income (loss), adjusted renewable diesel operating income, adjusted ethanol operating income (loss), adjusted net cash provided by operating activities, and capital investments attributable to Valero. These non-GAAP financial measures have been included to help facilitate the comparison of operating results between periods. See the accompanying earnings release tables for a reconciliation of non-GAAP measures to their most directly comparable U.S. GAAP measures. Note (g) to the earnings release tables provides reasons for the use of these non-GAAP financial measures.

VALERO ENERGY CORPORATION

EARNINGS RELEASE TABLES

FINANCIAL HIGHLIGHTS

(millions of dollars, except per share amounts)

(unaudited)


Three Months Ended
September 30,


Nine Months Ended
September 30,


2020


2019


2020


2019

Statement of income data


Revenues

$

15,809


$

27,249


$

48,308


$

80,445


Cost of sales:


Cost of materials and other (a) (b)

14,801


24,335


43,832


72,396


Lower of cost or market (LCM) inventory valuation adjustment (c)

(313)


(19)


Operating expenses (excluding depreciation and

amortization expense reflected below)

1,117


1,239


3,268


3,629


Depreciation and amortization expense (d)

602


556


1,737


1,645


Total cost of sales

16,207


26,130


48,818


77,670


Other operating expenses

25


10


30


14


General and administrative expenses (excluding

depreciation and amortization expense reflected below)

186


217


532


625


Depreciation and amortization expense

12


11


37


39


Operating income (loss)

(621)


881


(1,109)


2,097


Other income, net (e)

48


34


107


68


Interest and debt expense, net of capitalized interest

(143)


(111)


(410)


(335)


Income (loss) before income tax expense (benefit)

(716)


804


(1,412)


1,830


Income tax expense (benefit)

(337)


165


(614)


376


Net income (loss)

(379)


639


(798)


1,454


Less: Net income attributable to noncontrolling interests (b)

85


30


264


92


Net income (loss) attributable to Valero Energy Corporation

stockholders

$

(464)


$

609


$

(1,062)


$

1,362


Earnings (loss) per common share

$

(1.14)


$

1.48


$

(2.62)


$

3.28


Weighted-average common shares outstanding (in millions)

407


412


407


415


Earnings (loss) per common share – assuming dilution

$

(1.14)


$

1.48


$

(2.62)


$

3.28


Weighted-average common shares outstanding –

assuming dilution (in millions) (f)

407


413


407


416


See Notes to Earnings Release Tables.

VALERO ENERGY CORPORATION

EARNINGS RELEASE TABLES

FINANCIAL HIGHLIGHTS BY SEGMENT

(millions of dollars)

(unaudited)


Refining


Renewable
Diesel


Ethanol


Corporate
and
Eliminations


Total

Three months ended September 30, 2020


Revenues:


Revenues from external customers

$

14,727


$

305


$

777


$


$

15,809


Intersegment revenues

2


40


58


(100)


Total revenues

14,729


345


835


(100)


15,809


Cost of sales:


Cost of materials and other (a) (b)

14,103


128


670


(100)


14,801


LCM inventory valuation adjustment (c)

(296)


(17)


(313)


Operating expenses (excluding depreciation and

amortization expense reflected below)

989


23


105


1,117


Depreciation and amortization expense (d)

538


10


54


602


Total cost of sales

15,334


161


812


(100)


16,207


Other operating expenses

24


1


25


General and administrative expenses (excluding

depreciation and amortization expense reflected

below)


186


186


Depreciation and amortization expense


12


12


Operating income (loss) by segment

$

(629)


$

184


$

22


$

(198)


$

(621)


Three months ended September 30, 2019


Revenues:


Revenues from external customers

$

26,145


$

212


$

891


$

1


$

27,249


Intersegment revenues

2


50


57


(109)


Total revenues

26,147


262


948


(108)


27,249


Cost of sales:


Cost of materials and other

23,432


164


847


(108)


24,335


Operating expenses (excluding depreciation and

amortization expense reflected below)

1,100


18


121


1,239


Depreciation and amortization expense

518


15


23


556


Total cost of sales

25,050


197


991


(108)


26,130


Other operating expenses

10


10


General and administrative expenses (excluding

depreciation and amortization expense reflected

below)


217


217


Depreciation and amortization expense


11


11


Operating income (loss) by segment

$

1,087


$

65


$

(43)


$

(228)


$

881


See Operating Highlights by Segment.

See Notes to Earnings Release Tables.


VALERO ENERGY CORPORATION

EARNINGS RELEASE TABLES

FINANCIAL HIGHLIGHTS BY SEGMENT

(millions of dollars)

(unaudited)


Refining


Renewable
Diesel


Ethanol


Corporate
and
Eliminations


Total

Nine months ended September 30, 2020


Revenues:


Revenues from external customers

$

45,327


$

850


$

2,131


$


$

48,308


Intersegment revenues

6


150


160


(316)


Total revenues

45,333


1,000


2,291


(316)


48,308


Cost of sales:


Cost of materials and other (a) (b)

41,769


393


1,984


(314)


43,832


LCM inventory valuation adjustment (c)

(19)


(19)


Operating expenses (excluding depreciation and

amortization expense reflected below)

2,912


63


293


3,268


Depreciation and amortization expense (d)

1,607


33


97


1,737


Total cost of sales

46,269


489


2,374


(314)


48,818


Other operating expenses

29


1


30


General and administrative expenses (excluding

depreciation and amortization expense reflected

below)


532


532


Depreciation and amortization expense


37


37


Operating income (loss) by segment

$

(965)


$

511


$

(84)


$

(571)


$

(1,109)


Nine months ended September 30, 2019


Revenues:


Revenues from external customers

$

77,109


$

686


$

2,648


$

2


$

80,445


Intersegment revenues

12


174


162


(348)


Total revenues

77,121


860


2,810


(346)


80,445


Cost of sales:


Cost of materials and other

69,769


577


2,396


(346)


72,396


Operating expenses (excluding depreciation and

amortization expense reflected below)

3,197


54


378


3,629


Depreciation and amortization expense

1,539


38


68


1,645


Total cost of sales

74,505


669


2,842


(346)


77,670


Other operating expenses

13


1


14


General and administrative expenses (excluding

depreciation and amortization expense reflected

below)


625


625


Depreciation and amortization expense


39


39


Operating income (loss) by segment

$

2,603


$

191


$

(33)


$

(664)


$

2,097


See Operating Highlights by Segment.

See Notes to Earnings Release Tables.

VALERO ENERGY CORPORATION

EARNINGS RELEASE TABLES

RECONCILIATION OF NON-GAAP MEASURES TO MOST COMPARABLE AMOUNTS

REPORTED UNDER U.S. GAAP (g)

(millions of dollars, except per share amounts)

(unaudited)


Three Months Ended
September 30,


Nine Months Ended
September 30,


2020


2019


2020


2019


Reconciliation of net income (loss) attributable to Valero

Energy Corporation stockholders to adjusted net income

(loss) attributable to Valero Energy Corporation

stockholders


Net income (loss) attributable to Valero Energy Corporation

stockholders

$

(464)


$

609


$

(1,062)


$

1,362


Adjustments:


Last-in, first-out (LIFO) liquidation adjustment (a)

326


326


Income tax benefit related to the LIFO liquidation

adjustment

(108)


(108)


LIFO liquidation adjustment, net of taxes

218


218


Change in estimated useful life (d)

30


30


Income tax benefit related to the change in estimated

useful life

(6)


(6)


Change in estimated useful life, net of taxes

24


24


LCM inventory valuation adjustment (c)

(313)


(19)


Income tax expense related to the LCM inventory

valuation adjustment

63


3


LCM inventory valuation adjustment, net of taxes

(250)


(16)


2019 blender’s tax credit attributable to Valero Energy

Corporation stockholders (b)


33


112


Income tax expense related to 2019 blender’s tax credit


(3)


2019 blender’s tax credit attributable to Valero Energy

Corporation stockholders, net of taxes


33


109


Loss on early redemption of debt (e)


22


Income tax benefit related to loss on early

redemption of debt


(5)


Loss on early redemption of debt, net of taxes


17


Total adjustments

(8)


33


226


126


Adjusted net income (loss) attributable to

Valero Energy Corporation stockholders

$

(472)


$

642


$

(836)


$

1,488


Reconciliation of earnings (loss) per common share –

assuming dilution to adjusted earnings (loss) per common

share – assuming dilution


Earnings (loss) per common share – assuming dilution (f)

$

(1.14)


$

1.48


$

(2.62)


$

3.28


Adjustments:


LIFO liquidation adjustment (a)

0.53


0.53


Change in estimated useful life (d)

0.06


0.06


LCM inventory valuation adjustment (c)

(0.61)


(0.04)


2019 blender’s tax credit attributable to Valero Energy

Corporation stockholders (b)


0.07


0.26


Loss on early redemption of debt (e)


0.04


Total adjustments

(0.02)


0.07


0.55


0.30


Adjusted earnings (loss) per common share –

assuming dilution (f)

$

(1.16)


$

1.55


$

(2.07)


$

3.58


See Notes to Earnings Release Tables.

VALERO ENERGY CORPORATION

EARNINGS RELEASE TABLES

RECONCILIATION OF NON-GAAP MEASURES TO MOST COMPARABLE AMOUNTS

REPORTED UNDER U.S. GAAP (g)

(millions of dollars)

(unaudited)


Three Months Ended
September 30,


Nine Months Ended
September 30,


2020


2019


2020


2019

Reconciliation of operating income (loss) by segment to

segment margin, and reconciliation of operating income

(loss) by segment to adjusted operating income (loss) by

segment


Refining segment


Refining operating income (loss)

$

(629)


$

1,087


$

(965)


$

2,603


Adjustments:


2019 blender’s tax credit (b)


4


13


LIFO liquidation adjustment (a)

326


326


LCM inventory valuation adjustment (c)

(296)


(19)


Operating expenses (excluding depreciation and

amortization expense reflected below)

989


1,100


2,912


3,197


Depreciation and amortization expense

538


518


1,607


1,539


Other operating expenses

24


10


29


13


Refining margin

$

952


$

2,719


$

3,890


$

7,365


Refining operating income (loss)

$

(629)


$

1,087


$

(965)


$

2,603


Adjustments:


2019 blender’s tax credit (b)


4


13


LIFO liquidation adjustment (a)

326


326


LCM inventory valuation adjustment (c)

(296)


(19)


Other operating expenses

24


10


29


13


Adjusted refining operating income (loss)

$

(575)


$

1,101


$

(629)


$

2,629


Renewable diesel segment


Renewable diesel operating income

$

184


$

65


$

511


$

191


Adjustments:


2019 blender’s tax credit (b)


58


198


Operating expenses (excluding depreciation and

amortization expense reflected below)

23


18


63


54


Depreciation and amortization expense

10


15


33


38


Renewable diesel margin

$

217


$

156


$

607


$

481


Renewable diesel operating income

$

184


$

65


$

511


$

191


Adjustment: 2019 blender’s tax credit (b)


58


198


Adjusted renewable diesel operating income

$

184


$

123


$

511


$

389


See Notes to Earnings Release Tables.

VALERO ENERGY CORPORATION

EARNINGS RELEASE TABLES

RECONCILIATION OF NON-GAAP MEASURES TO MOST COMPARABLE AMOUNTS

REPORTED UNDER U.S. GAAP (g)

(millions of dollars)

(unaudited)


Three Months Ended
September 30,


Nine Months Ended
September 30,


2020


2019


2020


2019

Reconciliation of operating income (loss) by segment to

segment margin, and reconciliation of operating income

(loss) by segment to adjusted operating income (loss) by

segment (continued)


Ethanol segment


Ethanol operating income (loss)

$

22


$

(43)


$

(84)


$

(33)


Adjustments:


LCM inventory valuation adjustment (c)

(17)


Operating expenses (excluding depreciation and

amortization expense reflected below)

105


121


293


378


Depreciation and amortization expense (d)

54


23


97


68


Other operating expenses

1


1


1


Ethanol margin

$

165


$

101


$

307


$

414


Ethanol operating income (loss)

$

22


$

(43)


$

(84)


$

(33)


Adjustments:


LCM inventory valuation adjustment (c)

(17)


Change in estimated useful life (d)

30


30


Other operating expenses

1


1


1


Adjusted ethanol operating income (loss)

$

36


$

(43)


$

(53)


$

(32)


See Notes to Earnings Release Tables.


Contacts

Investors:
Homer Bhullar, Vice President – Investor Relations, 210-345-1982
Eric Herbort, Senior Manager – Investor Relations, 210-345-3331
Gautam Srivastava, Manager – Investor Relations, 210-345-3992

Media:
Lillian Riojas, Executive Director – Media Relations and Communications, 210-345-5002


Read full story here

The installed base spans residential, commercial, and utility sites on all 7 continents


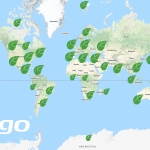
CAMPBELL, Calif.--(BUSINESS WIRE)--#IoT--This summer, Tigo Energy Inc.’s fleet of monitored module-level power electronics (MLPE) crossed a major milestone – more than 1 GWh of daily solar production. The fleet includes tens of thousands of communicating systems that span all seven continents on sites ranging from single kilowatt residential scale to multi-megawatt utility scale PV installations.

“This is a significant milestone that’s the result of years of hard work by our team and our amazing network of partners that literally span the globe,” said Zvi Alon, Chairman and CEO of Tigo Energy.

The daily production is tracked using Tigo’s cloud monitoring platform, which has the most granular data visibility available in the market. End customers and installation partners that use Tigo cloud can view everything from high level key site metrics, all the way down to electrical characteristics of each PV module.

Not only does Tigo increase visibility for its customers, but Tigo also uses the data to identify issues, pinpoint their location and notify customers in order to increase system performance and lower operation and maintenance expenses.

“We are performance driven, whether it’s our hardware or our customers’ systems,” said Maxym Makhota, VP of Software Engineering for Tigo. “Each new site added to the Tigo cloud benefits from the knowledge gained from our installed base and contributes to improvement of other systems as well as its future self.”

Tigo’s TS4 family of MLPE connects to the PV modules to enable additional benefits for PV systems, including power output Optimization, unparalleled Monitoring to lower maintenance costs and Safety for rapid shutdown compliance and asset protection.

The module level data used in Tigo’s monitoring system provides customers the ability to better assess, diagnose and perform O&M activities faster and more efficiently. The monitoring of this data helps Tigo’s customers improve performance and safeguard from potential safety issues.

For more information and inquiries, contact This email address is being protected from spambots. You need JavaScript enabled to view it.

About Tigo

Tigo is the worldwide leader in flexible module level power electronics (MLPE) with innovative solutions that significantly enhance safety, increase energy production, and decrease operating costs of photovoltaic (PV) systems. Tigo’s TS4 platform maximizes the benefit of PV systems and provides customers with the most scalable, versatile, and reliable MLPE solution available. Tigo was founded in Silicon Valley in 2007 to accelerate the adoption of solar energy worldwide. Tigo systems operate on 7 continents and produce gigawatt hours of reliable, clean, affordable and safe solar energy daily. Tigo's global team is dedicated to making the best MLPE on earth so more people can enjoy the benefits of solar. Visit us at www.tigoenergy.com.


Contacts

John Lerch
408.402.0802 x430
This email address is being protected from spambots. You need JavaScript enabled to view it.

Business Leaders and Experts to Explore How Companies can Embrace Environmentally Friendly Practices while Maintaining the Bottom Line

NEW HAVEN, Conn.--(BUSINESS WIRE)--#climatechange--In a time when many businesses are struggling just to stay afloat, a dedicated group of leaders from across Connecticut are coming together during the first-ever CT Climate Action Business Summit to discuss how companies and individual business owners can develop sustainable practices that reduce their impact on the environment while remaining focused on profitability and growth. Participants in the virtual 3-day Summit, which takes place October 21-23, will have access to an array of interactive sessions and experts operating at the intersection of business and environmental preservation. Registration is open throughout the 3-day summit.


“The cost of doing nothing has grown too high to simply sit back and be overtaken by a common threat,” according to Heather Burns, CEO of the Connecticut Sustainable Business Council and the lead organizer of the Summit. “The good news is our state includes shining examples of meaningful leadership by organizations that understand the urgency and have risen to meet - and communicate - the challenge.”

The Conscious Capitalism Connecticut Chapter co-organized the Summit. Chapter President Gavin Watson notes, “Protecting the environment and growing your business are not mutually exclusive goals. Research by Conscious Capitalism co-founder Dr. Raj Sisodia shows that conscious companies dramatically outperform the competition.”

The Summit is sponsored by Avangrid, UI, SCG, CNG and Energize CT, Regional Water Authority and Vineyard Wind.

The full schedule, speaker bios and registration information can be found here: https://www.ctclimateactionsummit.com/.


Contacts

Press:
Heather Burns, CEO
CT Sustainable Business Council
This email address is being protected from spambots. You need JavaScript enabled to view it.
203-947-6159

M&As can provide legacy lighting players the ability to expand and shift offerings to deliver solutions, address declining revenue, and build long-term client relationships


BOULDER, Colo.--(BUSINESS WIRE)--#Acquisitions--A new report from Guidehouse Insights explores the role of mergers and acquisitions (M&As) in the lighting and intelligent building markets to meet new client demands.

The shifting lighting market is creating a new lighting ecosystem, driven by the proliferation of LEDs, the growth of controls, and the subsequent influx of available data. The market no longer solely consists of lighting OEMs—competition has expanded to include players from adjacent markets, technology providers, and startups. Click to tweet: According to a new report from @WeAreGHInsights, M&As are a driving force behind the emerging lighting ecosystem, and they are needed for legacy vendors to maintain relevance and address new client demands.

“Building occupants and customers are demanding a more connected, customized, and automated indoor space, pressuring building owners and managers to provide this intelligent building experience,” says Krystal Maxwell, senior research analyst at Guidehouse Insights. “M&As can provide legacy lighting players the ability to expand and shift offerings to deliver these solutions to clients, address declining revenue, and build long-term client relationships.”

As the lines between solutions in the smart buildings market blur, new opportunities and competition arise. To position for success, Guidehouse Insights recommends that key industry players adapt to the shifting landscape. To maintain relevance and succeed, vendors must create an M&A and partnerships strategy, and lighting manufacturers must move beyond hardware-only offerings. In addition, manufacturers must find long-term solutions for continued success.

The report, M&A Creates a New Lighting Ecosystem, explores the role of M&A in the lighting and intelligent building markets to meet new client demands around actionable insight into the built environment. The report focuses on the necessity of having a strong M&A and partnership strategy, the inclusion of software and service offerings, and role of a long-term client relationship. An executive summary of the report is available for free download on the Guidehouse Insights website.

About Guidehouse Insights

Guidehouse Insights, the dedicated market intelligence arm of Guidehouse, provides research, data, and benchmarking services for today’s rapidly changing and highly regulated industries. Our insights are built on in-depth analysis of global clean technology markets. The team’s research methodology combines supply-side industry analysis, end-user primary research, and demand assessment, paired with a deep examination of technology trends, to provide a comprehensive view of emerging resilient infrastructure systems. Additional information about Guidehouse Insights can be found at www.guidehouseinsights.com.

About Guidehouse

Guidehouse is a leading global provider of consulting services to the public and commercial markets with broad capabilities in management, technology, and risk consulting. We help clients address their toughest challenges with a focus on markets and clients facing transformational change, technology-driven innovation and significant regulatory pressure. Across a range of advisory, consulting, outsourcing, and technology/analytics services, we help clients create scalable, innovative solutions that prepare them for future growth and success. Headquartered in Washington DC, the company has more than 7,000 professionals in more than 50 locations. Guidehouse is led by seasoned professionals with proven and diverse expertise in traditional and emerging technologies, markets and agenda-setting issues driving national and global economies. For more information, please visit: www.guidehouse.com.

* The information contained in this press release concerning the report, M&A Creates a New Lighting Ecosystem, is a summary and reflects the current expectations of Guidehouse Insights based on market data and trend analysis. Market predictions and expectations are inherently uncertain and actual results may differ materially from those contained in this press release or the report. Please refer to the full report for a complete understanding of the assumptions underlying the report’s conclusions and the methodologies used to create the report. Neither Guidehouse Insights nor Guidehouse undertakes any obligation to update any of the information contained in this press release or the report.


Contacts

Lindsay Funicello-Paul
+1.781.270.8456
This email address is being protected from spambots. You need JavaScript enabled to view it.

HOUSTON--(BUSINESS WIRE)--Kinder Morgan, Inc.’s (NYSE: KMI) board of directors today approved a cash dividend of $0.2625 per share for the third quarter ($1.05 annualized), payable on November 16, 2020, to common stockholders of record as of the close of business on November 2, 2020. This dividend represents a 5% increase over the third quarter of 2019.

KMI is reporting third quarter net income attributable to KMI of $455 million, compared to net income attributable to KMI of $506 million in the third quarter of 2019; and distributable cash flow (DCF) of $1,085 million, a 5% decrease from the third quarter of 2019.

“We are now in the seventh month of an unprecedented reduction in energy demand due to the pandemic,” said KMI Executive Chairman Richard D. Kinder. “Yet our company continued to produce considerable earnings and robust coverage of this quarter’s dividend.

“We generate substantial cash and we remain committed to funding our capital needs internally, maintaining a healthy balance sheet and returning excess cash to our shareholders through dividend increases and/or share repurchases. Once we have completed our 2021 budget process, the board will determine the fourth quarter 2020 dividend and our dividend policy for 2021,” Kinder concluded.

“We are very proud of how our team has performed during this challenging time. Essential workers in the field have adapted to new practices and procedures designed to keep everyone safe and healthy as we maintain our assets and execute on projects. Thousands of office workers have adapted to new working conditions as we continue to serve our customers and generate new business,” said KMI Chief Executive Officer Steve Kean. “Our continued success is key to providing services that are vital for the country and the world’s economy — and for the quality of life for millions of our fellow citizens.

“We have also maintained our vigilance with respect to capital spending, expenses, and increased operational efficiency. We have reduced our 2020 expenses and sustaining capital expenditures by approximately $175 million combined versus our original budget without sacrificing safety and compliance. That figure is net of more than $12 million that we will spend on personal protective equipment, enhanced cleaning protocols, temperature screening, and other measures we adopted to protect our colleagues. And we reduced our expansion capital outlook for 2020 by approximately $680 million, or almost 30%,” continued Kean.

“Finally, and as I noted last quarter, the actions we took over the last several years to strengthen our balance sheet, including reducing our net debt by $10 billion since the third quarter of 2015, have increased our resiliency for these challenging times,” Kean concluded.

“Despite the on-going headwinds facing the energy sector overall, including continued low crude oil and natural gas production and reduced demand for refined products, we generated third quarter earnings per common share of $0.20, compared to earnings per common share of $0.22 in the third quarter of 2019,” said KMI President Kim Dang. “Financial contributions from our Products Pipelines and Terminals business segments were down compared to the third quarter of 2019, primarily due to lower refined products volumes as a result of the pandemic and the December 2019 sale of Kinder Morgan Canada Limited (KML). This was somewhat offset by lower interest expense versus the same period last year.

“Adjusted earnings per share in the third quarter of 2020 were down 5% compared to the third quarter of 2019. At $0.48 per common share, DCF per share was down $0.02 from the third quarter of 2019, reflecting the items above as well as higher cash taxes due to deferrals from the second quarter of 2020. We also achieved $487 million of excess DCF above our declared dividend.

“Our project management team made excellent progress this quarter on the Permian Highway Pipeline project, with the project standing at more than 97% mechanically complete. As previously announced, we expect the project to be in service early in 2021,” said Dang. “We also completed the Elba Liquefaction project, and the facility is fully in-service. Both projects are contracted under long term, reservation-based contracts.”

2020 Outlook

For 2020, KMI’s original budget contemplated DCF of approximately $5.1 billion ($2.24 per common share) and Adjusted EBITDA of approximately $7.6 billion. Because of the pandemic-related reduced energy demand and the sharp decline in commodity prices, the company expects DCF to be below plan by slightly more than 10% and Adjusted EBITDA to be below plan by slightly more than 8%. As a result, KMI expects to end 2020 with a Net Debt-to-Adjusted EBITDA ratio of approximately 4.6 times.

Market conditions also negatively impacted a number of planned expansion projects such that they are not needed at this time or no longer meet our internal return thresholds. We therefore expect the budgeted $2.4 billion of expansion projects and contributions to joint ventures for 2020 to be lower by approximately $680 million. With this reduction, DCF less expansion capital expenditures is improved by approximately $135 million compared to budget, helping to keep our balance sheet strong.

KMI expects to use internally generated cash flow to fully fund its 2020 dividend payments, as well as all of its 2020 discretionary spending.

As of September 30, 2020, we had over $3.9 billion of borrowing capacity under our $4 billion credit facility and $632 million in cash and cash equivalents. We believe this borrowing capacity, current cash on hand, and our cash from operations are more than adequate to allow us to manage our cash requirements, including maturing debt, through 2021.

Due to the impracticality of predicting certain amounts required by GAAP such as unrealized gains and losses on derivatives marked to market and potential changes in estimates for certain contingent liabilities, KMI does not provide budgeted net income attributable to KMI and net income, the GAAP financial measures most directly comparable to the non-GAAP financial measures of DCF and Adjusted EBITDA, respectively, or budgeted metrics derived therefrom.

Overview of Business Segments

“The Natural Gas Pipelines segment’s financial performance was slightly down for the third quarter of 2020 relative to the third quarter of 2019,” said Dang. “The segment experienced lower contributions from multiple gathering and processing assets due to sharply reduced natural gas production, and from the sale of the Cochin Pipeline in December 2019. These reduced contributions were partially offset by greater contributions from the Elba Liquefaction and the Gulf Coast Express (GCX) projects.”

Natural gas transport volumes were down 2% compared to the third quarter of 2019, with notable volume declines on Kinder Morgan Louisiana Pipeline (KMLP) and Natural Gas Pipeline of America (NGPL) due to lower LNG demand; Ruby Pipeline, due to competition from deliveries from Canada; and Wyoming Interstate Company (WIC), due to Rockies basin production declines. These declines were partially offset by a full quarter of GCX volumes. Natural gas gathering volumes were down 13% from the third quarter of 2019 across nearly all our systems, most notably on the KinderHawk system.

“Continued low refined product demand and lower crude and condensate volumes during the third quarter reduced contributions from the Products Pipelines segment,” Dang said. “Crude and condensate pipeline volumes were down 17% and total refined product volumes were down 16% compared to the third quarter of 2019. This performance represents an improvement over the second quarter of 2020 as we saw some recovery in this sector.”

Terminals segment earnings were lower compared to the third quarter of 2019 predominantly driven by the impacts of the December 2019 sale of Kinder Morgan Canada Limited (KML) and demand reduction attributable to the pandemic. In our liquids business, which accounts for approximately 80% of the segment, refined product volumes were down 22% compared to the third quarter of 2019, although our predominantly fixed, take-or-pay contracting profile mitigated the negative impact to earnings. Further, storage demand has remained elevated, contributing to historically-high effective utilization across our network of nearly 80 million barrels of storage capacity,” said Dang. “Our bulk business was impacted by weakness in petroleum coke and coal volumes.

CO2 segment earnings were down slightly due to mark-to-market adjustments on hedge contracts. Excluding this impact, the segment was up slightly versus the third quarter of 2019 primarily due to lower operating expenditures and higher realized crude prices, mostly offset by lower CO2 and crude volumes. Our realized weighted average crude oil price for the quarter was up 11% at $54.83 per barrel compared to $49.45 per barrel for the third quarter of 2019, largely driven by our Midland/Cushing basis hedges,” said Dang. “Third quarter 2020 combined oil production across all of our fields was down 12% compared to the same period in 2019 on a net to KMI basis and CO2 volumes were down 33%.”

Other News

Corporate

  • In August 2020, KMI issued $750 million in 2% senior notes due 2031 and $500 million in 3.25% senior notes due 2050. These coupon rates were the lowest ever achieved on KMI 10-year and 30-year issuances, respectively. The proceeds were used to repay $949 million of maturing senior notes in September 2020 and to prefund early 2021 debt maturities.

Natural Gas Pipelines

  • The Permian Highway Pipeline (PHP) is more than 97% mechanically complete and is on schedule to be placed in service in early first quarter 2021. The approximately $2 billion project is designed to transport up to 2.1 billion cubic feet per day (Bcf/d) of natural gas through approximately 430 miles of 42-inch pipeline from the Waha area to U.S. Gulf Coast and Mexico markets. The project is fully subscribed under long-term, firm transportation agreements. Kinder Morgan Texas Pipeline (KMTP), EagleClaw Midstream and Altus Midstream each hold an ownership interest of approximately 26.7%, and an affiliate of an anchor shipper has a 20% interest. KMTP is building and will operate the pipeline.
  • Construction activities are expected to be completed during the fourth quarter of 2020 on KMI’s approximately $260 million expansion project designed to increase the delivery capacity by 1.4 Bcf/d on its Texas intrastate system. This expansion capacity will serve future LNG, industrial, electric generation and local distribution company expansions along the Texas Gulf Coast.
  • Kinder Morgan received significant customer commitments through a recent open season and is moving forward with its Mier-Monterrey Pipeline system expansion project serving Mexico. The approximately $22 million project involves expanding the system’s existing capacity by 35 million cubic feet per day (MMcf/d) and is supported by long term take or pay contracts. The project is expected to be in service in the third quarter of 2021.
  • Elba Liquefaction Company (ELC) completed the commissioning and startup activities on the remaining liquefaction units of the Elba Liquefaction project on August 27, 2020. Now fully in-service, the facility has a total liquefaction capacity of approximately 2.5 million metric tons per year of LNG, equivalent to approximately 350 MMcf/d of natural gas. The nearly $2 billion project is supported by long-term contracts with Shell. ELC, a KMI joint venture with EIG Global Energy Partners as a 49% partner, owns the liquefaction units and other ancillary equipment. Other facilities associated with the project are 100% owned by KMI.
  • KMLP received a Federal Energy Regulatory Commission certificate order on September 17, 2020, authorizing its approximately $145 million Acadiana expansion project to provide 945,000 Dth/d of capacity to serve Train 6 at Cheniere’s Sabine Pass Liquefaction facility in Cameron Parish, Louisiana. The KMLP project is anticipated to be placed into commercial service as early as the first quarter of 2022.
  • Construction is complete on NGPL’s Sabine Pass Compression Project, which was placed in service on October 1, 2020. The approximately $68 million project (KMI’s share: approximately $34 million), supported by a long-term take-or-pay contract, adds compression capacity on NGPL’s Louisiana system in order to deliver additional natural gas to the Sabine Pass Liquefaction facility.
  • Construction is progressing on NGPL’s Gulf Coast Southbound project. The approximately $203 million project (KMI’s share: $101.5 million) will increase southbound capacity on NGPL’s Gulf Coast System by approximately 300,000 dekatherms per day (Dth/d) to serve Cheniere’s Corpus Christi Liquefaction facility in San Patricio County, Texas. The project is supported by a long-term take-or-pay contract and is expected to be placed into service the first quarter of 2021.
  • Construction is complete on NGPL’s approximately $51 million Lockridge to Waha Project (KMI’s share: $25.5 million), which was placed in service on September 18, 2020. The project enables NGPL to deliver up to 500,000 Dth/d to the Waha Hub with an extension of its Amarillo system, and is supported by long-term take-or-pay contracts.

Terminals

  • Kinder Morgan has completed and placed in service the final elements in a series of projects at the Pasadena Terminal and Jefferson Street Truck Rack located on the Houston Ship Channel. The projects, totaling approximately $134 million and supported by long-term agreements, included increasing flow rates on inbound pipeline connections and outbound dock lines, tank modifications that added butane blending and vapor combustion capabilities to 10 storage tanks, expansion of the current methyl tert-butyl ether storage and blending platform, and a new dedicated natural gasoline (C5) inbound connection.
  • Construction activities continue on the butane-on-demand blending system at KMI’s Galena Park Terminal. The approximately $52 million project includes construction of a 30,000-barrel butane sphere and a new inbound C4 pipeline connection, as well as tank and piping modifications to extend butane blending capabilities to 25 tanks, two ship docks, and six cross-channel pipelines. The project is supported by a long-term agreement with an investment-grade midstream company and is expected to be completed in the first quarter of 2021.
  • Construction is substantially complete on an expansion of Kinder Morgan’s market-leading Argo ethanol hub. The project, which spans both the Argo and Chicago Liquids facilities, includes 105,000 barrels of additional ethanol storage capacity and enhancements to the system’s rail loading, rail unloading and barge loading capabilities. The approximately $18 million project improves the system’s inbound and outbound modal balances, adding greater product-clearing efficiencies to this industry-critical pricing and liquidity hub.
  • Construction is nearing completion on a facility upgrade at the Battleground Oil Specialty Terminal Company LLC (BOSTCO) terminal, a leading fuel oil storage terminal on the Houston Ship Channel. The approximately $20 million project, which is expected to be placed in service in the fourth quarter of 2020, will add piping to allow for segregation of high sulfur and low sulfur fuel oils. KMI owns a 55% interest in and is the operator of BOSTCO.

CO2

  • The CO2 segment continues to efficiently execute approved projects and generate economic production. Ongoing capital discipline and cost management practices have increased CO2 segment Free Cash Flow as compared to its 2020 budget.

Kinder Morgan, Inc. (NYSE: KMI) is one of the largest energy infrastructure companies in North America. Our mission is to provide energy transportation and storage services in a safe, efficient and environmentally responsible manner for the benefit of people, communities and businesses. Our vision is delivering energy to improve lives and create a better world. We own an interest in or operate approximately 83,000 miles of pipelines and 147 terminals. Our pipelines transport natural gas, refined petroleum products, crude oil, condensate, CO2 and other products, and our terminals store and handle various commodities including gasoline, diesel fuel, chemicals, ethanol, metals and petroleum coke. For more information, please visit www.kindermorgan.com.

Please join Kinder Morgan, Inc. at 4:30 p.m. Eastern Time on Wednesday, October 21, at www.kindermorgan.com for a LIVE webcast conference call on the company’s third quarter earnings.

Non-GAAP Financial Measures

The non-generally accepted accounting principles (non-GAAP) financial measures of Adjusted Earnings and distributable cash flow (DCF), both in the aggregate and per share for each; segment earnings before depreciation, depletion, amortization (DD&A), amortization of excess cost of equity investments and Certain Items (Adjusted Segment EBDA); net income before interest expense, income taxes, DD&A, amortization of excess cost of equity investments and Certain Items (Adjusted EBITDA); Net Debt; Net Debt to Adjusted EBITDA; and Free Cash Flow in relation to our CO2 segment are presented herein.

Our non-GAAP financial measures described below should not be considered alternatives to GAAP net income (loss) or other GAAP measures and have important limitations as analytical tools. Our computations of these non-GAAP financial measures may differ from similarly titled measures used by others. You should not consider these non-GAAP financial measures in isolation or as substitutes for an analysis of our results as reported under GAAP. Management compensates for the limitations of these non-GAAP financial measures by reviewing our comparable GAAP measures, understanding the differences between the measures and taking this information into account in its analysis and its decision-making processes.

Certain Items, as adjustments used to calculate our non-GAAP financial measures, are items that are required by GAAP to be reflected in net income (loss), but typically either (1) do not have a cash impact (for example, asset impairments), or (2) by their nature are separately identifiable from our normal business operations and in our view are likely to occur only sporadically (for example, certain legal settlements, enactment of new tax legislation and casualty losses). We also include adjustments related to joint ventures (see “Amounts from Joint Ventures” below and the accompanying Tables 4 and 7.)

Adjusted Earnings is calculated by adjusting net income (loss) attributable to Kinder Morgan, Inc. for Certain Items. Adjusted Earnings is used by us and certain external users of our financial statements to assess the earnings of our business excluding Certain Items as another reflection of the Company’s ability to generate earnings. We believe the GAAP measure most directly comparable to Adjusted Earnings is net income (loss) to Kinder Morgan, Inc. Adjusted Earnings per share uses Adjusted Earnings and applies the same two-class method used in arriving at basic earnings per common share. (See the accompanying Tables 1 and 2.)

DCF is calculated by adjusting net income (loss) attributable to Kinder Morgan, Inc. for Certain Items (Adjusted Earnings), and further by DD&A and amortization of excess cost of equity investments, income tax expense, cash taxes, sustaining capital expenditures and other items. We also include amounts from joint ventures for income taxes, DD&A and sustaining capital expenditures (see “Amounts from Joint Ventures” below). DCF is a significant performance measure useful to management and external users of our financial statements in evaluating our performance and in measuring and estimating the ability of our assets to generate cash earnings after servicing our debt, paying cash taxes and expending sustaining capital, that could be used for discretionary purposes such as common stock dividends, stock repurchases, retirement of debt, or expansion capital expenditures. DCF should not be used as an alternative to net cash provided by operating activities computed under GAAP. We believe the GAAP measure most directly comparable to DCF is net income (loss) to Kinder Morgan, Inc. DCF per common share is DCF divided by average outstanding common shares, including restricted stock awards that participate in common share dividends. (See the accompanying Tables 2 and 3.)

Adjusted Segment EBDA is calculated by adjusting segment earnings before DD&A and amortization of excess cost of equity investments (Segment EBDA) for Certain Items attributable to the segment. Adjusted Segment EBDA is used by management in its analysis of segment performance and management of our business. General and administrative expenses and certain corporate charges are generally not under the control of our segment operating managers, and therefore, are not included when we measure business segment operating performance. We believe Adjusted Segment EBDA is a useful performance metric because it provides management and external users of our financial statements additional insight into the ability of our segments to generate segment cash earnings on an ongoing basis. We believe it is useful to investors because it is a measure that management uses to allocate resources to our segments and assess each segment’s performance. We believe the GAAP measure most directly comparable to Adjusted Segment EBDA is Segment EBDA. (See the accompanying Tables 3 and 7.)

Adjusted EBITDA is calculated by adjusting net income before interest expense, income taxes, DD&A, and amortization of excess cost of equity investments (EBITDA) for Certain Items. We also include amounts from joint ventures for income taxes and DD&A (see “Amounts from Joint Ventures” below). Adjusted EBITDA is used by management and external users, in conjunction with our Net Debt (as described further below), to evaluate certain leverage metrics. Therefore, we believe Adjusted EBITDA is useful to investors. We believe the GAAP measure most directly comparable to Adjusted EBITDA is net (loss) income. (See the accompanying Tables 3 and 4.)

Amounts from Joint Ventures - Certain Items, DCF and Adjusted EBITDA reflect amounts from unconsolidated joint ventures (JVs) and consolidated JVs utilizing the same recognition and measurement methods used to record “Earnings from equity investments” and “Noncontrolling interests,” respectively. The calculations of DCF and Adjusted EBITDA related to our unconsolidated and consolidated JVs include the same items (DD&A and income tax expense, and for DCF only, also cash taxes and sustaining capital expenditures) with respect to the JVs as those included in the calculations of DCF and Adjusted EBITDA for our wholly-owned consolidated subsidiaries. (See Table 7, Additional JV Information.) Although these amounts related to our unconsolidated JVs are included in the calculations of DCF and Adjusted EBITDA, such inclusion should not be understood to imply that we have control over the operations and resulting revenues, expenses or cash flows of such unconsolidated JVs. DCF and Adjusted EBITDA are further adjusted for certain KML activities attributable to our noncontrolling interests in KML for the periods presented through KML’s sale on December 16, 2019 (See Table 7, KML Activities Prior to December 16, 2019.)

Net Debt is calculated by subtracting from debt (i) cash and cash equivalents, (ii) the preferred interest in the general partner of Kinder Morgan Energy Partners L.


Contacts

Dave Conover
Media Relations
(713) 420-6397
This email address is being protected from spambots. You need JavaScript enabled to view it.

Investor Relations
(800) 348-7320
This email address is being protected from spambots. You need JavaScript enabled to view it.
www.kindermorgan.com


Read full story here

AKRON, Ohio--(BUSINESS WIRE)--$BW #energyrecovery--Babcock & Wilcox (B&W) (NYSE: BW) announced today that its B&W Renewable segment has been awarded a contract to provide upgrades to Shetland Islands Council’s energy recovery plant in Lerwick, Scotland, to reduce emissions and increase efficiency.


Under the contract, which is valued at more than $3 million, B&W Renewable will design, supply and install new, patented water-cooled wear zones, a secondary air system, waste feed hopper and associated equipment, and provide a control system upgrade.

The equipment upgrades, which utilize proven, patented Babcock & Wilcox Vølund A/S technology, are intended to reduce emissions, while also boosting the plant’s municipal waste-processing capacity by 15 percent. The plant provides hot water to the local district heating company, Shetland Heat, Energy & Power Ltd., which supplies more than 1,200 local homes and businesses.

“B&W Renewable is proud to be a leading provider of equipment and services to the renewable energy plant fleet in Europe and throughout the world,” said B&W Chief Operating Officer Jimmy Morgan. “We look forward to executing this important project and appreciate the confidence Shetland Islands Council has shown in our clean energy technologies.”

B&W Renewable will also provide grate and boiler maintenance services, training, start-up support and performance optimization services for the energy recovery plant. The project is scheduled for completion and handover to the customer in the fall of 2021.

B&W Renewable’s waste-to-energy technologies are robust and effective energy options designed to reduce CO2 emissions and replace fossil fuels. Technologies offered include combustion systems, grates and stokers, waste fuel feeder systems, water-cooled wear zones, emissions control, flue gas treatment and more.

About B&W

Headquartered in Akron, Ohio, Babcock & Wilcox Enterprises, Inc., is a global leader in energy and environmental technologies and services for the power and industrial markets. Follow us on LinkedIn and learn more at www.babcock.com.

About B&W Renewable

Babcock & Wilcox Renewable offers cost-effective technologies for efficient and environmentally sustainable power and heat generation, including waste-to-energy, biomass energy and black liquor systems for the pulp and paper industry. B&W Renewable’s leading technologies support a circular economy, diverting waste from landfills to use for power generation and replacing fossil fuels, while recovering metals and reducing emissions.

Forward-Looking Statements

B&W cautions that this release contains forward-looking statements, including, without limitation, statements relating to the execution and completion of a contract to provide upgrades to Shetland Islands Council’s energy recovery plant in Lerwick, Scotland. These forward-looking statements are based on management’s current expectations and involve a number of risks and uncertainties. For a more complete discussion of these risk factors, see our filings with the Securities and Exchange Commission, including our most recent annual report on Form 10-K. If one or more of these risks or other risks materialize, actual results may vary materially from those expressed. We caution readers not to place undue reliance on these forward-looking statements, which speak only as of the date of this release, and we undertake no obligation to update or revise any forward-looking statement, except to the extent required by applicable law.


Contacts

Investor:
Megan Wilson
Vice President, Corporate Development & Investor Relations
Babcock & Wilcox
704.625.4944 | This email address is being protected from spambots. You need JavaScript enabled to view it.

Media:
Ryan Cornell
Public Relations
Babcock & Wilcox
330.860.1345 | This email address is being protected from spambots. You need JavaScript enabled to view it.

Reports quarterly GAAP and Adjusted earnings from continuing operations of $0.21 and $0.17 per diluted share, respectively

Generates both year-to-date operating and free cash flow before leasing investment of $457 million, respectively

Returned $193 million of capital to stockholders year-to-date, including $90 million of share repurchases in the third quarter, completing the authorization

Announces new $250 million share repurchase authorization

DALLAS--(BUSINESS WIRE)--Trinity Industries, Inc. (NYSE:TRN) today announced earnings results for the third quarter ended September 30, 2020.


Financial and Operational Highlights — Third Quarter 2020

  • Quarterly total company revenues of $459 million
  • Quarterly income from continuing operations per common diluted share ("EPS") of $0.21 and quarterly adjusted EPS of $0.17, which excludes the following:
    • Restructuring activities totaling $0.03 per common diluted share
    • Additional income tax benefit of $0.07 per common diluted share related to carryback claims as permitted under recent tax legislation
  • Both year-to-date cash flow from operations and free cash flow before leasing investment were $457 million, respectively
  • Year-to-date investment of $310 million in leasing capital expenditures, net of railcar sales, predominantly for growth
  • Total committed liquidity of $719 million as of September 30, 2020
  • Repurchases of approximately 4.5 million shares at a cost of $89.9 million
  • Year-to-date returns to shareholders of $193 million through dividends and share repurchases
  • Announces new $250 million share repurchase authorization approved subsequent to quarter-end
  • Completed a new $155.5 million securitization under an existing indenture bearing interest at 1.96% annually to replace $153.1 million of secured railcar equipment notes bearing interest at 3.82%, which were redeemed
  • Previously announced date of 2020 Investor Day on November 19, 2020

“In the wake of the challenges created by the COVID-19 pandemic, I applaud the commitment of Trinity’s people to deliver high-quality products and services to our customers and continue our progress in effecting the transformation of the Company’s rail-focused operating strategy,” said Jean Savage, Trinity’s CEO and President. “Trinity’s third quarter performance reflects solid execution against numerous headwinds including competitive pricing, declining deliveries, and difficult decisions in rightsizing our operations. Through it all, Trinity’s rail platform, which generates significant cash flow, and our strong balance sheet have enabled us to manage through the current environment from a position of strength.”

“Railcar loadings rebounded during the third quarter from the historical declines earlier in the year resulting from economic shutdowns amid the coronavirus outbreak. However, market uncertainty continues to cloud demand for railcars as much of the economy remains under pressure. We continue to see a good pipeline of inquiries for available railcars – new and existing – from strategic buyers and owners of railcar assets, and we remain cautiously optimistic regarding the trajectory of demand heading into next year. Average lease rates and the utilization of our lease fleet remained essentially flat from the second quarter, while lease rate renewal pricing continued to experience negative headwinds. Rail manufacturing received orders for 2,000 railcars during the third quarter, composed primarily of larger, complex transactions that leverage the strength of Trinity’s rail platform and our ability to tailor solutions for our customers.”

“Our business leaders are taking additional actions to optimize our operating structure and our balance sheet. During the third quarter, Trinity transitioned its U.S. logistics business and outsourced these services to third-party providers, as well as completed the realignment of its organizational structure. The Company also completed the $350 million share repurchase authorization, our second such completion in the past two years, with the purchase of approximately $90 million during the quarter. Earlier this week, Trinity’s Board approved a new $250 million share repurchase authorization that runs through the end of 2021.”

Ms. Savage concluded, “As we move forward with the execution of our long-term strategy, we have redefined our purpose to ‘Delivering Goods for the Good of All.’ We are proud of the essential role our railcars play in sustaining our communities, and our strategic initiatives are aimed at enhancing the rail industry's modal advantage while improving our returns on the business. We are strongly committed to accelerating the financial performance of the Company and unlocking value for our shareholders through a disciplined capital allocation framework.”

Consolidated Financial Summary


Three Months Ended
September 30,


2020


2019


Year over Year – Comparison


(in millions, except percentages and per share amounts)


Revenues

$

459.4


$

813.6


Lower deliveries in the Rail Products Group and fewer railcars sold from our lease fleet

Selling, engineering, and administrative expenses

$

51.2


$

62.1


Lower employee-related costs resulting from cost optimization initiatives, including headcount reductions and adjustments to incentive-based compensation, and lower litigation-related expenses

Operating profit (loss)

$

72.9


$

120.3


Lower volumes in the Rail Products Group and fewer railcar sales in the Leasing Group

Interest expense

$

52.3


$

55.8


Reduction in the average borrowings and the variable interest rates associated with the Company's debt facilities, as well as the early redemption of a securitization in the first quarter of 2020

EBITDA (1)

$

136.4


$

194.5


See change in operating profit described above

Effective tax expense (benefit) rate

(34.9)%


27.5%


Primarily tax benefit due to the carryback of net operating losses

Net income (loss) attributable to Trinity Industries, Inc.

$

25.1


$

49.0


Diluted EPS – GAAP

$

0.21


$

0.39


Diluted EPS – Adjusted (1)

$

0.17


$

0.39


Nine Months Ended
September 30,


2020


2019


Year over Year – Comparison


(in millions)


Net cash provided by operating activities – continuing operations

$

456.8


$

166.3


Cash impacts include cyclical shifts and working capital initiatives, as well as inflows from a customer's exercise of a purchase option on a sales-type lease

Free cash flow before leasing investment (1)

$

457.0


$

217.2


Capital expenditures – leasing, net

$

448.8


$

854.3


Reduced lease fleet investment in 2020

Returns of capital to shareholders

$

193.1


$

294.7


Reduced share repurchase activity in 2020

(1) Non-GAAP financial measure. See the Reconciliations of Non-GAAP Measures section within this Press Release for a reconciliation to the most directly comparable GAAP measure and why management believes this measure is useful to management and investors.

Business Group Summary


Three Months Ended
September 30,


2020


2019


Year over Year – Comparison


(in millions, except percentages and number of units)


Leasing and Management Services Group


Leasing and management revenues

$

183.9


$

190.1


Lower fleet utilization and lower lease rates on renewals, partially offset by growth in the lease fleet and higher lease rates associated with new railcar additions

Leasing and management operating profit

$

86.8


$

79.8


Growth in the lease fleet and lower depreciation expense

Operating profit on sales of leased railcars

$

2.9


$

35.9


Lower volume of railcars sold from the lease fleet

Fleet utilization

94.8%


96.7%


Primarily driven by decrease in energy-related markets

Owned lease fleet (in units) (1)

105,925


102,090


Managed lease fleet (in units)

26,655


24,215


Additional sales of leased railcars to third-party fleets managed by the Company


Rail Products Group


Revenues

$

381.2


$

735.1


Lower deliveries and railcar modification services

Operating profit margin

0.8%


8.9%


Lower deliveries resulting in additional unabsorbed burden in addition to lower pricing

Deliveries (in units)

2,605


5,320


Orders (in units)

2,000


2,530


Order value

$

186.8


$

259.2


Lower number of units and competitive pricing

Backlog value

$

1,155.4


$

2,445.7


All Other Group


Revenues

$

62.6


$

70.3


Decreased demand for highway products

Operating profit

$

7.3


$

3.9


Lower employee-related costs and lower costs associated with our non-operating facilities


September 30,
2020


December 31,
2019


Loan-to-value ratio:


Wholly-owned subsidiaries, including corporate revolving credit facility

57.9%


55.1%


(1) Includes wholly-owned and partially-owned railcars and railcars under sale-leaseback arrangements.

Additional Business Items

Income Tax Adjustments

  • As a result of the reinstatement of the tax-loss carryback provisions in recent tax legislation, the Company recognized an additional tax benefit in the third quarter of $8.6 million, or $0.07 per common diluted share. The associated income tax losses were primarily due to accelerated tax depreciation associated with our investment in the lease fleet.
  • The Company’s tax rate was a benefit of 34.9% for the quarter and a benefit of 69.5% for the year. These rates differed from the U.S. statutory rate primarily as a result of the Coronavirus Aid, Relief, and Economic Security Act (the "CARES Act").

Liquidity and Capital Source Updates

  • In July 2020, Trinity Rail Leasing 2017 LLC, a wholly-owned subsidiary of the Company, issued $225.0 million of additional promissory notes through its existing loan agreement. The promissory notes bear interest at LIBOR plus 1.50%. Net proceeds received from the transaction were used to repay borrowings under TILC's secured warehouse credit facility and under the Company’s revolving credit facility, and for general corporate purposes.
  • In July 2020, we amended our revolving credit facility to increase the maximum leverage ratio through December 31, 2021 to provide near-term covenant flexibility.
  • In October 2020, Trinity Rail Leasing 2018 LLC (“TRL-2018”), a wholly-owned subsidiary of the Company, issued $155.5 million of Series 2020-1 Class A Secured Railcar Equipment Notes (the “2020-1 Notes”) under an existing indenture. The 2020-1 Notes bear interest at a fixed rate of 1.96% per annum and have a stated final maturity date of 2050. In a separate transaction during October 2020, TRL-2018 redeemed its Series 2018-1 Class A-1 Secured Railcar Equipment Notes, of which $153.1 million was outstanding at the redemption date. The fixed interest rate for these notes was 3.82% per annum.
  • In October 2020, our Board of Directors authorized a new share repurchase program effective October 23, 2020 through December 31, 2021. The new share repurchase program authorizes the Company to repurchase up to $250.0 million of its common stock.
  • The Company's income tax receivable at the end of the third quarter was $485 million.

Cost Optimization

  • In connection with the Company's ongoing assessment of future needs to support our rail-focused strategy and to optimize the performance of the business, the Company recognized pre-tax restructuring charges totaling $10.5 million year to date, primarily from employee transition costs and the write-down of our corporate headquarters campus, partially offset by a net gain on the disposition of a non-operating facility and certain related assets.
    • Restructuring charges for the third quarter of 2020 totaled $4.7 million, which included $3.4 million for severance costs, $0.7 million in asset write-downs from transportation equipment related to our logistics operations, and $0.6 million of contract termination costs.
  • Trinity currently anticipates that the structural and cyclical administrative cost reductions completed thus far in 2020 will generate approximately $80 million in future annualized cost savings.
    • As the Company continues to reposition its operating structure and drive platform efficiency, we anticipate identifying further cost savings opportunities, which could lead to additional restructuring charges.
  • In connection with the Company's previously communicated pension plan termination, the plan is expected to be fully settled in the fourth quarter of 2020. Upon settlement, the Company currently expects to recognize a pre-tax non-cash pension settlement charge totaling between $145 million to $160 million, which includes the recognition of all pre-tax actuarial losses accumulated in Accumulated Other Comprehensive Loss.

Conference Call

Trinity will hold a conference call at 11:00 a.m. Eastern on October 22, 2020 to discuss its third quarter results. To listen to the call, please visit the Investor Relations section of the Company's website at www.trin.net and access the Events & Presentations webpage, or the live call can be accessed at 785-424-1854 with the conference ID "Trinity". Please call at least 10 minutes in advance to ensure a timely connection. An audio replay may be accessed through the Company’s website or by dialing (402) 220-1140 until 11:59 p.m. Eastern on October 29, 2020.

Additionally, the Company will provide Supplemental Materials to accompany the earnings conference call. The materials will be accessible on Trinity's Investor Relations website under the Events and Presentations portion of the site along with the Third Quarter Earnings Call event weblink.

2020 Investor Day

Trinity Industries will also hold a virtual Investor Day at 9:00 a.m. Eastern on November 19, 2020. The half-day event will include presentations on the Company’s business strategy from Jean Savage, Trinity’s CEO and President; Eric Marchetto, EVP and Chief Financial Officer; as well as other members of executive management. The live webcast and presentation slides will be accessible via the Events & Presentations portion of the Investor Relations website located at www.trin.net. A replay of the event will also be made available on the Company’s website following the event.

Non-GAAP Financial Measures

We have included financial measures compiled in accordance with generally accepted accounting principles ("GAAP") and certain non-GAAP measures in this earnings press release to provide management and investors with additional information regarding our financial results. Non-GAAP measures should not be considered in isolation or as a substitute for our reporting results prepared in accordance with GAAP and, as calculated, may not be comparable to other similarly titled measures for other companies. For each non-GAAP financial measure, a reconciliation to the most comparable GAAP measure has been included in the accompanying tables. When forward-looking non-GAAP measures are provided, quantitative reconciliations to the most directly comparable GAAP measures are not provided because management cannot, without unreasonable effort, predict the timing and amounts of certain items included in the computations of each of these measures. These factors include, but are not limited to: the product mix of expected railcar deliveries; the timing and amount of significant transactions and investments, such as railcar sales from the lease fleet, capital expenditures, and returns of capital to shareholders; and the amount and timing of certain other items outside the normal course of our core business operations, such as restructuring activities and non-cash pension plan termination charges.

About Trinity Industries

Trinity Industries, Inc., headquartered in Dallas, Texas, owns businesses that are leading providers of rail transportation products and services in North America. Our rail-related businesses market their railcar products and services under the trade name TrinityRail®. The TrinityRail platform provides railcar leasing and management services, as well as railcar manufacturing, maintenance and modifications. Trinity also owns businesses engaged in the manufacture of products used on the nation’s roadways and in traffic control. Trinity reports its financial results in three principal business segments: the Railcar Leasing and Management Services Group, the Rail Products Group, and the All Other Group. For more information, visit: www.trin.net.

Some statements in this release, which are not historical facts, are “forward-looking statements” as defined by the Private Securities Litigation Reform Act of 1995. Forward-looking statements include statements about Trinity's estimates, expectations, beliefs, intentions or strategies for the future, and the assumptions underlying these forward-looking statements, including, but not limited to, future financial and operating performance, future opportunities and any other statements regarding events or developments that Trinity believes or anticipates will or may occur in the future, including the potential financial and operational impacts of the COVID-19 pandemic. Trinity uses the words “anticipates,” “assumes,” “believes,” “estimates,” “expects,” “intends,” “forecasts,” “may,” “will,” “should,” “guidance,” “projected,” “outlook,” and similar expressions to identify these forward-looking statements. Forward-looking statements speak only as of the date of this release, and Trinity expressly disclaims any obligation or undertaking to disseminate any updates or revisions to any forward-looking statement contained herein to reflect any change in Trinity’s expectations with regard thereto or any change in events, conditions or circumstances on which any such statement is based, except as required by federal securities laws. Forward-looking statements involve risks and uncertainties that could cause actual results to differ materially from historical experience or our present expectations, including but not limited to risks and uncertainties regarding economic, competitive, governmental, and technological factors affecting Trinity’s operations, markets, products, services and prices, and such forward-looking statements are not guarantees of future performance. For a discussion of such risks and uncertainties, which could cause actual results to differ from those contained in the forward-looking statements, see “Risk Factors” and “Forward-Looking Statements” in Trinity’s Annual Report on Form 10-K for the most recent fiscal year, as may be revised and updated by Trinity’s Quarterly Reports on Form 10-Q, and Trinity’s Current Reports on Form 8-K.

Trinity Industries, Inc.

Condensed Consolidated Statements of Operations

(in millions, except per share amounts)

(unaudited)


Three Months Ended
September 30,


Nine Months Ended
September 30,


2020


2019


2020


2019

Revenues

$

459.4


$

813.6


$

1,583.8


$

2,154.4


Operating costs:


Cost of revenues

334.5


649.1


1,213.1


1,691.0


Selling, engineering, and administrative expenses

51.2


62.1


172.3


191.5


Gains (losses) on dispositions of property:


Net gains on railcar lease fleet sales owned more than one year at the time of sale

2.9


18.1


17.3


44.7


Other

1.0


(0.2)


2.8


2.5


Impairment of long-lived assets


369.4


Restructuring activities, net

4.7


10.5


386.5


693.3


1,745.2


1,835.3


Operating profit (loss)

72.9


120.3


(161.4)


319.1


Interest expense, net

51.7


54.0


163.6


160.8


Other, net

2.0


0.5


0.2


Income (loss) from continuing operations before income taxes

19.2


66.3


(325.5)


158.1


Provision (benefit) for income taxes:


Current

(18.7)


2.5


(471.2)


2.7


Deferred

12.0


15.7


245.1


38.5


(6.7)


18.2


(226.1)


41.2


Income (loss) from continuing operations

25.9


48.1


(99.4)


116.9


Loss from discontinued operations, net of income taxes


(0.4)


(0.2)


(2.3)


Net income (loss)

25.9


47.7


(99.6)


114.6


Net income (loss) attributable to noncontrolling interest

0.8


(1.3)


(79.5)


(1.4)


Net income (loss) attributable to Trinity Industries, Inc.

$

25.1


$

49.0


$

(20.1)


$

116.0


Basic earnings per common share:


Income (loss) from continuing operations

$

0.21


$

0.39


$

(0.17)


$

0.91


Income (loss) from discontinued operations


(0.02)


Basic net income (loss) attributable to Trinity Industries, Inc.

$

0.21


$

0.39


$

(0.17)


$

0.89


Diluted earnings per common share:


Income (loss) from continuing operations

$

0.21


$

0.39


$

(0.17)


$

0.90


Income (loss) from discontinued operations


(0.02)


Diluted net income (loss) attributable to Trinity Industries, Inc.

$

0.21


$

0.39


$

(0.17)


$

0.88


Weighted average number of shares outstanding:


Basic

116.4


124.7


117.2


127.6


Diluted

117.0


126.0


117.2


129.2


Trinity is required to utilize the two-class method of calculating earnings per share ("EPS") as a result of unvested restricted shares that have non-forfeitable rights to dividends and are, therefore, considered to be participating securities. The calculation of EPS using the two-class method excludes income attributable to these participating securities from the numerator and excludes the dilutive impact of those shares from the denominator; therefore, the two-class method may result in a lower EPS than is calculated from the face of the income statement. There were no restricted shares and stock options included in the computation of diluted EPS for the nine months ended September 30, 2020 as we incurred a loss for the period, and any effect on loss per common share would have been antidilutive.

Trinity Industries, Inc.

Condensed Segment Data

(in millions)

(unaudited)


Three Months Ended
September 30,


Nine Months Ended
September 30,

Revenues:

2020


2019


2020


2019

Railcar Leasing and Management Services Group

$

183.9


$

326.4


$

613.0


$

803.9


Rail Products Group

381.2


735.1


1,296.2


2,075.8


All Other

62.6


70.3


195.3


200.3


Segment Totals before Eliminations

627.7


1,131.8


2,104.5


3,080.0


Eliminations – Lease Subsidiary

(166.0)


(314.0)


(512.4)


(913.0)


Eliminations – Other

(2.3)


(4.2)


(8.3)


(12.6)


Consolidated Total

$

459.4


$

813.6


$

1,583.8


$

2,154.4


Three Months Ended
September 30,


Nine Months Ended
September 30,

Operating profit (loss):

2020


2019


2020


2019

Railcar Leasing and Management Services Group

$

89.7


$

115.7


$

265.5


$

306.3


Rail Products Group

3.2


65.4


36.2


180.8


All Other

7.3


3.9


23.9


19.9


Segment Totals before Eliminations, Corporate Expenses, Impairment of long-lived assets, and Restructuring activities

100.2


185.0


325.6


507.0


Corporate

(21.0)


(23.9)


(73.3)


(78.1)


Impairment of long-lived assets


(369.4)


Restructuring activities, net

(4.7)


(10.5)


Eliminations – Lease Subsidiary

(2.6)


(40.7)


(33.5)


(109.5)


Eliminations – Other

1.0


(0.1)


(0.3)


(0.3)


Consolidated Total

$

72.9


$

120.3


$

(161.4)


$

319.1


Trinity Industries, Inc.

Selected Financial Information Leasing Group

($ in millions)

(unaudited)


Three Months Ended
September 30,


Nine Months Ended
September 30,


2020


2019


2020


2019

Revenues:


Leasing and management

$

183.9


$

190.1


$

558.6


$

566.6


Sales of railcars owned one year or less at the time of sale (1)(2)


136.3


54.4


237.3


Total revenues

$

183.9


$

326.4


$

613.0


$

803.9


Operating profit (3):


Leasing and management

$

86.8


$

79.8


$

247.8


$

234.6


Railcar sales(1):


Railcars owned one year or less at the time of sale


17.8


0.4


27.0


Railcars owned more than one year at the time of sale

2.9


18.1


17.3


44.7


Total operating profit

$

89.7


$

115.7


$

265.5


$

306.3


Total operating profit margin

48.8

%


35.4

%


43.3

%


38.1

%


Leasing and management operating profit margin

47.2

%


42.0

%


44.4

%


41.4

%


Selected expense information:


Depreciation (4)(5)

$

51.5


$

59.4


$

159.1


$

171.6


Maintenance and compliance

$

18.5


$

24.9


$

67.4


$

79.2


Rent

$

2.1


$

3.8


$

8.1


$

13.6


Selling, engineering, and administrative expenses

$

11.7


$

10.7


$

39.0


$

36.2


Interest

$

47.0


$

50.0


$

149.2


$

146.4


Three Months Ended
September 30,


Nine Months Ended
September 30,


2020


2019


2020


2019

Sales of leased railcars:


Railcars owned one year or less at the time of sale (2)

$


$

136.3


$

54.4


$

237.3


Railcars owned more than one year at the time of sale

6.5


75.1


138.7


175.0


$

6.5


$

211.4


$

193.1


$

412.3


Operating profit on sales of leased railcars:


Railcars owned one year or less at the time of sale

$


$

17.8


$

0.4


$

27.0


Railcars owned more than one year at the time of sale

2.9


18.1


17.3


44.7


$

2.9


$

35.9


$

17.7


$

71.7


Operating profit margin on sales of leased railcars:


Railcars owned one year or less at the time of sale

%


13.1

%


0.7

%


11.4

%

Railcars owned more than one year at the time of sale

44.6

%


24.1

%


12.5

%


25.5

%

Weighted average operating profit margin on sales of leased railcars

44.6

%


17.0

%


9.2

%


17.4

%


Contacts

Investor Contact:
Jessica L. Greiner
Vice President, Investor Relations and Communications
Trinity Industries, Inc.
(Investors) 214/631-4420

Media Contact:
Jack L. Todd
Vice President, Public Affairs
Trinity Industries, Inc.
(Media Line) 214/589-8909


Read full story here

DUBLIN--(BUSINESS WIRE)--The "Marine Hybrid & Full Electric Propulsion Market - Global Industry Analysis, Size, Share, Growth, Trends, and Forecast, 2020-2030" report has been added to ResearchAndMarkets.com's offering.


The study presents detailed information about important drivers, restraints, and key trends that are creating a landscape for growth of the global marine hybrid & full electric propulsion market in order to identify opportunities for market stakeholders. The report also provides insightful information about how the global marine hybrid & full electric propulsion market would expand during the forecast period of 2020 to 2030.

The report offers intricate dynamics about different aspects of the global marine hybrid & full electric propulsion market, which aids companies operating in the market in making strategic decisions. The publisher's study also elaborates on significant changes that are anticipated to configure growth of the global marine hybrid & full electric propulsion market during the forecast period.

It also includes key indicator assessment that highlights growth prospects for the global marine hybrid & full electric propulsion market and estimates statistics related to the market in terms of volume (units) and value (US$ Mn).

This study covers detailed segmentation of the global marine hybrid & full electric propulsion market, along with key information and a competition outlook. The report mentions company profiles of players that are currently dominating the global marine hybrid & full electric propulsion market, wherein various developments, expansions, and winning strategies practiced by these players have been presented in detail.

Key Questions Answered in this report on Marine Hybrid & Full Electric Propulsion Market

The report provides detailed information about the global marine hybrid & full electric propulsion market on the basis of comprehensive research on various factors that are playing a key role in accelerating growth of the global market. Information mentioned in the report answers path-breaking questions for companies that are currently operating in the global market and are looking for innovative methods to create a unique benchmark in the market so as to help them design successful strategies and make target-driven decisions.

  • Which segments of the global marine hybrid & full electric propulsion market would emerge as key revenue generators for the market during the forecast period?
  • How are major market players successfully earning revenues in the global marine hybrid & full electric propulsion market?
  • What would be the Y-o-Y growth trend of the global marine hybrid & full electric propulsion market between 2020 and 2030?
  • What are the winning imperatives of leading players operating in the global marine hybrid & full electric propulsion market?

Key Topics Covered:

1. Executive Summary

1.1. Market Outlook

1.2. Key Facts and Figures

1.3. Key Trends

2. Market Overview

2.1. Market Segmentation

2.2. Market Indicators

3. Market Dynamics

3.1. Drivers and Restraints Snapshot Analysis

3.2. Porter's Five Forces Analysis

3.3. Regulatory Scenario

3.4. Volume Chain Analysis

4. COVID-19 Impact Analysis

5. Global Marine Hybrid & Full Electric Propulsion Market Volume (Units) and Value (US$ Mn) Analysis, by Propulsion

5.1. Key Findings and Introduction

5.2. Global Marine Hybrid & Full Electric Propulsion Market Volume (Units) and Value (US$ Mn) Forecast, by Propulsion, 2019-2030

5.3. Global Marine Hybrid & Full Electric Propulsion Market Attractiveness Analysis, by Propulsion

6. Global Marine Hybrid & Full Electric End-use Market Volume (Units) and Value (US$ Mn) Analysis, by End-use

6.1. Key Findings and Introduction

6.2. Global Marine Hybrid & Full Electric Propulsion Market Volume (Units) and Value (US$ Mn) Forecast, by End-use, 2019-2030

6.3. Global Marine Hybrid & Full Electric Propulsion Market Attractiveness Analysis, by End-use

7. Global Marine Hybrid & Full Electric Propulsion Market Volume (Units) and Value (US$ Mn) Analysis, by Power Rating

7.1. Key Findings and Introduction

7.2. Global Marine Hybrid & Full Electric Propulsion Market Volume (Units) and Value (US$ Mn) Forecast, by Power Rating, 2019-2030

7.3. Global Marine Hybrid & Full Electric Propulsion Market Attractiveness Analysis, by Power Rating

8. Global Marine Hybrid & Full Electric Propulsion Market Volume (Units) and Value (US$ Mn) Analysis, by RPM

8.1. Key Findings and Introduction

8.2. Global Marine Hybrid & Full Electric Propulsion Market Volume (Units) and Value (US$ Mn) Forecast, by RPM, 2019-2030

8.3. Global Marine Hybrid & Full Electric Propulsion Market Attractiveness Analysis, by RPM

9. Global Marine Hybrid & Full Electric Propulsion Market Volume (Units) and Value (US$ Mn) Analysis, by Fuel

9.1. Key Findings and Introduction

9.2. Global Marine Hybrid & Full Electric Propulsion Market Volume (Units) and Value (US$ Mn) Forecast, by Fuel, 2019-2030

9.3. Global Marine Hybrid & Full Electric Propulsion Market Attractiveness Analysis, by Fuel

10. Global Marine Hybrid & Full Electric Propulsion Market Analysis, by Region

10.1. Key Findings

10.2. Global Marine Hybrid & Full Electric Propulsion Market Volume (Units) and Value (US$ Mn) Forecast, by Region

10.3. Global Marine Hybrid & Full Electric Propulsion Market Attractiveness Analysis, by Region

11. North America Marine Hybrid & Full Electric Propulsion Market Overview

12. Europe Marine Hybrid & Full Electric Propulsion Market Overview

13. Asia Pacific Marine Hybrid & Full Electric Propulsion Market Overview

14. Latin America Marine Hybrid & Full Electric Propulsion Market Overview

15. Middle East & Africa Marine Hybrid & Full Electric Propulsion Market Overview

16. Competition Landscape

16.1. Competition Matrix

16.2. Global Marine Hybrid & Full Electric Propulsion Market Share Analysis, by Company (2019)

16.3. Market Footprint Analysis

16.4. Company Profiles

17. Primary Research - Key Insights

Companies Mentioned

  • Cummins Inc.
  • AB Volvo.
  • IHI Power Systems Co.,Ltd..
  • Fairbanks Morse.
  • Masson Marine
  • Caterpillar
  • BAE Systems
  • Wartsila Corporation.
  • Rolls-Royce Plc.
  • General Electric
  • STEYR MOTORS GmbH
  • MAN Diesel & Turbo SE
  • Torqeedo GmbH.

For more information about this report visit https://www.researchandmarkets.com/r/lnl2os


Contacts

ResearchAndMarkets.com
Laura Wood, Senior Press Manager
This email address is being protected from spambots. You need JavaScript enabled to view it.
For E.S.T Office Hours Call 1-917-300-0470
For U.S./CAN Toll Free Call 1-800-526-8630
For GMT Office Hours Call +353-1-416-8900

  • Solid operational results driven by strong execution across all segments
  • Total Company inbound orders of $2.2 billion; Subsea book-to-bill of 1.1
  • Resilient backlog of $19.6 billion; $9.4 billion scheduled in 2021
  • Achieved targeted cost savings of more than $350 million ahead of schedule
  • Cash flow from operations of $168 million; free cash flow of $95 million
  • U.S. GAAP diluted loss per share was $0.01
    • Includes total after-tax charges, net of credits, of $0.17 per diluted share
  • Adjusted diluted earnings per share, excluding charges and credits, was $0.16
    • Includes foreign exchange gains of $0.02 per diluted share
    • Includes expense resulting from increased liability to joint venture partners of $0.14 per diluted share

LONDON & PARIS & HOUSTON--(BUSINESS WIRE)--TechnipFMC plc (NYSE: FTI) (Paris: FTI)(ISIN:GB00BDSFG982) today reported third quarter 2020 results.


Summary Financial Statements - Third Quarter 2020
Reconciliation of U.S. GAAP to non-GAAP financial measures are below and in financial schedules.

Three Months Ended

(In millions, except per share amounts)

September 30,

2020

September 30,
2019

Change

Revenue

$3,335.7

$3,335.1

0.0%

Net income (loss)

$(3.9)

$(119.1)

n/m

Diluted earnings (loss) per share

$(0.01)

$(0.27)

n/m


Adjusted EBITDA

$321.2

$379.2

(15.3%)

Adjusted EBITDA margin

9.6 %

11.4 %

(180 bps)

Adjusted net income

$72.2

$53.8

34.2%

Adjusted diluted earnings per share

$0.16

$0.12

33.3%


Inbound orders

$2,227.4

$2,610.6

(14.7%)

Backlog

$19,646.1

$24,115.3

(18.5%)

Total Company revenue was $3,335.7 million. Net loss was $3.9 million, or $0.01 per diluted share. These results included after-tax charges and credits totaling $76.1 million of expense, or $0.17 per diluted share. Adjusted net income was $72.2 million, or $0.16 per diluted share.

Adjusted EBITDA, which excludes pre-tax charges and credits, was $321.2 million and included a foreign exchange gain of $5.6 million; adjusted EBITDA margin was 9.6 percent (Exhibit 10).

Doug Pferdehirt, Chairman and CEO of TechnipFMC, stated, “We delivered strong operational results in the third quarter. All three segments delivered sequential improvement in adjusted EBITDA margin, with total Company adjusted EBITDA of $321 million and a margin of 9.6 percent. These results were achieved working collaboratively with our clients, where our innovative solutions, demonstrated execution excellence and financial strength enabled our project portfolio to progress through a challenging period.”

Pferdehirt added, “As our clients continue to re-prioritize their portfolio investments, we have seen an increase in our award activity. Inbound orders of more than $2.2 billion represent our strongest quarter of the year and a sequential increase of 45 percent, largely driven by Subsea where we were awarded notable projects in South America and Norway. With the services and project activity forecast for the remainder of the year, we remain confident in achieving $4 billion of Subsea inbound orders for 2020.”

Technip Energies secured an EPC contract for the Assiut Hydrocracking Complex, which we expect will be inbound by year-end. We also announced a revamp project at Shell’s Moerdijk plant, demonstrating both our leadership in ethylene technology and our ability to reduce CO2 emissions.”

And in Surface Technologies, we continued to leverage the strength and resilience of our international franchise with two important growth opportunities captured in the Middle East. These awards provide us the opportunity to further expand our market share of high-specification equipment across the region.”

We continued to accelerate our cost reduction efforts and have already achieved the full targeted run-rate savings of more than $350 million. These savings, combined with our award momentum, provide us with confidence to reaffirm full-year guidance for all operating segments.”

Digital is another key enabler of our business transformation. We continue to apply digital technologies to enhance our customer offering and expand our market leadership. With Subsea Studio™, we are leveraging our proprietary global database of projects to rapidly evaluate field development scenarios, which enables our ability to utilize machine learning and artificial intelligence. And our integrated and digitally enabled iComplete™ offering for surface well completions is providing significant cost and efficiency benefits with a dramatic reduction in components, connections and operating costs. Since product launch, we have achieved broad customer acceptance, leading to market share gains.”

Pferdehirt continued, “Our energy transition expertise across all segments will support our clients’ efforts to meet their carbon reduction ambitions. We recently announced a strategic collaboration to accelerate the development of green hydrogen technologies with McPhy – a leading manufacturer of equipment used in the production and distribution of green hydrogen. We are a leader in hydrogen today, and with McPhy, we are bringing our core competencies in technology, engineering, integration and project execution to develop large scale and competitive green hydrogen solutions.”

Pferdehirt concluded, “In the midst of an extremely challenging time, the women and men of TechnipFMC continued to deliver strong operational results. We remained focused on strengthening our market leading positions and leveraging our financial flexibility to pursue growth opportunities. We are fully committed to further our business transformation through new business models, innovative technologies and digital solutions across the organization.”

Operational and Financial Highlights - Third Quarter 2020

Subsea

Financial Highlights
Reconciliation of U.S. GAAP to non-GAAP financial measures are below and in financial schedules.

Three Months Ended

(In millions)

September 30,

2020

September 30,

2019

Change

Revenue

$1,501.8

$1,342.2

11.9%

Operating profit (loss)

$20.3

$(79.6)

n/m

Adjusted EBITDA

$146.0

$139.1

5.0%

Adjusted EBITDA margin

9.7 %

10.4 %

(70 bps)


Inbound orders

$1,607.1

$1,509.9

6.4%

Backlog

$7,218.0

$8,655.8

(16.6%)

Subsea reported third quarter revenue of $1,501.8 million, an increase of 11.9 percent from the prior year driven by continued strong execution of our backlog. Revenue growth in project activity was most significant in the United States, Norway and Africa. Sequentially, revenue increased 9 percent primarily driven by continued improvement in operational efficiency as well as increased activity in Subsea Services.

Subsea reported an operating profit of $20.3 million. Operating profit increased versus the prior-year quarter primarily driven by significantly lower charges and credits in the current period. Sequentially, operating profit benefited from project completions and improved asset utilization in the third quarter.

Adjusted EBITDA was $146 million, with a margin of 9.7 percent. Adjusted EBITDA increased versus the prior-year quarter as higher activity and the benefits of our cost reduction initiatives more than offset the COVID-19-related inefficiencies in the quarter.

Third Quarter Subsea Highlights

  • Neptune Energy Fenja iEPCI™ (Norway)
    Began installation of electrically trace heated pipe-in-pipe.
  • BP Atlantis Phase 3 iEPCI™ (United States)
    Helped client achieve fast track start-up.
  • Woodside Pyxis iEPCI™ (Australia)
    Successful installation of two Subsea 2.0™ trees.
  • Shell BC-10 (Brazil)
    Successful installation of Subsea 2.0™ tree; well is now operational and producing.

Subsea inbound orders were $1,607.1 million for the quarter, resulting in a book-to-bill of 1.1. The following announced awards were included in the period:

  • Libra Consortium’s Mero 2 Project (Brazil)
    Large* contract from the Libra Consortium for the Mero 2 project, operated by Petrobras. The contract covers the engineering, procurement, construction, installation and pre-commissioning of the infield rigid riser and flowlines for production, including the water alternating gas wells. It also comprises the installation and pre-commissioning of service flexible lines and steel tube umbilicals, as well as towing and hook-up of the floating production storage and offloading unit (FPSO).
    *A “large” award ranges between $500 million and $1 billion.
  • ExxonMobil Payara Project (Guyana)
    Large* contract for the subsea system for the Payara project in Guyana from ExxonMobil subsidiary Esso Exploration and Production Guyana Limited. The contract covers the manufacture and delivery of the subsea production system, including 41 enhanced vertical deep water trees and associated tooling, six flexible risers and 10 manifolds along with associated controls and tie-in development.
    *A “large” award ranges between $500 million and $1 billion.

Subsea

Estimated Backlog Scheduling as of September 30, 2020

(In millions)

Consolidated
backlog1,2

Non-
consolidated
backlog3

2020 (3 months)

$1,068

$36

2021

$3,402

$129

2022 and beyond

$2,748

$509

Total

$7,218

$674

1 Backlog in the period was increased by a foreign exchange impact of $78 million.

2 Backlog does not capture all revenue potential for Subsea Services.

3 Non-consolidated backlog reflects the proportional share of backlog related to joint ventures that is not consolidated due to our minority ownership position.

Technip Energies

Financial Highlights
Reconciliation of U.S. GAAP to non-GAAP financial measures are below and in financial schedules.

Three Months Ended

(In millions)

September 30,

2020

September 30,

2019

Change

Revenue

$1,608.2

$1,596.3

0.7%

Operating profit

$129.5

$284.6

(54.5%)

Adjusted EBITDA

$174.5

$304.2

(42.6%)

Adjusted EBITDA margin

10.9 %

19.1 %

(820 bps)


Inbound orders

$412.8

$696.0

(40.7%)

Backlog

$12,059.2

$15,030.8

(19.8%)

Technip Energies reported third quarter revenue of $1,608.2 million, largely unchanged versus the prior-year quarter. Revenue benefited from the continued ramp-up of Arctic LNG 2 and higher activity on downstream projects in Africa, North America and India, which more than offset the anticipated decline in revenue from Yamal LNG. Sequentially, revenue increased 4.5 percent primarily driven by the improvement in operational efficiency related to our supply chain and construction sites.

Technip Energies reported operating profit of $129.5 million; adjusted EBITDA was $174.5 million with a margin of 10.9 percent. Operating profit decreased 54.5 percent versus the prior-year quarter primarily due to a reduced contribution from Yamal LNG and lower margin realization on early phase projects, including Arctic LNG 2. Despite the challenging environment, project execution remained strong across the portfolio. Sequentially, operating profit increased 9.7 percent when excluding the benefit of the favorable litigation settlement in the second quarter of $113.2 million.

Third Quarter Technip Energies Highlights

  • Arctic LNG 2 (Russia)
    Construction progressing at all yards in China and on-site in the Gydan peninsula.
  • Eni Coral South FLNG (Mozambique)
    Seven out of thirteen modules were installed on the hull in South Korea, confirming the good progress of the module lifting campaign and integration phase.
  • Dow Chemical Company LHC-9 (United States)
    Our technology and design expertise have helped Dow achieve well over 2,000 KTA capacity at their new U.S. Gulf Coast steam cracker, the largest operating ethylene unit in the world.

Partnership and Alliance Highlights

  • LanzaTech Sustainable Aviation Fuel Biorefinery (United States)
    TechnipFMC’s proprietary Hummingbird® ethanol-to-ethylene technology has been selected by LanzaTech for a key application which, when combined with LanzaTech’s Alcohol-to-Jet (ATJ) technology, can be used to manufacture sustainable aviation fuel (SAF) using ethanol as raw material. These sustainable technologies will be deployed in a first commercial demonstration-scale integrated biorefinery at LanzaTech’s Freedom Pines site in Georgia, U.S., that will produce 10 million gallons per year of SAF and renewable diesel starting from sustainable ethanol sources.

Technip Energies inbound orders were $412.8 million for the quarter, resulting in a book-to-bill of 0.3. The following announced award and early engagement studies were included in the period:

  • Shell Moerdijk Plant Ethylene Furnaces Modernization (Netherlands)
    Significant* Engineering, Procurement and module Fabrication (EPF) contract from Shell Moerdijk for proprietary equipment and related services for eight ethylene furnaces at the Moerdijk petrochemicals complex. The new furnaces will utilize TechnipFMC’s innovative multi-line radiant coil design and will replace 16 older units without reducing capacity at the facility, while increasing energy efficiency and reducing greenhouse gas emissions.
    *A “significant” award ranges between $75 million and $250 million.
  • Sakhalin-1 Russian Far East LNG Plant (Russian Federation)
    Awarded FEED contract by Exxon Neftegas Ltd for the 6.2Mtpa LNG plant to be built in De-Kastri, Khabarovsk Krai in Russia. This award demonstrates our leadership in engineering services and EPC for significant LNG projects.
  • Qatar CO2 Sequestration (Qatar)
    Awarded the engineering study and pre-FEED contract for a 5Mtpa CO2 project in Qatar; this is the largest carbon recovery and sequestration facility in the region.
  • Hydrogen Generation (U.K. North Sea)
    Genesis has been awarded a concept study which aims to identify clean gas-to-hydrogen generation from natural gas in the North Sea.

Technip Energies

Estimated Backlog Scheduling as of September 30, 2020

(In millions)

Consolidated
backlog1

Non-
consolidated
backlog2

2020 (3 months)

$1,611

$146

2021

$5,790

$828

2022 and beyond

$4,658

$1,025

Total

$12,059

$1,999

1 Backlog in the period was increased by a foreign exchange impact of $122 million.

2 Non-consolidated backlog reflects the proportional share of backlog related to joint ventures that is not consolidated due to our minority ownership position.

Surface Technologies

Financial Highlights
Reconciliation of U.S. GAAP to non-GAAP financial measures are below and in financial schedules.

Three Months Ended

(In millions)

September 30,

2020

September 30, 2019

Change

Revenue

$225.7

$396.6

(43.1%)

Operating profit (loss)

$(7.0)

$6.1

n/m

Adjusted EBITDA

$17.3

$44.4

(61.0%)

Adjusted EBITDA margin

7.7 %

11.2 %

(350 bps)


Inbound orders

$207.5

$404.7

(48.7%)

Backlog

$368.9

$428.7

(13.9%)

Surface Technologies reported third quarter revenue of $225.7 million, a decrease of 43.1 percent from the prior-year quarter. The decline was primarily driven by the sharp reduction in operator activity in North America. Revenue outside of North America displayed resilience, with a more modest decline due to reduced activity levels. Nearly 70 percent of total segment revenue was generated outside of North America in the period.

Surface Technologies reported an operating loss of $7 million; adjusted EBITDA was $17.3 million with a margin of 7.7 percent. Operating profit decreased primarily due to lower activity in North America driven by the significant decline in rig count and completions-related activity, partially offset by the accelerated cost reduction actions initiated in the first quarter. Sequentially, operating profit improved through a combination of favorable product mix, the benefit of our cost reduction program, and improved manufacturing execution.

Inbound orders for the quarter were $207.5 million, a decrease versus the prior-year quarter primarily due to the significant reduction in North America activity. Backlog decreased 13.9 percent versus the prior-year quarter to $368.9 million. Given the short-cycle nature of the business, orders are generally converted into revenue within twelve months.

Third Quarter Surface Technologies Highlights

  • 5-year frame agreement (Oman)
    Received orders for wellheads, trees and services as part of a new 5-year frame agreement with Petrogas Rima.
  • High-specification equipment and services (Kuwait)
    Nominated to supply high-specification gas equipment and in-country services for client’s 20 well program.
  • Expansion of offerings (United Arab Emirates)
    Received a services award for maintenance of wellheads and trees from Crescent Petroleum for its Nahrwan field; successfully completed the installation of trees as part of Total’s Diyab Unconventional Exploration project.
  • Successful commercialization of iComplete™ system (United States)
    Secured awards from operators in all major U.S. basins for our iComplete™ system offering for surface well completions.
  • Orders for new UH-5 Unihead® wellhead systems (Malaysia)
    Received orders with Carigali Hess Operating Company (CHOC) in support of its migration to our new standard wellhead products which reduce installation time, improve safety and minimize customers’ non-productive time.

Corporate and Other Items

Corporate expense in the quarter was $27.7 million. Excluding charges and credits totaling $3.8 million of expense, corporate expense was $23.9 million. The results benefited from the accelerated pace of cost reduction actions.

Foreign exchange gains in the quarter were $5.6 million, which resulted primarily from the timing of naturally hedged projects.

Net interest expense was $91.8 million in the quarter, which included an increase in the liability payable to joint venture partners of $61.9 million.

The Company recorded a tax provision in the quarter of $22.5 million.

Total depreciation and amortization for the quarter was $108.5 million.

The Company ended the period with cash and cash equivalents of $4,244 million; net cash was $383.8 million.

2020 Full-Year Financial Guidance1

The Company’s full-year guidance for 2020 can be found in the table below. No updates were made to the previous guidance that was issued on July 29, 2020.

All segment guidance assumes no further material degradation from COVID-19-related impacts.

2020 Guidance


Subsea


Technip Energies


Surface Technologies

Revenue in a range of $5.3 - 5.6 billion


Revenue in a range of $6.3 - 6.8 billion


Revenue in a range of $950 - 1,150 million


EBITDA margin at least 8.5% (excluding charges and credits)


EBITDA margin at least 10% (excluding charges and credits)


EBITDA margin at least 5.5% (excluding charges and credits)


TechnipFMC

Corporate expense, net $130 - 150 million


Net interest expense $80 - 90 million

(excluding the impact of revaluation of partners’ mandatorily redeemable financial liability)


Tax provision, as reported $80 - 90 million


Capital expenditures approximately $300 million


Free cash flow $0 - 150 million

(cash flow from operations less capital expenditures)


______________________
12020 segment guidance is reflective of new business perimeters previously announced in 2019. Businesses with approximately $120 million of total revenue in 2019, most of which was in the Surface Technologies segment, were re-allocated to Technip Energies at the beginning of 2020. The revenue of these businesses is included in Technip Energies guidance for 2020.

Our guidance measures adjusted EBITDA margin, corporate expense, net, net interest expense (excluding the impact of revaluation of partners’ mandatorily redeemable financial liability) and free cash flow are non-GAAP financial measures. We are unable to provide a reconciliation to comparable GAAP financial measures on a forward-looking basis without unreasonable effort because of the unpredictability of the individual components of the most directly comparable GAAP financial measure and the variability of items excluded from each such measure. Such information may have a significant, and potentially unpredictable, impact on our future financial results.

Teleconference

The Company will host a teleconference on Thursday, October 22, 2020 to discuss the third quarter 2020 financial results. The call will begin at 1 p.m. London time (8 a.m. New York time). Dial-in information and an accompanying presentation can be found at www.TechnipFMC.com.

Webcast access will also be available on our website prior to the start of the call. An archived audio replay will be available after the event at the same website address. In the event of a disruption of service or technical difficulty during the call, information will be posted on our website.

###

About TechnipFMC

TechnipFMC is a global leader in the energy industry; delivering projects, products, technologies and services. With our proprietary technologies and production systems, integrated expertise, and comprehensive solutions, we are transforming our customers’ project economics.

Organized in three business segments — Subsea, Surface Technologies and Technip Energies — we are uniquely positioned to deliver greater efficiency across project lifecycles from concept to project delivery and beyond. Through innovative technologies and improved efficiencies, our offering unlocks new possibilities for our customers in developing their energy resources and in their positioning to meet the energy transition challenge.

Each of our approximately 37,000 employees is driven by a steady commitment to clients and a culture of project execution, purposeful innovation, challenging industry conventions, and rethinking how the best results are achieved.

TechnipFMC utilizes its website www.TechnipFMC.com as a channel of distribution of material company information. To learn more about us and how we are enhancing the performance of the world’s energy industry, go to www.TechnipFMC.com and follow us on Twitter @TechnipFMC.

This communication contains “forward-looking statements” as defined in Section 27A of the United States Securities Act of 1933, as amended, and Section 21E of the United States Securities Exchange Act of 1934, as amended. Words such as “guidance,” “confident,” “believe,” “expect,” “anticipate,” “plan,” “intend,” “foresee,” “should,” “would,” “could,” “may,” “will,” “likely,” “predicated,” “estimate,” “outlook” and similar expressions are intended to identify forward-looking statements, which are generally not historical in nature. Such forward-looking statements involve significant risks, uncertainties and assumptions that could cause actual results to differ materially from our historical experience and our present expectations or projections, including the following known material factors:

  • risks associated with disease outbreaks and other public health issues, including the coronavirus disease 2019 (“COVID-19”), their impact on the global economy and the business of our company, customers, suppliers and other partners, changes in, and the administration of, treaties, laws, and regulations, including in response to such issues and the potential for such issues to exacerbate other risks we face, including those related to the factors listed or referenced below;
  • risks associated with our ability to consummate our proposed separation and spin-off;
  • unanticipated changes relating to competitive factors in our industry;
  • demand for our products and services, which is affected by changes in the price of, and demand for, crude oil and natural gas in domestic and international markets;
  • our ability to develop and implement new technologies and services, as well as our ability to protect and maintain critical intellectual property assets;
  • potential liabilities arising out of the installation or use of our products;
  • cost overruns related to our fixed price contracts or capital asset construction

Contacts

Investor relations

Matt Seinsheimer
Vice President Investor Relations
Tel: +1 281 260 3665
Email: This email address is being protected from spambots. You need JavaScript enabled to view it.

Phillip Lindsay
Director Investor Relations (Europe)
Tel: +44 (0) 20 3429 3929
Email: This email address is being protected from spambots. You need JavaScript enabled to view it.

Media relations

Christophe Bélorgeot
Senior Vice President Corporate Engagement
Tel: +33 1 47 78 39 92
Email: This email address is being protected from spambots. You need JavaScript enabled to view it.

Brooke Robertson
Public Relations Director
Tel: +1 281 591 4108
Email: This email address is being protected from spambots. You need JavaScript enabled to view it.


Read full story here

PDI expands relationship with EG Group to more broadly serve the global convenience retailer’s multi-site network

ATLANTA--(BUSINESS WIRE)--#EGGroup--PDI (www.pdisoftware.com), a global provider of enterprise software solutions to the convenience retail, wholesale petroleum and logistics industries, announced it is extending its business relationship with the UK-based gasoline and convenience retailer, EG Group.


EG Group is expanding its use of PDI’s ERP, Fuel Pricing, and Logistics solutions to thousands of sites across Europe, North America and Australia as part of the agreement. Additionally, they are currently exploring using PDI Marketing Cloud Solutions, a proven, industry-specific marketing solution that helps retailers drive topline revenue by combining back office, promotional and loyalty data to attract and retain customers. The announcement follows several acquisitions EG Group made in the U.S. and other markets. Most recently, the retailer acquired the U.S.-based c-store chain Cumberland Farms as part of its ongoing global expansion strategy.

“EG Group has been extending its global reach over the last few years, and we are always keen to improve the retail experience. We needed a software partner that could support both the international expansion and complexity of our current operations,” expressed Mohsin Issa, Founder and co-CEO at EG Group. “PDI’s industry expertise and reputation for customer service, combined with its scalable, end-to-end solutions provide a suitable technology platform for us to consider and build on.”

Expanding solutions portfolio and global reach to support customers

PDI has also been on a rapid growth trajectory, expanding and strengthening its solution portfolio and global footprint over the last two years. The software company has acquired several U.S.- and internationally-based businesses, making significant investments to grow its retail and wholesale ERP, logistics management, fuel pricing, loyalty, insights and, most recently, payments capabilities to better serve its customers.

“Our mission is to help our customers thrive by building great solutions that make it easy for them to run every part of their organization, regardless of size or geographic location,” said Jimmy Frangis, CEO at PDI. “A big part of our strategy is being able to holistically serve the diverse needs of growing, global businesses like EG Group, and we look forward to helping them succeed for years to come.”

PDI will continue integrating and expanding its solutions portfolio to help customers realize their growth goals and easily adapt to market changes.

About PDI
Professional Datasolutions, Inc. (PDI) helps convenience retailers and petroleum wholesalers thrive through digital transformation and enterprise software that enables them to grow topline revenue, optimize operations and unify their business across the entire value chain. Over 1,500 customers in more than 200,000 locations worldwide count on our leading ERP, logistics, fuel pricing and marketing cloud solutions to provide insights that increase volume, margin and customer loyalty. PDI owns and operates the Fuel Rewards® loyalty program that is consistently ranked as a top-performing fuel savings program year after year. For more than 35 years, our comprehensive suite of solutions and unmatched expertise have helped customers of any size reimagine their enterprise and deliver exceptional customer experiences. For more information about PDI, visit www.pdisoftware.com.

About EG Group
Founded in 2001 by the Issa Family, United Kingdom based EG Group is a leading petrol forecourt retail convenience operator who has established partnerships with global brands such as ESSO, BP, Shell, Carrefour, Louise Delhaize, SPAR, Starbucks, Burger King, KFC, Greggs and Subway. The business has an established pedigree of delivering a world class fuel, convenience and food-to-go offer. The EG Group currently employs over 55,000 colleagues working in circa 6,250 sites across ten international markets in Europe, USA and Australia. EG Group has made a significant commitment to delivering a modern consumer retail offer which exceeds expectations and creates a true ‘one-stop’ retail destination to satisfy multiple consumer missions. The business is regularly recognised for innovation and investment in convenience retail assets, the employees and the systems. Zuber Issa and Mohsin Issa, Co-Founders and co-CEOs, EG Group, were jointly named the 2018 EY Entrepreneur of the Year in the UK. Visit www.eurogarages.com for further information.


Contacts

Cederick Johnson, PDI
+1 254.410.7600 I This email address is being protected from spambots. You need JavaScript enabled to view it.

DAVIDSON, N.C.--(BUSINESS WIRE)--Ingersoll Rand Inc. (NYSE: IR), a global provider of mission-critical flow creation and industrial solutions, will issue its third-quarter 2020 earnings release after the market closes on Monday, November 2, 2020.


Ingersoll Rand will also host a live earnings conference call to discuss the third-quarter results on Tuesday, November 3, 2020 at 10 a.m. (Eastern time). To participate in the call, please dial 1-833-502-0496, domestically, or 1-778-560-2573, internationally, and use conference ID, 9265953, or ask to be joined into the Ingersoll Rand call.

A real-time audio webcast of the presentation can be accessed via the Events and Presentations section of the Ingersoll Rand Investor Relations website (https://investors.irco.com), where related materials will be posted prior to the conference call.

A replay of the webcast will be available after conclusion of the conference and can be accessed on the Ingersoll Rand Investor Relations website.

About Ingersoll Rand Inc.

Ingersoll Rand Inc. (NYSE:IR), driven by an entrepreneurial spirit and ownership mindset, is dedicated to helping make life better for our employees, customers and communities. Customers lean on us for our technology-driven excellence in mission-critical flow creation and industrial solutions across 40+ respected brands where our products and services excel in the most complex and harsh conditions. Our employees develop customers for life through their daily commitment to expertise, productivity and efficiency. For more information, visit www.IRCO.com.


Contacts

Media:
Misty Zelent
(704) 896-5324, This email address is being protected from spambots. You need JavaScript enabled to view it.

Investor Relations:
Vik Kini
(414) 212-4753, This email address is being protected from spambots. You need JavaScript enabled to view it.

  • Orders of $5.1 billion for the quarter, up 4% sequentially and down 34% year-over-year
  • Revenue of $5.0 billion for the quarter, up 7% sequentially and down 14% year-over-year
  • GAAP operating loss of $49 million for the quarter, up 6% sequentially and unfavorable year-over-year.
  • Adjusted operating income (a non-GAAP measure) of $234 million for the quarter was favorable sequentially and down 45% year-over-year.
  • GAAP loss per share of $(0.25) for the quarter which included $0.29 per share of adjusting items. Adjusted earnings per share (a non-GAAP measure) was $0.04.
  • Cash flows generated from operating activities were $219 million for the quarter. Free cash flow (a non-GAAP measure) for the quarter was $52 million.

    The Company presents its financial results in accordance with GAAP. However, management believes that using additional non-GAAP measures will enhance the evaluation of the profitability of the Company and its ongoing operations. Please see Tables 1a, 1b and 1c in the section entitled "Charges & Credits" for a reconciliation of GAAP to non-GAAP financial measures.  Certain columns and rows in our tables and financial statements may not sum up due to the use of rounded numbers. 

LONDON & HOUSTON--(BUSINESS WIRE)--Baker Hughes Company (NYSE: BKR) ("Baker Hughes" or the "Company") announced results today for the third quarter of 2020.



Three Months Ended


Variance

(in millions except per share amounts)

September 30,
2020

June 30,
2020

September 30,
2019


Sequential

Year-
over-year

Orders

$

5,106


$

4,888


$

7,783


4%

(34)%

Revenue

5,049


4,736


5,882


7%

(14)%

Operating income (loss)

(49)


(52)


297


6%

U

Adjusted operating income (non-GAAP)

234


104


422


F

(45)%

Net income (loss) attributable to Baker Hughes

(170)


(195)


57


13%

U

Adjusted net income (loss) (non-GAAP) attributable to Baker Hughes

27


(31)


114


F

(76)%

EPS attributable to Class A shareholders

(0.25)


(0.30)


0.11


15%

U

Adjusted EPS (non-GAAP) attributable to Class A shareholders

0.04


(0.05)


0.21


F

(81)%

Cash flow from operating activities

219


230


360


(5)%

(39)%

Free cash flow (non-GAAP)

52


63


161


(17)%

(68)%

"F" is used in most instances when variance is above 100%. Additionally, "U" is used in most instances when variance is below (100)%.

“Despite continued uncertainty in global oil and gas markets and the ongoing impact of the COVID-19 pandemic, we produced solid results in the third quarter of 2020. I am pleased with the continued execution on cost-out from our Oilfield Services (OFS) and Oilfield Equipment (OFE) teams, the commercial success and performance from Turbomachinery & Process Solutions (TPS) and Digital Solutions (DS), and our continued free cash flow generation during the quarter. I am proud of our employees and their continued commitment to delivering for our customers and shareholders,” said Lorenzo Simonelli, Baker Hughes Chairman and Chief Executive Officer.

“After significant turmoil during the first half of the year, oil markets have somewhat stabilized. However, demand recovery is beginning to level off and significant excess capacity remains, which could create volatility in the future. The outlook for natural gas is slightly more optimistic as forward prices have improved with strong demand in Asia and lower expected future gas production in the U.S.

“Despite the uncertain macro environment, we are executing on the framework we laid out earlier this year. We are on track to hit our goals of right-sizing the business, generating free cash flow, and achieving $700 million in annualized cost savings by year end.

"As we move forward, we are intensely focused on improving the margin and return profile of Baker Hughes despite the near-term macro volatility, while at the same time executing on our long-term strategy to evolve our portfolio along with the energy landscape. Baker Hughes remains committed to leading the energy transition and becoming a key enabler to decarbonizing oil and gas and other industries,” concluded Simonelli.

Quarter Highlights

Supporting our Customers

The TPS segment secured a major LNG order with longtime partner Qatar Petroleum to supply multiple main refrigerant compressors for Qatar Petroleum’s North Field East (NFE) project, executed by Qatargas. The total award is part of four LNG “mega trains,” representing 33 million tons per annum (MTPA) of additional capacity. As part of Baker Hughes’ commitment to support customers in decarbonizing their operations, the latest compression technology for the NFE project is expected to reduce emissions by ~5% versus previous technologies.

TPS also continued to innovate its FPSO technologies to support sustainable operations. The business was awarded a FPSO contract in Latin America for power generation, compression, and related equipment, including six LM2500+G4 gas turbines and two high pressure compressors for gas reinjection. The contract includes major capital spare parts and services.

The OFS segment delivered 83% of its global drilling services jobs remotely, compared to 72% in the second quarter. OFS remote operations have led to consistently better outcomes for customers at a record pace, and remote drilling increased most prominently in Asia Pacific (APAC) and the Middle East, and 100% of drilling jobs were completed using remote operations in Latin America and the Russia Caspian Region.

In the OFE segment, the Flexible Pipe Systems product line continues to gain traction in China, and was awarded a contract for high temperature subsea flexible jumpers and associated equipment as part of an Engineering, Procurement and Construction (EPC) project.

OFE also secured a major services contract for the supply of conductor casings for all the deep well drilling programs and associated logistics for a customer in the Middle East. The contract affirms OFE's status as the preferred supplier for premium connectors and casings.

The DS segment secured a major three-year frame agreement with Petrobras for multiple solutions from our Bently Nevada, Nexus Controls, and Panametrics product lines to enhance the customer’s operations through risk mitigation and performance standardization and improvements. A broad range of condition monitoring sensors will be deployed including wireless, vibration and motor sensors, as well as plant control systems, and flare flow meters. The agreement is the largest Bently Nevada order ever for Latin America and includes the latest generation Orbit 60 system launched in 2019.

DS also secured several contracts to deliver advanced technologies for LNG, power generation, and pipeline infrastructure. Bently Nevada was awarded a five-year agreement with Sonatrach in Algeria, providing a range of vibration monitoring systems for multiple LNG and liquid petroleum gas plants. Panametrics secured a three-year contract with Snam for ultrasonic flow meters, helping to ensure 32,000+ km of pipelines in Italy remain stable and safe.

Executing on Priorities

Following several consecutive quarters securing large downstream chemicals contracts, the OFS Chemicals product line continued to win contracts in the third quarter including a five-year contract to provide process and fuel treatment products and services to HollyFrontier in North America. OFS will provide hydrocarbon treatment products and services at HollyFrontier’s four U.S. refineries.

OFS also continued to focus on its differentiated portfolio with another consecutive quarter securing multi-year contracts for drilling services, completions, and artificial lift. In Guyana, OFS secured a five-year contract for drilling services, drill bits, and drilling and completion fluids. The Artificial Lift product line was awarded a contract for equipment and services in offshore Qatar, displacing a major competitor.

TPS achieved important execution milestones for LNG projects in the third quarter. In September, TPS completed the successful mechanical and performance tests for one of its largest size expander-compressors for Novatek’s Arctic LNG 2 project. TPS also completed the first phase of the Calcasieu Pass LNG project with Venture Global, shipping the first two equipment modules from Baker Hughes’ facility in Italy to the U.S.

DS continued to drive growth across industrial end markets, including aerospace and automotive. Bently Nevada achieved its first order for the Orbit 60 system outside of the oil and gas sector, signing a contract with an iron ore mining customer in Australia. The Waygate Technologies product line launched a unique high energy CT scanner system and secured a large multi-year inspection service order with a space exploration customer. In China, DS won multiple orders for sensor and inspection technologies with electric vehicle and aerospace OEMs.

Leading with Innovation

Baker Hughes continued to drive advancements in leading technologies while supporting its strategy to lead in the energy transition. TPS successfully tested the world’s first “hybrid” hydrogen turbine designed for a gas network with Snam, paving the way to implement adoption of hydrogen blended with natural gas in Snam’s current transportation network infrastructure. The test used a NovaLT™12 gas turbine with a 10% blend of hydrogen with natural gas. Once installed, the turbine can compress and move hydrogen fuel blends through Snam’s network of pipelines while using the same fuel to power itself, significantly contributing to the reduction of CO2 emissions in Italy.

OFS introduced the Lucida advanced rotary steerable service, which integrates hardware, software, automation, and remote connectivity to help customers drill faster and deliver more precise, higher-quality wells. The service fully complements OFS’ automation and remote operations services. Lucida is designed to maximize directional drilling performance and well productivity by incorporating advanced electronics and near-bit sensors that enable drillers to more precisely guide bottomhole assemblies.

OFE launched the Terminator vessel-deployed subsea wellhead cutting system, using a first-of-its-kind mechanical wellhead removal method to reduce time, fuel consumption and safety risks . Terminator was successfully launched with Wintershall DEA in Norway, cutting a subsea wellhead from an abandoned exploration well in 360 meters of water in only 35 minutes, compared to five or six hours with alternative abrasive cutting methods. Terminator joins the Subsea Connect suite of technologies for OFE and OFS customers, and it is smaller and lighter than previous systems.

DS continued to gain traction with its innovative Flare.IQ technology, securing a five-year contract with a North American customer. A key technology in Baker Hughes’ energy transition portfolio, Flare.IQ helps operators manage their flare assets remotely and can also reduce methane emissions, ensure high-efficiency flare combustion, and reduce steam usage in flare systems using advanced sensors and analytics.

The BakerHughesC3.ai joint venture alliance secured a contract with a customer in the North Sea for BHC3™ Reliability. BHC3 Reliability is a comprehensive software solution that provides reliability engineers, process engineers, and maintenance managers with AI-enabled insights to address process and equipment performance risks. The application delivers value through increased revenue from recovered production, reduced costs of unplanned downtime, extended equipment life, and improved safety in operations.

Consolidated Results by Reporting Segment

Consolidated Orders by Reporting Segment

(in millions)

Three Months Ended


Variance

Consolidated segment orders

September 30,
2020

June 30,
2020

September 30,
2019


Sequential

Year-
over-year

Oilfield Services

$

2,296


$

2,411


$

3,354


(5)

%

(32)

%

Oilfield Equipment

432


699


1,029


(38)

%

(58)

%

Turbomachinery & Process Solutions

1,885


1,313


2,784


44

%

(32)

%

Digital Solutions

493


465


616


6

%

(20)

%

Total

$

5,106


$

4,888


$

7,783


4

%

(34)

%

Orders for the quarter were $5,106 million, up 4% sequentially and down 34% year-over-year. The sequential increase was a result of higher order intake in Turbomachinery & Process Solutions and Digital Solutions, partially offset by lower orders in Oilfield Services and Oilfield Equipment. Equipment orders were up 17% sequentially and service orders were down 6%.

Year-over-year, the decline in orders was a result of lower order intake across all segments. Year-over-year equipment orders were down 40% and service orders were down 28%.

The Company's total book-to-bill ratio in the quarter was 1; the equipment book-to-bill ratio in the quarter was 1.1.

Remaining Performance Obligations (RPO) in the third quarter ended at $23.0 billion, an increase of $0.1 billion from the second quarter of 2020. Equipment RPO was $8.3 billion, up 4% sequentially. Services RPO was $14.7 billion, down 1% sequentially.

Consolidated Revenue by Reporting Segment

(in millions)

Three Months Ended


Variance

Consolidated segment revenue

September 30,
2020

June 30,
2020

September 30,
2019


Sequential

Year-over
-year

Oilfield Services

$

2,308


$

2,411


$

3,348


(4)

%

(31)

%

Oilfield Equipment

726


696


728


4

%

%

Turbomachinery & Process Solutions

1,513


1,161


1,197


30

%

26

%

Digital Solutions

503


468


609


7

%

(17)

%

Total

$

5,049


$

4,736


$

5,882


7

%

(14)

%

Revenue for the quarter was $5,049 million, an increase of 7%, sequentially. The increase in revenue was driven by Turbomachinery & Process Solutions, Digital Solutions, and Oilfield Equipment, partially offset by Oilfield Services.

Compared to the same quarter last year, revenue was down 14%, driven by lower volume across the Oilfield Services and Digital Solutions segments, partially offset by Turbomachinery & Process Solutions.

Consolidated Operating Income by Reporting Segment

(in millions)

Three Months Ended


Variance

Segment operating income

September 30,
2020

June 30,
2020

September 30,
2019


Sequential

Year-over-
year

Oilfield Services

$

93


$

46


$

274


F

(66)

%

Oilfield Equipment

19


(14)


14


F

37

%

Turbomachinery & Process Solutions

191


149


161


28

%

18

%

Digital Solutions

46


41


82


12

%

(44)

%

Total segment operating income

349


221


531


57

%

(34)

%

Corporate

(115)


(117)


(109)


2

%

(5)

%

Inventory impairment

(42)


(16)


U

U

Restructuring, impairment & other charges

(209)


(103)


(71)


U

U

Separation related

(32)


(37)


(54)


13

%

41

%

Operating income (loss)

(49)


(52)


297


6

%

U

Adjusted operating income*

$

234


$

104


$

422


F

(45)

%

*Non-GAAP measure.

"F" is used in most instances when variance is above 100%. Additionally, "U" is used in most instances when variance is below (100)%.

On a GAAP basis, operating loss for the third quarter of 2020 was $49 million. Operating loss decreased $3 million sequentially and increased $346 million year-over-year. Total segment operating income was $349 million for the third quarter of 2020, up 57% sequentially and down 34% year-over-year.

Adjusted operating income (a non-GAAP measure) for the third quarter of 2020 was $234 million, which excludes adjustments totaling $283 million before tax, mainly related to asset impairments, restructuring and separation related charges. A complete list of the adjusting items and associated reconciliation from GAAP has been provided in Table 1a in the section entitled “Charges and Credits.” Adjusted operating income for the third quarter was up 124% sequentially, driven by increased volume and productivity. Adjusted operating income was down 45% year-over-year driven by lower margins in the Oilfield Services, and Digital Solutions segments, partially offset by volume in Turbomachinery & Process Solutions, and margin expansion in Oilfield Equipment.

Depreciation and amortization for the third quarter of 2020 was $315 million.

Corporate costs were $115 million in the third quarter of 2020, down 2% sequentially and up 5% year-over-year.

Other Financial Items

Income tax expense in the third quarter of 2020 was $6 million. Included in income tax is a $42 million benefit related to the CARES Act. This benefit has been excluded from adjusted earnings per share.

Other non-operating loss in the third quarter of 2020 was $149 million. Included in other non-operating loss was a $132 million loss primarily related to the write-down of assets held for sale.

GAAP diluted loss per share was $(0.25). Adjusted diluted earnings per share was $0.04. Excluded from adjusted diluted earnings per share were all items listed in Table 1a in the section entitled "Charges and Credits" as well as the "other adjustments (non-operating)" found in Table 1b.

Cash flow from operating activities was $219 million for the third quarter of 2020. Free cash flow (a non-GAAP measure) for the quarter was $52 million. A reconciliation from GAAP has been provided in Table 1c in the section entitled "Charges and Credits."

Capital expenditures, net of proceeds from disposal of assets, were $167 million for the third quarter of 2020.

Results by Reporting Segment

The following segment discussions and variance explanations are intended to reflect management's view of the relevant comparisons of financial results on a sequential or year-over-year basis, depending on the business dynamics of the reporting segments.

Oilfield Services

(in millions)

Three Months Ended


Variance

Oilfield Services

September 30,
2020

June 30,
2020

September 30,
2019


Sequential

Year-over-
year

Revenue

$

2,308


$

2,411


$

3,348


(4)

%

(31)

%

Operating income

$

93


$

46


$

274


F

(66)

%

Operating income margin

4.0

%

1.9

%

8.2

%


2.1pts

-4.2pts


Oilfield Services (OFS) revenue of $2,308 million for the third quarter decreased by $102 million, or 4%, sequentially.

North America revenue was $559 million, down 7% sequentially. International revenue was $1,749 million, a decrease of 3% sequentially, driven by lower revenues in Sub-Saharan Africa, Asia Pacific, and the Middle East, partially offset by Latin America and Europe.

Segment operating income before tax for the quarter was $93 million. Operating income for the third quarter of 2020 was up $47 million sequentially, primarily driven by productivity as a result of cost efficiencies and restructuring.

Oilfield Equipment

(in millions)

Three Months Ended


Variance

Oilfield Equipment

September 30,
2020

June 30,
2020

September 30,
2019


Sequential

Year-over-
year

Orders

$

432


$

699


$

1,029


(38)

%

(58)

%

Revenue

$

726


$

696


$

728


4

%

%

Operating income (loss)

$

19


$

(14)


$

14


F

37

%

Operating income margin

2.6

%

(2.1)

%

1.9

%


4.7pts

0.7pts

Oilfield Equipment (OFE) orders were down $597 million, or 58%, year-over-year, driven by lower order intake in most segments. Equipment orders were down 69% and services orders were down 31% year-over-year.

OFE revenue of $726 million for the quarter decreased $2 million year-over-year. The decrease was driven by lower volume in the Subsea Services, Offshore, Surface Pressure Control, and Subsea Drilling Systems businesses, offset by higher volume in the Subsea Production Systems and Flexible Pipe business.

Segment operating income before tax for the quarter was $19 million, an increase of $5 million year-over-year. The increase was driven by higher cost productivity.

Turbomachinery & Process Solutions

(in millions)

Three Months Ended


Variance

Turbomachinery & Process Solutions

September 30,
2020

June 30,
2020

September 30,
2019


Sequential

Year-over-
year

Orders

$

1,885


$

1,313


$

2,784


44

%

(32)

%

Revenue

$

1,513


$

1,161


$

1,197


30

%

26

%

Operating income

$

191


$

149


$

161


28

%

18

%

Operating income margin

12.6

%

12.8

%

13.5

%


-0.2pts

-0.9pts

Turbomachinery & Process Solutions (TPS) orders were down 32% year-over-year. Equipment orders were down 39% and service orders were down 17%.

TPS revenue of $1,513 million for the quarter increased $316 million, or 26%, year-over-year. The increase was driven by higher equipment volume. Equipment revenue in the quarter represented 46% of total segment revenue, and service revenue represented 54% of total segment revenue.

Segment operating income before tax for the quarter was $191 million, up $30 million, or 18%, year-over-year. The increase was driven by higher volume and cost productivity, offset partially by higher equipment mix.

Digital Solutions

(in millions)

Three Months Ended


Variance

Digital Solutions

September 30,
2020

June 30,
2020

September 30,
2019


Sequential

Year-over-
year

Orders

$

493


$

465


$

616


6

%

(20)

%

Revenue

$

503


$

468


$

609


7

%

(17)

%

Operating income

$

46


$

41


$

82


12

%

(44)

%

Operating income margin

9.2

%

8.8

%

13.5

%


0.3pts

-4.4pts

Digital Solutions (DS) orders were down 20% year-over-year, driven by lower order intake across all businesses.

DS revenue of $503 million for the quarter decreased 17% year-over-year, driven by lower volume across most businesses.

Segment operating income before tax for the quarter was $46 million, down 44% year-over-year. The decrease year-over-year was primarily driven by lower volume.

Charges & Credits

Table 1a. Reconciliation of GAAP and Adjusted Operating Income/(Loss)


Three Months Ended

(in millions)

September 30,
2020

June 30,
2020

September 30,
2019

Operating income (loss) (GAAP)

$

(49)


$

(52)


$

297


Separation related

32


37


54


Restructuring, impairment & other

209


103


71


Inventory impairment

42


16


Total operating income adjustments

283


156


125


Adjusted operating income (non-GAAP)

$

234


$

104


$

422


Table 1a reconciles operating income (loss), which is the directly comparable financial result determined in accordance with Generally Accepted Accounting Principles (GAAP), to adjusted operating income (a non-GAAP financial measure). Adjusted operating income excludes the impact of certain identified items.

Table 1b. Reconciliation of GAAP and Non-GAAP Net Income


Three Months Ended

(in millions, except per share amounts)

September 30,
2020

June 30,
2020

September 30,
2019

Net income (loss) attributable to Baker Hughes (GAAP)

$

(170)


$

(195)


$

57


Total operating income adjustments (identified items)

283


156


125


Other adjustments (non-operating) (1)

90


156


Tax on total adjustments

(54)


(11)


(15)


Total adjustments, net of income tax

319


301


110


Less: adjustments attributable to noncontrolling interests

122


138


53


Adjustments attributable to Baker Hughes

197


164


57


Adjusted net income (loss) attributable to Baker Hughes (non-GAAP)

$

27


$

(31)


$

114


Denominator:


Weighted-average shares of Class A common stock outstanding diluted

678


655


541


Adjusted earnings per Class A share— diluted (non-GAAP)

$

0.04


$

(0.05)


$

0.21


(1)

3Q'20: Primarily driven by loss on the write-down of assets held for sale partially offset by a tax benefit related to the CARES Act. 2Q'20: Primarily driven by loss on sale of business partially offset by a tax benefit related to the CARES Act.

Table 1b reconciles net income (loss) attributable to Baker Hughes, which is the directly comparable financial result determined in accordance with GAAP, to adjusted net income attributable to Baker Hughes (a non-GAAP financial measure). Adjusted net income attributable to Baker Hughes excludes the impact of certain identified items.

Table 1c. Reconciliation of Cash Flow From Operating Activities to Free Cash Flow


Three Months Ended

(in millions)

September 30,
2020

June 30,
2020

September 30,
2019

Cash flow from operating activities (GAAP)

$

219


$

230


$

360


Add: cash used in capital expenditures, net of proceeds from disposal of assets

(167)


(167)


(199)


Free cash flow (non-GAAP)

$

52


$

63


$

161


Table 1c reconciles net cash flows from operating activities, which is the directly comparable financial result determined in accordance with GAAP, to free cash flow (a non-GAAP financial measure).


Contacts

Investor Relations
Jud Bailey
+1 281-809-9088
This email address is being protected from spambots. You need JavaScript enabled to view it.

Media Relations
Thomas Millas
+1 910-515-7873
This email address is being protected from spambots. You need JavaScript enabled to view it.


Read full story here

HOUSTON--(BUSINESS WIRE)--Black Stone Minerals, L.P. (NYSE: BSM) (“Black Stone,” “BSM,” or “the Company”) today declared the distribution attributable to the third quarter of 2020. Additionally, the Partnership announced the date of its third quarter 2020 earnings call.


Common Distribution

The Board of Directors of the general partner has approved a cash distribution for common units attributable to the third quarter of 2020 of $0.15 per unit. Distributions will be payable on November 20, 2020 to unitholders of record on November 13, 2020.

Earnings Conference Call

The Partnership is scheduled to release details regarding its results for the third quarter of 2020 after the close of trading on November 2, 2020. A conference call to discuss these results is scheduled for November 3, 2020 at 9:00 a.m. Central time (10:00 a.m. Eastern time). The conference call will be broadcast live in listen-only mode on the company’s investor relations website at www.blackstoneminerals.com. If you would like to ask a question, the dial-in number for the conference call is 877-447-4732 for domestic participants and 615-247-0077 for international participants. The conference ID for the call is 4129508. Call participants are advised to call in 10 minutes in advance of the call start time.

A telephonic replay of the conference call will be available approximately two hours after the call through December 4, 2020, at 855-859-2056 for domestic replay and 404-537-3406 for international replay. The conference ID for the replay is 4129508.

About Black Stone Minerals, L.P.

Black Stone Minerals is one of the largest owners of oil and natural gas mineral interests in the United States. The Company owns mineral interests and royalty interests in 41 states in the continental United States. Black Stone believes its large, diversified asset base and long-lived, non-cost-bearing mineral and royalty interests provide for stable to growing production and reserves over time, allowing the majority of generated cash flow to be distributed to unitholders.


Contacts

Black Stone Minerals, L.P.

Jeff Wood
President and Chief Financial Officer

Evan Kiefer
Director, Finance and Investor Relations
Telephone: (713) 445-3200
This email address is being protected from spambots. You need JavaScript enabled to view it.

ST. CATHARINES, Ontario--(BUSINESS WIRE)--Algoma Central Corporation (TSX: ALC), a leading provider of marine transportation services, today announced that it will report its financial results for the three and nine months ended September 30, 2020, before market open on Wednesday, November 4, 2020.

About Algoma Central
Algoma owns and operates the largest fleet of dry and liquid bulk carriers operating on the Great Lakes - St. Lawrence Waterway, including self-unloading dry-bulk carriers, gearless dry-bulk carriers and product tankers. Algoma also owns ocean self-unloading dry-bulk vessels operating in international markets and a 50% interest in NovaAlgoma, which owns and operates a diversified portfolio of dry-bulk fleets serving customers internationally.

www.algonet.com or www.sedar.com


Contacts

Gregg A. Ruhl
President & CEO
905-687-7890

Peter D. Winkley
Chief Financial Officer
905-687-7897

HOUSTON--(BUSINESS WIRE)--Helix Energy Solutions Group, Inc. ("Helix") (NYSE: HLX) reported net income1 of $24.5 million, or $0.16 per diluted share, for the third quarter 2020 compared to $31.7 million, or $0.21 per diluted share, for the same period in 2019 and $5.5 million, or $0.04 per diluted share, for the second quarter 2020. Adjusted EBITDA2 was $52.7 million for the third quarter 2020 compared to $66.3 million for the third quarter 2019 and $47.9 million for the second quarter 2020.


For the nine months ended September 30, 2020, Helix reported net income of $18.0 million, or $0.10 per diluted share, compared to net income of $49.9 million, or $0.33 per diluted share, for the nine months ended September 30, 2019. Adjusted EBITDA for the nine months ended September 30, 2020 was $120.0 million compared to $146.8 million for the nine months ended September 30, 2019. The table below summarizes our results of operations:

Summary of Results

($ in thousands, except per share amounts, unaudited)

 
Three Months Ended Nine Months Ended
9/30/2020 9/30/2019 6/30/2020 9/30/2020 9/30/2019
Revenues

$

193,490


$

212,609


$

199,147


$

573,658


$

581,160


Gross Profit

$

34,628


$

55,074


$

29,576


$

66,214


$

111,262


18

%


26

%


15

%


12

%


19

%

 
Net Income1

$

24,499


$

31,695


$

5,450


$

18,011


$

49,867


Diluted Earnings Per Share

$

0.16


$

0.21


$

0.04


$

0.10


$

0.33


Adjusted EBITDA2

$

52,719


$

66,273


$

47,915


$

119,977


$

146,811


Cash and Cash Equivalents3

$

259,334


$

286,340


$

178,367


$

259,334


$

286,340


Cash Flows from Operating Activities

$

52,586


$

57,316


$

23,264


$

58,628


$

89,877


1 Net income attributable to common shareholders
2 Adjusted EBITDA is a non-GAAP financial measure. See reconciliation below
3 Excludes restricted cash of $42.1 million as of 6/30/20

Owen Kratz, President and Chief Executive Officer of Helix, stated, “Our third quarter operating results improved sequentially despite lower revenue, as we maintain strict cost control measures during this difficult time. COVID-19 continues to affect us, both in our operations and customer demand for our services, and we expect this to persist until the pandemic is resolved. Despite these challenges, our team continues to perform at high levels, safely operating our vessels and delivering services with outstanding uptime efficiency and minimal disruptions from the pandemic. During the third quarter we enhanced our financial position by reducing our costs and strengthening our balance sheet. We continue to repay maturing debt, and we proactively extended maturities on a portion of our long-term debt, creating a longer liquidity runway and establishing a debt reduction schedule more manageable in the current environment. We believe these actions will allow us to continue navigating through this difficult environment and position us for more favorable markets ahead.”

Segment Information, Operational and Financial Highlights

($ in thousands, unaudited)

 
Three Months Ended Nine Months Ended
9/30/2020 9/30/2019 6/30/2020 9/30/2020 9/30/2019
Revenues:
Well Intervention

$

140,803


$

170,206


$

145,841


$

427,296


$

451,511


Robotics


49,802


51,909


50,836


135,896


136,396


Production Facilities


14,167


13,777


13,593


43,301


44,651


Intercompany Eliminations


(11,282

)


(23,283

)


(11,123

)


(32,835

)


(51,398

)

Total

$

193,490


$

212,609


$

199,147


$

573,658


$

581,160


Income (Loss) from Operations:
Well Intervention

$

18,844


$

37,689


$

11,758


$

24,910


$

74,002


Robotics


6,982


8,876


7,781


11,940


7,921


Production Facilities


4,134


3,050


3,365


11,142


11,907


Goodwill Impairment


-


-


-


(6,689

)


-


Corporate / Other / Eliminations


(10,945

)


(10,617

)


(8,710

)


(29,121

)


(31,491

)

Total

$

19,015


$

38,998


$

14,194


$

12,182


$

62,339


Segment Results

Well Intervention

Well Intervention revenues decreased $5.0 million, or 3%, from the prior quarter primarily due to lower vessel utilization in the North Sea and lower IRS utilization in the Gulf of Mexico, offset in part by higher utilization on the Q5000. North Sea and West Africa utilization declined with both the Q7000 and the Seawell idle during the third quarter. The 15K IRS utilization declined to 16% during the third quarter compared to 78% during the prior quarter. The Q5000 results improved with a full quarter of utilization during the third quarter after incurring a gap between projects during the second quarter. Overall Well Intervention vessel utilization declined to 68% compared to 72% during the prior quarter. Well Intervention income from operations increased $7.1 million compared to the prior quarter due to higher earnings on the Q5000 and reduced costs during the third quarter.

Well Intervention revenues decreased $29.4 million, or 17%, in the third quarter 2020 compared to the third quarter 2019 due to lower utilization in the North Sea and the Gulf of Mexico and weaker foreign currency rates in Brazil. Well Intervention vessel utilization decreased to 68% in the third quarter 2020 from 97% in the third quarter 2019, with the Seawell warm stacked and lower utilization on the Q4000 during the third quarter 2020. Income from operations decreased $18.8 million, or 50%, in the third quarter 2020 compared to the third quarter 2019 primarily due to lower revenues and to stacking costs incurred on the Q7000 during the third quarter 2020.

Robotics

Robotics revenues decreased $1.0 million, or 2%, from the previous quarter primarily due to a decrease in vessel days with the completion of a marine salvage project offshore Australia during the second quarter 2020 and fewer days on the Ross Candies in the Gulf of Mexico, offset in part by an increase in trenching activity and ROV utilization during the quarter. Chartered vessel utilization remained flat at 95% compared to the previous quarter; however, vessel days decreased to 450 days during the third quarter 2020 compared to 499 days during the previous quarter. ROV, trencher and ROVDrill utilization was 37% during the third quarter 2020 compared to 34% during the previous quarter, and the third quarter included 154 days of trencher utilization compared to 119 days in the previous quarter. Robotics income from operations decreased $0.8 million from the prior quarter primarily due to lower revenues.

Robotics revenues decreased $2.1 million, or 4%, compared to the third quarter 2019 primarily due to a decrease in trenching and ROV activity, offset in part by increased vessel days due to the ongoing renewables site clearance project in the North Sea during the third quarter 2020. ROV, trencher and ROVDrill utilization decreased to 37% in the third quarter 2020, which included 154 days of trencher utilization, compared to 44% in the same quarter 2019, which included 241 days of trencher utilization. Chartered vessel utilization was slightly down at 95% in the third quarter 2020 compared to 96% during the third quarter 2019; however, the third quarter 2020 included 450 vessel days, which included 196 days from the North Sea renewables site clearance project, compared to 292 vessel days during the third quarter 2019. Income from operations in the third quarter 2020 decreased $1.9 million compared to the third quarter 2019 due to lower revenues and the types of projects performed.

Production Facilities

Production Facilities revenues increased $0.6 million in the third quarter 2020 compared to the previous quarter and $0.4 million compared to the same quarter in the prior year due to higher oil and gas production revenues.

Selling, General and Administrative and Other

Selling, General and Administrative

Selling, general and administrative expenses were $16.1 million, or 8.3% of revenue, in the third quarter 2020 compared to $15.9 million, or 8.0% of revenue, in the second quarter 2020. The increase was primarily related to an increase in employee compensation costs, offset in part by lower credit losses compared to the second quarter 2020.

Other Income and Expenses

Other income, net was $8.8 million in the third quarter 2020 compared to other expense, net of $2.1 million in the second quarter 2020. The change was primarily due to net foreign currency gains in the third quarter 2020 compared to foreign currency losses in the prior quarter.

Cash Flows

Operating cash flow was $52.6 million in the third quarter 2020 compared to $23.3 million in the second quarter 2020 and $57.3 million in the third quarter 2019. The increase in operating cash flow quarter over quarter was primarily due to higher operating income and improvements in working capital compared to the prior quarter. The decrease year over year was primarily due to lower operating income, offset in part by improvements in working capital in the third quarter 2020 compared to the same quarter 2019.

Capital expenditures totaled $1.6 million in the third quarter 2020 compared to $5.2 million in the previous quarter and $18.2 million in the third quarter 2019. Capital expenditures decreased year over year following the completion of the Q7000 during the first quarter 2020.

Free cash flow was $51.4 million in the third quarter 2020 compared to $18.6 million in the second quarter 2020 and $39.2 million in the third quarter 2019. The increase quarter over quarter was due to higher operating cash flow in the third quarter 2020 compared to the previous quarter. The increase year over year was primarily due to lower capital expenditures during the third quarter 2020 compared to the third quarter 2019. (Free cash flow is a non-GAAP measure. See reconciliation below.)

Financial Condition and Liquidity

In August 2020 we issued $200.0 million of Convertible Senior Notes due 2026 (2026 Notes). We used the net proceeds of the 2026 Notes’ issuance to fund the repurchase of $90.0 million of our Convertible Senior Notes due 2022 (2022 Notes) and $95.0 million of our Convertible Senior Notes due 2023 (2023 Notes) and to acquire capped calls, which reduce the potential dilution associated with the 2026 Notes.

Cash and cash equivalents were $259.3 million and available capacity under our revolving credit facility was $144.7 million at September 30, 2020. Consolidated long-term debt decreased to $356.9 million at September 30, 2020 from $386.9 million at June 30, 2020. The net decrease in debt was primarily due to the higher discount associated with the 2026 Notes compared to the discounts associated with the repurchased 2022 Notes and 2023 Notes. Consolidated net debt at September 30, 2020 was $97.6 million. Net debt to book capitalization at September 30, 2020 was 5%. (Net debt and net debt to book capitalization are non-GAAP measures. See reconciliation below.)

Conference Call Information

Further details are provided in the presentation for Helix’s quarterly webcast and teleconference to review its third quarter 2020 results (see the "Investor Relations" page of Helix’s website, www.HelixESG.com). The teleconference, scheduled for Thursday, October 22, 2020 at 9:00 a.m. Central Time, will be audio webcast live from the "For the Investor" page of Helix’s website. Investors and other interested parties wishing to participate in the teleconference may join by dialing 1-800-771-7943 for participants in the United States and 1-212-231-2907 for international participants. The passcode is "Staffeldt." A replay of the webcast will be available on our website under "For the Investor" by selecting the "Audio Archives" link beginning approximately two hours after the completion of the event.

About Helix

Helix Energy Solutions Group, Inc., headquartered in Houston, Texas, is an international offshore energy services company that provides specialty services to the offshore energy industry, with a focus on well intervention and robotics operations. For more information about Helix, please visit our website at www.HelixESG.com.

Non-GAAP Financial Measures

Management evaluates performance and financial condition using certain non-GAAP measures, primarily EBITDA, Adjusted EBITDA, net debt, net debt to book capitalization and free cash flow. We define EBITDA as earnings before income taxes, net interest expense, gain or loss on extinguishment of long-term debt, net other income or expense, and depreciation and amortization expense. Non-cash impairment losses on goodwill and other long-lived assets and gains and losses on equity investments are also added back if applicable. To arrive at our measure of Adjusted EBITDA, we exclude the gain or loss on disposition of assets and the general provision for current expected credit losses, if any. In addition, we include realized losses from foreign currency exchange contracts not designated as hedging instruments and other than temporary loss on note receivable, which are excluded from EBITDA as a component of net other income or expense. Net debt is calculated as total long-term debt less cash and cash equivalents and restricted cash. Net debt to book capitalization is calculated by dividing net debt by the sum of net debt and shareholders’ equity. We define free cash flow as cash flows from operating activities less capital expenditures, net of proceeds from sale of assets.

We use EBITDA and free cash flow to monitor and facilitate internal evaluation of the performance of our business operations, to facilitate external comparison of our business results to those of others in our industry, to analyze and evaluate financial and strategic planning decisions regarding future investments and acquisitions, to plan and evaluate operating budgets, and in certain cases, to report our results to the holders of our debt as required by our debt covenants. We believe that our measures of EBITDA and free cash flow provide useful information to the public regarding our operating performance and ability to service debt and fund capital expenditures and may help our investors understand and compare our results to other companies that have different financing, capital and tax structures. Other companies may calculate their measures of EBITDA, Adjusted EBITDA and free cash flow differently from the way we do, which may limit their usefulness as comparative measures. EBITDA, Adjusted EBITDA and free cash flow should not be considered in isolation or as a substitute for, but instead are supplemental to, income from operations, net income, cash flows from operating activities, or other income or cash flow data prepared in accordance with GAAP. Users of this financial information should consider the types of events and transactions that are excluded from these measures. See reconciliation of the non-GAAP financial information presented in this press release to the most directly comparable financial information presented in accordance with GAAP.

Forward-Looking Statements

This press release contains forward-looking statements that involve risks, uncertainties and assumptions that could cause our results to differ materially from those expressed or implied by such forward-looking statements. All statements, other than statements of historical fact, are “forward-looking statements” within the meaning of the Private Securities Litigation Reform Act of 1995, including, without limitation, any statements regarding the ongoing COVID-19 pandemic and recent oil price volatility and their respective effects and results, our protocols and plans, our current work continuing, the spot market, our spending and cost reduction plans and our ability to manage changes; our strategy; any statements regarding visibility and future utilization; any projections of financial items; any statements regarding future operations expenditures; any statements regarding the plans, strategies and objectives of management for future operations; any statements regarding our ability to enter into, renew and/or perform commercial contracts; any statements concerning developments; any statements regarding future economic conditions or performance; any statements of expectation or belief; and any statements of assumptions underlying any of the foregoing. Forward-looking statements are subject to a number of known and unknown risks, uncertainties and other factors that could cause results to differ materially from those in the forward-looking statements, including but not limited to the results and effects of the COVID-19 pandemic and actions by governments, customers, suppliers and partners with respect thereto; market conditions; results from acquired properties; demand for our services; the performance of contracts by suppliers, customers and partners; actions by governmental and regulatory authorities; operating hazards and delays, which include delays in delivery, chartering or customer acceptance of assets or terms of their acceptance; our ultimate ability to realize current backlog; employee management issues; complexities of global political and economic developments; geologic risks; volatility of oil and gas prices and other risks described from time to time in our reports filed with the Securities and Exchange Commission (“SEC”), including our most recently filed Annual Report on Form 10-K and in our other filings with the SEC, which are available free of charge on the SEC’s website at www.sec.gov. We assume no obligation and do not intend to update these forward-looking statements, which speak only as of their respective dates, except as required by the securities laws.

Social Media

From time to time we provide information about Helix on Twitter (@Helix_ESG), LinkedIn (www.linkedin.com/company/helix-energy-solutions-group), Facebook (www.facebook.com/HelixEnergySolutionsGroup) and Instagram (www.instagram.com/helixenergysolutions).

HELIX ENERGY SOLUTIONS GROUP, INC.
 
Comparative Condensed Consolidated Statements of Operations
 

Three Months Ended Sep. 30,

Nine Months Ended Sep. 30,

(in thousands, except per share data)

2020

2019

2020

2019

(unaudited) (unaudited)
 
Net revenues

$

193,490


$

212,609


$

573,658


$

581,160


Cost of sales


158,862


157,535


507,444


469,898


Gross profit


34,628


55,074


66,214


111,262


Goodwill impairment


-


-


(6,689

)


-


Gain on disposition of assets, net


440


-


913


-


Selling, general and administrative expenses


(16,053

)


(16,076

)


(48,256

)


(48,923

)

Income from operations


19,015


38,998


12,182


62,339


Equity in losses of investment


(11

)


(13

)


(33

)


(82

)

Net interest expense


(7,598

)


(1,901

)


(20,407

)


(6,204

)

Gain (loss) on extinguishment of long-term debt


9,239


-


9,239


(18

)

Other income (expense), net


8,824


(2,285

)


(3,672

)


(2,430

)

Royalty income and other


208


362


2,526


2,897


Income (loss) before income taxes


29,677


35,161


(165

)


56,502


Income tax provision (benefit)


5,232


3,539


(16,132

)


6,739


Net income


24,445


31,622


15,967


49,763


Net loss attributable to redeemable noncontrolling interests


(54

)


(73

)


(2,044

)


(104

)

Net income attributable to common shareholders

$

24,499


$

31,695


$

18,011


$

49,867


Earnings per share of common stock:
Basic

$

0.16


$

0.21


$

0.10


$

0.33


Diluted

$

0.16


$

0.21


$

0.10


$

0.33


Weighted average common shares outstanding:
Basic


149,032


147,575


148,956


147,506


Diluted


149,951


148,354


149,824


148,086


Comparative Condensed Consolidated Balance Sheets
 
Sep. 30, 2020 Dec. 31, 2019
(in thousands) (unaudited)
 
ASSETS
 
Current Assets:
Cash and cash equivalents (1)

$

259,334


$

208,431


Restricted cash (1)


-


54,130


Accounts receivable, net


157,834


125,457


Other current assets


104,117


50,450


Total Current Assets


521,285


438,468


Property and equipment, net


1,776,010


1,872,637


Operating lease right-of-use assets


162,052


201,118


Other assets, net


46,127


84,508


Total Assets

$

2,505,474


$

2,596,731


LIABILITIES AND SHAREHOLDERS' EQUITY
 
Current Liabilities:
Accounts payable

$

66,320


$

69,055


Accrued liabilities


84,657


62,389


Current maturities of long-term debt (1)


73,401


99,731


Current operating lease liabilities


52,160


53,785


Total Current Liabilities


276,538


284,960


Long-term debt (1)


283,545


306,122


Operating lease liabilities


112,957


151,827


Deferred tax liabilities


118,411


112,132


Other non-current liabilities


4,958


38,644


Redeemable noncontrolling interests


3,579


3,455


Shareholders' equity (1)


1,705,486


1,699,591


Total Liabilities and Equity

$

2,505,474


$

2,596,731


(1)

Net debt to book capitalization - 5% at September 30, 2020. Calculated as net debt (total long-term debt less cash and cash equivalents and restricted cash - $97,612) divided by the sum of net debt and shareholders' equity ($1,803,098).
Helix Energy Solutions Group, Inc.
Reconciliation of Non-GAAP Measures
 
 
Three Months Ended Nine Months Ended
(in thousands, unaudited) 9/30/2020 9/30/2019 6/30/2020 9/30/2020 9/30/2019
 
Reconciliation from Net Income to Adjusted EBITDA:
Net income

$

24,445


$

31,622


$

5,450


$

15,967


$

49,763


Adjustments:
Income tax provision (benefit)


5,232


3,539


(271

)


(16,132

)


6,739


Net interest expense


7,598


1,901


7,063


20,407


6,204


(Gain) loss on extinguishment of long-term debt


(9,239

)


-


-


(9,239

)


18


Other (income) expense, net


(8,824

)


2,285


2,069


3,672


2,430


Depreciation and amortization


33,985


27,908


33,969


99,552


84,420


Goodwill impairment


-


-


-


6,689


-


EBITDA


53,197


67,255


48,280


120,916


149,574


Adjustments:
Gain on disposition of assets, net


(440

)


-


(473

)


(913

)


-


General provision (release) for current expected credit losses


(38

)


-


108


656


-


Realized losses from foreign exchange contracts not designated as hedging instruments


-


(982

)


-


(682

)


(2,763

)

Adjusted EBITDA

$

52,719


$

66,273


$

47,915


$

119,977


$

146,811


Free Cash Flow:
Cash flows from operating activities

$

52,586


$

57,316


$

23,264


$

58,628


$

89,877


Less: Capital expenditures, net of proceeds from sale of assets


(1,174

)


(18,153

)


(4,692

)


(18,255

)


(43,086

)

Free cash flow

$

51,412


$

39,163


$

18,572


$

40,373


$

46,791


Contacts

Erik Staffeldt
Executive Vice President & CFO
This email address is being protected from spambots. You need JavaScript enabled to view it.
281-618-0465

Atmos Energy, BGE, Southwest Gas and TECO Peoples Gas Rank Highest in Respective Regions


COSTA MESA, Calif.--(BUSINESS WIRE)--Due to the COVID-19 pandemic, it is no surprise that businesses are struggling. One small bright spot exists, however, as satisfaction with gas utilities increases from 2019, according to the J.D. Power 2020 Gas Utility Business Customer Satisfaction Study,SM released today. While 14% of businesses say they are worse off compared with a year ago, 67% of respondents said they are aware their gas utility offers various forms of support, which has led to a new level of overall satisfaction across the nation.

It is very encouraging to see natural gas providers continue to improve the customer experience, especially with the challenges this year has brought,” said Carl Lepper, director of the utility practice at J.D. Power. “Commercial consumption of natural gas is lower than last year and, given the current work climate, we don’t yet know if this is a new normal. We will only know once traditional payment policies are reinstated and businesses start functioning at their pre-virus capacities.”

Study Rankings

The industry results for the 2020 study are reported across four U.S. geographic regions: East, Midwest, South and West. The following utilities rank highest in customer satisfaction in their respective region:

  • East: BGE (for third consecutive year)
  • Midwest: Atmos Energy
  • South: TECO Peoples Gas (for second consecutive year)
  • West: Southwest Gas

Now in its 16th year, the Gas Utility Business Customer Satisfaction Study measures business customer satisfaction with gas utility companies in four regions: East, Midwest, South and West. Each of the 60 brands included in the study serve more than 25,000 business customers, representing more than 4.4 million business customers in total. Overall satisfaction is measured by examining six factors (listed in order of importance): safety and reliability (25%); billing and payment (17%); corporate citizenship (15%); customer service (15%); price (15%); and communications (13%).

The study is based on responses from more than 9,600 online interviews with business customers who spend at least $150 monthly on natural gas. The study was fielded in two waves: January through April and May through September 2020.

For more information about the Gas Utility Business Customer Satisfaction Study, visit https://www.jdpower.com/business/utilities/gas-utility-business-customer-satisfaction-study

See the online press release at http://www.jdpower.com/pr-id/2020135.

J.D. Power is a global leader in consumer insights, advisory services and data and analytics. A pioneer in the use of big data, artificial intelligence (AI) and algorithmic modeling capabilities to understand consumer behavior, J.D. Power has been delivering incisive industry intelligence on customer interactions with brands and products for more than 50 years. The world's leading businesses across major industries rely on J.D. Power to guide their customer-facing strategies.

J.D. Power is headquartered in Troy, Mich., and has offices in North America, Europe and Asia Pacific. To learn more about the company’s business offerings, visit JDPower.com/business. The J.D. Power auto shopping tool can be found at JDPower.com.

About J.D. Power and Advertising/Promotional Rules: www.jdpower.com/business/about-us/press-release-info


Contacts

Media Relations Contacts
Geno Effler, J.D. Power; West Coast; 714-621-6224; This email address is being protected from spambots. You need JavaScript enabled to view it.
John Roderick; East Coast; 631-584-2200; This email address is being protected from spambots. You need JavaScript enabled to view it.

Strong Winds Expected to Begin This Evening Through Friday Morning

SAN FRANCISCO--(BUSINESS WIRE)--Pacific Gas and Electric Company (PG&E) will de-energize certain electrical lines for safety over the course of this evening (Wednesday, Oct. 21) as part of a Public Safety Power Shutoff (PSPS). PG&E is calling a PSPS due to a high-wind event combined with low humidity and severely dry vegetation, that together create high risk of catastrophic wildfires.

Due changes in the weather forecast, the number of customers expected to be impacted has decreased by 31 percent. The PSPS event will affect approximately 37,000 customers in targeted portions of 15 counties.

  • Counties removed from scope include: Lassen, Solano, Stanislaus and Yuba counties.
  • Counties remaining in scope include: Alameda, Butte, Colusa, Contra Costa, Glenn, Humboldt, Lake, Napa, Plumas, Santa Clara, Shasta, Sonoma, Tehama, Trinity, and Yolo Counties.

Customers Notified of Decision to Shut Off Power Wednesday afternoon

Customer notifications began 48 hours in advance of the shutoff and PG&E continues to update affected customers. Customers were notified this afternoon that the PSPS event would occur and customers who were removed from the scope were notified of cancellation. Lines will be de-energized starting at approximately 8 p.m. tonight and the de-energization process will continue throughout the evening, depending upon location, across the Sacramento Valley, Northern Sierra, and elevated terrain of the North and East Bay. All of these areas are covered by National Weather Service Red Flag Warnings, indicating critical fire weather conditions.

To support our customers during this PSPS, PG&E will open 21 Community Resource Centers (CRCs). For customers with power turning off this evening, CRCs will be open from 7 p.m. today (Wednesday, Oct. 21) until 10 p.m. All CRCs will operate from 8 a.m. to 10 p.m. through the event. These temporary CRCs will be open to customers when power is out at their homes and will provide ADA-accessible restrooms, hand-washing stations, medical-equipment charging, WiFi; bottled water, grab-and-go bags and non-perishable snacks.

Timeline for safety shutoffs

The de-energization will begin around 8 p.m. Shutoffs will continue throughout the evening, ultimately affecting a total of about 37,000 customers in portions of Alameda, Butte, Colusa, Contra Costa, Glenn, Humboldt, Lake, Napa, Plumas, Santa Clara, Shasta, Sonoma, Tehama, Trinity, and Yolo Counties.

Customer notifications—via text, email and automated phone call—began Monday afternoon (Oct. 19), approximately two days prior to the potential shutoff. Additional notifications one day prior to the event took place Tuesday, Oct. 20. Customers enrolled in the company’s Medical Baseline program who do not verify that they have received these important safety communications will be individually visited by a PG&E employee with a knock on their door when possible with a focus on customers who rely on electricity for critical life-sustaining equipment.

Once the weather subsides on Friday morning and it’s safe to do so, PG&E will patrol the de-energized lines to determine if they were damaged during the wind event and repair any damage found. PG&E will then safely restore power in stages and as quickly as possible, with the goal of restoring power to nearly all customers within 12 daylight hours after severe weather has passed.

Affected Counties and Customers

  • Alameda County: 336 customers, 16 Medical Baseline customers
  • Butte County: 10,259 customers, 922 Medical Baseline customers
  • Colusa County: 4 customers, 0 Medical Baseline customers
  • Contra Costa County: 201 customers, 10 Medical Baseline customers
  • Glenn County: 162 customers, 7 Medical Baseline customers
  • Humboldt County: 288 customers, 5 Medical Baseline customers
  • Lake County: 127 customers, 6 Medical Baseline customers
  • Napa County: 3,296 customers, 120 Medical Baseline customers
  • Plumas County: 434 customers, 8 Medical Baseline customers
  • Santa Clara County: 236 customers, 9 Medical Baseline customers
  • Shasta County: 18,480 customers, 1,464 Medical Baseline customers
  • Sonoma County: 135 customers, 5 Medical Baseline customers
  • Tehama County: 2,511 customers, 189 Medical Baseline customers
  • Trinity County: 395 customers, 21 Medical Baseline customers
  • Yolo County: 10 customers, 0 Medical Baseline customers
  • Total*: 36,874 customers, 2,782 Medical Baseline customers

*The following Tribal Communities located within these counties will be impacted by this event:

  • Grindstone Rancheria Tribal community
  • Pit River Tribal community – Montgomery Creek Rancheria, Roaring Creek Rancheria

Customers can look up their address online to find out if their location is being monitored for the potential safety shutoff at www.pge.com/pspsupdates.

Community Resource Centers Reflect COVID-Safety Protocols

While a PSPS is an important safety tool to reduce wildfire risk during severe fire risk weather, PG&E understands that losing power disrupts lives.

PG&E’s temporary CRCs will provide ADA-accessible restrooms, hand-washing stations; medical-equipment charging; WiFi; bottled water; grab-and-go bags and non-perishable snacks. The 21 CRCs, located throughout PG&E’s service area in locations affected by the PSPS, will remain open throughout the event.

In response to the COVID-19 pandemic, all CRCs will follow important health and safety protocols including:

  • Facial coverings and maintaining a physical distance of at least six feet from those who are not part of the same household will be required at all CRCs.
  • Temperature checks will be administered before entering CRCs that are located indoors.
  • CRC staff will be trained in COVID-19 precautions and will regularly sanitize surfaces and use Plexiglass barriers at check-in.
  • All CRCs will follow county and state requirements regarding COVID-19, including limits on the number of customers permitted indoors at any time.

Besides these health protocols, customers visiting a CRC in 2020 will experience further changes, including a different look and feel. In addition to using existing indoor facilities, PG&E is planning to open CRCs at outdoor, open-air sites in some locations and use large commercial vans as CRCs in other locations. CRC locations will depend on a number of factors, including input from local and tribal leaders. Outdoor CRCs will provide grab-and-go supply bags so most customers can be on their way quickly.

PG&E updates its CRC locations regularly. Click here for updates.

Here’s Where to Go to Learn More

  • PG&E’s emergency website pge.com/pspsupdates is now available in 13 languages. Currently, the website is available in English, Spanish, Chinese, Tagalog, Russian, Vietnamese, Korean, Farsi, Arabic, Hmong, Khmer, Punjabi and Japanese. Customers will have the opportunity to choose their language of preference for viewing the information when visiting the website.
  • For additional language support services including how to set language preference, select options for obtaining translated notifications, and receive other translated resources on PSPS, customers can visit pge.com/pspslanguagehelp. This website is available in 11 languages including English, Spanish, Chinese, Tagalog, Russian, Vietnamese, Korean, Hmong, Khmer, Punjabi and Japanese. Customers who need in-language support over the phone can contact us by calling 1-833-208-4167.
  • Customers are encouraged to update their contact information and indicate their preferred language for notifications by visiting pge.com/mywildfirealerts or by calling 1-800-743-5000.
  • Tenants and non-account holders can sign up to receive PSPS ZIP Code Alerts for any area where you do not have a PG&E account by visiting pge.com/pspszipcodealerts.
  • PG&E has launched a new tool at its online Safety Action Center safetyactioncenter.pge.com to help customers prepare. By using the "Make Your Own Emergency Plan" tool and answering a few short questions, visitors to the website can compile and organize the important information needed for a personalized family emergency plan.

About PG&E

Pacific Gas and Electric Company, a subsidiary of PG&E Corporation (NYSE:PCG), is one of the largest combined natural gas and electric energy companies in the United States. Based in San Francisco, with more than 23,000 employees, the company delivers some of the nation's cleanest energy to 16 million people in Northern and Central California. For more information, visit pge.com and pge.com/news.


Contacts

MEDIA RELATIONS:
415-973-5930

- GPS Signal Protection Vital to Ensure Safe Commercial and Defense BVLOS operations -

BROOKLYN, N.Y. & CAESAREA, Israel--(BUSINESS WIRE)--#GPS--Easy Aerial, a leading provider of autonomous drone-based monitoring solutions for commercial, government, and defense applications, today announced it has integrated the infiniDome GPSdome solution for GNSS/GPS signal protection into its line of military-grade autonomous unmanned aerial systems.


GPSdome integrates into Easy Aerial’s Smart Aerial Monitoring System (SAMS) GNSS receivers and employs a unique interference filtering system that combines patterns from two omnidirectional antennas. In real-time, GPSdome analyzes the interference signal and feeds its properties into infiniDome’s proprietary algorithm to filter and reject any attacking RF interference allowing the UAS to continue GPS signal reliance during a jamming attack. Upon detection of a jamming signal, GPSdome notifies operators of a possible signal jamming interference.

Easy Aerial selected GPSdome for its lightweight, small form factor, low power consumption, and field-proven ability to detect, alert, and shield jamming signals. As the only dual-use GPS anti-jamming solution on the market, infiniDome’s technology is perfectly suited for Easy Aerial’s global security and defense customers ensuring safe Beyond Visual Line of Sight (BVLOS) and other critical operations in GPS denied environments.

“We chose GPSdome because it’s a proven solution that perfectly suits the diverse missions our customers routinely fly in some of the world’s most inhospitable and hostile environments,” said Ido Gur, co-founder & CEO of Easy Aerial. “While our systems are equipped with multiple onboard redundancies, GPS signals are vital to maintaining position, navigation, and timing accuracy, ensuring uninterrupted operation.”

“GPSdome delivers anti-jamming technology, unmatched in size, weight, power, and cost advantages,” said Omer Sharar, infiniDome’s CEO. “GPSdome is the industry’s only dual-use, both commercial and military, GPS anti-jamming protection. GPSdome not only detects the attack but also shields the received signals from being overpowered by jammers. These assaults can have drastic effects, including losses in property, services, as well as the potential risk to lives.”

About Easy Aerial

Easy Aerial is a leading provider of autonomous drone-based monitoring solutions for commercial, government, and military applications. Developed and manufactured in the United States, Easy Aerial’s free-flight and tethered drone-in-a-box systems are fully autonomous, modular, portable, rugged, and all weather capable. They are deployed worldwide for mission-critical applications such as perimeter and border security, event monitoring, emergency response, and industrial inspection. Easy Aerial is headquartered in Brooklyn, New York, with regional offices in Tel-Aviv, Israel, and Belgrade, Serbia. Visit: www.easyaerial.com.

About infiniDome, Ltd.

infiniDome provides front-end cyber solutions protecting wireless communications from jamming and spoofing attacks. infiniDome’s products protect against attacks of GPS-based systems which are critical for autonomous vehicles, drones, connected fleets, critical infrastructure, and defense/security. infiniDome’s products have been successfully proven in the field and sold to customers globally. Contact or Visit: www.infinidome.com.


Contacts

Easy Aerial
Robert van Gool
415-505-2686
This email address is being protected from spambots. You need JavaScript enabled to view it.

Kristi Furrer
infiniDome, Ltd.
303-525-0924
This email address is being protected from spambots. You need JavaScript enabled to view it.

  • Strategic transaction furthers AVANGRID’s growth in both clean energy distribution and transmission - expands leadership position in renewables
  • All Cash Offer for PNM Resources shares at $50.30 per share – $8.3 billion enterprise value transaction
  • Creates one of biggest clean energy companies in the US with ten regulated utilities in six states and third largest renewables company with operations in 24 states
  • Majority shareholder IBERDROLA supports the transaction and has provided a funding commitment letter

ORANGE, Conn.--(BUSINESS WIRE)--$AGR--AVANGRID (NYSE: AGR), a leading sustainable energy company, and PNM Resources (NYSE: PNM) announced today that their respective boards have approved the merger of PNM Resources into AVANGRID.


Ignacio Galán, chairman of AVANGRID and chairman of IBERDROLA Group, said: "This transaction is a consequence of the IBERDROLA Group’s disciplined strategy followed over more than 20 years. This is a friendly transaction, focused on regulated businesses and renewables in highly rated states with legal and regulatory stability and predictability offering future growth opportunities."

Dennis V. Arriola, AVANGRID’s CEO who will continue as CEO of the combined Company said: “This merger between AVANGRID and PNM Resources is a strategic fit and helps us further our growth in both clean energy distribution and transmission, as well as helping to expand our growing leadership position in renewables. Our two companies also share the same values as we both are passionate about our customers, employees and the communities we serve. In addition, both AVANGRID and PNM Resources are leaders in environmental, social and governance issues that impact our stakeholders.”

Pat Vincent-Collawn, chairman, president and CEO of PNM Resources stated: “We are excited to be part of this transaction that provides so many benefits to our customers, communities, employees and shareholders. Our combined companies provide greater opportunities to invest in the infrastructure and new technologies that will help us navigate our transition to clean energy while maintaining our commitments to our local teams and communities.”

AVANGRID will add two independent board members from PNM Resources to its board of directors and one independent board member from PNM Resources will join the AVANGRID Networks board.

Key Highlights:

  • The transaction is expected to be EPS accretive in the first full year after closing.
  • As a result of PNM’s earnings from regulated distribution and transmission assets, it is expected that AVANGRID’s regulated earnings contribution post-transaction will exceed 80%. This proportion of regulated earnings will support AVANGRID’s fast growing renewables business over the next decade.
  • The purchase price represents a premium of 10% over the PNM's share price as of Tuesday 20th October and 19.3% over the average PNM share price during the 30 days prior to 21st October.
  • AVANGRID’s majority shareholder, Iberdrola, has provided the company with a funding commitment letter for the entire equity proceeds for the transaction.
  • As a result of this transaction, PNM’s shareholders will receive approximately $4.318 billion in cash.

The agreement between AVANGRID and PNM Resources is subject to approval by PNM Resources shareholders. In addition, the transaction will require approval from a number of state and federal regulators including the New Mexico Public Regulation Commission, Public Utility Commission of Texas, Federal Energy Regulatory Commission, Hart Scott Rodino Clearance, Committee on Foreign Investment in the United States, Federal Communications Commission and the Nuclear Regulatory Commission. Regulatory approvals are expected to be completed in approximately 12 months.

AVANGRID currently owns 1,900 MW of renewable energy and a pipeline of 1,400 MW of renewables assets in New Mexico and Texas. In addition, Iberdrola operates a retail business in Texas. For more than 15 years, Iberdrola has also funded the King Felipe VI Chair in the Department of Electrical and Computer Engineering at the University of New Mexico.

# # #

About AVANGRID: AVANGRID, Inc. (NYSE: AGR) is a leading, sustainable energy company with approximately $35 billion in assets and operations in 24 U.S. states. With headquarters in Orange, Connecticut, AVANGRID has two primary lines of business: Avangrid Networks and Avangrid Renewables. Avangrid Networks owns eight electric and natural gas utilities, serving more than 3.3 million customers in New York and New England. Avangrid Renewables owns and operates a portfolio of renewable energy generation facilities across the United States. AVANGRID employs approximately 6,600 people. AVANGRID supports the U.N.’s Sustainable Development Goals and was named among the World’s Most Ethical Companies in 2019 and 2020 by the Ethisphere Institute. For more information, visit www.avangrid.com.

About PNM Resources: PNM Resources (NYSE: PNM) is an energy holding company based in Albuquerque, NM, with 2019 consolidated operating revenues of $1.5 billion. Through its regulated utilities, PNM and TNMP, PNM Resources has approximately 2,811 megawatts of generation capacity and provides electricity to approximately 790,000 homes and businesses in New Mexico and Texas. For more information, visit the company's website at www.PNMResources.com.

Forward-Looking Statements

Certain statements made in this press release for Avangrid that relate to future events or expectations, developments, projections, estimates, intentions, goals, targets, and strategies are made pursuant to the Private Securities Litigation Reform Act of 1995. All statements contained in this Current Report on Form 8-K that do not relate to matters of historical fact should be considered forward-looking statements, and are generally identified by words such as “may,” “will,” “would,” “can,” “expect(s),” “intend(s),” “anticipate(s),” “estimate(s),” “believe(s),” “future,” “could,” “should,” “plan(s),” “aim(s),” “assume(s)”, “project(s)”, “target(s)”), “forecast(s)”, “seek(s)” and or the negative of such terms or other variations on such terms, comparable terminology or similar expressions. These forward-looking statements generally include statements regarding the potential transaction between Avangrid and PNMR, including any statements regarding the expected timetable for completing the potential Merger, the ability to complete the potential Merger, the expected benefits of the potential Merger, projected financial information, future opportunities, and any other statements regarding Avangrid’s and PNMR’s future expectations, beliefs, plans, objectives, results of operations, financial condition and cash flows, or future events or performance. Readers are cautioned that all forward-looking statements are based upon current reasonable beliefs, expectations and assumptions. Neither Avangrid nor PNMR assumes any obligation to update this information. Because actual results may differ materially from those expressed or implied by these forward-looking statements, Avangrid and PNMR caution readers not to place undue reliance on these statements. Avangrid’s and PNMR’s business, financial condition, cash flow, and operating results are influenced by many factors, which are often beyond its control, that can cause actual results to differ from those expressed or implied by the forward-looking statements. For a discussion of risk factors and other important factors affecting forward-looking statements, please see Avangrid’s Form 10-K and Form 10-Q filings and the information filed on Avangrid’s Forms 8-K with the Securities and Exchange Commission (the “SEC”) as well as its subsequent SEC filings, and the risks and uncertainties related to the proposed Merger with PNMR, including, but not limited to: the expected timing and likelihood of completion of the pending Merger, including the timing, receipt and terms and conditions of any required governmental and regulatory approvals of the pending Merger that could reduce anticipated benefits or cause the parties to abandon the transaction, the failure by Avangrid to obtain the necessary financing arrangement set forth in commitment letter received in connection with the Merger, the occurrence of any event, change or other circumstances that could give rise to the termination of the Merger Agreement, the possibility that PNMR’s shareholders may not approve the Merger Agreement, the risk that the parties may not be able to satisfy the conditions to the proposed Merger in a timely manner or at all, risks related to disruption of management time from ongoing business operations due to the proposed Merger, and the risk that the proposed transaction and its announcement could have an adverse effect on the ability of PNMR to retain and hire key personnel and maintain relationships with its customers and suppliers, and on its operating results and businesses generally. Other unpredictable or unknown factors not discussed in this communication could also have material adverse effects on forward-looking statements. Readers are cautioned not to place undue reliance on these forward-looking statements that speak only as of the date hereof.

Additional Information

The proposed business combination transaction between PNMR and Avangrid will be submitted to the shareholders of PNMR for their consideration. PNMR will file a proxy statement and other documents with the SEC regarding the proposed business combination transaction. INVESTORS AND SECURITY HOLDERS ARE URGED TO READ THE PROXY STATEMENT AND ANY OTHER RELEVANT DOCUMENTS THAT WILL BE FILED WITH THE SEC CAREFULLY AND IN THEIR ENTIRETY WHEN THEY BECOME AVAILABLE BECAUSE THEY WILL CONTAIN IMPORTANT INFORMATION ABOUT THE PROPOSED TRANSACTION. You may obtain copies of all documents filed with the SEC regarding this transaction, free of charge, at the SEC’s website (www.sec.gov).

Avangrid, Inc., PNM and certain of their respective directors, executive officers and other members of management and employees may be deemed to be participants in the solicitation of proxies from PNM’s shareholders in connection with the transactions presented in this presentation. Information regarding the persons who may, under the rules of the SEC, be deemed participants in the solicitation of PNM’s shareholders in connection with the transactions presented in this presentation will be set forth in the Proxy Statement when it is filed with the SEC. Additional information about Avangrid Inc.’s executive officers and directors and PNM’s executive officers and directors can be found in the Proxy Statement when it becomes available.

This press release is not, and shall not be deemed to be, an offer to sell or a solicitation of an offer to buy any interest or securities of any person, or an offer to enter into any transaction. Accordingly, neither Avangrid nor any other member of the Avangrid group will be under any legal or other obligation of any kind whatsoever to negotiate or consummate any transaction, and neither the recipient hereof nor any of its affiliates or other persons shall have any claim whatsoever against the Avangrid group (or any of its directors, officers, owners or affiliates) arising out of or relating to the information contained herein.


Contacts

Media:

  • Zsoka McDonald for AVANGRID
    203-997-6892 or This email address is being protected from spambots. You need JavaScript enabled to view it.
  • Paul Ferguson for IBERDROLA
    This email address is being protected from spambots. You need JavaScript enabled to view it.
  • Ray Sandoval for PNM Resources
    (505)-241-2782

Investors:

  • Patricia Cosgel for AVANGRID
    203-499-2624 or This email address is being protected from spambots. You need JavaScript enabled to view it.
  • Diego Morón for IBERDROLA
    This email address is being protected from spambots. You need JavaScript enabled to view it.
  • Lisa Goodman for PNM Resources
    (505) 241-2160

HOUSTON--(BUSINESS WIRE)--Orion Group Holdings, Inc. (NYSE: ORN) (the “Company”), a leading specialty construction company, today announced that it will issue its financial results for the third quarter ended September 30, 2020 on Wednesday, October 28, 2020, after the close of the stock market.


Management will conduct a conference call on Thursday, October 29, 2020 at 10:00 a.m. ET to review these results. To listen to the call live, dial 201-493-6739 and ask for the Orion Group Holdings Conference Call. To listen to the call via the Internet, please visit www.oriongroupholdingsinc.com and click on the Investor Relations Section. Please go to the website 15 minutes early to download and install any necessary audio software. If you are unable to listen live, a replay of the conference call may be accessed for approximately 30 days after the call at Orion Group Holdings’ website.

About Orion Group Holdings

Orion Group Holdings, Inc., a leading specialty construction company serving the infrastructure, industrial and building sectors, provides services both on and off the water in the continental United States, Alaska, Canada and the Caribbean Basin through its marine segment and its concrete segment. The Company’s marine segment provides construction and dredging services relating to marine transportation facility construction, marine pipeline construction, marine environmental structures, dredging of waterways, channels and ports, environmental dredging, design, and specialty services. Its concrete segment provides turnkey concrete construction services including pour and finish, dirt work, layout, forming, rebar, and mesh across the light commercial, structural and other associated business areas. The Company is headquartered in Houston, Texas with regional offices throughout its operating areas.


Contacts

Orion Group Holdings Inc.
Francis Okoniewski, VP Investor Relations
(346) 616-4138
www.oriongroupholdingsinc.com
-OR-
INVESTOR RELATIONS COUNSEL:
The Equity Group Inc.
Fred Buonocore, CFA (212) 836-9607
Mike Gaudreau (212) 836-9620

Offshore Source Logo

Offshore Source keeps you updated with relevant information concerning the Offshore Energy Sector.

Any views or opinions represented on this website belong solely to the author and do not represent those of the people, institutions or organizations that Offshore Source or collaborators may or may not have been associated with in a professional or personal capacity, unless explicitly stated.

Corporate Offices

Technology Systems Corporation
8502 SW Kansas Ave
Stuart, FL 34997

info@tscpublishing.com