Business Wire News

Renewable energy pioneer joins tech leader’s inaugural climate change accelerator

FRANKLIN, Tenn.--(BUSINESS WIRE)--Enexor BioEnergy, LLC, has been selected as one of 11 companies in North America to participate in the inaugural Google for Startups Accelerator: Climate Change. This program recognizes Enexor as a top company providing innovative and impactful climate change solutions.


Launching in June, this three-month program grants access to Google’s best programs, products, people and technology to startups developing early-stage solutions to mitigate the environmental impact of climate change. Through this partnership, Enexor will rapidly accelerate the commercialization of its carbon conversion and renewable energy solution to help increase efficiency and reduce the carbon footprints of companies worldwide.

“I am eager to welcome Enexor into the first Google for Startups Accelerator: Climate Change cohort and support the company’s ambitious mission: solving the world’s organic, biomass and plastic waste overabundance problem,” said Jason Scott, head of Startup Developer Ecosystems at Google. “The team highlights Tennessee’s growing entrepreneurial ecosystem, and we couldn’t be happier to advance their solution with Google’s mentorship and machine learning expertise.”

Enexor’s patented Bio-CHP system converts almost any organic, plastic or biomass waste into reliable, renewable power and thermal energy while concurrently reducing carbon emissions and ultimately mitigating climate change. Modular and easily transportable, the plug-and-play design of this powerful system allows for quick deployment and on-site mobilization in most places around the world.

“This is a major boost for our technology and a great honor to be selected by Google for the launch of its accelerator program,” said Enexor’s founder and CEO, Lee Jestings. “We believe Google’s deep technical, engineering and novel machine learning expertise will dramatically accelerate commercialization of our renewable energy and carbon reduction technology and help us deploy our systems to the neediest places in the world.”

This is the second major alliance announcement in recent days for Enexor, following its selection as one of three companies to join Halliburton Labs’ inaugural clean technology accelerator program in February. Later that month, Enexor was selected by the United Nations as one of the winners of its prestigious World Tourism Organization (UNWTO) Sustainable Development Goals Global Startup Competition, the only U.S. winner in the Affordable and Clean Energy category. Along with today’s announcement, Enexor has established itself as a leader in renewable energy systems and climate change solutions.


Contacts

Media contact: Javier Solano, This email address is being protected from spambots. You need JavaScript enabled to view it., (615) 330-2817

HOUSTON--(BUSINESS WIRE)--DXP Enterprises, Inc. (NASDAQ: DXPE) today announced that the Board of Directors of DXP Enterprises, Inc. elected Mr. Kent Yee, Chief Financial Officer, as a director on the Board, effective immediately.


“We are delighted to have Kent formally join the Board. Kent for the past ten years has regularly participated in DXP Board meetings and displayed strong business acumen and leadership skills. Since becoming CFO, he has contributed in an even stronger manner and has emerged as a valued Board participant. He has distinguished himself as a leader with in-depth financial, strategic, capital markets and human capital expertise. This is a public acknowledgement of what we have known and benefited from at DXP since he arrived. Kent not only brings valuable business skills but also brings other diverse and valued perspectives,” said David Little, Chairman of the Board of Directors.

This appointment reflects Mr. Yee’s tenure with DXP and the important role he serves on the senior management team.

Mr. Yee currently serves as Chief Financial Officer and Senior Vice President Corporate Development and leads DXP's acquisitions, finance, accounting, business integration and human resource activities. During March 2011, Mr. Yee joined DXP from Stephens Inc.'s Industrial Distribution and Services team where he served in various positions and most recently as Vice President from August 2005 to February 2011. Prior to Stephens, Mr. Yee was a member of The Home Depot’s Strategic Business Development Group with a primary focus on acquisition activity for HD Supply. Mr. Yee was also an Associate in the Global Syndicated Finance Group at JPMorgan Chase. He has executed over 45 transactions including more than $1.5 billion in M&A and $3.4 billion in financing transactions primarily for change of control deals and numerous industrial and distribution acquisition and sale assignments. He holds a Bachelors of Arts in Urban Planning from Morehouse College and an MBA from Harvard University Graduate School of Business.

About DXP Enterprises, Inc.

DXP Enterprises, Inc. is a leading products and service distributor that adds value and total cost savings solutions to industrial customers throughout the United States, Canada and Dubai. DXP provides innovative pumping solutions, supply chain services and maintenance, repair, operating and production ("MROP") services that emphasize and utilize DXP’s vast product knowledge and technical expertise in rotating equipment, bearings, power transmission, metal working, industrial supplies and safety products and services. DXP's breadth of MROP products and service solutions allows DXP to be flexible and customer-driven, creating competitive advantages for our customers. DXP’s business segments include Service Centers, Innovative Pumping Solutions and Supply Chain Services. For more information, go to www.dxpe.com.

The Private Securities Litigation Reform Act of 1995 provides a “safe-harbor” for forward-looking statements. Certain information included in this press release (as well as information included in oral statements or other written statements made by or to be made by the Company) contains statements that are forward-looking. Such forward-looking information involves important risks and uncertainties that could significantly affect anticipated results in the future; and accordingly, such results may differ from those expressed in any forward-looking statement made by or on behalf of the Company. These risks and uncertainties include, but are not limited to; ability to obtain needed capital, dependence on existing management, leverage and debt service, domestic or global economic conditions, and changes in customer preferences and attitudes. In some cases, you can identify forward-looking statements by terminology such as, but not limited to, “may,” “will,” “should,” “intend,” “expect,” “plan,” “anticipate,” “believe,” “estimate,” “predict,” “potential,” “goal,” or “continue” or the negative of such terms or other comparable terminology. For more information, review the Company’s filings with the Securities and Exchange Commission.


Contacts

Kent Yee
Senior Vice President CFO
713-996-4700 – www.dxpe.com

Kayrros proprietary technology is the first to differentiate between emissions from gas production and coal mining

PARIS & HOUSTON--(BUSINESS WIRE)--Kayrros has released measurements quantifying the total methane emissions across the Appalachian Basin. The findings, derived from satellite data and proprietary algorithms, place the Appalachian Basin ahead of the Permian as the biggest source of methane in the US and identify the primary sources behind its emissions.


Kayrros leverages data from the European Union’s Sentinel-5P and Sentinel-2 satellites, and advanced mathematics, to detect and attribute large methane emissions events worldwide. Recent data show emissions from fossil fuel production in the Appalachian Basin hit 3 million tons in 2019 and 2.4 million tons in 2020. Given that the warming potential of methane is estimated at 84 times that of carbon dioxide, this is equivalent to the annual emissions of ~30 million cars.

Excluding emissions from coal mines, emissions from natural gas (from the Appalachian’s Marcellus Basin) declined from 1.9 million tons in 2019 to 1.4 million tons in 2020. In comparison, Permian measurements showed methane emissions from oil and natural gas production declined from 2.7 million tons in 2019 to 2.0 million tons in 2020.

Across the basins, methane emissions fell by 20% in the Appalachian and by 26% in the Permian in 2020, largely due to the impact of the Covid pandemic on energy demand. The variation in the percentage decreases can be traced to the differing energy mixes within each basin. These results are consistent with IEA estimates of US emissions from oil and gas and are materially higher than EPA estimates.

The satellite measurements also show that while the methane footprint of the Appalachian is larger than that of the Permian in absolute terms, the 2020 methane intensity of gas production in the Appalachian was lower than in both the Permian and Anadarko Basins. This is likely explained by the fact that Appalachian gas is "non-associated,” meaning it’s the only hydrocarbon fuel produced in the basin. In the Permian Basin, it’s mainly associated with oil extraction, meaning that it comes as a by-product of oil production.

The Appalachian region has been an important source of coal since the 19th century. More recently, it has also become a major hub for natural gas production. Hundreds of coal mines are intermingled with thousands of gas wells across the basin, which complicates the task of measuring total methane emissions and attributing them to their sources.

The findings demonstrate that large methane emissions cannot simply be considered as an unavoidable side effect of production but rather the avoidable consequence of various factors such as insufficient or poorly maintained infrastructure for natural gas gathering, processing, and transportation. Kayrros tracking and attribution technology not only makes it possible to measure change in performance over time and compare trends across basins and assets but also to detect emissions in near realtime and optimize mitigation and prevention efforts. Efficient and accurate leak detection is the first step toward their eradication, and therefore has substantive positive implications for operational standards and policy-making in the energy industry.

This is the first time that methane emissions from coal have been quantified in a comprehensive manner. The modeling approach used by Kayrros in the Appalachian Basin now makes it possible to measure the vast majority of methane emissions worldwide and add granularity to their types and sources. Future Kayrros analyses of major coal mining regions in Australia and China will bring further transparency and make it possible to analyze variations in methane intensity across different types of coal mined around the world. This is a new and important milestone in bringing transparency to energy and the environment.

About Kayrros

Kayrros is the leading global asset observation platform built on fundamental science, strong R&D, and leading technology. Harnessing satellite imagery and multiple sources of unconventional data with machine learning, natural language processing, and advanced mathematics, Kayrros monitors and measures energy and natural resource activity worldwide. With access to data on more than 200,000 industry assets, Kayrros customers track individual or multiple assets in configurable proprietary or collaborative workflows to analyze industrial and environmental performance for maximum insight and optimal operational and financial decisions. For more information, visit www.kayrros.com.


Contacts

Arnaud Salla – Kekst CNC, Paris | +33 6 16 17 52 26
Julius Lang – Kekst CNC, Munich | +49 162 207 4729
This email address is being protected from spambots. You need JavaScript enabled to view it.

Chris Jones - Pierpont Communications
This email address is being protected from spambots. You need JavaScript enabled to view it. | 713-627-2223

HOUSTON & CALGARY, Alberta--(BUSINESS WIRE)--Civeo Corporation (NYSE:CVEO) announced today that it has scheduled its first quarter 2021 earnings conference call for Friday, April 30, at 10:00 a.m. Central Time (11:00 a.m. Eastern Time). During the call, Civeo will discuss financial and operating results for the quarter, which will be released before the market opens on Friday, April 30, 2021.


By Phone:

Dial 800-263-0877 inside the U.S. or 646-828-8143 internationally and ask for the Civeo call at least 10 minutes prior to the start time.

A replay will be available through May 7th by dialing 844-512-2921 inside the U.S. or 412-317-6671 internationally and using the conference ID 6711622#.

By Webcast:

Connect to the webcast via the Events and Presentations page of Civeo's Investor Relations website at www.civeo.com.

Please log in at least 10 minutes in advance to register and download any necessary software.

A webcast replay will be available after the call.

ABOUT CIVEO

Civeo Corporation is a leading provider of hospitality services with prominent market positions in the Canadian oil sands and the Australian natural resource regions. Civeo offers comprehensive solutions for lodging hundreds or thousands of workers with its long-term and temporary accommodations and provides food services, housekeeping, facility management, laundry, water and wastewater treatment, power generation, communications systems, security and logistics services. Civeo currently operates a total of 28 lodges and villages in Canada, Australia and the U.S., with an aggregate of approximately 30,000 rooms. Civeo is publicly traded under the symbol CVEO on the New York Stock Exchange. For more information, please visit Civeo's website at www.civeo.com.


Contacts

Regan Nielsen
Civeo Corporation
Senior Director, Corporate Development & Investor Relations
713-510-2400

Jeffrey Spittel
FTI Consulting
832-667-5140

SACRAMENTO, Calif.--(BUSINESS WIRE)--#PVinstall--SOL Components, a leading producer of cost-effective designs for solar module mounting systems, announced today the successful construction of its Ground Fixed Tilt (GFT) mounting system in support of a 213MWp (DC) solar PV project near Hemet, CA. The project utilizes solar PV to replace electricity capacity previously provided by a nuclear power plant that ceased operation in 1989.


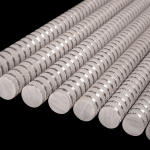
SOL Components’ roll-formed steel components support more than 500,000 solar panels at the site, which is one of the largest ground mounted fixed-tilt solar PV projects in the western United States. SOL Components was selected to support the project because of its expertise with utility-scale solar projects, and the benefits and advantages of their end-to-end PV structural systems. SOL Components’ light gauge roll-formed steel piles and racking components reduce overall steel weight while providing optimum structural integrity, which greatly reduced the developer’s racking costs. The site was developed on steep, undulating terrain necessitating a system with the flexibility to adapt to varying site constraints. SOL Components was able to deliver a racking system that not only easily adapted to variable slope, but also provided flexibility in dealing with unforeseen site challenges.

Mike Fraenkel, SOL Components President and General Manager stated: “SOL Components continues to grow rapidly and take market share in the utility-scale PV racking space, and this 213MW project is a perfect example where our cost-optimized GFT solution and superior support services enable success for our customers. Not every racking provider can meet the challenging terrain, tightly coordinated material delivery, and site support requirements this project required – it’s what we do best.”

About SOL Components

SOL Components was founded in 2015 with the purpose of simplifying solar mounting solutions and reducing the associated project costs and complexity. Leveraging over 40 years in steel manufacturing and an in-house engineering department that works directly with owners, designers, and contractors to facilitate efficient project execution, the SOL Components team has the experience to deliver the project on time and under budget. The mission of their team of highly motivated engineers and manufacturing experts is to develop and produce innovative products for the renewable energy, building and construction industries using roll formed light gauge steel.


Contacts

Company:
Kris Jernstedt
SVP Commercial Operations
P: 925-980-1818
E: This email address is being protected from spambots. You need JavaScript enabled to view it.

Agency:
Jason Isberg
Managing Partner, Speedway Communications
P: 415-269-9784
E: This email address is being protected from spambots. You need JavaScript enabled to view it.

HOUSTON--(BUSINESS WIRE)--Black Stone Minerals, L.P. (NYSE: BSM) (“Black Stone,” “BSM,” or “the Company”) today declared the distribution attributable to the first quarter of 2021. Additionally, the Partnership announced the date of its first quarter 2021 earnings call.


Common Distribution

The Board of Directors of the general partner has approved a cash distribution for common units attributable to the first quarter of 2021 of $0.175 per unit. Distributions will be payable on May 21, 2021 to unitholders of record on May 14, 2021.

Earnings Conference Call

The Partnership is scheduled to release details regarding its results for the first quarter of 2021 after the close of trading on May 3, 2021. A conference call to discuss these results is scheduled for May 4, 2021 at 9:00 a.m. Central time (10:00 a.m. Eastern time). The conference call will be broadcast live in listen-only mode on the company’s investor relations website at www.blackstoneminerals.com. If you would like to ask a question, the dial-in number for the conference call is 877-447-4732 for domestic participants and 615-247-0077 for international participants. The conference ID for the call is 3175119. Call participants are advised to call in 10 minutes in advance of the call start time.

A telephonic replay of the conference call will be available approximately two hours after the call through June 3, 2021, at 855-859-2056 for domestic replay and 404-537-3406 for international replay. The conference ID for the replay is 3175119.

About Black Stone Minerals, L.P.

Black Stone Minerals is one of the largest owners of oil and natural gas mineral interests in the United States. The Company owns mineral interests and royalty interests in 41 states in the continental United States. Black Stone believes its large, diversified asset base and long-lived, non-cost-bearing mineral and royalty interests provide for stable to growing production and reserves over time, allowing the majority of generated cash flow to be distributed to unitholders.

Information for Non-U.S. Investors

This press release is intended to be a qualified notice under Treasury Regulation Section 1.1446-4(b). Although a portion of Black Stone Minerals’ income may not be effectively connected income and may be subject to alternative withholding procedures, brokers and nominees should treat 100% of Black Stone Minerals’ distributions to non-U.S. investors as being attributable to income that is effectively connected with a United States trade or business. Accordingly, Black Stone Minerals’ distributions to non-U.S. investors are subject to federal income tax withholding at the highest marginal rate, currently 37.0% for individuals.


Contacts

Black Stone Minerals, L.P. Contacts

Jeff Wood
President and Chief Financial Officer

Evan Kiefer
Vice President, Finance and Investor Relations
Telephone: (713) 445-3200
This email address is being protected from spambots. You need JavaScript enabled to view it.

BALTIMORE--(BUSINESS WIRE)--#EarthDay--BGE's commitment to innovation and environmental stewardship were recognized recently with awards from the Electric Power Research Institute (EPRI) and Maryland forestry organizations.


The cross-functional teams leading the lauded projects featured employees from Environmental Management, Unmanned Aerial Systems, New Business, Distribution Planning, Reliability & Maintenance Planning, Utility Training, Overhead Distribution, Underground Lines, and Regional Electric Operations.

EPRI Technology Transfer Awards

BGE employees collaborated with colleagues across Exelon on three innovation projects that won EPRI 2020 Technology Transfer Awards, which recognize those who have applied EPRI research to produce significant results in efforts to help make electricity more reliable, efficient, affordable, safe, and environmentally responsible.

The EPRI Technology Transfer Award-winning projects include:

  • Installation of Avian Diverters using Unmanned Aircraft Systems (UAS) – BGE, ComEd, Exelon Generation, PECO, and Pepco collaborated with EPRI to assess and install avian diverters on electric transmission and distribution equipment at Conowingo using unmanned arial systems (i.e., drones). Installation with drones, rather than helicopters, is a safer, more efficient, and lower-cost alternative. There have not been any additional avian collisions in the area since the diverters were installed, and the project is planned for expansion to other locations.
  • Navigating Distributed Energy Resources (DER) Criteria: Creating a Technical Interconnection Requirement for Exelon Utilities – BGE, ComEd, PECO, and PHI collaborated with EPRI to create DER integration criteria as part of the supplemental project: Navigating DER Interconnection Standards and Practices. This helps enable customers to more safely install solar, or other distributed resources, in their homes and businesses.
  • Vehicle Grounding and Personal Protection of Distribution System Mobile Equipment Practices – BGE, ComEd, PECO, and PHI provided EPRI with field tested results that helped develop a standard for improving safety protection for workers using mobile equipment and reducing or eliminating risks to the public. Exelon Utilities is developing a procedure for vehicle and mobile equipment grounding and barricading of work zones, which will affect more than 4,000 lineworkers and contractors at Exelon's operating companies. This project is enabling a standard across the utility industry.

More information is available at epri.com.

PLANT Award

BGE also recently received the People Loving and Nurturing Trees (PLANT) Green Award, which honors BGE's tree planting and tree care initiatives. This is the 12th time BGE has won the PLANT Green Award, the highest honor given by the Maryland Urban and Community Forest Committee of the Maryland Association of District Forestry Boards in partnership with the Maryland Department of Natural Resources Forestry Service. BGE's PLANT Green Award application highlighted the company's longstanding partnership with the Arbor Day Foundation to encourage customers to conserve energy and reduce energy bills through strategic tree planting through the Energy-Saving Trees program. Each year, BGE and Arbor Day make trees available to customers for free on a first-come, first-served basis. Nearly 18,500 BGE customers have received more than 32,000 trees through the joint effort.

BGE's commitment to environmental stewardship is a core company pillar. BGE joined the Maryland Department of the Environment's Green Registry in 2018 and has been ISO 14001 certified since 2012. This year, BGE was named an Environmental Protection Agency ENERGY STAR® Partner of the Year for the 11th time. A total of 16 BGE locations across the company's service area are National Wildlife Federation Certified Wildlife Habitats and BGE's Spring Gardens natural gas facility has a Silver Tier Conservation Certification from the Wildlife Habitat Council. BGE is also a three-time recipient of the National Arbor Day Foundation/National Association of State Foresters Tree Line USA national award for demonstrating practices that protect and enhance America's urban forests through quality tree care, worker training, tree planting, and public education.

More information about BGE's environmental initiatives is available at bge.com. Feature stories about BGE's environmental work are available at bgenow.com.

BGE is Maryland’s largest natural gas and electric utility, providing safe and reliable energy delivery to more than 1.3 million electric customers and more than 680,000 natural gas customers in central Maryland. The company was founded in 1816 as the nation’s first gas utility and remains headquartered in Baltimore City to this day. BGE is a subsidiary of Exelon Corporation (Nasdaq: EXC), the nation’s leading competitive energy provider. Engage with the latest BGE stories on bgenow.com and connect with BGE on Facebook, Twitter, Instagram, and YouTube.


Contacts

Nick Alexopulos, This email address is being protected from spambots. You need JavaScript enabled to view it.
Baltimore Gas and Electric Company (BGE)
BGE Media Hotline: 410.470.7433


DENVER--(BUSINESS WIRE)--Whiting Petroleum Corporation (NYSE:WLL) will host a conference call on Thursday, May 6, 2021 at 11:00 a.m. Eastern time (9:00 a.m. Mountain time) to discuss the first quarter 2021 results. The call will be conducted by President and Chief Executive Officer Lynn A. Peterson, Executive Vice President Finance and Chief Financial Officer James Henderson, Executive Vice President Operations and Chief Operating Officer Charles J. Rimer and Investor Relations Manager Brandon Day. A question and answer session will immediately follow the discussion of the results for the quarter.


To participate in this call please dial:
Domestic Dial-in Number: (877) 328-5506
International Dial-in Number: (412) 317-5422
Webcast URL: https://dpregister.com/sreg/10155734/e7c049863c

Replay Information:
Conference ID #: 10155734
Replay Dial-In (Toll Free U.S. & Canada): (877) 344-7529 (U.S.), (855) 669-9658 (Canada)
Replay Dial-In (International): (412) 317-0088
Expiration Date: May 13, 2021

About Whiting Petroleum Corporation

Whiting Petroleum Corporation, a Delaware corporation, is an independent oil and gas company engaged in the development, production and acquisition of crude oil, NGLs and natural gas primarily in the Rocky Mountains region of the United States. The Company’s largest projects are in the Bakken and Three Forks plays in North Dakota and Montana and the Niobrara play in northeast Colorado. The Company trades publicly under the symbol WLL on the New York Stock Exchange. For further information, please visit http://www.whiting.com.


Contacts

Company Contact: Brandon Day
Title: Investor Relations Manager
Phone: 303‑837‑1661
Email: This email address is being protected from spambots. You need JavaScript enabled to view it.

Atlantic Shores Deploys Two Buoys in Its Lease Area and Offers New Data to Local NJ Researchers

ATLANTIC CITY, N.J.--(BUSINESS WIRE)--Today, Atlantic Shores Offshore Wind (Atlantic Shores) announced the launch of two buoys that will collect critical atmospheric and weather data, and track the migration of species of birds, fish, turtles and other animals that have been nanotagged by researchers. Each buoy will be deployed in the offshore wind developer’s Lease Area off the coast of Atlantic City to strengthen atmospheric models that help inform how the developer designs and estimates energy production for their proposed project. Some data collected will also help deepen research of the Mid-Atlantic Cold Pool as well as help study animal migration and stop-over activities to inform the development of offshore wind in the area.


The buoy deployment is the latest stage of progress for Atlantic Shores as they continue to study their Lease Area for the eventual build out of over 3 gigawatts of offshore wind. While progressing their portfolio of projects, the developer continues to work with state universities conducting atmospheric and migration research off the New Jersey coast. Last year, Atlantic Shores and Rutgers University Center for Ocean Observing Leadership (RUCOOL) collaborated on the installation of a wind LiDAR (light detection and ranging) instrument alongside the causeway leading to the Rutgers University Marine Field Station in Tuckerton, New Jersey.

RUCOOL will use some of the data collected from the upcoming buoy deployment and the ongoing wind LiDAR installation to evaluate the Rutgers University Weather Research Forecasting atmospheric modeling system.

“The publicly available Lidar data provided by ASOW has allowed us to evaluate and validate the Rutgers University Weather Research and Forecasting (RU-WRF) atmospheric modeling system at wind turbine hub heights off the coast of New Jersey,” said Travis Miles, Ph.D., Assistant Professor, Center for Ocean Observing Leadership, Rutgers University. “These types of hub-height wind data have historically had very limited availability in the Mid-Atlantic region, and have been critical to improving and developing our wind forecasting capabilities. RU-WRF is not only used for offshore wind research, but it is also actively used to better understand air-sea interactions during Hurricanes, winter storms, and coastal sea breezes. The model and ASOW Lidar buoy data have been used by faculty, graduate, and undergraduate students as both research and teaching tools over the past two years.”

“We are thrilled to progress the study of our Lease Area and provide data to institutions such as Rutgers University,” said Jennifer Daniels, Development Director from Atlantic Shores. “The analysis that students, faculty and our team will conduct is essential to further develop our knowledge of the Lease Area’s atmospheric and ecological conditions. Atlantic Shores leads with science, and we are proud to collaborate with one of the state’s leading academic institutions to deepen the body of research on coastal New Jersey waters.”

“The publicly available oceanographic data provided by ASOW has been an invaluable dataset for validation of and comparison with both data from autonomous underwater vehicle deployments and regional ocean model output,” said Joe Gradone, Ph.D. Student, Center for Ocean Observing Leadership, Rutgers University. “While the temperature and salinity data are used frequently, the subsurface current data, especially reported in real-time, are particularly valuable.”

The buoys will be launched in May 2021 with the atmospheric data collection instruments and this fall the sensors will be added to begin collecting migration and stop-over data of turtles, bird species, fish and other species which may be nanotagged, including bats and large insects. The sensors will collect data on the unique signature emitted by each tag, including animal location, migration speed between points, length of stop-over and other aspects about their behavior and conservation.

About Atlantic Shores Offshore Wind, LLC:

Atlantic Shores Offshore Wind, LLC is a 50/50 partnership between Shell New Energies US LLC and EDF Renewables North America. The joint venture formed in December 2018 to co-develop a 183,353 acre Lease Area located approximately 10-20 miles off the New Jersey coast between Atlantic City and Barnegat Light. Atlantic Shores is strategically positioned to meet the growing demands of renewable energy targets in New York, New Jersey and beyond, with strong and steady wind resources close to large population centers with associated electricity demand. Our Lease Area, once fully developed, has the potential to generate over 3,000 MW (3 GW) in wind energy and power nearly 1.5 million homes. The capital and expertise needed to develop such a large area is significant. Together, Shell and EDF Renewables have the investment capability and industry experience to bring this project to scale safely, efficiently and cost effectively. For more info: www.atlanticshoreswind.com


Contacts

Julia Ofman, This email address is being protected from spambots. You need JavaScript enabled to view it., 646 246 8211


SANTA CLARITA, Calif.--(BUSINESS WIRE)--California Resources Corporation (NYSE: CRC) announced today that the Company’s executives will be participating in the 2021 Virtual Wells Fargo Energy Conference to be held on June 2-3.


CRC’s presentation materials will be available the day of the event on the Earnings and Presentations page in the Investor Relations section on www.crc.com.

About California Resources Corporation (CRC)

California Resources Corporation (CRC) is an independent oil and natural gas exploration and production company, applying complementary and integrated infrastructure to gather, process and market its production. Using advanced technology, CRC focuses on safely and responsibly supplying affordable energy.


Contacts

Joanna Park (Investor Relations)
818-661-3731
This email address is being protected from spambots. You need JavaScript enabled to view it.

Richard Venn (Media)
818-661-6014
This email address is being protected from spambots. You need JavaScript enabled to view it.

Agreement provides additional customer and community benefits as part of planned merger between AVANGRID and PNM Resources

ORANGE, Conn.--(BUSINESS WIRE)--AVANGRID, Inc. (NYSE: AGR), a leading sustainable energy company, today joined the New Mexico Attorney General, the International Brotherhood of Electrical Workers Local 611, Western Resource Advocates and other community leaders in announcing the parties have reached a stipulation agreement that provides significant enhanced economic development and customer benefits to New Mexico as part of AVANGRID’s planned merger with PNM Resources, Inc (NYSE: PNM).


“AVANGRID is committed to the communities we serve,” said Dennis V. Arriola, CEO of AVANGRID. “That’s why we listened to local leaders, customers and other stakeholders to learn more about the unique circumstances in New Mexico. As a result, we are proud to put forward this agreement, with strong local support, to increase our investments in New Mexico and build on our partnership with New Mexicans and help ensure local communities prosper.”

The customer benefits in the agreement include:

  • $50 million in rate credits over three years;
  • $6 million in COVID arrearages relief;
  • $5 million for low-income energy-efficiency assistance; and
  • $2 million to bring electricity to low-income, remote customers.

“Our discussions with Avangrid have demonstrated the company’s commitment to comprehensively address climate change and its willingness to support policies that will benefit the economy and environment in New Mexico communities and beyond,” said Steve Michel, deputy director of Western Resource Advocates’ clean energy program.

The City of Albuquerque, another intervenor in the merger case, through City Attorney Esteban Aguilar, also expressed confidence in the leadership of the New Mexico Attorney General Hector Balderas when he said, “The Attorney General is lead on this case, and we are confident in his work to resolve this matter.”

AVANGRID looks forward to continued engagement with additional stakeholders involved in this merger case as it works to deliver a positive outcome for New Mexico and for the future of PNM and its customers.

The agreement includes significant additional economic development:

  • 150 new full-time jobs over three years that will remain no less than five years thereafter;
  • $7.5 million in additional economic development funds; and
  • $12.5 million in economic development contributions to community groups in the Four Corners region over five years ($2.5M/year). The community groups, who signed on to the agreement, are Dine Citizens Against Ruining Our Environment, Nava Education Project, San Juan Citizens Alliance and To Nizhoni Ani.

“The legacy of pollution and generational harm to front-line communities from coal-fired energy generation cannot be solved overnight, but this stipulation represents a pathway to a different future, including ongoing dialogue with impacted communities and resources to help the region transition,” said Kyle Tisdel, attorney with the Western Environmental Law Center, which represents the Navajo community groups. “I applaud AVANGRID, PNM and Attorney General Balderas for listening and responding to Native voices and for their commitment to a more sustainable future.”

The stipulation also includes 51 other important commitments, including programs to source locally for future goods and services, environmental commitments for significant carbon reduction, social commitments to ensure greater diversity in hiring, management and contracting, and dozens of financial and governance protections to ensure that PNM is well protected.

The New Mexico Public Regulation Commission is expected to consider the merits of the proposed stipulation agreement in the existing merger proceeding.

“AVANGRID is proud to be bringing forward such an innovative, community-based agreement,” Arriola said. “From Albuquerque and Santa Fe to small towns and the Navajo Nation, customers, communities and employees will benefit from AVANGRID’s commitment to giving back and to providing quality service.”

About AVANGRID: AVANGRID, Inc. (NYSE: AGR) aspires to be the leading sustainable energy company in the United States. Headquartered in Orange, CT with approximately $38 billion in assets and operations in 24 U.S. states, AVANGRID has two primary lines of business: Avangrid Networks and Avangrid Renewables. Avangrid Networks owns and operates eight electric and natural gas utilities, serving more than 3.3 million customers in New York and New England. Avangrid Renewables owns and operates a portfolio of renewable energy generation facilities across the United States. AVANGRID employs approximately 7,000 people and has been recognized by Forbes and Just Capital as one of the 2021 JUST 100 companies – a list of America’s best corporate citizens – and was ranked number one within the utility sector for its commitment to the environment and the communities it serves. The company supports the U.N.’s Sustainable Development Goals and was named among the World’s Most Ethical Companies in 2021 for the third consecutive year by the Ethisphere Institute. For more information, visit www.avangrid.com.

Forward-Looking Statements

Certain statements made in this press release for AVANGRID that relate to future events or expectations, developments, projections, estimates, intentions, goals, targets, and strategies are made pursuant to the Private Securities Litigation Reform Act of 1995. All statements contained in this Press Release that do not relate to matters of historical fact should be considered forward-looking statements, and are generally identified by words such as “may,” “will,” “would,” “can,” “expect(s),” “intend(s),” “anticipate(s),” “estimate(s),” “believe(s),” “future,” “could,” “should,” “plan(s),” “aim(s),” “assume(s)”, “project(s)”, “target(s)”), “forecast(s)”, “seek(s)” and or the negative of such terms or other variations on such terms, comparable terminology or similar expressions. These forward-looking statements generally include statements regarding the potential transaction between AVANGRID and PNM Resources, including any statements regarding the expected timetable for completing the potential merger, the ability to complete the potential merger, the expected benefits of the potential merger, projected financial information, future opportunities, and any other statements regarding AVANGRID’s and PNM Resources’ future expectations, beliefs, plans, objectives, results of operations, financial condition and cash flows, or future events or performance. Readers are cautioned that all forward-looking statements are based upon current reasonable beliefs, expectations and assumptions. AVANGRID assumes any obligation to update this information. Because actual results may differ materially from those expressed or implied by these forward-looking statements, AVANGRID cautions readers not to place undue reliance on these statements.

AVANGRID’s business, financial condition, cash flow, and operating results are influenced by many factors, which are often beyond its control, that can cause actual results to differ from those expressed or implied by the forward-looking statements. For a discussion of risk factors and other important factors affecting forward-looking statements, please see AVANGRID’s Form 10-K and Form 10-Q filings and the information filed on Avangrid’s Forms 8-K with the Securities and Exchange Commission (the “SEC”) as well as its subsequent SEC filings, and the risks and uncertainties related to the proposed merger with PNM Resources, including, but not limited to: the expected timing and likelihood of completion of the pending merger, including the timing, receipt and terms and conditions of any required governmental and regulatory approvals of the pending merger that could reduce anticipated benefits or cause the parties to abandon the transaction, the failure by AVANGRID to obtain the necessary financing arrangement set forth in commitment letter received in connection with the Merger, the occurrence of any event, change or other circumstances that could give rise to the termination of the merger agreement, the risk that the parties may not be able to satisfy the conditions to the proposed Merger in a timely manner or at all, risks related to disruption of management time from ongoing business operations due to the proposed Merger, and the risk that the proposed transaction and its announcement could have an adverse effect on the ability of PNM Resources to retain and hire key personnel and maintain relationships with its customers and suppliers, and on its operating results and businesses generally. Other unpredictable or unknown factors not discussed in this communication could also have material adverse effects on forward looking statements. Readers are cautioned not to place undue reliance on these forward-looking statements that speak only as of the date hereof.


Contacts

Media:
Heather Brewer, 505-310-5957
This email address is being protected from spambots. You need JavaScript enabled to view it.

Athena Hernandez, 203-231-2146 or
This email address is being protected from spambots. You need JavaScript enabled to view it.

Investors:
Patricia Cosgel, 203-499-2624 or
This email address is being protected from spambots. You need JavaScript enabled to view it.

TULSA, Okla.--(BUSINESS WIRE)--$BKEP #Asphalt--Blueknight Energy Partners, L.P. (“Blueknight” or the “Partnership”) (Nasdaq: BKEP and BKEPP), announced today that the board of directors of its general partner has declared a quarterly cash distribution on the Partnership’s common units of $0.04 per common unit, as well as a cash distribution of $0.17875 per unit on the Partnership’s preferred units for the quarter ended March 31, 2021. The first quarter 2021 distributions for both the common and preferred units remain unchanged from those paid for the fourth quarter 2020. The distributions are payable on May 14, 2021, on all outstanding common and preferred units to unitholders of record as of the close of business on May 7, 2021.


Forward-Looking Statements and Treasury Regulation Notice

This release may include forward-looking statements. Statements included in this release that are not historical facts are forward-looking statements. Such forward-looking statements are subject to various risks and uncertainties. These risks and uncertainties include, among other things, uncertainties relating to the Partnership’s future cash flows and operations, the Partnership’s ability to pay future distributions, future market conditions, current and future governmental regulation, future taxation and other factors discussed in the Partnership’s filings with the Securities and Exchange Commission. If any of these risks or uncertainties materializes, or should underlying assumptions prove incorrect, actual results or outcomes may vary materially from those expected. The Partnership undertakes no obligation to publicly update or revise any forward-looking statement, whether as a result of new information, future events or otherwise.

This release is intended to be a qualified notice under Treasury Regulation Section 1.1446-4(b) (4) and (d). Brokers and nominees should treat one hundred percent (100.0%) of Blueknight’s distributions to foreign investors as being attributable to income that is effectively connected with a United States trade or business. Accordingly, Blueknight’s distributions to foreign investors are subject to federal income tax withholding at the highest applicable effective tax rate. Nominees, and not Blueknight, are treated as withholding agents responsible for withholding on the distributions received by them on behalf of foreign investors.

About Blueknight

Blueknight (Nasdaq: BKEP and BKEPP) is a publicly traded master limited partnership that owns the largest independent asphalt terminalling network in the country. Operations include 8.7 million barrels of liquid asphalt storage capacity across 53 terminals and 26 states throughout the U.S. Blueknight is focused on providing integrated terminalling solutions for tomorrow’s infrastructure and transportation end markets. More information is available at www.bkep.com.


Contacts

Blueknight Investor Relations
Dusty Schoeling, VP Finance, (918) 237-4032
This email address is being protected from spambots. You need JavaScript enabled to view it.

  • First quarter 2021 financial performance exceeds internal projections despite winter storm impact
  • Reported net income of $2.5 million and adjusted EBITDA of $30.9 million for the first quarter of 2021
  • Generated distributable cash flow of $12.8 million for the first quarter of 2021
  • Declares quarterly distribution of $0.005 or $0.02 per unit annually

KILGORE, Texas--(BUSINESS WIRE)--Martin Midstream Partners L.P. (Nasdaq:MMLP) (the "Partnership") today announced its financial results for the first quarter of 2021.

“For the first quarter of 2021, the Partnership exceeded our internal earnings forecast by $3.7 million despite headwinds from the February winter storm that plunged Texas and surrounding areas into a deep freeze,” stated Bob Bondurant, President and Chief Executive Officer of Martin Midstream GP LLC, the general partner of the Partnership. “The majority of the impact from winter storm Uri was centered around our transportation and sulfur services segments as refineries ran at reduced rates or halted operations entirely. Our Smackover Refinery was down approximately nine days due to the storm, during which time we began preparations for the previously scheduled turnaround in March. This allowed us to minimize the amount of downtime at the refinery which was back in operation by March 9th. In the NGL segment, butane and propane margins were strong as customary seasonal demand returned.

“At this time the refineries we service have restored operations and utilization has climbed back to 86% of Gulf Coast capacity. The COVID-19 pandemic continues to impact demand but appears to be lessening as vaccinations become more widespread and the economy improves as a result. The Partnership remains focused on our leverage reduction goals and optimizing our assets to maximize free cash flow generation.”

FIRST QUARTER 2021 OPERATING RESULTS BY BUSINESS SEGMENT

TERMINALLING AND STORAGE (“T&S”)

T&S Operating Income for the three months ended March 31, 2021 and 2020 was $3.4 million and $1.0 million, respectively.

Adjusted segment EBITDA for T&S was $10.6 million and $11.5 million for the three months ended March 31, 2021 and 2020, respectively, reflecting the sale of Mega Lubricants in December of 2020 and expired capital recovery fees at the Smackover Refinery offset by improved margins on packaged lubricants products from lower production costs and operating efficiencies.

TRANSPORTATION

Transportation had an operating loss of $1.3 million for the three months ended March 31, 2021 and operating income of $2.4 million for the three months ended March 31, 2020.

Adjusted segment EBITDA for Transportation was $2.7 million and $7.9 million for the three months ended March 31, 2021 and 2020, respectively, reflecting lower marine utilization and reduced day rates along with lower land transportation load count related to demand destruction and lower refinery utilization as a result of COVID-19 and the impact from winter storm Uri in February of 2021.

SULFUR SERVICES

Sulfur Services Operating Income for the three months ended March 31, 2021 and 2020 was $6.4 million and $11.3 million, respectively.

Adjusted segment EBITDA for Sulfur Services was $9.2 million and $10.1 million for the three months ended March 31, 2021 and 2020, respectively, reflecting increased fertilizer demand compared to the first quarter of 2020 offset by lower refinery utilization volumes during the first quarter of 2021 as a result of COVID-19 and the impact from winter storm Uri. The first quarter of 2020 also benefited from business interruption insurance proceeds received of $2.7 million as a result of storm damage to the Neches shiploader.

NATURAL GAS LIQUIDS (“NGL”)

NGL Operating Income for the three months ended March 31, 2021 and 2020 was $11.1 million and $5.2 million, respectively.

Adjusted segment EBITDA for NGL was $12.2 million and $5.5 million for the three months ended March 31, 2021 and 2020, respectively, primarily reflecting increased margins within the butane optimization and propane businesses.

UNALLOCATED SELLING, GENERAL AND ADMINISTRATIVE EXPENSE (“USGA”)

USGA expenses included in operating income for the three months ended March 31, 2021 and 2020 were $3.9 million and $4.4 million, respectively.

USGA expenses included in adjusted EBITDA for the three months ended March 31, 2021 and 2020 were $3.7 million and $4.0 million, respectively, primarily reflecting a reduction in overhead allocated from Martin Resource Management.

LIQUIDITY

At March 31, 2021, the Partnership had $176 million drawn on its $300 million revolving credit facility, a $28.0 million increase from December 31, 2020. The increase was attributable to the redemption of the $28.8 million of senior unsecured notes that matured in February 2021. After the redemption, the Partnership has the following outstanding senior notes: senior secured notes of $53.8 million due 2024 and senior secured notes of $291.9 million due 2025, for a total of senior notes outstanding of $345.7 million. The Partnership’s leverage ratio, as calculated under the revolving credit facility, was 5.4 times on both March 31, 2021 and December 31, 2020. The Partnership is in compliance with all debt covenants as of March 31, 2021.

QUARTERLY CASH DISTRIBUTION

The Partnership has declared a quarterly cash distribution of $0.005 per unit for the quarter ended March 31, 2021. The distribution is payable on May 14, 2021 to common unitholders of record as of the close of business on May 7, 2021. The ex-dividend date for the cash distribution is May 6, 2021.

COVID-19 RESPONSE

The Partnership continues to evaluate protocols in response to the COVID-19 pandemic. Where possible, employee work from home initiatives remain and travel restrictions have been lifted. Employees are encouraged to continue to exercise safety measures to protect the welfare of each other and the communities they serve.

RESULTS OF OPERATIONS

The Partnership had net income for the three months ended March 31, 2021 of $2.5 million, or $0.06 per limited partner unit. The Partnership had net income for the three months ended March 31, 2020 of $8.8 million, or $0.22 per limited partner unit. Adjusted EBITDA for the three months ended March 31, 2021 was $30.9 million compared to the three months ended March 31, 2020 of $31.0 million. Distributable cash flow for the three months ended March 31, 2021 was $12.8 million compared to the three months ended March 31, 2020 of $18.3 million.

Revenues for the three months ended March 31, 2021 were $200.9 million compared to the three months ended March 31, 2020 of $198.9 million.

EBITDA, adjusted EBITDA, distributable cash flow and adjusted free cash flow are non-GAAP financial measures which are explained in greater detail below under the heading "Use of Non-GAAP Financial Information." The Partnership has also included below a table entitled "Reconciliation of EBITDA, Adjusted EBITDA, Distributable Cash Flow and Adjusted Free Cash Flow" in order to show the components of these non-GAAP financial measures and their reconciliation to the most comparable GAAP measurement.

An attachment included in the Current Report on Form 8-K to which this announcement is included, contains a comparison of the Partnership’s Adjusted EBITDA for the first quarter 2021 to the Partnership's Adjusted EBITDA for the first quarter 2020.

Investors' Conference Call

Date: Thursday, April 22, 2021
Time: 8:00 a.m. CT (please dial in by 7:55 a.m.)
Dial In #: (833) 900-2251
Conference ID: 3387961

Replay Dial In # (800) 585-8367 – Conference ID: 3387961

A webcast of the conference call will also be available by visiting the Events and Presentations section under Investor Relations on our website at www.MMLP.com.

About Martin Midstream Partners

Martin Midstream Partners L.P., headquartered in Kilgore, Texas, is a publicly traded limited partnership with a diverse set of operations focused primarily in the United States Gulf Coast region. The Partnership's primary business lines include: (1) terminalling, processing, storage, and packaging services for petroleum products and by-products; (2) land and marine transportation services for petroleum products and by-products, chemicals, and specialty products; (3) sulfur and sulfur-based products processing, manufacturing, marketing and distribution; and (4) natural gas liquids marketing, distribution and transportation services. To learn more, visit www.MMLP.com. Follow Martin Midstream Partners L.P. on LinkedIn and Facebook.

Forward-Looking Statements

Statements about the Partnership’s outlook and all other statements in this release other than historical facts are forward-looking statements within the meaning of the Private Securities Litigation Reform Act of 1995. These forward-looking statements and all references to guidance or to financial or operational estimates or projections rely on a number of assumptions concerning future events and are subject to a number of uncertainties, including (i) the current and potential impacts of the COVID-19 pandemic generally, on an industry-specific basis, and on the Partnership’s specific operations and business, (ii) the effects of the continued volatility of commodity prices and the related macroeconomic and political environment, and (iii) other factors, many of which are outside its control, which could cause actual results to differ materially from such statements. While the Partnership believes that the assumptions concerning future events are reasonable, it cautions that there are inherent difficulties in anticipating or predicting certain important factors. A discussion of these factors, including risks and uncertainties, is set forth in the Partnership’s annual and quarterly reports filed from time to time with the Securities and Exchange Commission. The Partnership disclaims any intention or obligation to revise any forward-looking statements, including financial estimates, whether as a result of new information, future events, or otherwise except where required to do so by law.

Use of Non-GAAP Financial Information

The Partnership's management uses a variety of financial and operational measurements other than its financial statements prepared in accordance with United States Generally Accepted Accounting Principles ("GAAP") to analyze its performance. These include: (1) net income before interest expense, income tax expense, and depreciation and amortization ("EBITDA"), (2) adjusted EBITDA (3) distributable cash flow and (4) adjusted free cash flow. The Partnership's management views these measures as important performance measures of core profitability for its operations and the ability to generate and distribute cash flow, and as key components of its internal financial reporting. The Partnership's management believes investors benefit from having access to the same financial measures that management uses.

EBITDA and Adjusted EBITDA. The Partnership defines Adjusted EBITDA as EBITDA before unit-based compensation expenses, gains and losses on the disposition of property, plant and equipment, impairment and other similar non-cash adjustments. Certain items excluded from EBITDA and adjusted EBITDA are significant components in understanding and assessing an entity's financial performance, such as cost of capital and historical costs of depreciable assets. The Partnership has included information concerning EBITDA and adjusted EBITDA because it provides investors and management with additional information to better understand the following: financial performance of the Partnership's assets without regard to financing methods, capital structure or historical cost basis; the Partnership's operating performance and return on capital as compared to those of other similarly situated entities; and the viability of acquisitions and capital expenditure projects. The Partnership's method of computing adjusted EBITDA may not be the same method used to compute similar measures reported by other entities. The economic substance behind the Partnership's use of adjusted EBITDA is to measure the ability of the Partnership's assets to generate cash sufficient to pay interest costs, support its indebtedness and make distributions to its unitholders.

Distributable Cash Flow. The Partnership defines Distributable Cash Flow as Adjusted EBITDA less cash paid for interest, cash paid for income taxes, maintenance capital expenditures, and plant turnaround costs. Distributable cash flow is a significant performance measure used by the Partnership's management and by external users of its financial statements, such as investors, commercial banks and research analysts, to compare basic cash flows generated by the Partnership to the cash distributions it expects to pay unitholders. Distributable cash flow is also an important financial measure for the Partnership's unitholders since it serves as an indicator of the Partnership's success in providing a cash return on investment. Specifically, this financial measure indicates to investors whether or not the Partnership is generating cash flow at a level that can sustain or support an increase in its quarterly distribution rates. Distributable cash flow is also a quantitative standard used throughout the investment community with respect to publicly-traded partnerships because the value of a unit of such an entity is generally determined by the unit's yield, which in turn is based on the amount of cash distributions the entity pays to a unitholder.

Adjusted Free Cash Flow. Adjusted free cash flow is defined as distributable cash flow less growth capital expenditures and principal payments under finance lease obligations. Adjusted free cash flow is a significant performance measure used by the Partnership's management and by external users of our financial statements and represents how much cash flow a business generates during a specified time period after accounting for all capital expenditures, including expenditures for growth and maintenance capital projects. The Partnership believes that adjusted free cash flow is important to investors, lenders, commercial banks and research analysts since it reflects the amount of cash available for reducing debt, investing in additional capital projects, paying distributions, and similar matters. The Partnership's calculation of adjusted free cash flow may or may not be comparable to similarly titled measures used by other entities.

EBITDA, adjusted EBITDA, distributable cash flow, and adjusted free cash flow should not be considered alternatives to, or more meaningful than, net income, cash flows from operating activities, or any other measure presented in accordance with GAAP. The Partnership's method of computing these measures may not be the same method used to compute similar measures reported by other entities.

MMLP-F


MARTIN MIDSTREAM PARTNERS L.P.

CONSOLIDATED AND CONDENSED BALANCE SHEETS

(Dollars in thousands)


March 31,
2021


December 31,
2020


(Unaudited)


(Audited)

Assets


Cash

$

1,112


$

4,958


Accounts and other receivables, less allowance for doubtful accounts of $248 and $261, respectively

65,232


52,748


Inventories

38,716


54,122


Due from affiliates

22,213


14,807


Fair value of derivatives

12


Other current assets

8,294


8,991


Total current assets

135,579


135,626


Property, plant and equipment, at cost

889,210


889,108


Accumulated depreciation

(518,143)


(509,237)


Property, plant and equipment, net

371,067


379,871


Goodwill

16,823


16,823


Right-of-use assets

21,250


22,260


Deferred income taxes, net

22,178


22,253


Other assets, net

3,314


2,805


Total assets

$

570,211


$

579,638


Liabilities and Partners’ Capital (Deficit)


Current installments of long-term debt and finance lease obligations

$

335


$

31,497


Trade and other accounts payable

56,271


51,900


Product exchange payables

237


373


Due to affiliates

1,214


435


Income taxes payable

696


556


Fair value of derivatives


207


Other accrued liabilities

19,485


34,407


Total current liabilities

78,238


119,375


Long-term debt, net

513,272


484,597


Finance lease obligations

230


289


Operating lease liabilities

14,264


15,181


Other long-term obligations

8,541


7,067


Total liabilities

614,545


626,509


Commitments and contingencies


Partners’ capital (deficit)

(44,334)


(46,871)


Total partners’ capital (deficit)

(44,334)


(46,871)


Total liabilities and partners' capital (deficit)

$

570,211


$

579,638


MARTIN MIDSTREAM PARTNERS L.P.

CONSOLIDATED AND CONDENSED STATEMENTS OF OPERATIONS

(Dollars in thousands, except per unit amounts)


Three Months Ended


March 31,


2021


2020

Revenues:


Terminalling and storage *

$

18,378


$

20,474


Transportation *

29,815


38,941


Sulfur services

2,950


2,915


Product sales: *


Natural gas liquids

98,085


82,211


Sulfur services

31,885


25,408


Terminalling and storage

19,861


28,934


149,831


136,553


Total revenues

200,974


198,883


Costs and expenses:


Cost of products sold: (excluding depreciation and amortization)


Natural gas liquids *

79,135


69,835


Sulfur services *

21,214


15,295


Terminalling and storage *

14,502


23,680


114,851


108,810


Expenses:


Operating expenses *

44,634


51,282


Selling, general and administrative *

10,609


10,462


Depreciation and amortization

14,434


15,239


Total costs and expenses

184,528


185,793


Other operating income (loss), net

(760)


2,510


Operating income

15,686


15,600


Other income (expense):


Interest expense, net

(12,953)


(9,925)


Gain on retirement of senior unsecured notes


3,484


Other, net


3


Total other expense

(12,953)


(6,438)


Net income before taxes

2,733


9,162


Income tax expense

(222)


(347)


Net income

2,511


8,815


Less general partner's interest in net (income)

(50)


(176)


Less (income) allocable to unvested restricted units

(10)


(55)


Limited partners' interest in net income (loss)

$

2,451


$

8,584


Net income per unit attributable to limited partners - basic

$

0.06


$

0.22


Net income per unit attributable to limited partners - diluted

$

0.06


$

0.22


Weighted average limited partner units - basic

38,692,609


38,640,862

Weighted average limited partner units - diluted

38,705,641


38,644,467


*Related Party Transactions Shown Below


MARTIN MIDSTREAM PARTNERS L.P.

CONSOLIDATED STATEMENTS OF OPERATIONS

(Dollars in thousands, except per unit amounts)

*Related Party Transactions Included Above


Three Months Ended


March 31,


2021


2020

Revenues:*


Terminalling and storage

$

15,306


$

15,874


Transportation

4,010


5,894


Product Sales

114


92


Costs and expenses:*


Cost of products sold: (excluding depreciation and amortization)


Sulfur services

2,535


2,767


Terminalling and storage

4,568


5,777


Expenses:


Operating expenses

18,368


21,771


Selling, general and administrative

8,680


8,312


MARTIN MIDSTREAM PARTNERS L.P.

CONSOLIDATED AND CONDENSED STATEMENTS OF CAPITAL (DEFICIT)

(Dollars in thousands)


Partners’ Capital (Deficit)


Common Limited


General
Partner
Amount


Units


Amount


Total

Balances - January 1, 2020

38,863,389


$

(38,342)


$

2,146


$

(36,196)


Net income


8,639


176


8,815


Issuance of restricted units

81,000


Forfeiture of restricted units

(84,134)


Cash distributions


(2,408)


(49)


(2,457)


Unit-based compensation


346


346


Purchase of treasury units

(7,748)


(9)


(9)


Balances - March 31, 2020

38,852,507


$

(31,774)


$

2,273


$

(29,501)


Balances - January 1, 2021

38,851,174


$

(48,776)


$

1,905


$

(46,871)


Net income


2,461


50


2,511


Issuance of restricted units

42,168


Forfeiture of restricted units

(83,436)


Cash distributions


(193)


(4)


(197)


Unit-based compensation


240


240


Purchase of treasury units

(7,156)


(17)


(17)


Balances - March 31, 2021

38,802,750


$

(46,285)


$

1,951


$

(44,334)


MARTIN MIDSTREAM PARTNERS L.P.

CONSOLIDATED AND CONDENSED STATEMENTS OF CASH FLOWS

(Dollars in thousands)


Three Months Ended


March 31,


2021


2020

Cash flows from operating activities:


Net Income

$

2,511


$

8,815


Adjustments to reconcile net income to net cash provided by operating activities:


Depreciation and amortization

14,434


15,239


Amortization of deferred debt issuance costs

755


492


Amortization of premium on notes payable


(77)


Deferred income tax expense

75


286


Loss on sale of property, plant and equipment, net

760


190


Gain on retirement of senior unsecured notes


(3,484)


Derivative (income) loss

1,436


(33)


Net cash paid for commodity derivatives

(1,655)


(636)


Unit-based compensation

240


346


Change in current assets and liabilities, excluding effects of acquisitions and dispositions:


Accounts and other receivables

(12,484)


26,413


Inventories

15,070


15,710


Due from affiliates

(7,406)


2,729


Other current assets

633


(1,413)


Trade and other accounts payable

1,984


(10,440)


Product exchange payables

(136)


450


Due to affiliates

779


(166)


Income taxes payable

140


133


Other accrued liabilities

(13,370)


(9,118)


Change in other non-current assets and liabilities

88


(547)


Net cash provided by operating activities

3,854


44,889


Cash flows from investing activities:


Payments for property, plant and equipment

(2,514)


(12,260)


Payments for plant turnaround costs

(1,674)


(150)


Proceeds from involuntary conversion of property, plant and equipment


1,768


Proceeds from sale of property, plant and equipment

3


4,347


Net cash used in investing activities

(4,185)


(6,295)


Cash flows from financing activities:


Payments of long-term debt

(87,790)


(112,860)


Payments under finance lease obligations

(2,431)


(1,864)


Proceeds from long-term debt

87,000


76,000


Purchase of treasury units

(17)


(9)


Payment of debt issuance costs

(80)


(192)


Cash distributions paid

(197)


(2,457)


Net cash used in financing activities

(3,515)


(41,382)


Net decrease in cash

(3,846)


(2,788)


Cash at beginning of period

4,958


2,856


Cash at end of period

$

1,112


$

68


Non-cash additions to property, plant and equipment

$

2,855


$

2,142


MARTIN MIDSTREAM PARTNERS L.P.

SEGMENT OPERATING INCOME

(Dollars and volumes in thousands, except BBL per day)

Terminalling and Storage Segment

Comparative Results of Operations for the Three Months Ended March 31, 2021 and 2020


Three Months Ended
March 31,


Variance


Percent
Change


2021


2020


(In thousands, except BBL per day)


Revenues:


Services

$

19,959


$

22,167


$

(2,208)


(10)

%

Products

19,875


28,967


(9,092)


(31)

%

Total revenues

39,834


51,134


(11,300)


(22)

%


Cost of products sold

14,941


24,988


(10,047)


(40)

%

Operating expenses

12,793


12,951


(158)


(1)

%

Selling, general and administrative expenses

1,499


1,659


(160)


(10)

%

Depreciation and amortization

7,105


7,456


(351)


(5)

%


3,496


4,080


(584)


(14)

%

Other operating loss, net

(66)


(3,051)


2,985


98

%

Operating income

$

3,430


$

1,029


$

2,401


233

%


Shore-based throughput volumes (guaranteed minimum) (gallons)

20,000


20,000


%

Smackover refinery throughput volumes (guaranteed minimum) (BBL per day)

6,500


6,500


%

Transportation Segment

Comparative Results of Operations for the Three Months Ended March 31, 2021 and 2020


Three Months Ended
March 31,


Variance


Percent
Change


2021


2020


(In thousands)


Revenues

$

33,969


$

45,174


$

(11,205)


(25)

%

Operating expenses

29,504


35,162


(5,658)


(16)

%

Selling, general and administrative expenses

1,800


2,135


(335)


(16)

%

Depreciation and amortization

3,998


4,280


(282)


(7)

%


$

(1,333)


$

3,597


$

(4,930)


(137)

%

Other operating loss, net

(4)


(1,208)


1,204


100

%

Operating income (loss)

$

(1,337)


$

2,389


$

(3,726)


(156)

%


Contacts

Sharon Taylor - Vice President & Chief Financial Officer
(877) 256-6644
This email address is being protected from spambots. You need JavaScript enabled to view it.


Read full story here

  • Net Income of $69.7 Million and Earnings Per Share of $6.38
  • Petroleum Additives Operating Profit of $94.1 Million
  • Focus Remains on Investing in the Long-Term Success of the Company

RICHMOND, Va.--(BUSINESS WIRE)--NewMarket Corporation (NYSE:NEU) Chairman and Chief Executive Officer, Thomas E. Gottwald, released the following earnings report of the Company’s operations for the first quarter of 2021.

Net income for the first quarter of 2021 was $69.7 million, or $6.38 per share, compared to net income of $85.5 million, or $7.67 per share, for the first quarter of 2020.

Sales for the petroleum additives segment for the first quarter of 2021 were $564.9 million, up 1.4% compared to the same period last year. Petroleum additives operating profit for the first quarter of 2021 was $94.1 million, a 17.2% decrease compared to record first quarter operating profit last year of $113.7 million. This decrease was due mainly to lower selling prices and higher conversion and raw material costs, partially offset by increased shipments. Shipments increased 2.6% between periods, with increases in lubricant additives shipments partially offset by decreases in fuel additives shipments. All regions except Europe contributed to the increase in lubricant additives shipments, and Asia Pacific was the only region reporting an increase in fuel additives shipments.

We are pleased with our petroleum additives operating results for the first quarter, but are mindful of the negative impact that our increasing raw material costs have on our operating margins. We will focus on margin improvement during 2021 to help ensure our operating margins remain at the historical ranges our shareholders have come to expect. Government restrictions on travel and work related to COVID-19 have had a negative effect on our business. The pace and stability of improvement in demand for our products will continue to depend heavily on economic recovery and the rate at which restrictions are lifted and remain lifted. We will continue to monitor the government restrictions as well as the status of vaccination programs that are being implemented globally. We expect successful vaccination efforts will help provide more stability in the global economy in 2021.

During the quarter we funded capital expenditures of $20.5 million, and paid dividends of $20.8 million. In March 2021, we issued $400 million 2.70% senior notes that are due in 2031. The proceeds will be used for the repayment of our $350 million 4.10% senior notes that are due in 2022 and for general corporate purposes.

We remain focused on the long-term success of our company, including emphasis on satisfying customer needs, generating solid operating results, and promoting the greatest long-term value for our shareholders, customers and employees. We believe the fundamentals of how we run our business – a long-term view, safety and people first culture, customer-focused solutions, technology-driven product offerings, and a world-class supply chain capability – will continue to be beneficial for all our stakeholders.

Sincerely,

Thomas E. Gottwald

The petroleum additives segment consists of the North America (the United States and Canada), Latin America (Mexico, Central America, and South America), Asia Pacific, and Europe/Middle East/Africa/India (Europe or EMEAI) regions.

The Company has disclosed the non-GAAP financial measure EBITDA and the related calculation in the schedules included with this earnings release. EBITDA is defined as income from continuing operations before the deduction of interest and financing expenses, income taxes, depreciation (on property, plant and equipment) and amortization (on intangibles and lease right-of-use assets). The Company believes that even though this item is not required by or presented in accordance with United States generally accepted accounting principles (GAAP), this additional measure enhances understanding of the Company’s performance and period to period comparability. The Company believes that this item should not be considered an alternative to net income determined under GAAP.

As a reminder, a conference call and Internet webcast is scheduled for 3:00 p.m. EDT on Thursday, April 22, 2021 to review first quarter results. You can access the conference call live by dialing 1-844-369-8770 (domestic) or 1-862-298-0840 (international) and requesting the NewMarket conference call. To avoid delays, callers should dial in five minutes early. A teleconference replay of the call will be available until April 29, 2021 at 3:00 p.m. EDT by dialing 1-877-481-4010 (domestic) or 1-919-882-2331 (international). The replay passcode number is 40638. The call will also be broadcast via the Internet and can be accessed through the Company’s website at www.NewMarket.com or www.webcaster4.com/Webcast/Page/2001/40638. A webcast replay will be available for 30 days.

NewMarket Corporation, through its subsidiaries Afton Chemical Corporation and Ethyl Corporation, develops, manufactures, blends, and delivers chemical additives that enhance the performance of petroleum products. From custom-formulated additive packages to market-general additives, the NewMarket family of companies provides the world with the technology to make engines run smoother, machines last longer, and fuels burn cleaner.

Some of the information contained in this press release constitutes forward-looking statements within the meaning of the Private Securities Litigation Reform Act of 1995. Although NewMarket’s management believes its expectations are based on reasonable assumptions within the bounds of its knowledge of its business and operations, there can be no assurance that actual results will not differ materially from expectations.

Factors that could cause actual results to differ materially from expectations include, but are not limited to, the availability of raw materials and distribution systems; disruptions at production facilities, including single-sourced facilities; hazards common to chemical businesses; the ability to respond effectively to technological changes in our industry; failure to protect our intellectual property rights; sudden or sharp raw material price increases; competition from other manufacturers; current and future governmental regulations; the gain or loss of significant customers; failure to attract and retain a highly-qualified workforce; an information technology system failure or security breach; the occurrence or threat of extraordinary events, including natural disasters; terrorist attacks and health-related epidemics such as the COVID-19 pandemic; risks related to operating outside of the United States; political, economic, and regulatory factors concerning our products; the impact of substantial indebtedness on our operational and financial flexibility; the impact of fluctuations in foreign exchange rates; resolution of environmental liabilities or legal proceedings; limitation of our insurance coverage; our inability to realize expected benefits from investment in our infrastructure or from recent or future acquisitions, or our inability to successfully integrate recent or future acquisitions into our business; the underperformance of our pension assets resulting in additional cash contributions to our pension plans; and other factors detailed from time to time in the reports that NewMarket files with the Securities and Exchange Commission, including the risk factors in Item 1A. “Risk Factors” of our 2020 Annual Report on Form 10-K, which is available to shareholders upon request.

You should keep in mind that any forward-looking statement made by NewMarket in the foregoing discussion speaks only as of the date on which such forward-looking statement is made. New risks and uncertainties arise from time to time, and it is impossible for us to predict these events or how they may affect the Company. We have no duty to, and do not intend to, update or revise the forward-looking statements in this discussion after the date hereof, except as may be required by law. In light of these risks and uncertainties, you should keep in mind that the events described in any forward-looking statement made in this discussion, or elsewhere, might not occur.


NEWMARKET CORPORATION AND SUBSIDIARIES

SEGMENT RESULTS AND OTHER FINANCIAL INFORMATION

(In thousands, except per-share amounts, unaudited)


Three Months Ended

March 31,


2021


2020

Revenue:


Petroleum additives


$

564,898


$

557,372


All other


1,717


2,045


Total


$

566,615


$

559,417


Segment operating profit:


Petroleum additives


$

94,071


$

113,671


All other


(664

)


335


Segment operating profit


93,407


114,006


Corporate unallocated expense


(4,312

)


(4,231

)

Interest and financing expenses


(6,343

)


(7,104

)

Other income (expense), net


6,618


7,407


Income before income tax expense


$

89,370


$

110,078


Net income


$

69,712


$

85,541


Earnings per share - basic and diluted


$

6.38


$

7.67


NEWMARKET CORPORATION AND SUBSIDIARIES

CONSOLIDATED STATEMENTS OF INCOME

(In thousands, except per-share amounts, unaudited)


Three Months Ended

March 31,


2021


2020

Net sales


$

566,615


$

559,417

Cost of goods sold


404,862


378,510

Gross profit


161,753


180,907

Selling, general, and administrative expenses


36,915


35,715

Research, development, and testing expenses


36,337


35,506

Operating profit


88,501


109,686

Interest and financing expenses, net


6,343


7,104

Other income (expense), net


7,212


7,496

Income before income tax expense


89,370


110,078

Income tax expense


19,658


24,537

Net income


$

69,712


$

85,541

Earnings per share - basic and diluted


$

6.38


$

7.67

Cash dividends declared per share


$

1.90


$

1.90


NEWMARKET CORPORATION AND SUBSIDIARIES

CONSOLIDATED BALANCE SHEETS

(In thousands except share amounts, unaudited)


March 31,

2021


December 31,

2020

ASSETS


Current assets:


Cash and cash equivalents


$

522,405


$

125,172


Trade and other accounts receivable, less allowance for credit losses


373,655


336,395


Inventories


414,737


401,031


Prepaid expenses and other current assets


41,670


35,480


Total current assets


1,352,467


898,078


Property, plant, and equipment, net


671,955


665,147


Intangibles (net of amortization) and goodwill


129,248


129,944


Prepaid pension cost


139,104


137,069


Operating lease right-of-use assets


65,307


61,329


Deferred charges and other assets


41,308


42,308


Total assets


$

2,399,389


$

1,933,875


LIABILITIES AND SHAREHOLDERS' EQUITY


Current liabilities:


Accounts payable


$

218,211


$

189,937


Accrued expenses


73,264


78,422


Dividends payable


18,612


15,184


Income taxes payable


5,949


3,760


Operating lease liabilities


14,307


13,410


Other current liabilities


5,510


11,742


Total current liabilities


335,853


312,455


Long-term debt


990,189


598,848


Operating lease liabilities - noncurrent


50,928


48,324


Other noncurrent liabilities


212,064


214,424


Total liabilities


1,589,034


1,174,051


Shareholders' equity:


Common stock and paid-in capital (with no par value; issued and outstanding shares - 10,928,154 at March 31, 2021 and 10,921,377 at December 31, 2020)


1,190


717


Accumulated other comprehensive loss


(172,055

)


(173,164

)

Retained earnings


981,220


932,271


Total shareholders' equity


810,355


759,824


Total liabilities and shareholders' equity


$

2,399,389


$

1,933,875


NEWMARKET CORPORATION AND SUBSIDIARIES

SELECTED CONSOLIDATED CASH FLOW DATA

(In thousands, unaudited)


Three Months Ended

March 31,


2021


2020

Net income


$

69,712


$

85,541


Depreciation and amortization


20,631


21,369


Cash pension and postretirement contributions


(2,577

)


(2,557

)

Working capital changes


(41,421

)


(42,058

)

Deferred income tax expense


2,455


3,379


Capital expenditures


(20,524

)


(20,106

)

Issuance of 2.70% senior notes


395,052


0


Debt issuance costs


(2,932

)


(1,308

)

Net borrowings under revolving credit facility


0


97,424


Repurchases of common stock


0


(79,473

)

Dividends paid


(20,763

)


(21,160

)

All other


(2,400

)


(6,786

)

Increase in cash and cash equivalents


$

397,233


$

34,265


NEWMARKET CORPORATION AND SUBSIDIARIES

NON-GAAP FINANCIAL INFORMATION

(In thousands, unaudited)


Three Months Ended

March 31,


2021


2020

Net Income


$

69,712


$

85,541

Add:


Interest and financing expenses, net


6,343


7,104

Income tax expense


19,658


24,537

Depreciation and amortization


20,324


20,859

EBITDA


$

116,037


$

138,041


Contacts

FOR INVESTOR INFORMATION CONTACT:
Brian D. Paliotti

Investor Relations
Phone: 804.788.5555
Fax: 804.788.5688
Email: This email address is being protected from spambots. You need JavaScript enabled to view it.

HOUSTON--(BUSINESS WIRE)--Kinder Morgan, Inc.’s (NYSE: KMI) board of directors today approved a cash dividend of $0.27 per share for the first quarter ($1.08 annualized), payable on May 17, 2021, to stockholders of record as of the close of business on April 30, 2021. This dividend represents a 3% increase over the fourth quarter of 2020.

KMI is reporting first quarter net income attributable to KMI of $1,409 million, compared to a net loss attributable to KMI of $306 million in the first quarter of 2020; and distributable cash flow (DCF) of $2,329 million, compared to $1,261 million in the first quarter of 2020. The increases are primarily related to the February winter storm and therefore largely nonrecurring. We realized greater margins on KMI’s Texas intrastate pipeline systems resulting from the temporary supply and demand imbalances and substantial spot market price volatility caused by the storm; as well as favorable contributions from the CO2 segment, which curtailed oil production during the storm, allowing power it would have used to be delivered to the grid. Net income for the first quarter of 2021 is also higher relative to the prior year period due to $971 million of impairment charges taken in the first quarter of 2020.

“Apart from the storm and throughout the quarter, our assets continued to provide strong cash flow as we remain guided by a sound corporate philosophy: fund our capital needs internally, maintain a healthy balance sheet, and return excess cash to our shareholders through dividend increases and/or share repurchases,” said KMI Executive Chairman Richard D. Kinder.

“The bulk of our improvement in net income and DCF is due to the strong performance of our Natural Gas Pipelines segment in the face of challenging circumstances presented by the February winter storm. That performance was a result of actions we took following previous weather events, as well as actions we took immediately prior to and during this storm to ensure that our systems could remain operational,” said KMI Chief Executive Officer Steve Kean. “Those actions included enhanced weatherization at storage and other facilities, ensuring critical facilities had backup generation so they wouldn’t lose power, and deploying additional personnel and equipment at normally automated facilities to maintain operations and be positioned to make any necessary repairs if roads became impassable.

“Our storage assets performed exceptionally well, allowing us to deliver gas into the market throughout the storm. These storage withdrawals, along with gas we purchased before and during the event, enabled us to deliver significant volumes of gas at contractual or prevailing prices. These volumes were directed primarily to serve gas utilities and power plants, including some customers who traditionally find their gas supplies elsewhere,” continued Kean. “I am extremely proud of our co-workers throughout the organization in commercial, control rooms, scheduling and contract administration, field operations, and others, who ensured that natural gas reached our wholesale customers even as their own homes were without power and heat.”

“We generated first quarter earnings per share of $0.62, well up compared to a loss per share of $0.14 in the first quarter of 2020,” said KMI President Kim Dang. “At $1.02 per share, DCF per share was up $0.47 from the first quarter of 2020. We achieved $1,714 million of excess DCF above our declared dividend.

“As noted above, that excess cash resulted largely from the outstanding performance of the people in our Texas intrastate pipeline systems and the facilities they kept operational throughout the storm. In addition to the steps Steve outlined, system deliverability and resiliency was also enhanced by our investments in expansion projects and asset maintenance in Texas. These investments, by Kinder Morgan and our joint venture partners, totaled more than $5 billion in the last three years alone.

“We are particularly proud of the fact that the Permian Highway Pipeline, which went into commercial service six weeks prior to the storm, played a key role in keeping more lights and heat on in Austin than would otherwise have been the case,” Dang continued.

2021 Outlook

For 2021, KMI now expects to generate net income attributable to KMI in a range of $2.7 billion to $2.9 billion, declared dividends of $1.08 per share, a 3% increase from the 2020 declared dividends, DCF in a range of $5.1 billion to $5.3 billion, and Adjusted EBITDA in a range of $7.6 billion to $7.7 billion. KMI also now expects to end 2021 with a Net Debt-to-Adjusted EBITDA ratio in a range of 3.9 to 4.0.

As of March 31, 2021, we had over $3.9 billion of borrowing capacity under our $4 billion credit facility and over $1.3 billion in cash and cash equivalents. We believe this borrowing capacity, current cash on hand, and our cash from operations are more than adequate to allow us to manage our cash requirements, including maturing debt, through 2021.

Overview of Business Segments

“The Natural Gas Pipelines segment’s financial performance was well up for the first quarter of 2021 relative to the first quarter of 2020,” said Dang. “The segment provided higher contributions from the Texas intrastate systems and Tennessee Gas Pipeline (TGP), due to their performance during the February winter storm, partially offset by lower contributions from our Oklahoma gathering systems, also due to the storm.”

Natural gas transport volumes were down 3% compared to the first quarter of 2020, with notable volume declines on Colorado Interstate Gas Pipeline (CIG) due to production declines in the Rockies basin; on El Paso Natural Gas due to lower Permian supplies and power generation shifting to coal due to higher natural gas prices (particularly during the winter storm), and milder weather in the southwest later in the quarter; and on Fayetteville Express Pipeline due to contract expirations. These declines were partially offset by: increased volumes on TGP due primarily to weather-related increased usage across the system and increased deliveries to LNG and Mexico customers; on the Permian Highway Pipeline going into service; and, on Elba Express due to increased deliveries to Elba Island. Natural gas gathering volumes were down 25% from the first quarter of 2020 across nearly all our systems, most notably on the KinderHawk and Eagle Ford systems.

“Contributions from the Products Pipelines segment were down compared to the first quarter of 2020 on lower refined products demand as well as lower crude and condensate volumes that were exacerbated by temporary supply and demand interruptions from the February winter storm,” Dang said. “Crude and condensate pipeline volumes were down 28% and total refined products volumes were down 10% compared to the first quarter of 2020. Gasoline volumes were below the comparable period last year by 7% and jet volumes were still very weak (down 40%) but diesel volumes were up by 6% compared to the first quarter of 2020. We did see favorable pricing impacts compared to the first quarter of 2020, when severe declines in commodity prices necessitated inventory value write-downs during that quarter in our transmix and crude and condensate assets.

Terminals segment earnings were down compared to the first quarter of 2020. Extended refinery outages resulting from the winter storm impacted refined product and petroleum coke volumes at our Houston Ship Channel and Port Arthur, Texas-area facilities, reducing associated ancillary and product handling fees for the quarter. Lingering demand reduction attributable to the pandemic continued to affect refined product volumes that move through our terminals as well as demand for our Jones Act tankers, which experienced lower fleet utilization in the quarter compared to the prior year period,” said Dang. “Conversely, effective utilization across our network of nearly 80 million barrels of storage capacity remains near historic highs due to term contracts entered into during the second quarter of 2020. Due to the structure of our contracts, a much more significant portion of our revenue comes from fixed monthly payments on tank leases versus the revenue we receive for moving product through our terminals.”

CO2 segment earnings were up compared to the first quarter of 2020 due to its returning power to the grid by curtailing oil production during the winter storm under its existing contract with its power provider, partially offset by lower CO2 sales and crude volumes and lower realized crude prices. Our realized weighted average crude oil price for the quarter was down 7% at $51.05 per barrel compared to $54.61 per barrel for the first quarter of 2020,” said Dang. “First quarter 2021 combined oil production across all of our fields was down 19% compared to the same period in 2020 on a net to KMI basis, but only down 15% net of curtailed volumes. CO2 sales volumes were down 26%.”

Other News

Corporate

  • In February 2021, KMI issued $750 million in 3.60% senior notes due February 2051.
  • During the first quarter of 2021, KMI repaid a combined $1.9 billion in principal amount of senior notes consisting of (1) $750 million of senior notes due February 2021; (2) $400 million of senior notes due March 2021; and (3) $750 million of senior notes due March 2021 (which were repaid at the beginning of January 2021).
  • On March 12, 2021, KMI announced the formation of a new Energy Transition Ventures group within the company to identify, analyze and pursue commercial opportunities emerging from the low-carbon energy transition. The group, led by Jesse Arenivas, President of Energy Transition Ventures and CO2, and Anthony Ashley, Vice President of Energy Transition Ventures, will focus on broadening KMI’s reach beyond the low-carbon energy initiatives currently in development by our business units.

Natural Gas Pipelines

  • Construction continues on Kinder Morgan Louisiana Pipeline’s approximately $145 million Acadiana expansion project. The project is designed to provide 945,000 dekatherms per day (Dth/d) of capacity to serve Train 6 at Cheniere’s Sabine Pass Liquefaction facility in Cameron Parish, Louisiana. The project is anticipated to be placed into commercial service as early as the first quarter of 2022.
  • On March 8, 2021, KMI and Brookfield Infrastructure Partners L.P. (Brookfield) completed the sale of a combined 25% interest in Natural Gas Pipeline Company of America LLC (NGPL) to a fund controlled by ArcLight Capital Partners, LLC. KMI received net proceeds of $413 million for our proportionate share of the interests sold. KMI and Brookfield now each hold a 37.5% interest in NGPL. KMI will continue to operate the pipeline.
  • NGPL’s Gulf Coast Southbound project was placed in service on March 1, 2021. The approximately $203 million project (KMI’s share: $101.5 million) increases southbound capacity on NGPL’s Gulf Coast System by approximately 300,000 Dth/d to serve Cheniere’s Corpus Christi Liquefaction facility in San Patricio County, Texas. It is supported by a long-term take-or-pay contract, which commenced on April 1, 2021.
  • On March 11, 2021, CIG joined in an announcement that it will be a partner in a responsibly sourced gas (RSG) pilot project along with Project Canary, Colorado Springs Utilities, Bayswater Exploration & Production, LLC and Rimrock Energy Partners. RSG is produced and transported by companies who have committed to reducing methane emissions and whose operations have been independently verified as meeting certain environmental, social and governance standards. Project Canary is a company that provides continuous emissions monitoring data and technologies. CIG will be transporting the RSG to Colorado Springs Utilities for distribution to local consumers and communities in Colorado. Kinder Morgan’s low fugitive methane emissions rate, resulting from years of efforts to reduce emissions across our systems, enabled us to participate in this project. We are pursuing similar opportunities across the Kinder Morgan footprint to bring lower carbon fuels to markets.

Terminals

  • Construction of the butane-on-demand blending system at KMI’s Galena Park Terminal is complete. The project included the construction of a 30,000-barrel butane sphere, a new inbound C4 pipeline, as well as tank and piping modifications that extended butane blending capabilities to 25 tanks, two ship docks, and six cross-channel pipelines. The approximately $48 million project is supported by a long-term agreement with an investment-grade midstream company.

CO2

  • The CO2 segment’s ongoing production optimization focus generated increased SACROC base production versus plan. Additional volumes have also been realized due to lower decline rates in the East Flank and Hawaii project areas. This trend overcame the winter storm curtailment, as the operations groups were able to restore production quickly with minimal impact to the reservoir and to operating expenses. CO2 shipments were also up for the quarter versus plan, a result of increased third party and KMI customer demand.

Kinder Morgan, Inc. (NYSE: KMI) is one of the largest energy infrastructure companies in North America. Access to reliable, affordable energy is a critical component for improving lives around the world. We are committed to providing energy transportation and storage services in a safe, efficient and environmentally responsible manner for the benefit of the people, communities and businesses we serve. We own an interest in or operate approximately 83,000 miles of pipelines and 144 terminals. Our pipelines transport natural gas, refined petroleum products, crude oil, condensate, CO2 and other products, and our terminals store and handle various commodities including gasoline, diesel fuel, chemicals, ethanol, metals and petroleum coke. For more information, please visit www.kindermorgan.com.

Please join Kinder Morgan, Inc. at 4:30 p.m. Eastern Time on Wednesday, April 21, at www.kindermorgan.com for a LIVE webcast conference call on the company’s first quarter earnings.

Non-GAAP Financial Measures

The non-generally accepted accounting principles (non-GAAP) financial measures of Adjusted Earnings and distributable cash flow (DCF), both in the aggregate and per share for each; segment earnings before depreciation, depletion, amortization (DD&A), amortization of excess cost of equity investments and Certain Items (Adjusted Segment EBDA); net income before interest expense, income taxes, DD&A, amortization of excess cost of equity investments and Certain Items (Adjusted EBITDA); Net Debt; Net Debt-to-Adjusted EBITDA; and Free Cash Flow (FCF) in relation to our CO2 segment are presented herein.

Our non-GAAP financial measures described below should not be considered alternatives to GAAP net income (loss) attributable to Kinder Morgan, Inc. or other GAAP measures and have important limitations as analytical tools. Our computations of these non-GAAP financial measures may differ from similarly titled measures used by others. You should not consider these non-GAAP financial measures in isolation or as substitutes for an analysis of our results as reported under GAAP. Management compensates for the limitations of these non-GAAP financial measures by reviewing our comparable GAAP measures, understanding the differences between the measures and taking this information into account in its analysis and its decision-making processes.

Certain Items, as adjustments used to calculate our non-GAAP financial measures, are items that are required by GAAP to be reflected in net income (loss) attributable to Kinder Morgan, Inc., but typically either (1) do not have a cash impact (for example, asset impairments), or (2) by their nature are separately identifiable from our normal business operations and in our view are likely to occur only sporadically (for example, certain legal settlements, enactment of new tax legislation and casualty losses). We also include adjustments related to joint ventures (see “Amounts from Joint Ventures” below and the accompanying Tables 4 and 7.)

Adjusted Earnings is calculated by adjusting net income (loss) attributable to Kinder Morgan, Inc. for Certain Items. Adjusted Earnings is used by us and certain external users of our financial statements to assess the earnings of our business excluding Certain Items as another reflection of our ability to generate earnings. We believe the GAAP measure most directly comparable to Adjusted Earnings is net income (loss) attributable to Kinder Morgan, Inc. Adjusted Earnings per share uses Adjusted Earnings and applies the same two-class method used in arriving at basic earnings (loss) per share. (See the accompanying Tables 1 and 2.)

DCF is calculated by adjusting net income (loss) attributable to Kinder Morgan, Inc. for Certain Items (Adjusted Earnings), and further by DD&A and amortization of excess cost of equity investments, income tax expense, cash taxes, sustaining capital expenditures and other items. We also include amounts from joint ventures for income taxes, DD&A and sustaining capital expenditures (see “Amounts from Joint Ventures” below). DCF is a significant performance measure useful to management and external users of our financial statements in evaluating our performance and in measuring and estimating the ability of our assets to generate cash earnings after servicing our debt, paying cash taxes and expending sustaining capital, that could be used for discretionary purposes such as dividends, stock repurchases, retirement of debt, or expansion capital expenditures. DCF should not be used as an alternative to net cash provided by operating activities computed under GAAP. We believe the GAAP measure most directly comparable to DCF is net income (loss) attributable to Kinder Morgan, Inc. DCF per share is DCF divided by average outstanding shares, including restricted stock awards that participate in dividends. (See the accompanying Tables 2 and 3.)

Adjusted Segment EBDA is calculated by adjusting segment earnings before DD&A and amortization of excess cost of equity investments (Segment EBDA) for Certain Items attributable to the segment. Adjusted Segment EBDA is used by management in its analysis of segment performance and management of our business. General and administrative expenses and certain corporate charges are generally not under the control of our segment operating managers, and therefore, are not included when we measure business segment operating performance. We believe Adjusted Segment EBDA is a useful performance metric because it provides management and external users of our financial statements additional insight into the ability of our segments to generate cash earnings on an ongoing basis. We believe it is useful to investors because it is a measure that management uses to allocate resources to our segments and assess each segment’s performance. We believe the GAAP measure most directly comparable to Adjusted Segment EBDA is Segment EBDA. (See the accompanying Tables 3 and 7.)

Adjusted EBITDA is calculated by adjusting net income (loss) attributable to Kinder Morgan, Inc. before interest expense, income taxes, DD&A, and amortization of excess cost of equity investments (EBITDA) for Certain Items. We also include amounts from joint ventures for income taxes and DD&A (see “Amounts from Joint Ventures” below). Adjusted EBITDA is used by management and external users, in conjunction with our Net Debt (as described further below), to evaluate certain leverage metrics. Therefore, we believe Adjusted EBITDA is useful to investors. We believe the GAAP measure most directly comparable to Adjusted EBITDA is net income (loss) attributable to Kinder Morgan, Inc.. In prior periods, Net income (loss) was considered the comparable GAAP measure and has been updated to Net income (loss) attributable to Kinder Morgan, Inc. for consistency with our other non-GAAP performance measures. (See the accompanying Tables 3 and 4.)

Amounts from Joint Ventures - Certain Items, DCF and Adjusted EBITDA reflect amounts from unconsolidated joint ventures (JVs) and consolidated JVs utilizing the same recognition and measurement methods used to record “Earnings from equity investments” and “Noncontrolling interests (NCI),” respectively. The calculations of DCF and Adjusted EBITDA related to our unconsolidated and consolidated JVs include the same items (DD&A and income tax expense, and for DCF only, also cash taxes and sustaining capital expenditures) with respect to the JVs as those included in the calculations of DCF and Adjusted EBITDA for our wholly-owned consolidated subsidiaries. (See Table 7, Additional JV Information.) Although these amounts related to our unconsolidated JVs are included in the calculations of DCF and Adjusted EBITDA, such inclusion should not be understood to imply that we have control over the operations and resulting revenues, expenses or cash flows of such unconsolidated JVs.

Net Debt is calculated by subtracting from debt (1) cash and cash equivalents, (2) debt fair value adjustments, and (3) the foreign exchange impact on Euro-denominated bonds for which we have entered into currency swaps. Net Debt is a non-GAAP financial measure that management believes is useful to investors and other users of our financial information in evaluating our leverage. We believe the most comparable measure to Net Debt is debt net of cash and cash equivalents as reconciled in the notes to the accompanying Preliminary Consolidated Balance Sheets in Table 6.

CO2 Segment FCF, as used in relation to our CO2 business segment, is calculated by reducing Segment EBDA (GAAP) for our CO2 business segment by Certain Items and capital expenditures (sustaining and expansion). Management uses FCF as an additional performance measure for our CO2 segment. We believe the GAAP measure most directly comparable to FCF is Segment EBDA (GAAP). (See the accompanying Table 7.)

Our guidance for 2021 includes a forecast of net income attributable to KMI, which we previously have not provided due to the impracticability of predicting certain components of net income required by GAAP. As a result of changes to GAAP rules and guidance and our 2019 sale of Kinder Morgan Canada Limited, the impact of components related to commodity and interest rate hedge ineffectiveness and foreign currency fluctuations will be inconsequential. In addition, based on our current circumstances, we do not expect that changes in unrealized gains and losses on derivatives marked to market and potential changes in estimates for certain contingent liabilities will materially impact our ability to forecast net income for 2021. If the circumstances relating to these items or other GAAP requirements change and we determine that the difficulty of predicting components required by GAAP makes it impracticable for us to forecast net income attributable to KMI, we will cease to provide a forecast of net income attributable to KMI and will disclose the factors affecting our ability to do so. (See the accompanying Tables 8 and 9).

Important Information Relating to Forward-Looking Statements

This news release includes forward-looking statements within the meaning of the U.S. Private Securities Litigation Reform Act of 1995 and Section 21E of the Securities Exchange Act of 1934. Generally the words “expects,” “believes,” “anticipates,” “plans,” “will,” “shall,” “estimates,” “projects,” and similar expressions identify forward-looking statements, which are generally not historical in nature. Forward-looking statements in this news release include, among others, express or implied statements pertaining to: the long-term demand for KMI’s assets and services; KMI’s expected Net income attributable to Kinder Morgan, Inc.


Contacts

Dave Conover
Media Relations
(713) 420-6397
This email address is being protected from spambots. You need JavaScript enabled to view it.

Investor Relations
(800) 348-7320
This email address is being protected from spambots. You need JavaScript enabled to view it.
www.kindermorgan.com


Read full story here

TOLEDO, Ohio--(BUSINESS WIRE)--#howwebuildnow--MATEENBAR™ Fiberglas™ Rebar, a lighter, more durable and corrosion-resistant concrete reinforcement alternative to steel rebar for structural, heavy-load applications, launched April 14, 2021, to customers throughout the U.S. With the U.S. preparing for new investments to rebuild its aging infrastructure and create new, stronger buildings, bridges, seawalls, rail systems and other structures, the need for domestically manufactured, higher-performing and more cost-effective materials has never been more critical.


MATEENBAR™ Fiberglas™ Rebar is manufactured in a new Concord, North Carolina facility using Owens Corning Type 30® single-end roving fiberglass originating from the company’s Amarillo, Texas, Composites facility. It will be solely distributed by Owens Corning Infrastructure Solutions (OCIS) to enable increased market access to ACI, ASTM and CSA compliant, high-performance fiberglass rebar (also referred to as GFRP, FRP or composite rebar).

“We are proud to provide a world-class fiberglass rebar product to the federal and state departments of transportation as a proven substitute to steel reinforcements in building more durable and longer-lasting concrete structures” said Chad Fenbert, general manager of OCIS.

Mateenbar™ is recognized globally as a best-in-class concrete reinforcement product and has been used in more than 1,500 construction projects worldwide and certified in 2,500 independent, third-party tests. It is a proven, durable, corrosion resistant reinforcement designed to provide concrete structures with longer service life than traditional steel rebar. Additionally, the product is four times lighter than steel, enabling faster installations with reduced labor and physical demands, as well twice the strength of steel ensuring consistent performance.

“Material conversion in infrastructure is central to the long-term growth of OCIS. Mateenbar™ has built an incredibly powerful global product leadership position and we are excited that our Type 30® single end roving fiberglass made in Amarillo, Texas will now be the reinforcement of choice for this product and enable the building of better structures. Our high-quality products provide consistent and reliable performance to our customers who have come to rely on our differentiated solutions,” added Marcio Sandri, president of Owens Corning Composites.

“We are honored to work with OCIS to introduce a stronger, stiffer and more cost-effective product that extends service life in the U.S. market. OCIS has established itself as the leading global brand for sustainable rebar by enabling customers to switch from steel to fiberglass rebar with ease and confidence,” said Nick Crofts, chief executive officer of Mateenbar USA LLC.


Contacts

For OCIS inquiries:
Casey Ingle, Director of Strategic Marketing at (313) 404-3212

For information on Mateenbar USA LLC:
Nick Crofts, Chief Executive Officer at +44 7739 300402

DEERFIELD, Ill.--(BUSINESS WIRE)--CF Industries Holdings, Inc. (NYSE: CF) today announced that it has signed an engineering and procurement contract with thyssenkrupp for the Company’s green ammonia project at its Donaldsonville, Louisiana, manufacturing complex.


Highlights

  • CF Industries has signed an engineering and procurement contract with thyssenkrupp to supply a 20 megawatt (MW) alkaline water electrolysis plant to produce green hydrogen at the Company’s Donaldsonville, Louisiana, manufacturing complex
  • Construction and installation, which will be managed by CF Industries, is expected to begin in the second half of 2021 and to finish in 2023, with the cost of the initial project fitting within the Company’s annual capital expenditure budget
  • CF Industries will integrate the carbon-free hydrogen generated by the electrolysis plant into existing ammonia synthesis loops to enable the production of 20,000 tons per year of green ammonia
  • When complete in 2023, the Donaldsonville green ammonia project will be the largest of its kind in North America

“Today we launch a new era for CF Industries as we sign a definitive agreement to develop the first commercial-scale green ammonia project in North America,” said Tony Will, president and chief executive officer, CF Industries Holdings, Inc. “This project highlights the competitive advantage our world class ammonia production network offers to industries sourcing carbon-free energy and reinforces our commitment to make significant progress in reducing our carbon footprint by 2030.”

Ammonia as a Clean Energy Source

As countries around the world work to reach net-zero carbon emissions by 2050, hydrogen has emerged as a leading source of clean energy. Industry experts project hydrogen will meet approximately 20% of the world’s energy needs by 2050, up from less than 1% today. Ammonia is a critical enabler for the storage and transport of hydrogen and can also be a clean fuel in its own right.

CF Industries, the world’s largest producer of ammonia, is pursuing initiatives to support this clean energy future. These include the production of green ammonia – ammonia produced using hydrogen from carbon-free sources – and blue ammonia – ammonia produced with carbon dioxide removed through carbon capture and sequestration and other certified carbon abatement projects.

Donaldsonville Green Ammonia Project

The Company’s first green ammonia project will be implemented at its Donaldsonville, Louisiana, manufacturing complex. The project will utilize a 20 MW alkaline water electrolyzer developed by thyssenkrupp. The modular electrolyzer technology allows additional units to be added that leverage the Donaldsonville site infrastructure, enabling production to scale in the future.

CF Industries will allocate renewable energy purchased across its network from available grid-connected sources to match 100% of the electricity needed by the electrolyzer to separate water into carbon-free hydrogen and oxygen. The electrolyzer will be integrated into existing ammonia plants at Donaldsonville where atmospheric nitrogen will be fixed with the carbon-free hydrogen to produce green ammonia.

“We are pleased to partner with thyssenkrupp on our first green ammonia project at our Donaldsonville facility,” said Ashraf Malik, senior vice president, manufacturing and distribution, CF Industries Holdings, Inc. “Their established and reliable technology complements our commitment to the clean energy economy. By integrating the water electrolysis plant into existing ammonia production at Donaldsonville, we will build on our ammonia manufacturing expertise and identify efficiencies that will allow us to scale production in the future.”

The initial project will enable the production of approximately 20,000 tons per year of green ammonia and is expected to be the largest project of its kind in North America at completion.

About CF Industries Holdings, Inc.

At CF Industries, our mission is to provide clean energy to feed and fuel the world sustainably. Our employees are focused on safe and reliable operations, environmental stewardship, and disciplined capital and corporate management. We are on a path to decarbonize our ammonia production network – the world’s largest – to enable green and blue hydrogen and nitrogen products for energy, fertilizer, emissions abatement and other industrial activities. Our nine manufacturing complexes in the United States, Canada, and the United Kingdom, an unparalleled storage, transportation and distribution network in North America, and logistics capabilities enabling a global reach underpin our strategy to leverage our unique capabilities to accelerate the world’s transition to clean energy. CF Industries routinely posts investor announcements and additional information on the company’s website at www.cfindustries.com and encourages those interested in the company to check there frequently.


Contacts

Media
Chris Close
Director, Corporate Communications
847-405-2542 – This email address is being protected from spambots. You need JavaScript enabled to view it.

Investors
Martin Jarosick
Vice President, Investor Relations
847-405-2045 – This email address is being protected from spambots. You need JavaScript enabled to view it.

DAVIDSON, N.C.--(BUSINESS WIRE)--Ingersoll Rand Inc., (NYSE: IR) a global provider of mission-critical flow creation and industrial solutions, will issue its first-quarter earnings release after the market closes on April 28, 2021.


Ingersoll Rand will also host a live earnings conference call to discuss the first-quarter results on Thursday, April 29, 2021 at 8 a.m. (Eastern time). To participate in the call, please dial 1-844-200-6205, domestically, or 1-646-904-5544, internationally, and use conference ID 833508, or ask to be joined into the Ingersoll Rand call.

A real-time audio webcast of the presentation can be accessed via the Events and Presentations section of the Ingersoll Rand Investor Relations website (https://investors.irco.com), where related materials will be posted prior to the conference call.

A replay of the webcast will be available after conclusion of the conference and can be accessed on the Ingersoll Rand Investor Relations website.

About Ingersoll Rand Inc.

Ingersoll Rand Inc. (NYSE:IR), driven by an entrepreneurial spirit and ownership mindset, is dedicated to helping make life better for our employees, customers and communities. Customers lean on us for our technology-driven excellence in mission-critical flow creation and industrial solutions across 40+ respected brands where our products and services excel in the most complex and harsh conditions. Our employees develop customers for life through their daily commitment to expertise, productivity and efficiency. For more information, visit www.IRCO.com.


Contacts

Media:
Misty Zelent
This email address is being protected from spambots. You need JavaScript enabled to view it.

Investor Relations:
Christopher Miorin
This email address is being protected from spambots. You need JavaScript enabled to view it.

HOUSTON--(BUSINESS WIRE)--SilverBow Resources, Inc. (NYSE: SBOW) (“SilverBow” or “the Company”) announced today it will release financial and operating results for the first quarter 2021 and post an updated corporate presentation after market close on Wednesday, May 5, 2021.


SilverBow will host a conference call to discuss its results on Thursday, May 6, 2021 at 9:00 a.m. Central Time (10:00 a.m. Eastern Time). Investors and participants can register for the call in advance by visiting http://www.directeventreg.com/registration/event/2256468. After registering, instructions will be shared on how to join the call.

Info:


SilverBow Resources First Quarter 2021 Earnings Conference Call

Conference ID: 2256468

Webcast:


Live and rebroadcast over the internet at:


https://event.on24.com/wcc/r/3079958/74671759900173EE04392E603EC8EE84

https://www.sbow.com

Replay:


A replay will be available approximately two hours after the call through Thursday, June 3, 2021 at 10:59 p.m. Central Time (11:59 p.m. Eastern Time). The replay may be accessed by dialing 1-800-585-8367 or 1-416-621-4642, and referencing the Conference ID: 2256468.

ABOUT SILVERBOW RESOURCES, INC.

SilverBow Resources, Inc. (NYSE: SBOW) is a Houston-based energy company actively engaged in the exploration, development, and production of oil and gas in the Eagle Ford Shale in South Texas. With over 30 years of history operating in South Texas, the Company possesses a significant understanding of regional reservoirs which it leverages to assemble high quality drilling inventory while continuously enhancing its operations to maximize returns on capital invested. For more information, please visit www.sbow.com.


Contacts

Jeff Magids
Director of Finance & Investor Relations
(281) 874-2700, (888) 991-SBOW

The Larsen and Lam Climate Initiative injects $35 million for the purchase of cutting-edge plant to be located in California

OTTAWA, Ontario--(BUSINESS WIRE)--Today, OMNI Conversion Technologies Inc. (OMNI CT) announced the first sale of its unprecedented waste to hydrogen product. The Larsen and Lam Climate Initiative, a foundation backed by philanthropists Chris Larsen and Lyna Lam, has committed $35 million to bring this ground-breaking technology to production in the fight against climate change. The first commercial plant in production from OMNI CT will use unsorted non-recyclable Municipal Solid Waste (MSW), which is currently disposed of in landfills, to produce negative carbon hydrogen in California.


New technologies are essential in the fight against climate change. While low-cost solar electricity was a dream only a decade ago, its impact today is far-reaching. The Larsen and Lam Climate Initiative investment will accelerate the global adoption of OMNI CT technology.

”Low or zero CO2 fuels are critical to achieving a decarbonized economy. OMNI CT has created a first-of-its-kind product that can have a global and immediate impact. This is why we are excited to work with their team to bring this technology to market in California as our first project from the Larsen and Lam Climate Initiative,” said Chris Larsen, Co-Founder of the Larsen and Lam Climate Initiative and Ripple.

“With surging global interest in hydrogen and biofuels and as the urgency grows around the climate change crisis, it’s an opportune time to be launching our product into the fight against climate change. We’ve spent 15 years and $400 million perfecting it. We’re thrilled to be working with the Larsen and Lam Climate Initiative who not only understand but share our vision for the future,” said Rod Bryden, CEO of OMNI CT.

Professor Daniel Kammen, Chair of the Energy and Resources Group at the University of California, Berkeley, commented that zero-carbon fuels are a critical part of the aggressive path to a clean economy. As California looks to build a vibrant zero-carbon economy, the Omni technology is an exciting addition that will solve multiple problems at once.

The Omni 200™ GPRS™ waste to hydrogen product can produce around 5000 tonnes of negative carbon hydrogen each year, from 200 tonnes a day of unsorted non-recyclable garbage. Hydrogen is produced in the city where it is needed and the garbage is diverted from landfill to OMNI CT and eliminated with no air emissions and nothing left for disposal. Energy in the garbage replaces electricity otherwise required to make green hydrogen. The circular hydrogen produced could operate some 550 city buses running on hydrogen at a cost less than the current cost of using gasoline or diesel.

The purchase was funded and signed on April 21, 2021 with the goal of being in production in California converting Municipal Solid Waste to hydrogen by the end of 2023.

About OMNI CT

OMNI CT is an Ottawa Canada-based company that has developed a proprietary technology by designing, building, testing, and operating a complete commercial demonstration plant from 2007-2014. The patented process converts any solid energetic material into OmniSyngas™ to produce clean green hydrogen, biofuels, synthetic natural gas, chemicals or electricity for the circular economy.

OMNI CT’s robust efficient OMNI200™ GPRS™ is providing a unique solution to achieving decarbonization targets.

The OMNI200™ Gasification & Plasma Refining System (GPRS™)

The OMNI200™ GPRS™ unit is proven at industrial scale. It is a complete integrated system, delivered to site in large modules, rather than stick-built. It receives and converts at a rate of 200 tonnes per day (67,000 tonnes per year) a wide variety and mix of energetic wastes into clean consistent syngas with a predictable heating value and composition. The H2/CO ratio can be tailored to the final application. Multiple units can be readily combined for larger plants.

OmniSyngas™

OmniSyngas™ is a precursor to the production of hydrogen and biofuels. Municipal solid waste has more than 50% biogenic content. This will produce green fuels and avoid methane from sending waste to landfills. Since methane has 25x the GHG effect of CO2, these fuels can be produced with a negative carbon footprint. Further reduction is possible by capturing and storing the CO2 in the syngas.

For additional details on Omni CT’s product: Download Product Description


Contacts

OMNI Conversion Technologies Inc.
Randy Bennett
This email address is being protected from spambots. You need JavaScript enabled to view it.
OmniCT.com

Offshore Source Logo

Offshore Source keeps you updated with relevant information concerning the Offshore Energy Sector.

Any views or opinions represented on this website belong solely to the author and do not represent those of the people, institutions or organizations that Offshore Source or collaborators may or may not have been associated with in a professional or personal capacity, unless explicitly stated.

Corporate Offices

Technology Systems Corporation
8502 SW Kansas Ave
Stuart, FL 34997

info@tscpublishing.com