Business Wire News

Week-long programming on technology, innovation and decarbonization—centered in the “CERAWeek Agora-X”—will be a major focus at the world’s preeminent energy conference, to be held virtually March 1-5


HOUSTON--(BUSINESS WIRE)--Andy Jassy, CEO of Amazon Web Services, will be among the technology and innovation speakers at CERAWeek by IHS Markit 2021—the world’s preeminent energy conference—to be held virtually March 1-5.

Mr. Jassy will speak about reinventing the energy industry for a more sustainable future and will join a lineup of technology leaders such as Moderna co-founder and chairman Noubar Afeyan, Microsoft chief environmental officer Lucas Joppa and former U.S. Secretary of Energy Ernest J. Moniz.

CERAWeek 2021: The New Map: Energy, Climate and Charting the Future will examine a new global map being shaped by dramatic shifts in energy and geopolitics—a map defined less by physical and political boundaries than by policies, technology, alliances and possibly collisions in global commerce and politics.

Inspired by the new book, The New Map: Energy, Climate and the Clash of Nations by IHS Markit Vice Chairman and CERAWeek Chairman Daniel Yergin, the conference program will focus on key themes related to Energy Transition; Geopolitics, Economics and Markets; Investment and Financing; Technology and Innovation; Mobility and the Future Workforce.

The CERAWeek Agora-X will serve as the central hub of the technology and innovation program at the virtual conference. It will feature a community of thought leaders, technologists, start-ups, investors, academics, energy companies and government officials to explore emerging technologies in the energy space—from digital and AI to storage, renewables, mobility, hydrogen, nuclear, additive manufacturing and agile design, robotics and more.

The CERAWeek Agora-X program is available to all CERAWeek registrants and will comprise a series of candid conversations, on-demand presentations and discussions, anchored by the Voices of Innovation series featuring intimate, one-on-one conversations with thought leaders including:

  • Noubar Afeyan, co-founder and chairman, Moderna. Interviewed by Walter Isaacson, author and professor of history, Tulane University
  • Arun Majumdar, founding director of the Advanced Research Projects Agency - Energy (ARPA-E). Interviewed by Atul Arya, senior vice president and chief energy strategist, IHS Markit
  • Jon Hirschtick, founder and former CEO of SolidWorks. Interviewed by James Rosenfield, CERAWeek co-founder and senior vice president, IHS Markit
  • Ernest J. Moniz, president and CEO, Energy Futures Initiative. Former U.S. Secretary of Energy. Interviewed by Pratima Rangarajan, CEO, OGCI Climate Investments
  • Walter Isaacson, author and professor of history, Tulane University. Interviewed by Susan Hockfield, president emerita and professor of neuroscience, MIT
  • Maria Zuber, vice president for research and E.A. Griswold professor of geophysics, MIT. Interviewed by Antonia Bullard, senior associate, IHS Markit

The CERAWeek Agora-X program also includes Studio sessions—moderated dialogues with 2-3 guest speakers on emerging and disruptive technologies—focused on topics such as:

  • Low Carbon Hydrogen: Production technologies and costs
  • What Happens to Mobility in the Post-pandemic World?
  • New Horizons for Energy and Climate Research
  • How Will the Energy Innovation Ecosystem Evolve?
  • Utility-scale Batteries and Storage: What's Ahead?

“The convergence of technology and energy has never been stronger,” said Daniel Yergin, vice chairman, IHS Markit and CERAWeek conference chair. “That became a major theme of my new book, The New Map and it will be an inseparable component of this year’s conference.” Whether it is the increased digitization of the industry; how the future of mobility is impacting energy (and vice versa); or the continued evolution of renewables and decarbonization, a wave of innovation is shaping—and being shaped by—the energy future. The breadth and depth of the technology and innovation program, centered in the CERAWeek Agora-X, shows how tech and energy have become synonymous with each other. They are really one in the same.”

Key themes to be explored across the CERAWeek Agora-X program include:

  • Decarbonization Pathways: Measurement, initiatives, and new fuel solutions
  • Digital Transformation Technologies: Computing, analytics, operations, and risks
  • Mobility and Built Environment: Vehicles, urban centers, and mobility
  • Innovation and Digital Workforce: Investment, inclusion, and innovation ecosystems
  • Clean Power Technologies: Advanced technologies, renewables integration, storage, and new supply chains

Learn more about the CERAWeek Agora-X program at: https://ceraweek.com/program/innovation-agora.html

CERAWeek by IHS Markit is the premier annual international gathering of energy industry leaders, experts, government officials and policymakers, leaders from the technology, financial and industrial communities – and energy technology innovators. CERAWeek 2021 marks the 39th installment of the conference and is the first time that it will be an all-virtual event. The conference is produced by IHS Markit (NYSE: INFO), a world leader in critical information, analytics and solutions.

Visit www.ceraweek.com for a complete list of conference speakers and the most up-to-date program information (subject to change).

Registration Information

CERAWeek by IHS Markit 2021 will be held virtually March 1-5. Further information and delegate registration is available at www.ceraweek.com.

Media Accreditation

Media registration is now open. Members of the media interested in covering CERAWeek 2021 are required to apply for accreditation. Applications can be submitted via the following link: https://ceraweek.com/about/press.html

About IHS Markit (www.ihsmarkit.com)

IHS Markit (NYSE: INFO) is a world leader in critical information, analytics and solutions for the major industries and markets that drive economies worldwide. The company delivers next-generation information, analytics and solutions to customers in business, finance and government, improving their operational efficiency and providing deep insights that lead to well-informed, confident decisions. IHS Markit has more than 50,000 business and government customers, including 80 percent of the Fortune Global 500 and the world’s leading financial institutions. Headquartered in London, IHS Markit is committed to sustainable, profitable growth.

IHS Markit is a registered trademark of IHS Markit Ltd. and/or its affiliates. All other company and product names may be trademarks of their respective owners © 2021 IHS Markit Ltd. All rights reserved.


Contacts

News Media:
Jeff Marn
IHS Markit
+1 202 463 8213
This email address is being protected from spambots. You need JavaScript enabled to view it.

Press Team
+1 303 858 6417
This email address is being protected from spambots. You need JavaScript enabled to view it.

Edison Gold Award-winning powder available in Asia through RtMJ

BOSTON & TOKYO--(BUSINESS WIRE)--NanoAL, LLC announced today that it has signed a Commercial License Agreement with Mitsubishi Corporation RtM Japan Ltd. (RtMJ) to bring its award-winning Addalloy® family of advanced aluminum alloy powders to the rapidly growing Metal Additive Manufacturing (AM) Market in Asia. The companies also signed a letter of intent for potential partnerships on additional NanoAL advanced aluminum alloy products including aluminum casting and rolled sheets for automotive and other industrial applications.


This announcement is an enormous signal of the market need for Addalloy powders. In partnership with RtMJ, a wholly owned subsidiary of Mitsubishi Corporation, a global integrated business enterprise, we will now be able to reach across the globe to deliver the promise of our aluminum alloy technologies’ excellent performance and economics,” said Dr. Nhon Vo, CEO of NanoAL LLC.

We believe the aluminum alloys developed by NanoAL are the essential materials for the next generation to achieve decarbonization, electrification and a circular economy. NanoAL and RtMJ will play an important role in creating a cleaner and greener society by combining the advanced technology of NanoAL with the global business network of RtMJ,” said Takehito Nagashima, General Manager of New Business Development and DX Office, Mitsubishi Corporation RtM Japan Ltd.

Addalloy is an award-winning aluminum alloy technology designed and developed for Metal Additive Manufacturing via laser powder bed fusion. Today, Addalloy consists of 5T, 7S, and HX compositions, each with application specific performance levels tailored to the demands of Automotive, Motorsports, Aerospace, and Industrial markets.

  • Addalloy 5T – Delivers optimal material performance for structural applications enabling fully functional and high performing parts that outperform typically wrought alloy components made using subtractive manufacturing.
  • Addalloy HX – Exceptional performance for thermal management applications such as heat exchanger/heat sink in the demanding markets of Motorsports, Electronics, Semiconductor and Satellite.
  • Addalloy 7S – Presents an incredible strength to weight ratio highly sought after in Motorsports, Aerospace and Satellite applications where weight to performance metrics are the most critical design factors in material selection.

Addalloy powders work on major laser-based OEM platforms for Metal 3D Printing including EOS, SLM Solutions, Renishaw, Concept Laser, and many others. Using Addalloy, designers and engineers are able to transform their product concepts and bring new designs to life with a focus on lightweighting, durable performance, and package size reduction.

About NanoAL, LLC

NanoAL, LLC is a materials research and technology company dedicated to design, development, and commercialization of high-performance aluminum alloys based on scientifically designed nanostructures. NanoAL has developed several innovative products that include the Addalloy® family of aluminum powders that are tailored for 3D-printing and high-strength rolled sheet aluminum alloys that are designed for lightweighting in automotive, food & beverage applications, delivering extraordinary performance and economics. NanoAL, LLC is a wholly owned subsidiary and R&D arm of Unity Aluminum Inc.

About Mitsubishi Corporation RtM Japan Ltd.

Mitsubishi Corporation RtM Japan Ltd., a subsidiary of Mitsubishi Corporation, is a metals and mineral resources trading company, which deals in a wide spectrum of general metal resources and materials, including coal and iron ore, aluminum, copper, and precious metals, as well as nickel, chrome and rare metals.

About the Edison Awards

The Edison Awards in the world’s most revered Innovation Award dedicated to recognizing and honoring the best in innovation and innovators since 1987. For more information about the Edison Awards complete program and a list of past winners, visit www.edisonawards.com


Contacts

Commercial Contact:
Matthew Simmers: 833-462-6625
This email address is being protected from spambots. You need JavaScript enabled to view it.

Media Contact:
Kaylee Price: 832-878-2904
This email address is being protected from spambots. You need JavaScript enabled to view it.

CREtechClimate.com To Raise Awareness And Drive Investments In Critically Important Climate, Sustainability and ESG Movements

NEW YORK--(BUSINESS WIRE)--#CRE--CREtech, the largest media company devoted to covering the real estate technology sector, announced the official launch of CREtech Climate, a new platform devoted to educating and inspiring investment in climate tech, Sustainability, and ESG throughout the Built World. In collaboration with Fifth Wall and several leading real estate and advisory companies, CREtech Climate’s mission is to decarbonize the industry and promote sustainability and ESG through a daily newsletter, virtual events, webinars/forums, and market research.


CREtech Climate will be the “voice” of the real estate industry’s commitment to climate tech by developing a global consortium of thought-leaders, policy makers, venture capitalists, startups, and real estate companies. The overriding goal of CREtech Climate is to significantly reduce the industry’s carbon footprint by driving investments and encouraging the adoption of climate technologies.

CREtech is joined by Founding Sponsors Fifth Wall, the largest venture capital firm focused on technology-driven innovation for the global real estate industry, Savills, a global real estate services provider, Oxford Properties Group, a leading global commercial real estate investor, developer and manager, RXR, a leading real estate owner, investor, operator and developer, and EY, a global consulting, assurance, tax and transaction services company.

“The real estate industry has an extraordinary opportunity to be the catalyst for meaningful progress in addressing the climate crises. CREtech Climate will be an accelerant in not just driving awareness but forcing measurable action throughout the Built World,” stated Michael Beckerman, CEO of CREtech.

Join the CREtech Climate community here.

If your company is at the intersection of real estate and clean technology, please join our database here so that we can be in touch regarding ways we can support your initiatives.


Contacts

Lauren Leal
(201) 615-5551
This email address is being protected from spambots. You need JavaScript enabled to view it.

DUBLIN--(BUSINESS WIRE)--The "Global Personal Protective Equipment (PPE) Market in the Wind Energy Industry 2021 - Growth Being Driven by Government Incentives and Initiatives" report has been added to ResearchAndMarkets.com's offering.


PPE in the wind energy industry was valued at $409.2 million in 2020. The growth in the industry has been driven by an increase in installation and maintenance services of wind farms and resultant employment opportunities, growing awareness about wind energy PPE, riskier work environments, and stringent regulatory compliance.

Driven by high compliance rates, and stringent regulatory norms, Europe is the largest market of PPE for wind energy, constituting nearly 44.4% revenue market share in 2020. The total revenue is expected to increase from $181.9 million in 2020 to $229 million in 2025, at a CAGR of 4.7%.

With the expected increase in both offshore and onshore farms and an increase in employment opportunities, the Asia-Pacific is expected to have the highest growth rate growing at a CAGR of 4.9%. The Asia-Pacific is expected to grow from $123.6 million in 2020 to $157.2 million in 2025.

Fall protection PPE is the largest and is also the fastest-growing product segment. Fall protection PPE for wind energy is expected to grow at a CAGR of 5.1% from 2020 to 2025.

Major PPE manufacturers are expected to enter into partnerships or gain market share through mergers and acquisitions and consolidate their position by entering into the lucrative Asia-Pacific wind energy PPE market, which is currently dominated by regional players.

Companies Mentioned

  • 3M
  • ATG Gloves
  • Atlas
  • Avanti
  • Ballyclare
  • Base Protection
  • Bullard
  • Bulwark
  • Delta Plus
  • Dunlop Footwear
  • Dynamic Safety
  • Elk River
  • Ergodyne
  • Essilor
  • Fal Seguridad
  • Fall Tech
  • Haix
  • Honeywell
  • JSP
  • Lakeland Industries
  • Mascot
  • MCR Safety
  • Moldex-Metric
  • MSA
  • National Safety Apparel
  • Occunomix
  • Petzl
  • Pure Safety Group
  • Radians Inc.
  • Reliance Fall Protection
  • Sensear
  • Showa
  • Sioen
  • Skylotec

Key Topics Covered:

1. Strategic Imperatives

2. Growth Opportunity Analysis, Global PPE in Wind Energy Industry

  • Key Findings
  • Global PPE in Wind Energy Industry Scope of Analysis
  • Global PPE in Wind Energy Industry Segmentation
  • Global Installed Wind Energy Capacity and Growth Rate
  • Global Added Wind Energy Capacity
  • Global Installed Wind Power Capacity By Regions
  • Global Installed Wind Power Capacity By Country
  • Global Onshore and Offshore Wind Energy Capacity, Investment and Installation Cost
  • Global Wind Energy Employment by Region, 2020
  • Occupational Hazards in Wind Energy Industry
  • Accidents in Wind Energy Industry
  • Regulatory Compliance
  • Top 10 Wind Turbine Manufacturers, 2020
  • Key Competitors for Global PPE in Wind Energy Industry
  • Key Growth Metrics for Global PPE in Wind Energy Industry
  • Distribution Channels for Global PPE in Wind Energy Industry
  • Growth Drivers for Global PPE in Wind Energy Industry
  • Growth Restraints for Global PPE in Wind Energy Industry
  • Forecast Assumptions, Global PPE in Wind Energy Industry
  • Revenue Forecast, Global PPE in Wind Energy Industry
  • Revenue Forecast by Product, Global PPE in Wind Energy Industry
  • Revenue Forecast by Region, Global PPE in Wind Energy Industry
  • Revenue Forecast Analysis, Global PPE in Wind Energy Industry
  • Competitive Environment, Global PPE in Wind Energy Industry
  • Competitive Analysis, Global PPE in Wind Energy Industry

3. Growth Opportunity Analysis, Above the Neck Protection

  • Key Growth Metrics for Global PPE in Wind Energy Industry, Above the Neck Protection
  • Revenue Forecast, Global PPE in Wind Energy Industry, Above the Neck Protection
  • Revenue Forecast by Region, Global PPE in Wind Energy Industry, Above the Neck Protection
  • Revenue Forecast Analysis, Global PPE in Wind Energy Industry, Above-the-Neck Protection
  • Competitive Environment, Global PPE in Wind Energy Industry, Above-the-Neck Protection
  • Competitive Analysis, Global PPE in Wind Energy Industry, Above-the-Neck Protection

4. Growth Opportunity Analysis, Respiratory Protection

5. Growth Opportunity Analysis, Protective Clothing

6. Growth Opportunity Analysis, Hand Protection

7. Growth Opportunity Analysis, Foot Protection

8. Growth Opportunity Analysis, Fall Protection

9. Growth Opportunity Universe, Global PPE in Wind Energy Industry

  • Growth Opportunity 1 - Sustained Growth in Wind Energy to Boost Employment and PPE Market
  • Growth Opportunity 2 - Rise in Offshore Wind Farms and Electric Power Grid to Enhance PPE Usage

10. Next Steps

  • Your Next Steps

11. List of Exhibits

For more information about this report visit https://www.researchandmarkets.com/r/3s9yl0


Contacts

ResearchAndMarkets.com
Laura Wood, Senior Press Manager
This email address is being protected from spambots. You need JavaScript enabled to view it.

For E.S.T Office Hours Call 1-917-300-0470
For U.S./CAN Toll Free Call 1-800-526-8630
For GMT Office Hours Call +353-1-416-8900

U.S. pilot expected to begin in 2022

RICHMOND, Va.--(BUSINESS WIRE)--ARKO Corp. (Nasdaq: ARKO) today announced that the Company has signed a strategic memorandum of understanding (MOU) with Chakratec, an Israel-based developer of electric vehicle (EV) charging technology, to distribute the kinetic storage systems for fast charging of electric vehicles.


Chakratec is a developer of kinetic energy storage systems that enable ultra-fast charging of EVs. Chakratec’s technology and products aim to solve the main challenge to mass adoption of EVs – the “Range Anxiety” – by allowing vast deployment of ultra-fast charging points along the roads, capable of charging EVs in less than 15 minutes (to a range of ~150 miles), even in sites where the local grid infrastructure is limited in power.

“The outdated electrical infrastructure in many US states and its inability to support fast charging is a significant barrier to massive penetration of electric vehicles. In fact, I believe the United States is still many years away from mass adoption of electric vehicles and this won’t change until fast charging infrastructure is more widely available,” said Arie Kotler, Chairman, President and Chief Executive Officer of ARKO. “Our partnership with Chakratec is an important first step in our long-term journey toward being ready should the time come for electric vehicles to become mainstream in North America.”

As part of the MOU, ARKO and Chakratec will conduct a preliminary pilot in the U.S. next year. The MOU also includes a goal of an extensive deployment of fast charging points for electric vehicles throughout North America by 2030.

To learn more about ARKO, visit: https://www.arkocorp.com/.

About ARKO:

ARKO owns 100% of GPM Investments, LLC (“GPM”). Based in Richmond, VA, GPM was founded in 2003 with 169 stores and has grown through acquisitions to become the 7th largest convenience store chain in the United States, with approximately 2,950 locations comprised of approximately 1,350 company-operated stores and approximately 1,600 dealer sites to which it supplies fuel, in 33 states and Washington D.C. GPM operates in three segments: retail, which consists of fuel and merchandise sales to retail consumers; wholesale, which supplies fuel to third-party dealers and consignment agents; and GPM Petroleum, which supplies fuel to GPM and its subsidiaries selling fuel (both in the retail and wholesale segments) as well as sub-wholesalers and bulk purchasers.


Contacts

Andrew Petro
Matter on behalf of ARKO
(978) 518-4531
This email address is being protected from spambots. You need JavaScript enabled to view it.

New clean air technology catches and kills COVID-19 and creates healthier buildings in the Philadelphia and South Jersey markets

KING OF PRUSSIA, Pa.--(BUSINESS WIRE)--Tozour Energy Systems announced an exclusive partnership with Integrated Viral Protection (IVP). IVP is the world’s only biodefense system proven to destroy COVID-19 (99.999%) and anthrax spores (99.98%) instantaneously in a single filter pass without impacting the ambient air. IVP is also the only air-cleaning device tested and approved by the FDA.


The agreement positions Tozour as IVP's exclusive representative for eastern Pennsylvania and southern New Jersey. IVP can provide two different types of air-cleaning solutions: portable mobile units and permanently installed systems. The mobile units come in three different sizes and are designed for small venues or school classrooms. These units run on 110v, 15-amp single-phase power. The permanent, duct-mounted units can be field installed and are customizable to be retrofitted for most existing air-handler units. The IVP product can also be designed for new air-handling systems.

The IVP units are quiet and require little or no maintenance. The primary biodefense media needs to be replaced only once every one to two years, depending on usage.

As building owners continue to make indoor air quality (IAQ) a top priority, the newest Tozour solution is improving indoor environmental quality, thus helping employees and students return to businesses and schools safely during the COVID-19 pandemic.

"We're raising the standard for indoor air quality through science," said Dr. Garrett Peel, IVP’s co-founder. "IVP is a biodefense system that kills actual airborne viruses and is proven to be 99.999% effective. This isn't a purification system, but a technology to lead everyone out of this public health crisis."

“IVP is a game changer and allows building owners to get people back to work quickly and, most importantly, safely" said Kevin Duffy, president of Tozour Energy Systems. "IVP's mobile units and permanent duct-mounted systems align with Tozour's Healthy Building's initiative of providing clean, healthy and virus-free air for indoor spaces."

Tozour Healthy Buildings encompasses all aspects of indoor environments, including air quality, filtration, ventilation, thermal health, humidity, lighting and more. The initiative provides advanced solutions, equipment, and controls to help owners and facility and operations managers assess, upgrade and maintain healthy buildings.

ABOUT INTEGRATED VIRAL PROTECTION (IVP)

Integrated Viral Protection (IVP) is a technology solutions company that specializes in the design of biodefense indoor air protection systems. Data from scientific peer-reviewed publications show significant promise for reducing the transmission of the SARS-CoV-2 virus in the air, safeguarding people against the dangerous, life-threatening pathogen. IVP has formed a public-private partnership with a team of renowned scientists, engineers, and virologists and collaborated to develop a promising biodefense indoor air protection system that combats airborne COVID-19 and other pathogens in commercial, transportation, residential and personal environments. For more information, please visit: www.IVPair.com.

ABOUT TOZOUR ENERGY SYSTEMS

Tozour Energy Systems is a full-service HVAC and building automation provider based in King of Prussia, Pennsylvania, and is a franchise of Trane, a business of Trane Technologies. The company provides customers with a diverse range of solutions, including building automation; HVAC mechanical services; energy conservation services; and parts, supplies and responsive technical support throughout Pennsylvania and New Jersey. Named one of the “Best Places to Work” by the Philadelphia Business Journal, Tozour Energy Systems is a member of Green Building United. For more information, visit tozourenergy.com.


Contacts

Jeff Shurilla
For Tozour Energy Systems
215-764-2376 (cell)
This email address is being protected from spambots. You need JavaScript enabled to view it.

Lauren Velasco
For IVP
847-567-4322
This email address is being protected from spambots. You need JavaScript enabled to view it.

Maggie Teson
For IVP
636-222-2927
This email address is being protected from spambots. You need JavaScript enabled to view it.

ATLANTA--(BUSINESS WIRE)--PIC Group Inc., has been awarded the Operation and Maintenance (O&M) Agreement for the Hummel Power Station, a subsidiary of LS Power Group, in Shamokin Dam, PA. The Hummel Station, a 3 X 1 combined cycle facility rated at 1124 MW, is equipped with (3) SGT6-5000F gas turbines, (1) SST6-5000 steam turbine, (3) SGen6-1000A air-cooled generators and (1) hydrogen-cooled SGen6-2000H generator.


“LS Power is excited about our recently acquired Hummel facility and looking forward to working with PIC Group and their experienced operations and maintenance team,” said Anthony Hammond, Vice President of Asset Management for LS Power.

PIC Group’s approach to O&M services ensures consistent and reliable operations while enabling the Hummel Station to achieve the maximum financial and operational goals. “Implementing a culture that instills strict program adherence and continuous operational improvement, enables our customers to generate superior plant performance, higher profits and increased asset value,” said Frank Avery, President and CEO at PIC Group.

PIC Group aligns the activities to be performed with its customers’ goals and objectives using a model that ensures constant visibility of performance versus the objectives. This approach produces results that align with customer objectives of compliance with regulations, facility performance in terms of output, efficiency, availability and reliability as well as commercial management in operating facilities within strict budget compliance with focused attention on maintenance that ensure issues are prevented and costs are minimized.

About PIC Group

Founded in 1988, PIC Group, Inc. is dedicated to delivering value by providing global energy services to facilities across four continents – North America, South America, Asia, and Africa. PIC Group provides O&M Services (Care, Custody and Control), Commissioning and Startup, Documentation & Training and Staffing services and serves the power generation, oil and gas, petrochemical, pulp and paper and manufacturing industries.

PIC Group, Inc. is a wholly owned subsidiary of Marubeni Corporation, a Fortune Global 500 Company. Marubeni is a major Japanese sogo shosha (international trading company) and the third largest global independent power producer (IPP).

(www.picgroupinc.com)

About Marubeni

Marubeni Corporation and its consolidated subsidiaries use their broad business networks, both within Japan and overseas, to conduct importing and exporting (including third country trading), as well as domestic business, encompassing a diverse range of business including consumer products, food, agriculture, chemicals, energy and metals and power business machinery and infrastructure.


Contacts

Douglas Shuda, Marketing Director
678-627-4142
This email address is being protected from spambots. You need JavaScript enabled to view it.

Fourth Quarter and Full Year 2020 Highlights

  • Net loss of $(51.1) million, or $(1.03) per diluted Class A share, for the full year ended December 31, 2020; Adjusted pro forma net loss of $(6.6) million, or $(0.15) per diluted share for the year ended December 31, 2020 (see below for a reconciliation of adjusted pro forma net income to net income attributable to Solaris)
  • Net loss of $(2.8) million, or $(0.06) per diluted Class A share, for the quarter ended December 31, 2020; Adjusted pro forma net loss of $(2.4) million, or $(0.05) per diluted share for the quarter ended December 31, 2020
  • Adjusted EBITDA of $25.6 million and $4.9 million for the year and quarter ended December 31, 2020, respectively
  • Net cash provided by operating activities of $43.9 million and $5.8 million for the year and quarter ended December 31, 2020, respectively
  • Positive free cash flow of $39.2 million and $4.1 million for the year and quarter ended December 31, 2020, respectively
  • Paid a regular quarterly dividend of $0.105 per share on December 7, 2020

HOUSTON--(BUSINESS WIRE)--Solaris Oilfield Infrastructure, Inc. (NYSE:SOI) (“Solaris” or the “Company”), a leading independent provider of supply chain management and logistics solutions designed to drive efficiencies and reduce costs for the oil and natural gas industry, today reported financial results for the fourth quarter and full year 2020.

Operational Update and Outlook

During the fourth quarter 2020, an average of 42 mobile proppant management systems were fully utilized, a 24% increase from the 34 fully utilized systems averaged in the third quarter of 2020, and a 52% decrease compared to fourth quarter 2019. The sequential increase in fully utilized systems during the fourth quarter of 2020 was primarily due to a stronger than expected increase in completions activity and reduced normal seasonal slowdown as compared to prior years. For full year 2020, an average of 45 mobile proppant management systems were fully utilized, representing a 59% decline from the 110 fully utilized systems averaged in 2019.

“2020 was one of the most challenging years this industry has ever faced, and I’m proud of how the Solaris team successfully managed through it. The team reacted swiftly to the changing market, while continuing to generate cash, invest in new technology, and preserve our dividend,” Solaris’ Chairman and Chief Executive Officer Bill Zartler commented. “As we look to 2021, we remain committed to maximizing cash flow, returning cash to shareholders and maintaining our strong balance sheet. We also look forward to sharing some of our latest technology innovations in the coming months as we continue to help our customers drive efficiencies at the well site.”

Full Year 2020 Financial Review

Solaris reported net loss of $(51.1) million, or $(1.03) per diluted Class A share, for full year 2020, compared to full year 2019 net income of $90.4 million, or $1.69 per diluted Class A share. Adjusted pro forma net loss for full year 2020 was $(6.6) million, or $(0.15) per fully diluted share, compared to full year 2019 adjusted pro forma net income of $62.7 million, or $1.32 per fully diluted share. A description of adjusted pro forma net income and a reconciliation to net income attributable to Solaris, its most directly comparable generally accepted accounting principles (“GAAP”) measure, and the computation of adjusted pro forma earnings per fully diluted share are provided below.

Revenues were $103.0 million for full year 2020, which were down 57% from full year 2019.

Adjusted EBITDA for full year 2020 was $25.6 million, compared to full year 2019 Adjusted EBITDA of $113.4 million. A description of Adjusted EBITDA and a reconciliation to net income, its most directly comparable GAAP measure, is provided below.

Fourth Quarter 2020 Financial Review

Solaris reported net loss of $(2.8) million, or $(0.06) per diluted Class A share, for fourth quarter 2020, compared to net loss of $(5.6) million, or $(0.12) per diluted Class A share, in third quarter 2020 and net income of $25.3 million, or $0.48 per diluted Class A share, in fourth quarter 2019. Fourth quarter 2019 included a $17.6 million, or $0.37 per diluted Class A share, benefit for deferred revenue recognition that resulted from a contract termination at the Company’s Kingfisher transload facility. Adjusted pro forma net loss for fourth quarter 2020 was $(2.4) million, or $(0.05) per fully diluted share, compared to adjusted pro forma net loss in third quarter 2020 of $(4.0) million, or $(0.09) per fully diluted share, and adjusted pro forma net income of $9.7 million, or $0.20 per fully diluted share in fourth quarter 2019.

Revenues were $25.3 million for fourth quarter 2020, which were up 23% from third quarter 2020 and down 60% compared to fourth quarter 2019.

Adjusted EBITDA for fourth quarter 2020 was $4.9 million, compared to Adjusted EBITDA of $3.1 million in third quarter 2020, a 55% sequential increase, and compared to $20.9 million in fourth quarter 2019.

Capital Expenditures, Free Cash Flow and Liquidity

Capital expenditures in the fourth quarter 2020 were $1.8 million and for the full year were $4.7 million. The Company expects capital expenditures for the full year 2021 to be between $5.0 and $10.0 million.

Free cash flow (defined as net cash provided by operating activities less investment in property, plant and equipment) during fourth quarter 2020 was $4.1 million, which represented the eighth consecutive quarter of positive free cash flow for the Company. For full year 2020, the Company generated $39.2 million of free cash flow.

As of December 31, 2020, the Company had approximately $60.4 million of cash on the balance sheet, which reflects about $2.09 per fully diluted share of available cash. The Company’s $50.0 million credit facility remains undrawn.

Shareholder Returns

On November 18, 2020, the Company’s Board of Directors declared a cash dividend of $0.105 per share of Class A common stock, which was paid on December 7, 2020 to holders of record as of November 27, 2020. A distribution of $0.105 per unit was also approved for holders of units in Solaris Oilfield Infrastructure, LLC (“Solaris LLC”). Since initiating the dividend in December 2018, the Company has paid 9 consecutive quarterly dividends. Cumulatively, the Company has returned approximately $73 million in cash to shareholders through dividends and share repurchases since December 2018.

Conference Call

The Company will host a conference call to discuss its fourth quarter and full year 2020 results on Monday, February 22, 2021 at 7:30 a.m. Central Time (8:30 a.m. Eastern Time). To join the conference call from within the United States, participants may dial (844) 413-3978. To join the conference call from outside of the United States, participants may dial (412) 317-6594. When instructed, please ask the operator to be joined to the Solaris Oilfield Infrastructure, Inc. call. Participants are encouraged to log in to the webcast or dial in to the conference call approximately ten minutes prior to the start time. To listen via live webcast, please visit the Investor Relations section of the Company’s website at http://www.solarisoilfield.com.

An audio replay of the conference call will be available shortly after the conclusion of the call and will remain available for approximately seven days. It can be accessed by dialing (877) 344-7529 within the United States or (412) 317-0088 outside of the United States. The conference call replay access code is 10151681. The replay will also be available in the Investor Relations section of the Company’s website shortly after the conclusion of the call and will remain available for approximately seven days.

About Solaris Oilfield Infrastructure, Inc.

Solaris Oilfield Infrastructure, Inc. (NYSE:SOI) provides mobile equipment that drives supply chain and execution efficiencies in the completion of oil and natural gas wells. Solaris’ patented mobile proppant and chemical systems are deployed in many of the most active oil and natural gas basins in the United States. Additional information is available on the Solaris website, www.solarisoilfield.com.

Website Disclosure

We use our website (www.solarisoilfield.com) as a routine channel of distribution of company information, including news releases, analyst presentations, and supplemental financial information, as a means of disclosing material non-public information and for complying with our disclosure obligations under the U.S. Securities and Exchange Commission’s (the “SEC”) Regulation FD. Accordingly, investors should monitor our website in addition to following press releases, SEC filings and public conference calls and webcasts. Additionally, we provide notifications of news or announcements on our investor relations website. Investors and others can receive notifications of new information posted on our investor relations website in real time by signing up for email alerts.

None of the information provided on our website, in our press releases, public conference calls and webcasts, or through social media channels is incorporated by reference into, or deemed to be a part of, this Current Report on Form 8-K or will be incorporated by reference into any other report or document we file with the SEC unless we expressly incorporate any such information by reference, and any references to our website are intended to be inactive textual references only.

Forward Looking Statements

This press release contains forward-looking statements within the meaning of Section 27A of the Securities Act of 1933, as amended and Section 21E of the Securities Exchange Act of 1934, as amended. Examples of forward-looking statements include, but are not limited to, our business strategy, our industry, our future profitability, the various risks and uncertainties associated with the extraordinary market environment and impacts resulting from the volatility in global oil markets and the COVID-19 pandemic, expected capital expenditures and the impact of such expenditures on performance, management changes, current and potential future long-term contracts and our future business and financial performance. Forward-looking statements are based on our current expectations and assumptions regarding our business, the economy and other future conditions. Because forward-looking statements relate to the future, by their nature, they are subject to inherent uncertainties, risks and changes in circumstances that are difficult to predict. As a result, our actual results may differ materially from those contemplated by the forward-looking statements. Factors that could cause our actual results to differ materially from the results contemplated by such forward-looking statements include, but are not limited to the factors discussed or referenced in our filings made from time to time with the SEC. Readers are cautioned not to place undue reliance on forward-looking statements, which speak only as of the date hereof. Factors or events that could cause our actual results to differ may emerge from time to time, and it is not possible for us to predict all of them. We undertake no obligation to publicly update or revise any forward-looking statement, whether as a result of new information, future developments or otherwise, except as may be required by law.

SOLARIS OILFIELD INFRASTRUCTURE, INC AND SUBSIDIARIES

CONSOLIDATED STATEMENTS OF OPERATIONS

(In thousands, except per share data)

(Unaudited)


Three Months Ended


Year Ended


December 31,


September 30,


December 31,


2020


2019


2020


2020


2019

Revenue


System rental


$

11,451


$

28,296


$

9,197


$

52,171


$

142,022


System services


13,394


15,250


10,855


48,625


63,871


Transloading services


211


18,974


310


1,250


34,105


Inventory software services


220


338


169


930


1,689


Total revenue


25,276


62,858


20,531


102,976


241,687


Operating costs and expenses


Cost of system rental (excluding depreciation and amortization)


1,483


1,970


1,181


5,501


9,707


Cost of system services (excluding depreciation and amortization)


15,498


18,383


13,126


58,767


74,749


Cost of transloading services (excluding depreciation and amortization)


257


550


243


1,040


2,601


Cost of inventory software services (excluding depreciation and amortization)


92


144


97


456


604


Depreciation and amortization


6,643


7,050


6,594


27,021


26,925


Selling, general and administrative (excluding depreciation and amortization)


4,269


4,619


3,840


16,481


18,586


Impairment loss


47,828


Other operating expenses (1)


453


56


1,856


5,782


585


Total operating costs and expenses


28,695


32,772


26,937


162,876


133,757


Operating income (loss)


(3,419

)


30,086


(6,406

)


(59,900

)


107,930


Interest income (expense), net


(198

)


141


(40

)


(162

)


(634

)

Total other income (expense)


(198

)


141


(40

)


(162

)


(634

)

Income (loss) before income tax expense


(3,617

)


30,227


(6,446

)


(60,062

)


107,296


Provision (benefit) for income taxes


(776

)


4,894


(843

)


(8,969

)


16,936


Net income (loss)


(2,841

)


25,333


(5,603

)


(51,093

)


90,360


Less: net (income) loss related to non-controlling interests


1,405


(10,317

)


2,320


21,752


(38,353

)

Net income (loss) attributable to Solaris


$

(1,436

)


$

15,016


$

(3,283

)


$

(29,341

)


$

52,007


Earnings per share of Class A common stock - basic


$

(0.06

)


$

0.48


$

(0.12

)


$

(1.03

)


$

1.69


Earnings per share of Class A common stock - diluted


$

(0.06

)


$

0.48


$

(0.12

)


$

(1.03

)


$

1.69


Basic weighted average shares of Class A common stock outstanding


28,944


30,933


28,787


28,915


30,141


Diluted weighted average shares of Class A common stock outstanding


28,944


30,961


28,787


28,915


30,185


1)

Other operating expenses are primarily related to credit losses, loss on sale of assets and costs associated with workforce reductions.

SOLARIS OILFIELD INFRASTRUCTURE, INC AND SUBSIDIARIES

CONSOLIDATED BALANCE SHEETS

(In thousands, except per share amounts)

(Unaudited)


December 31,


December 31,


2020


2019

Assets


Current assets:


Cash and cash equivalents


$

60,366


$

66,882


Accounts receivable, net of allowances for credit losses of $1,099 and $339 as of December 31, 2020 and 2019, respectively


18,243


38,554


Prepaid expenses and other current assets


2,169


5,002


Inventories


954


7,144


Total current assets


81,732


117,582


Property, plant and equipment, net


245,884


306,583


Non-current inventories


3,318


Operating lease right-of-use assets


4,708


7,871


Goodwill


13,004


17,236


Intangible assets, net


2,982


3,761


Deferred tax assets


59,805


51,414


Other assets


463


625


Total assets


$

411,896


$

505,072


Liabilities and Stockholders' Equity


Current liabilities:


Accounts payable


$

6,863


$

3,824


Accrued liabilities


11,986


14,447


Current portion of payables related to Tax Receivable Agreement


606


1,416


Current portion of lease liabilities


677


626


Other current liabilities


75


74


Total current liabilities


20,207


20,387


Lease liabilities, net of current


7,519


7,985


Payables related to Tax Receivable Agreement


68,097


66,582


Other long-term liabilities


594


460


Total liabilities


96,417


95,414


Stockholders' equity:


Preferred stock, $0.01 par value, 50,000 shares authorized, none issued and outstanding


Class A common stock, $0.01 par value, 600,000 shares authorized and 28,943 shares issued and outstanding as of December 31, 2020 and 30,928 issued and 30,765 outstanding as of December 31, 2019


290


308


Class B common stock, $0.00 par value, 180,000 shares authorized, 15,685 shares issued and outstanding as of December 31, 2020 and 15,939 issued and outstanding as of December 31, 2019


Additional paid-in capital


180,415


191,843


Retained earnings


20,549


74,222


Treasury stock (at cost), 0 and 163 shares as of December 31, 2020 and 2019, respectively


(2,526

)

Total stockholders' equity attributable to Solaris and members' equity


201,254


263,847


Non-controlling interest


114,225


145,811


Total stockholders' equity


315,479


409,658


Total liabilities and stockholders' equity


$

411,896


$

505,072


SOLARIS OILFIELD INFRASTRUCTURE, INC AND SUBSIDIARIES

CONSOLIDATED STATEMENTS OF CASH FLOWS

(In thousands)

(Unaudited)


Year Ended
December 31,


Three Months
Ended
December 31,


2020


2019


2020

Cash flows from operating activities:


Net (loss) income


$

(51,093

)


$

90,360


$

(2,841

)

Adjustment to reconcile net (loss) income to net cash provided by operating activities:


Depreciation and amortization


27,021


26,925


6,643


Impairment loss


47,828


Loss on disposal of asset


1,428


261


(11

)

Stock-based compensation


4,735


4,475


1,003


Amortization of debt issuance costs


176


753


44


Allowance for credit losses


2,910


339


30


Write-off of deposit


202


Deferred income tax expense


(9,153

)


16,122


(854

)

Other


(193

)


(150

)


(42

)

Changes in assets and liabilities:


Accounts receivable


17,400


853


(230

)

Prepaid expenses and other assets


2,423


2,332


547


Inventories


(235

)


(2,744

)


124


Accounts payable


3,051


(3,582

)


(2,194

)

Accrued liabilities


(2,445

)


4,183


3,624


Deferred revenue


(25,458

)


Net cash provided by operating activities


43,853


114,871


5,843


Cash flows from investing activities:


Investment in property, plant and equipment


(4,661

)


(34,852

)


(1,760

)

Cash received from insurance proceeds


100


618


47


Proceeds from disposal of assets


786


232


62


Net cash used in investing activities


(3,775

)


(34,002

)


(1,651

)

Cash flows from financing activities:


Distribution and dividend paid to Solaris LLC unitholders and Class A common shareholders


(19,026

)


(19,260

)


(4,759

)

Share repurchases


(26,717

)


(3,249

)


Payments under finance leases


(35

)


(35

)


(11

)

Payments under insurance premium financing


(2,485

)


Proceeds from stock option exercises


64


294


Payments for shares withheld for taxes from RSU vesting and cancelled


(276

)


Payments related to purchase of treasury stock


(454

)


(1,112

)


Payments related to debt issuance costs


(13,000

)


Repayment of senior secured credit facility


(197

)


Distribution to Solaris LLC unitholders for income tax withholding


(150

)


Net cash used in financing activities


(46,594

)


(39,044

)


(4,770

)

Net (decrease) increase in cash and cash equivalents


(6,516

)


41,825


(578

)

Cash and cash equivalents at beginning of period


66,882


25,057


60,944


Cash and cash equivalents at end of period


$

60,366


$

66,882


$

60,366


Non-cash activities


Investing:


Capitalized depreciation in property, plant and equipment


$

613


$

735


$

254


Capitalized stock based compensation


255


189


57


Property and equipment additions incurred but not paid at period-end


172


82


160


Property, plant and equipment additions transferred from inventory


358


5,882


(1

)

Financing:


Insurance premium financing


1,869


Cash paid for:


Interest


282


275


183


Income taxes


796


663


SOLARIS OILFIELD INFRASTRUCTURE, INC AND SUBSIDIARIES

RECONCILIATION OF GAAP TO NON-GAAP FINANCIAL INFORMATION — ADJUSTED EBITDA

(In thousands)

(Unaudited)

We view EBITDA and Adjusted EBITDA as important indicators of performance. We define EBITDA as net income, plus (i) depreciation and amortization expense, (ii) interest expense and (iii) income tax expense, including franchise taxes. We define Adjusted EBITDA as EBITDA plus (i) stock-based compensation expense and (ii) certain non-cash items and extraordinary, unusual or non-recurring gains, losses or expenses.

We believe that our presentation of EBITDA and Adjusted EBITDA provides useful information to investors in assessing our financial condition and results of operations. Net income is the GAAP measure most directly comparable to EBITDA and Adjusted EBITDA. EBITDA and Adjusted EBITDA should not be considered alternatives to net income presented in accordance with GAAP. Because EBITDA and Adjusted EBITDA may be defined differently by other companies in our industry, our definitions of EBITDA and Adjusted EBITDA may not be comparable to similarly titled measures of other companies, thereby diminishing their utility. The following table presents a reconciliation of net income to EBITDA and Adjusted EBITDA for each of the periods indicated.


Three months ended


Year ended


December 31,


September 30,


December 31,


2020


2019


2020


2020


2019


Net income (loss)


$

(2,841

)


$

25,333


$

(5,603

)


$

(51,093

)


$

90,360


Depreciation and amortization


6,643


7,050


6,594


27,021


26,925


Interest (income) expense, net


198


(141

)


40


162


634


Income taxes (1)


(776

)


4,894


(843

)


(8,969

)


16,936


EBITDA


$

3,224


$

37,136


$

188


$

(32,879

)


$

134,855


Stock-based compensation expense (2)


1,003


1,213


1,077


4,735


4,476


Loss on disposal of assets


(23

)


80


38


1,428


463


Impairment loss


47,828


Severance expense


5


75


3


547


229


Credit losses


30


1,246


2,728


Other write-offs (3)


12


586


601


528


Transaction costs (4)


603


603


Transload contract termination (5)


(17,630

)


(27,138

)

Adjusted EBITDA


$

4,854


$

20,874


$

3,138


$

25,591


$

113,413


______________________

1)

Federal and state income taxes.

2)

Represents stock-based compensation expense related to restricted stock awards.

3)

Write-off of certain prepaid and cancelled purchase orders in the three months and year ended December 31, 2020 and unamortized debt issuance costs in the year ended December 31, 2019 when the Amended and Restated Credit Agreement, dated as of January 19, 2018, was replaced in its entirety by the 2019 Credit Agreement.

4)

Costs related to the pursuit of acquisitions.

5)

Deferred revenue related to full termination of a sand storage and transloading agreement.

SOLARIS OILFIELD INFRASTRUCTURE, INC AND SUBSIDIARIES

RECONCILIATION OF GAAP TO NON-GAAP FINANCIAL INFORMATION — ADJUSTED PRO FORMA NET INCOME
AND ADJUSTED PRO FORMA EARNINGS PER FULLY DILUTED SHARE

(In thousands)

(Unaudited)

Adjusted pro forma net income represents net income attributable to Solaris assuming the full exchange of all outstanding membership interests in Solaris LLC not held by Solaris Oilfield Infrastructure, Inc. for shares of Class A common stock, adjusted for certain non-recurring items that the Company doesn't believe directly reflect its core operations and may not be indicative of ongoing business operations. Adjusted pro forma earnings per fully diluted share is calculated by dividing adjusted pro forma net income by the weighted-average shares of Class A common stock outstanding, assuming the full exchange of all outstanding units of Solaris LLC (“Solaris LLC Units”), after giving effect to the dilutive effect of outstanding equity-based awards.


Contacts

Yvonne Fletcher
Senior Vice President, Finance and Investor Relations
(281) 501-3070
This email address is being protected from spambots. You need JavaScript enabled to view it.


Read full story here

PLANO, Texas--(BUSINESS WIRE)--ReadyH2 is pleased to announce via their partnership with Doosan Mobility Innovation (DMI), an extended offering of United States Department of Transportation (DoT) approved hydrogen compressed gas tanks for wider use and distribution (United States and Canada). DMI was one of the first companies to receive such approval from the U.S. DoT.


ReadyH2 currently serves as the premier partner for all DMI’s customer and dealer hydrogen tank and fuel needs. This new expansion opens the door for new business opportunities and new companies in search of a premier partner for their own carbon-fiber, compressed hydrogen tank and fuel needs.

The U.S. DoT certified hydrogen tanks can be rented based on customer needs and are applicable for all compressed hydrogen gas applications.

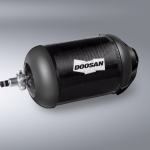
DMI’s hydrogen tanks are manufactured of carbon-fiber composite and lined with a high-density polymer liner. The tanks hold up to 350 bars of working pressure and measure 225 mm (8.86 inches) x 435 mm (17.13 inches). They are DoT certified, lightweight, reliable, and safe.

Per the Office of Energy Efficiency & Renewable Energy, “Hydrogen storage is key to enabling technology for the advancement of hydrogen and fuel cell technologies in applications including stationary power, portable power, and transportation.” The ReadyH2 and DMI hydrogen tank solution is uniquely equipped to be at the forefront of this momentous movement.

Brendon Mills, CEO of ReadyH2, states, “This expansion allows our team to better serve more customers in need of hydrogen compressed gas tanks and refueling services. Enabling the use of the tanks beyond just hydrogen fuel cell drones helps the adoption of hydrogen fuel technology applications across the U.S. Our team is ready to tackle the hydrogen fuel needs of these new hydrogen applications.”

The abundance of hydrogen use cases is astounding. Including but not limited to the following technologies:

- Unmanned aerial vehicle (UAV)
- Robotics
- Vehicle & automotive transportation
- Transit bus & rail transportation
- Supply chain and logistics material handling
- Conversion of gas-powered engines to hydrogen-powered engines
- Stationary power & reliable backup power

Hydrogen fuel cell solutions provide large benefits over current solutions such as improved efficiency, lower operational costs, a zero-emissions performance, a safer/renewable energy, and robust reliability.

According to Doosoon Lee, CEO of Doosan Mobility Innovation, “This is the next step towards unlocking the door into hydrogen mobility industries. This service enables hydrogen fueled products, like our drone solution, to be widely used across the U.S.”

GeoCue, one of the first ReadyH2 customers since expansion, offers fast and easy software, hardware, training, support and consulting services for LIDAR mapping, including production and exploitation, and drone mapping, including data collection, processing and management. ReadyH2 successfully delivered charged and DoT-approved hydrogen fuel tanks from Dallas, TX to GeoCue headquarters in Huntsville, AL, to help GeoCue meet their hydrogen needs.

Lewis Graham, President and CTO of GeoCue stated, “Working with ReadyH2 was quick and very easy. I would definitely recommend their services to any company looking for a new hydrogen fuel provider and look forward to working with them again.”

This expansion is another step forward in the path of many to substantially replacing current power solutions with hydrogen – a cleaner, more flexible energy carrier.

To inquire more regarding hydrogen tank use cases or distribution opportunities, please visit ReadyH2 or reach out directly by calling (833)952-0903.

About ReadyH2

ReadyH2 is a subsidiary of Fortress Solutions and Fortress UAV and supports a compressed hydrogen gas distribution network currently for Doosan Mobility Innovations customers and dealers.

Stay Connected with ReadyH2:

Twitter | Facebook | LinkedIn

All product names, logos, and brands are property of their respective owners. All company, product and service names used in this website are for identification purposes only. Use of these names, logos, and brands does not imply endorsement.


Contacts

Media Contact
Morgan Brown
This email address is being protected from spambots. You need JavaScript enabled to view it.
214.453.5600

THE WOODLANDS, Texas--(BUSINESS WIRE)--Epsilyte, a leading North American producer of Expandable Polystyrene (EPS), will increase the price of all grades of EPS by an additional $0.12/lb., effective March 1, 2021 or as contracts permit. This adjustment is in addition to the previously announced price increase of $0.05/lb. effective March 1, 2021, for a total of $0.17/lb. increase for all grades. This additional adjustment is necessary to keep pace with rapidly escalating feedstock costs.


About Epsilyte

Epsilyte is one of North America’s leading producers of expandable polystyrene resin. We are a company of scale focused on solving customer needs for efficient, high-R value EPS. This includes reducing energy usage in buildings, ensuring safe and healthy food through innovative packaging technology, and participating in infrastructure investment both in the United States and abroad. Epsilyte is a portfolio company of Balmoral Funds LLC.


Contacts

Epsilyte Contact:
Todd Galliart
Business Manager
Cell: 409-422-5903
This email address is being protected from spambots. You need JavaScript enabled to view it.

  • Arcturus UAV’s complementary capabilities provide program diversification, increase key customer penetration and enhance shareholder value
  • Transaction adds leading medium Unmanned Aircraft Systems to AeroVironment’s portfolio of intelligent, multi-domain robotic systems
  • Vertical takeoff and landing (VTOL) JUMP 20 unmanned aircraft system delivers reliable, multi-mission capabilities without launchers or runways to USSOCOM and other customers

SIMI VALLEY, Calif.--(BUSINESS WIRE)--$AVAV--AeroVironment, Inc. (NASDAQ: AVAV), a global leader in unmanned aircraft systems, today announced it had completed its acquisition of Arcturus UAV, Inc. a leading designer and manufacturer of high-performance unmanned aircraft systems (UAS). The approximately $405 million transaction was previously announced in a press release on January 13, 2021.


The United States Special Operations Command (USSOCOM) selected Arcturus UAV as one of six companies qualified for the potential $975 million indefinite-delivery/indefinite-quantity MEUAS IV contract in June 2020. The contract enables awardees to compete for site-specific task orders and provide USSOCOM with unmanned aircraft systems services and support for intelligence, surveillance and reconnaissance (ISR) operations. Arcturus UAV employs its VTOL JUMP 20 in support of USSOCOM operations, minimizing the logistical footprint of UAS operations while delivering multi-payload, multi-mission capabilities. Arcturus UAV is also one of four awardees selected for funded development and demonstrations supporting the U.S. Army’s FTUAS program, a potential billion dollar, and next-generation UAS program.

“Like AeroVironment, the Arcturus UAV team is laser-focused on supporting its customers around the world with the most reliable and effective products and services for their missions,” said Wahid Nawabi, president and chief executive officer. “As we welcome the Arcturus UAV team to AeroVironment, we commit to maintaining or exceeding the high level of service our existing and new customers experience. The JUMP 20 and T-20 platforms, combined with associated ISR services, represent a significant expansion to AeroVironment’s portfolio of intelligent, multi-domain robotic systems that will enhance long-term shareholder value and help our customers around the world Proceed with Certainty.”

AeroVironment completed the acquisition of Arcturus UAV on February 19, 2021, resulting in Arcturus UAV becoming a wholly-owned subsidiary operating under the AeroVironment brand.

ABOUT AEROVIRONMENT UNMANNED AIRCRAFT SOLUTIONS

AeroVironment’s portfolio of intelligent, multi-domain robotic systems includes small footprint, runway-independent unmanned aircraft systems. The JUMP 20, T-20 and Puma™ LE provide extended range, multi-payload capabilities, and the RQ-20A/B Puma™, RQ-11B Raven®, RQ-12A Wasp®, VAPOR® Helicopter and automated Quantix™ Recon deliver highly tactical, frontline situational awareness. These solutions deliver increased, multi-mission capabilities and the option of selecting the appropriate aircraft based on the type of mission to be performed. These capabilities have the potential to provide significant force protection and force multiplication benefits to small tactical units and security personnel, as well as greater safety, scalability and cost-savings to commercial operators. AeroVironment provides turnkey ISR and support services worldwide to ensure a consistently high level of mission success. AeroVironment has delivered tens of thousands of new and replacement unmanned air vehicles to customers within the United States and to more than 50 allied governments. For more information visit https://www.avinc.com/uas.

ABOUT AEROVIRONMENT, INC.

AeroVironment (NASDAQ: AVAV) provides technology solutions at the intersection of robotics, sensors, software analytics and connectivity that deliver more actionable intelligence so you can Proceed with Certainty. Celebrating 50 years of innovation, AeroVironment is a global leader in unmanned aircraft systems and tactical missile systems, and serves defense, government and commercial customers. For more information, visit www.avinc.com.

SAFE HARBOR STATEMENT

Certain statements in this press release may constitute “forward-looking statements” as that term is defined in the Private Securities Litigation Reform Act of 1995. These statements are made on the basis of current expectations, forecasts and assumptions that involve risks and uncertainties, including, but not limited to, economic, competitive, governmental and technological factors outside of our control, that may cause our business, strategy or actual results to differ materially from those expressed or implied. Factors that could cause actual results to differ materially from the forward-looking statements include, but are not limited to, our ability to successfully achieve the anticipated benefits of the acquisition of Arcturus UAV, including by retaining key employees and customers of Arcturus UAV; the risk that disruptions will occur from acquisitions that will harm our business or any acquired businesses; any disruptions or threatened disruptions to our relationships with our distributors, suppliers, customers and employees; the ability to timely and sufficiently integrate acquired operations into our ongoing business and compliance programs, including the expansion of international aspects; our ability to perform under existing contracts and obtain additional contracts; changes in the regulatory environment; the activities of competitors; failure of the markets in which we operate to grow; failure to expand into new markets; failure to develop new products or integrate new technology with current products; and general economic and business conditions in the United States and elsewhere in the world. For a further list and description of such risks and uncertainties, see the reports we file with the Securities and Exchange Commission. We do not intend, and undertake no obligation, to update any forward-looking statements, whether as a result of new information, future events or otherwise.


Contacts

AeroVironment, Inc.
Makayla Thomas
+1 (805) 520-8350
This email address is being protected from spambots. You need JavaScript enabled to view it.

ORANGE, Conn.--(BUSINESS WIRE)--AVANGRID, Inc. (NYSE: AGR), a leading sustainable energy company, provided the following statement:


The extreme cold weather in Texas has been unprecedented, resulting in outages impacting millions in the state. Despite this challenge, our team has worked safely and relentlessly to operate our Texas wind generation facilities to their maximum potential given the difficult conditions. Through our proactive and prudent risk management, we have met all of our delivery obligations in Texas and produced excess energy, contributing to the solution for Texas and for customers during this critical period. We appreciate the extra efforts by our employees as they worked in these challenging conditions to maximize the output of our wind facilities in the state, to serve our customers and help mitigate weather-related supply constraints.

About AVANGRID: AVANGRID, Inc. (NYSE: AGR) is a leading, sustainable energy company with approximately $38 billion in assets and operations in 24 U.S. states. With headquarters in Orange, Connecticut, AVANGRID has two primary lines of business: Avangrid Networks and Avangrid Renewables. Avangrid Networks owns eight electric and natural gas utilities, serving more than 3.3 million customers in New York and New England. Avangrid Renewables owns and operates a portfolio of renewable energy generation facilities across the United States. AVANGRID employs approximately 6,600 people. AVANGRID supports the U.N.’s Sustainable Development Goals and was named among the World’s Most Ethical Companies in 2019 and 2020 by the Ethisphere Institute. For more information, visit www.avangrid.com.

Forward Looking Statements

Certain statements in this presentation may relate to our future business and financial performance and future events or developments involving us and our subsidiaries that are not purely historical and may constitute “forward-looking statements” within the meaning of the Private Securities Litigation Reform Act of 1995. Forward-looking statements may be identified by the use of forward-looking terms such as “may,” “will,” “should,” “would,” “could,” “can,” “expect(s),” “believe(s),” “anticipate(s),” “intend(s),” “plan(s),” “estimate(s),” “project(s),” “assume(s),” “guide(s),” “target(s),” “forecast(s),” “are (is) confident that” and “seek(s)” or the negative of such terms or other variations on such terms or comparable terminology. Such forward-looking statements include, but are not limited to, statements about our plans, objectives and intentions, outlooks or expectations for earnings, revenues, expenses or other future financial or business performance, strategies or expectations, or the impact of legal or regulatory matters on business, results of operations or financial condition of the business and other statements that are not historical facts. Such statements are based upon the current reasonable beliefs, expectations, and assumptions of our management and are subject to significant risks and uncertainties that could cause actual outcomes and results to differ materially. Important factors are discussed and should be reviewed in our Form 10-K and other subsequent filings with the SEC. Specifically, forward-looking statements include, without limitation:

  • the future financial performance, anticipated liquidity and capital expenditures;
  • actions or inactions of local, state or federal regulatory agencies;
  • success in retaining or recruiting our officers, key employees or directors;
  • changes in levels or timing of capital expenditures;
  • adverse developments in general market, business, economic, labor, regulatory and political conditions;
  • fluctuations in weather patterns;
  • technological developments;
  • the impact of any cyber breaches or other incidents, grid disturbances, acts of war or terrorism, civil or social unrest, natural disasters, pandemic health events or other similar occurrences;
  • the impact of any change to applicable laws and regulations affecting operations, including those relating to the environment and climate change, taxes, price controls, regulatory approval and permitting;
  • our ability to close the proposed merger with PNM Resources, the anticipated timing and terms of the proposed merge;,
  • our ability to realize the anticipated benefits of the proposed merger with PNM Resources and our ability to manage the risks of the proposed merger;
  • the COVID-19 pandemic and its impact on business and economic conditions;
  • the implementation of changes in accounting standards; and
  • other presently unknown unforeseen factors.

Should one or more of these risks or uncertainties materialize, or should any of the underlying assumptions prove incorrect, actual results may vary in material respects from those expressed or implied by these forward-looking statements. You should not place undue reliance on these forward-looking statements. We do not undertake any obligation to update or revise any forward-looking statements to reflect events or circumstances after the date of this report, whether as a result of new information, future events or otherwise, except as may be required under applicable securities laws. Other risk factors are detailed from time to time in our reports filed with the SEC, and we encourage you to consult such disclosures.

Investors and others should note that AVANGRID routinely posts important information on its website and considers the Investor Relations section, www.avangrid.com/wps/portal/avangrid/Investors,a channel of distribution.


Contacts

Media: Zsoka McDonald, This email address is being protected from spambots. You need JavaScript enabled to view it., 203-997-6892
Analysts: Patricia Cosgel, This email address is being protected from spambots. You need JavaScript enabled to view it., 203-499-2624

BOSTON, Mass.--(BUSINESS WIRE)--Advent Technologies Holdings, Inc. (NASDAQ: ADN) (“Advent”), an innovation-driven company in the fuel cell and hydrogen technology space, announced today that Advent will be presenting virtually at the following upcoming conferences.


BTIG Energy Transition EV Day
Date:
Tuesday, February 23, 2021
Presentation Time: 9:30 AM ET / 3:30 PM CET

2nd World Hydrogen Summit
Date:
Wednesday, March 10, 2021
Presentation Time: 3:15 AM ET / 9:15 AM CET

About Advent Technologies Holdings, Inc.

Advent Technologies Holdings, Inc. is an innovation-driven company in the fuel cell and hydrogen technology space. Our vision is to accelerate electrification through advanced materials, components, and next-generation fuel cell technology. Our technology applies to electrification (fuel cells) and energy storage (flow batteries, hydrogen production) markets, which we commercialize through partnerships with Tier1s, OEMs, and System Integrators. For more information on Advent Technologies Holdings, Inc., please visit the company’s website at https://www.advent.energy/

Forward-Looking Statements

This press release includes forward-looking statements. These forward-looking statements generally can be identified by the use of words such as “anticipate,” “expect,” “plan,” “could,” “may,” “will,” “believe,” “estimate,” “forecast,” “goal,” “project,” and other words of similar meaning. These forward-looking statements address various matters including Advent’s acquisition of UltraCell and the impact of such acquisition on Advent including, among others, statements concerning the potential benefits, strategic plans and business expectations associated with the acquisition. Each forward-looking statement contained in this press release is subject to risks and uncertainties that could cause actual results to differ materially from those expressed or implied by such statement. Applicable risks and uncertainties include, among others, the successful execution of the plans described in this press release; and the risks identified under the heading "Risk Factors" in the definitive proxy statement / prospectus included in the Registration Statement on Form S-4 filed with the SEC on January 20, 2021, as well as the other information we file with the SEC. We caution investors not to place considerable reliance on the forward-looking statements contained in this press release. You are encouraged to read our filings with the SEC, available at www.sec.gov, for a discussion of these and other risks and uncertainties. The forward-looking statements in this press release speak only as of the date of this press release, and we undertake no obligation to update or revise any of these statements. Our business is subject to substantial risks and uncertainties, including those referenced above. Investors, potential investors, and others should give careful consideration to these risks and uncertainties.


Contacts

Sloane & Company
Joe Germani / Alex Kovtun / James Goldfarb
This email address is being protected from spambots. You need JavaScript enabled to view it. / This email address is being protected from spambots. You need JavaScript enabled to view it. / This email address is being protected from spambots. You need JavaScript enabled to view it.

SAN JOSE, Calif.--(BUSINESS WIRE)--Bloom Energy (NYSE: BE) will present at the following virtual events for the financial community.


Baird’s 2021 Sustainability Conference
Tuesday, February 23, 2021

Credit Suisse 26th Annual Energy Summit
Monday, March 1, 2021

Morgan Stanley Energy & Power Conference
Tuesday, March 2, 2021

Raymond James 42nd Annual Institutional Investors Conference
Wednesday, March 3, 2021

Canaccord Genuity’s Sustainability – Rethinking Impact 2021 Conference
Thursday, March 4, 2021

About Bloom Energy

Bloom Energy’s mission is to make clean, reliable energy affordable for everyone in the world. The company’s product, the Bloom Energy Server, delivers highly reliable and resilient, always-on electric power that is clean, cost-effective, and ideal for microgrid applications. Bloom’s customers include many Fortune 100 companies and leaders in manufacturing, data centers, healthcare, retail, higher education, utilities, and other industries. For more information, visit www.bloomenergy.com.


Contacts

Investor Relations:
This email address is being protected from spambots. You need JavaScript enabled to view it.

Media Relations:
Jennifer Duffourg
Bloom Energy
+1 (480) 341-5464
This email address is being protected from spambots. You need JavaScript enabled to view it.

NEW YORK & OSLO, Norway--(BUSINESS WIRE)--$ALUS--FREYR AS announced today that the company's Chief Executive Officer, Tom Einar Jensen, will attend the BTIG Energy Transition EV Day conference on Tuesday, February 23, 2021.

For more information about the conference go to www.btig.com/news.

On 29 January 2021 FREYR announced that it will become a publicly listed company through a business combination with Alussa Energy Acquisition Corp., raising $850 million in equity proceeds to accelerate the development of clean battery cell manufacturing capacity in Norway. Subject to closing conditions being met, the combined company will be named “FREYR Battery” and its common stock is expected to start trading on the New York Stock Exchange under the ticker symbol FREY upon closing, expected in the second quarter of 2021.

About FREYR AS

FREYR plans to develop up to 43 GWh of battery cell production capacity by 2025 to position the company as one of Europe’s largest battery cell suppliers. The facilities will be located in the Mo i Rana industrial complex in Northern Norway, leveraging Norway’s highly skilled workforce and abundant, low-cost renewable energy sources from hydro and wind in a crisp, clear and energized environment. FREYR will supply safe, high energy density and cost competitive clean battery cells to the rapidly growing global markets for electric vehicles, energy storage, and marine applications. FREYR is committed to supporting cluster-based R&D initiatives and the development of an international ecosystem of scientific, commercial, and financial stakeholders to support the expansion of the battery value chain in our region. For more information, please visit www.freyrbattery.com.

Forward-looking statements

The information in this press release includes forward-looking statements and information based on management’s expectations as of the date of this press release. All statements other than statements of historical facts, including statements regarding FREYR’s business strategy, anticipated business combination with Alussa Energy (the “Transaction”) and the terms of such combination, anticipated benefits of FREYR’s technologies and projected production capacity are forward-looking statements. The words “may,” will,” “expect,” “plan,” “target,” or similar terminology are intended to identify forward-looking statements, although not all forward-looking statements contain these identifying words. FREYR may not actually achieve the plans or expectations disclosed in these forward-looking statements, and you should not place undue reliance on these forward-looking statements. Factors that may cause actual results to differ materially from current expectations, include FREYR’s ability to execute on its business strategy and develop and increase production capacity in a cost-effective manner; changes adversely affecting the battery industry; the further development and success of competing technologies; the failure of 24M technology or FREYR’s batteries to perform as expected; and our ability to complete the business combination with Alussa Energy on the terms that we currently expect or at all.

No Offer or Solicitation

This press release is for informational purposes only and shall not constitute an offer to sell or the solicitation of an offer to buy any securities pursuant to the Transaction or otherwise, nor shall there be any sale of securities in any jurisdiction in which the offer, solicitation or sale would be unlawful prior to the registration or qualification under the securities laws of any such jurisdiction. No offer of securities shall be made except by means of a prospectus meeting the requirements of Section 10 of the Securities Act of 1933, as amended.

No Assurances

There can be no assurance that the Transaction will be completed, nor can there be any assurance, if the Transaction is completed, that the potential benefits of combining the companies will be realized.

Important Information about the Transaction and Where to Find It

In connection with the Transaction, Alussa Energy and Pubco will file relevant materials with the SEC, including a Form S-4 registration statement to be filed by Pubco (the “S-4”), which will include a prospectus with respect to Pubco’s securities to be issued in connection with the proposed business combination and a proxy statement (the “Proxy Statement”) with respect to Alussa Energy’s shareholder meeting at which Alussa Energy’s shareholders will be asked to vote on the proposed Business Combination and related matters. ALUSSA ENERGY SHAREHOLDERS AND OTHER INTERESTED PERSONS ARE ADVISED TO READ, WHEN AVAILABLE, THE S-4 AND THE AMENDMENTS THERETO AND OTHER INFORMATION FILED WITH THE SEC IN CONNECTION WITH THE TRANSACTION, AS THESE MATERIALS WILL CONTAIN IMPORTANT INFORMATION ABOUT ALUSSA ENERGY, PUBCO, FREYR AND THE TRANSACTION. When available, the Proxy Statement contained in the S-4 and other relevant materials for the Transaction will be mailed to shareholders of Alussa Energy as of a record date to be established for voting on the proposed business combination and related matters. The preliminary S-4 and Proxy Statement, the final S-4 and definitive Proxy Statement and other relevant materials in connection with the Transaction (when they become available), and any other documents filed by Alussa Energy with the SEC, may be obtained free of charge at the SEC’s website (www.sec.gov) or by writing to Alussa Energy Acquisition Corp. at c/o PO Box 500, 71 Fort Street, Grand Cayman KY1-1106, Cayman Islands.


Contacts

Steffen Føreid, Chief Financial Officer, This email address is being protected from spambots. You need JavaScript enabled to view it.
Harald Bjørland, IR adviser, This email address is being protected from spambots. You need JavaScript enabled to view it.

HOUSTON--(BUSINESS WIRE)--Permianville Royalty Trust (NYSE: PVL, the “Trust”) today announced the net profits interest calculation for February 2021. The net profits interest calculation represents reported oil production for the month of November 2020 and reported natural gas production during October 2020. The calculation includes accrued costs incurred in December 2020.

This month, excluding prior net profits interest shortfalls, income from the distributable net profits interest would have been approximately $0.1 million. As a result of the cumulative outstanding net profits shortfall of approximately $1.4 million, however, no distribution will be paid to the Trust’s unitholders of record on February 26, 2021 in March 2021. Distributions to the Trust will resume once the cumulative net profits shortfall, which continues to decrease and now totals approximately $1.3 million, is eliminated.

The following table displays reported underlying oil and natural gas sales volumes and average received wellhead prices attributable to the current and prior month recorded net profits interest calculations.


Underlying Sales Volumes


Average Price


Oil


Natural Gas


Oil


Natural Gas


Bbls


Bbls/D


Mcf


Mcf/D


(per Bbl)


(per Mcf)

Current Month


45,410


1,514


194,932


6,288


$

38.27


$

1.84

Prior Month


47,347


1,527


419,387


13,980


$

36.97


$

1.55

Recorded oil cash receipts from the oil and gas properties underlying the Trust (the “Underlying Properties”) totaled $1.7 million for the current month on realized wellhead prices of $38.27/Bbl, down $0.1 million from the prior month distribution period.

Recorded natural gas cash receipts from the Underlying Properties totaled $0.4 million for the current month, down $0.3 million from the prior month’s distribution period.

Total accrued operating expenses for the period were $1.8 million, a $0.1 million decrease month-over-month from the prior period. Capital expenditures decreased $0.1 from the prior period.

The remaining cumulative shortfall in net profits for the prior months will be deducted from any net profits in next month’s net profits interest calculation. At this time based on current commodity prices, COERT Holdings 1 LLC (the “Sponsor”) anticipates that the Underlying Properties will continue to generate positive net profits to reduce the cumulative shortfall before returning to monthly distributions again.

About Permianville Royalty Trust

Permianville Royalty Trust is a Delaware statutory trust formed to own a net profits interest representing the right to receive 80% of the net profits from the sale of oil and natural gas production from certain, predominantly non-operated, oil and gas properties in the states of Texas, Louisiana and New Mexico. As described in the Trust’s filings with the Securities and Exchange Commission (the “SEC”), the amount of the periodic distributions is expected to fluctuate, depending on the proceeds received by the Trust as a result of actual production volumes, oil and gas prices, the amount and timing of capital expenditures, and the Trust’s administrative expenses, among other factors. Future distributions are expected to be made on a monthly basis. For additional information on the Trust, please visit www.permianvilleroyaltytrust.com.

Forward-Looking Statements and Cautionary Statements

This press release contains statements that are “forward-looking statements” within the meaning of Section 21E of the Securities Exchange Act of 1934, as amended. All statements contained in this press release, other than statements of historical facts, are “forward-looking statements” for purposes of these provisions. These forward-looking statements include the amount and date of any anticipated distribution to unitholders, expected expenses, including capital expenditures, and expectations regarding the ability of the Underlying Properties to continue to generate positive net profits before returning to monthly distributions. The anticipated distribution is based, in large part, on the amount of cash received or expected to be received by the Trust from the Sponsor with respect to the relevant period. The amount of such cash received or expected to be received by the Trust (and its ability to pay distributions) has been and will continue to be directly affected by the volatility in commodity prices, which have declined since the beginning of 2020 in response to the economic effects of the COVID-19 pandemic and the dispute over production levels between Russia and the members of the Organization of Petroleum Exporting Countries, including Saudi Arabia, resulting in an oversupply of crude oil and exacerbating the decline in crude oil prices, and could remain low for an extended period of time. Continued low oil and natural gas prices will reduce profits to which the Trust is entitled, which will reduce the amount of cash available for distribution to unitholders and in certain periods could result in no distributions to unitholders. Other important factors that could cause actual results to differ materially include expenses of the Trust, reserves for anticipated future expenses and the effect, impact, potential duration or other implications of the COVID-19 pandemic. In addition, future monthly capital expenditures may exceed the average levels experienced in 2019 and prior periods. Statements made in this press release are qualified by the cautionary statements made in this press release. Neither the Sponsor nor the Trustee intends, and neither assumes any obligation, to update any of the statements included in this press release. An investment in units issued by the Trust is subject to the risks described in the Trust’s filings with the SEC, including the risks described in the Trust’s Annual Report on Form 10-K for the year ended December 31, 2019, filed with the SEC on March 16, 2020, and the Trust’s Quarterly Report on Form 10-Q for the period ended September 30, 2020, filed with the SEC on November 6, 2020. The Trust’s quarterly and other filed reports are or will be available over the Internet at the SEC’s website at http://www.sec.gov.


Contacts

Permianville Royalty Trust
The Bank of New York Mellon Trust Company, N.A., as Trustee
Sarah Newell 1 (512) 236-6555

Hiring represents further investment in growth with an industry veteran


CAMPBELL, Calif.--(BUSINESS WIRE)--#renewables--Tigo Energy, Inc., the solar industry worldwide leader in Flex MLPE (Module Level Power Electronics) today announced that Jurgen Krehnke has joined as its new Chief Commercial Officer. Mr. Krehnke brings more than 25 years of sales, marketing, and general management experience to the Tigo Executive Team.

Jurgen is a veteran of the renewable energy industry in a variety of leadership capacities and continues to serve as Director, Solar Electric Industry Association, and as Chairman of the Utility Solar Project Division. Previously, as Chief Executive Officer at Sunfolding, Inc. he successfully raised Series A and B funding and helped establish the company as a serious industry player, winning awards such as “Bloomberg New Energy Pioneer” along the way. As Chief Executive for KACO New Energy Inc. he created over one hundred green manufacturing jobs in San Antonio, Texas. As President of SMA Solar Technology America, LLC he grew revenues to hundreds of millions of dollars in North America while establishing US manufacturing and a nation-wide service organization.

“Jurgen has grown revenue at every company where he has served,” stated Zvi Alon, Chairman and CEO of Tigo. “I welcome such an experienced general manager to the Tigo leadership team as we continue to strengthen our position with loyal partners and installers while expanding into new markets with a complete software and hardware energy solution.”

Mr. Krehnke will own partner and customer relationships worldwide across module makers, inverter suppliers, distributors, installers, and end consumers. He is chartered with planning and executing an ambitious growth plan that builds upon an incredibly successful 2020. His hiring represents further investment to scale the company while providing more complete products and services for PV installers across the seven continents that Tigo serves.

“Tigo is one of the original pioneers and leader in Module Level Power Electronics and has reached a pivotal point in time,” stated Mr. Krehnke. “The company has built a strong brand throughout the world and is ready to grow in all directions. I am pleased to work side-by-side with Zvi and the Executive Team as we take on the next phase of development, serving customers with highly innovative systems solutions.”

Jurgen’s education includes an M.S. degree in Electrical Engineering from Technical University Braunschweig, Germany. He also attended Executive Education Programs at Stanford. He works out of the Silicon Valley, California Tigo headquarters.

About Tigo

Tigo is the worldwide leader in flexible module level power electronics (MLPE) with innovative solutions that significantly increase energy production, decrease operating costs, and enhance safety of photovoltaic (PV) systems. Tigo’s TS4 platform maximizes the benefit of PV systems and provides customers with the most scalable, versatile, and reliable MLPE solution available. Tigo was founded in Silicon Valley in 2007 to accelerate the adoption of solar energy worldwide. Tigo systems operate on 7 continents and produce gigawatt hours of reliable, clean, affordable and safe solar energy daily. Tigo’s global team is dedicated to making the best MLPE on earth so more people can enjoy the benefits of solar. Visit us at www.tigoenergy.com.


Contacts

Media Contact for Tigo
John Lerch
408.402.0802 x430
This email address is being protected from spambots. You need JavaScript enabled to view it.

DALLAS--(BUSINESS WIRE)--Energy Transfer LP (NYSE: ET) and Energy Transfer Operating, L.P. (ETO) today announced they have filed their respective annual reports on Form 10-K for the year ended December 31, 2020 with the Securities and Exchange Commission (SEC).


ET and ETO make available on their website, www.energytransfer.com, annual reports on Form 10-K, quarterly reports on Form 10-Q, current reports on Form 8-K, and other information filed with or furnished to the SEC. ET and ETO also will provide any unitholder with a printed copy of their respective annual report on Form 10-K, which includes audited financial statements, free of charge upon request. Such requests should be directed in writing to Investor Relations, 8111 Westchester Drive, Suite 600, Dallas, TX 75225.

About Energy Transfer

Energy Transfer LP (NYSE: ET) owns and operates one of the largest and most diversified portfolios of energy assets in the United States, with a strategic footprint in all of the major U.S. production basins, ET is a publicly traded limited partnership with core operations that include complementary natural gas midstream, intrastate and interstate transportation and storage assets; crude oil, natural gas liquids (NGL) and refined product transportation and terminalling assets; NGL fractionation; and various acquisition and marketing assets. ET, through its ownership of Energy Transfer Operating, L.P., also owns the general partner interests, the incentive distribution rights and 28.5 million common units of Sunoco LP (NYSE: SUN), and the general partner interests and 46.1 million common units of USA Compression Partners, LP (NYSE: USAC). For more information, visit the Energy Transfer LP website at www.energytransfer.com.

Energy Transfer Operating, L.P. owns and operates one of the largest and most diversified portfolios of energy assets in the United States. Strategically positioned in all of the major U.S. production basins, its core operations include complementary natural gas midstream, intrastate and interstate transportation and storage assets; crude oil, natural gas liquids (NGL) and refined product transportation and terminalling assets; NGL fractionation; and various acquisition and marketing assets. Energy Transfer Operating, L.P.’s general partner is owned by Energy Transfer LP (NYSE: ET). For more information, visit the Energy Transfer website at www.energytransfer.com.

Forward-Looking Statements

This news release may include certain statements concerning expectations for the future that are forward-looking statements as defined by federal law. Such forward-looking statements are subject to a variety of known and unknown risks, uncertainties, and other factors that are difficult to predict and many of which are beyond management’s control. An extensive list of factors that can affect future results are discussed in the Partnerships’ Annual Report on Form 10-K and other documents filed from time to time with the Securities and Exchange Commission, including the Partnerships’ Quarterly Report on Form 10-Q to be filed for the current period. In addition to the risks and uncertainties previously disclosed, the Partnerships have also been, or may in the future be, impacted by new or heightened risks related to the COVID-19 pandemic, and we cannot predict the length and ultimate impact of those risks. The Partnerships undertake no obligation to update or revise any forward-looking statement to reflect new information or events.

The information contained in this press release is available on our website at www.energytransfer.com.


Contacts

Energy Transfer

Investor Relations:
Bill Baerg, Brent Ratliff, Lyndsay Hannah, 214-981-0795
or
Media Relations:
Vicki Granado, 214-840-5820

Cutting emissions 51%, the company is over halfway to its vision of delivering 100% carbon-free electricity by 2050


MINNEAPOLIS--(BUSINESS WIRE)--For the second year in a row, Xcel Energy has hit a significant milestone in its quest to deliver 100% carbon-free electricity to customers by 2050.

The company broke its own record for a single-year drop in emissions in 2020, cutting carbon emissions company-wide by approximately six million tons, a 12% reduction over 2019 levels. That’s equivalent to taking nearly 1.2 million cars off the road for a year. In 2019, Xcel Energy achieved a 10% reduction over the previous year.

Since 2005, the company has reduced carbon emissions by 51% as it leads the nation’s clean energy transition. Xcel Energy’s 2020 carbon reductions outpaced the industry, which is ahead of any other part of the economy. At the end of 2020, it is estimated the U.S. electric power sector had reduced carbon emissions just under 40% from 2005 levels, according to data from the U.S. Energy Information Administration.

“We’re making tremendous progress towards delivering on our clean energy goals,” said Ben Fowke, chairman and CEO of Xcel Energy. “Even after factoring in the effect of the global pandemic on our operations, we are well on our way to achieving our goal of reducing carbon emissions 80% by 2030 and are more than halfway to delivering 100% carbon-free electricity to our customers, all while keeping their service reliable and energy bills low.”

Several factors contributed to the 2020 carbon reduction results.

Xcel Energy continued to significantly increase wind generation on its system, becoming one of the first energy providers in the United States to reach 10,000 megawatts of wind energy capacity online for customers in the states it serves.

The company added more than 800 megawatts of new wind projects in late 2019, in addition to bringing nearly 2,200 megawatts of new wind projects online in 2020. By the end of 2021, Xcel Energy estimates that approximately 35% of its energy will be from wind. Through the company’s wind expansion, it has delivered approximately $430 million in fuel savings to its customers from 2017 to 2020.

Thanks to having more wind and solar on its system, the company recorded a 12% reduction in megawatt hours from coal and natural gas generation. To support its growing renewable energy portfolio, it is using cleaner natural gas as backup and pushing the envelope in operating its remaining coal plants to follow the wind and sun.

Xcel Energy’s two nuclear plants in Minnesota had another excellent operating year, providing a steady supply of 100% carbon-free power.

The pandemic also played a role in reducing the company’s electricity sales by an estimated 3% for the year and contributing to lower carbon emissions.

About Xcel Energy

Xcel Energy (NASDAQ: XEL) provides the energy that powers millions of homes and businesses across eight Western and Midwestern states. Headquartered in Minneapolis, the company is an industry leader in responsibly reducing carbon emissions and producing and delivering clean energy solutions from a variety of renewable sources at competitive prices. For more information, visit xcelenergy.com or follow us on Twitter and Facebook.


Contacts

Xcel Energy Media Relations
(612) 215-5300
www.xcelenergy.com

 Task Force and Committee Virtual Sessions Scheduled

HOUSTON--(BUSINESS WIRE)--The Port Commission of the Port of Houston Authority will conduct its regular monthly meeting virtually on Tuesday, Feb. 23 at 9:15 a.m., via Webex webinar.


There are two virtual Port Authority public meetings also scheduled for next week:

  • Community Relations Committee – Feb. 23 at 9:30 a.m. (or immediately following the adjournment of the Port Commission meeting)
  • Procurement & Small Business Development Task Force – Feb. 25 at 10:00 a.m.

The agendas and the instructions to access all of the virtual meetings are available at http://porthouston.com/leadership/public-meetings/.

Sign up for public comment is available up to an hour before the Port Commission and Community Advisory Council meetings by contacting Erik Eriksson at This email address is being protected from spambots. You need JavaScript enabled to view it. or Liana Christian at This email address is being protected from spambots. You need JavaScript enabled to view it..

Governor Abbott’s action of March 16, 2020 continues to allow these virtual and telephonic open meetings to maintain government transparency, as the Port Authority Executive Office Building remains closed to the general public.

About Port Houston For more than 100 years, Port Houston has owned and operated the public wharves and terminals along the Houston Ship Channel – the nation’s largest port for waterborne tonnage and an essential economic engine for the Houston region, the state of Texas, and the U.S. nation. The more than 200 private and eight public terminals along the federal waterway supports the creation of nearly 1.35 million jobs in Texas and 3.2 million jobs nationwide, and economic activity totaling $339 billion in Texas – 20.6% of Texas’ total gross domestic product (GDP) – and a total of $801.9 billion in economic impact across the nation. For more information, visit the website: https://porthouston.com/

Please note the following to help the meeting run smoothly:

  • The meeting will begin at 9:15 a.m.
  • Please dial in via phone for the audio portion and use your attendee number to merge your phone and computer presence.
  • All participants will be muted upon entry. Please stay muted unless speaking.
  • Please turn off your video to help the call run more smoothly.

The Community Relations Committee will begin once the Port Commission meeting adjourns.

When it's time, join your Webex meeting here.

Join meeting

More ways to join:

Join from the meeting link
https://porthouston.webex.com/porthouston/j.php?MTID=mfb36643aa7581c3785c7a43af5dbf88f

Join by meeting number
Meeting number (access code): 187 001 2900
Meeting password: 9NPrkBKwJ68

Tap to join from a mobile device (attendees only)
+1-720-650-7664,,1870012900## United States Toll (Denver)
+1-469-210-7159,,1870012900## United States Toll (Dallas)

Join by phone
+1-720-650-7664 United States Toll (Denver)
+1-469-210-7159 United States Toll (Dallas)

Global call-in numbers

Join from a video system or application
Dial This email address is being protected from spambots. You need JavaScript enabled to view it.
You can also dial 173.243.2.68 and enter your meeting number.

Join using Microsoft Lync or Microsoft Skype for Business
Dial This email address is being protected from spambots. You need JavaScript enabled to view it.

Need help? Go to https://help.webex.com


Contacts

Lisa Ashley, Director, Media Relations, Port Houston
Office: 713-670-2644; Mobile: 832-247-8179; E-mail: This email address is being protected from spambots. You need JavaScript enabled to view it.

Offshore Source Logo

Offshore Source keeps you updated with relevant information concerning the Offshore Energy Sector.

Any views or opinions represented on this website belong solely to the author and do not represent those of the people, institutions or organizations that Offshore Source or collaborators may or may not have been associated with in a professional or personal capacity, unless explicitly stated.

Corporate Offices

Technology Systems Corporation
8502 SW Kansas Ave
Stuart, FL 34997

info@tscpublishing.com