Business Wire News

Highest Power and Safest Lithium Chemistry Establishes New Market Leader

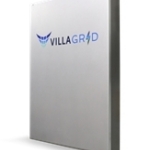
SACRAMENTO, Calif.--(BUSINESS WIRE)--#HomeBattery--Villara Energy Systems announced today the launch of its state-of-the-art home battery, the VillaGrid. This revolutionary energy storage system (ESS) is the first of its kind to harness lithium titanate chemistry. Delivered with a 20-year warranty, the VillaGrid is designed to be the safest, longest-lasting, most powerful and efficient battery on the market, with the highest lifetime usable energy and the lowest lifetime cost of ownership.


“We set out to engineer a battery that would last twice as long and provide twice the power,” says Villara Energy Systems President, Rick Wylie. “Today, we’re excited to present that battery to the world.”

The VillaGrid represents a quantum leap forward in home battery technology. It delivers double the power of leading competitors, enough to start up large air conditioners. The VillaGrid is also far more efficient, with less than half the energy loss of competitors, turning more of a homeowner’s solar power into usable electricity. The VillaGrid operates across a wider temperature range, performing in extreme climates where competitors cannot.

The VillaGrid energy storage system is complementary to home solar panels which charge the battery. As homeowners face rising electricity rates, unplanned power outages and Public Safety Power Shutoffs, the VillaGrid can help them reduce their electric bills and better endure blackouts.

“Imagine a car is introduced to the market that runs on a new alternative fuel, gets 200 miles per gallon, goes zero to sixty in one second and comes with a six-million-mile warranty. That’s the VillaGrid. It’s a fundamentally new battery technology that delivers more power, more safety, more efficiency and more useful life,” says General Manager of Villara Energy Systems, Garrett Woodroof.

As an aging power grid struggles to support increasing demand, state and federal agencies aim to ease the energy crisis by offering tax credits and other incentives to homeowners and home builders who invest in home energy storage systems. In the face of extended power outages and rising energy prices, many homeowners are leveraging these subsidies in order to secure their personal energy independence.

For more information, please visit villaraenergy.com.

About Villara Energy Systems

Villara Energy Systems delivers best-in-class energy products designed to exceed consumer expectations and the strictest safety standards. As a proud California manufacturer, Villara Energy engineers and produces its products in the USA.


Contacts

Ann Bouchard, Bouchard Communications
This email address is being protected from spambots. You need JavaScript enabled to view it.
Cell: (916) 521-7440

TAMPA, Fla.--(BUSINESS WIRE)--Overseas Shipholding Group, Inc. (NYSE: OSG) (the “Company” or “OSG”), a leading provider of energy transportation services for crude oil and petroleum products in the U.S. Flag markets, today reported results for the first quarter 2021.


  • Net loss for the first quarter 2021 was $15.9 million, or $(0.18) per diluted share, compared with net income of $25.1 million, or $0.28 per diluted share, for the first quarter 2020. The first quarter of 2020 included a $19.2 million gain related to the acquisition of the Alaska Tanker Company.
  • In April, we entered into a contract to sell the Overseas Gulf Coast for $32.5 million. Based on the negotiated sale terms, the transaction will result in a $5.4 million loss, which we recorded in the first quarter of 2021. The sale of this unencumbered asset will provide additional liquidity.
  • Shipping revenues for the first quarter 2021 were $81.3 million, a decrease of 19.4% from $100.9 million in the first quarter 2020.
  • Winter Storm Uri resulted in U.S. refinery shutdowns further reducing transportation demand from already depressed levels as a consequence of the COVID-19 pandemic.
  • During this quarter, the Company had seven ships in lay-up and one vessel unemployed in the spot market for two months.
  • Time charter equivalent (TCE) revenues(A), a non-GAAP measure, for the first quarter 2021 were $65.5 million, down 32.5% compared with the first quarter 2020.
  • First quarter 2021 Adjusted EBITDA(B), a non-GAAP measure, was $6.2 million, down 88.2% from $52.8 million in the first quarter 2020.
  • Total cash(c) was $45.2 million as of March 31, 2021.

Sam Norton, President and CEO, commenting on the recently completed quarter, stated, “The ongoing coronavirus pandemic, and associated lockdowns, business closures and travel restrictions, continued to severely impact global and national energy markets – and by extension demand for crude oil and refined product marine transportation in the first quarter. Given this very difficult operating environment, the results announced this morning have met our expectations and point to the continuing benefit of having a diversified asset portfolio. Although our conventional Jones Act tankers experienced losses in the first quarter, our other operating assets performed largely in line with historical norms. Heightened uncertainty has resulted in the non-renewal of charters for tankers. In response to this we have placed six conventional tankers and one of our lightering ATBs in layup as of March 31.”

Mr. Norton added, “We anticipate that, as vaccine distribution continues to expand and there is a continued lifting of COVID-19 restrictions, mobility and related US consumption of transportation fuels will normalize to fuel demand patterns consistent with historic levels of consumption. This normalization should stimulate more marine transportation demand, leading us to reactivate vessels from layup. The pace and trajectory of demand recovery continues to be influenced by many factors, including progress in resolving the pandemic outside of the US, and near-term uncertainty will continue to define a wide spectrum of possible vessel reactivation outcomes as we move through the late spring and summer. Nonetheless, we believe that, as our customers’ visibility and confidence in the future returns, there will be a resumption of more typical customer behavior and time charter activity will rebound, leading to improving financial performance as the year progresses.”


A, B, C Reconciliations of these non-GAAP financial measures are included in the financial tables attached to this press release starting on Page 8.

First Quarter 2021 Results

Shipping revenues were $81.3 million for the quarter, down 19.4% compared with the first quarter of 2020. TCE revenues for the first quarter of 2021 were $65.5 million, a decrease of $31.6 million, or 32.5%, compared with the first quarter of 2020, primarily a result of a 624-day increase in lay-up days due to seven vessels in lay-up, a decision taken in light of the lack of demand due to the economic impact of COVID-19. The decrease in TCE revenues was partially offset by the addition to our fleet of three crude oil tankers, Alaskan Explorer, Alaskan Legend and Alaskan Navigator, which were purchased on March 12, 2020.

Operating loss for the first quarter of 2021 was $15.8 million compared to operating income of $37.5 million in the first quarter of 2020. We had seven vessels in lay-up during the first quarter of 2021. Additionally, one vessel was available in the spot market and was unemployed for two months prior to entering into a time charter. The first quarter of 2020 included a gain on termination of a pre-existing arrangement related to the acquisition of the Alaska Tanker Company.

In April 2021, we entered into a contract to sell the Overseas Gulf Coast for $32.5 million. Based on the negotiated sale terms, the transaction will result in a $5.4 million loss, which was recorded in the first quarter.

Net loss for the first quarter of 2021 was $15.9 million, or $(0.18) per diluted share, compared with net income of $25.1 million, or $0.28 per diluted share, for the first quarter 2020.

Adjusted EBITDA was $6.2 million for the quarter, a decrease of $46.6 million compared with the first quarter of 2020, driven primarily by the decrease in TCE revenues.

Conference Call

The Company will host a conference call to discuss its first quarter 2021 results at 9:30 a.m. Eastern Time (“ET”) on Friday, May 7, 2021.

To access the call, participants should dial (844) 850-0546 for domestic callers and (412) 317-5203 for international callers. Please dial in ten minutes prior to the start of the call.

A live webcast of the conference call will be available from the Investor Relations section of the Company’s website at http://www.osg.com/.

An audio replay of the conference call will be available starting at 11:30 a.m. ET on Friday, May 7, 2021 through 10:59 p.m. ET on Friday, May 14, 2021 by dialing (877) 344-7529 for domestic callers and (412) 317-0088 for international callers, and entering Access Code 10155061.

About Overseas Shipholding Group, Inc.

Overseas Shipholding Group, Inc. (NYSE:OSG) is a publicly traded company providing energy transportation services for crude oil and petroleum products in the U.S. Flag markets. OSG is a major operator of tankers and ATBs in the Jones Act industry. OSG’s 22 vessel U.S. Flag fleet consists of three crude oil tankers doing business in Alaska, two conventional ATB, two lightering ATBs, three shuttle tankers, ten MR tankers, and two non-Jones Act MR tankers that participate in the U.S. Maritime Security Program. OSG also currently owns and operates two Marshall Islands flagged MR tankers which trade internationally.

OSG is committed to setting high standards of excellence for its quality, safety and environmental programs. OSG is recognized as one of the world’s most customer-focused marine transportation companies and is headquartered in Tampa, FL. More information is available at www.osg.com.

Forward-Looking Statements

This press release contains forward-looking statements within the meaning of the Private Securities Litigation Reform Act of 1995. In addition, the Company may make or approve certain forward-looking statements in future filings with the Securities and Exchange Commission (SEC), in press releases, or in oral or written presentations by representatives of the Company. All statements other than statements of historical facts should be considered forward-looking statements. These matters or statements may relate to our prospects, supply and demand for vessels in the markets in which we operate and the impact on market rates and vessel earnings, the continued stability of our niche businesses, and the impact of our time charter contracts on our future financial performance. Forward-looking statements are based on our current plans, estimates and projections, and are subject to change based on a number of factors. COVID-19 has had, and will continue to have, a profound impact on our workforce, and many aspects of our business and industry. Investors should carefully consider the risk factors outlined in more detail in our filings with the SEC. We do not assume any obligation to update or revise any forward-looking statements except as may be required by applicable law. Forward-looking statements and written and oral forward-looking statements attributable to us or our representatives after the date of this press release are qualified in their entirety by the cautionary statements contained in this paragraph and in other reports previously or hereafter filed by us with the SEC.

Consolidated Statements of Operations

($ in thousands, except per share amounts)


Three Months Ended

March 31,


2021


2020


(unaudited)


(unaudited)

Shipping Revenues:


Time and bareboat charter revenues

$

63,788


$

78,150


Voyage charter revenues

17,485


22,709


81,273


100,859


Operating Expenses:


Voyage expenses

15,760


3,786


Vessel expenses

31,807


35,769


Charter hire expenses

22,318


22,460


Depreciation and amortization

15,319


14,019


General and administrative

6,365


6,173


Loss on disposal of vessels and other property, including impairments, net

5,493


296


Total operating expenses

97,062


82,503


(Loss)/income from vessel operations

(15,789

)


18,356


Gain on termination of pre-existing arrangement


19,172


Operating (loss)/income

(15,789

)


37,528


Other income, net

122


31


(Loss)/income before interest expense and income taxes

(15,667

)


37,559


Interest expense

(6,370

)


(6,074

)

(Loss)/income before income taxes

(22,037

)


31,485


Income tax benefit/(expense)

6,169


(6,360

)

Net (loss)/income

$

(15,868

)


$

25,125


Weighted Average Number of Common Shares Outstanding:


Basic - Class A

90,111,701


89,422,311


Diluted - Class A

90,111,701


90,388,988


Per Share Amounts:


Basic and diluted net (loss)/income - Class A

$

(0.18

)


$

0.28


Consolidated Balance Sheets


March 31,
2021


December 31,
2020


(unaudited)


ASSETS


Current Assets:


Cash and cash equivalents

$

45,093


$

69,697


Restricted cash

37


49


Voyage receivables, including unbilled of $4,999 and $6,740, net of reserve for doubtful accounts

10,872


13,123


Income tax receivable

388


387


Other receivables

3,817


1,817


Inventories, prepaid expenses and other current assets

5,067


3,603


Total Current Assets

65,274


88,676


Vessels and other property, less accumulated depreciation

787,241


832,174


Asset held for sale

31,850


Deferred drydock expenditures, net

45,810


43,134


Total Vessels, Other Property and Deferred Drydock

864,901


875,308


Restricted cash - non current

59


73


Intangible assets, less accumulated amortization

26,067


27,217


Operating lease right-of-use assets, net

197,073


215,817


Other assets

26,058


24,646


Total Assets

$

1,179,432


$

1,231,737


LIABILITIES AND EQUITY


Current Liabilities:


Accounts payable, accrued expenses and other current liabilities

$

48,449


$

48,089


Current portion of operating lease liabilities

90,612


90,613


Current portion of finance lease liabilities

4,001


4,000


Current installments of long-term debt

38,718


38,922


Total Current Liabilities

181,780


181,624


Reserve for uncertain tax positions

183


189


Noncurrent operating lease liabilities

128,055


147,154


Noncurrent finance lease liabilities

20,793


21,360


Long-term debt

380,165


390,198


Deferred income taxes, net

74,821


80,992


Other liabilities

29,618


30,409


Total Liabilities

815,415


851,926


Equity:


Common stock - Class A ($0.01 par value; 166,666,666 shares authorized; 86,863,651 and 86,365,422 shares issued and outstanding)

869


864


Paid-in additional capital

592,732


592,564


Accumulated deficit

(229,203

)


(213,335

)


364,398


380,093


Accumulated other comprehensive loss

(381

)


(282

)

Total Equity

364,017


379,811


Total Liabilities and Equity

$

1,179,432


$

1,231,737


Consolidated Statements of Cash Flows


Three Months Ended

March 31,


2021


2020


(unaudited)


(unaudited)

Cash Flows from Operating Activities:


Net (loss)/income

$

(15,868

)


$

25,125


Items included in net income not affecting cash flows:


Depreciation and amortization

15,319


14,019


Gain on termination of pre-existing arrangement


(19,172

)

Loss on disposal of vessels and other property, including impairments, net

5,493


296


Amortization of debt discount and other deferred financing costs

557


533


Compensation relating to restricted stock awards and stock option grants

575


438


Deferred income tax (benefit)/expense

(6,178

)


2,135


Interest on finance lease liabilities

460


506


Non-cash operating lease expense

22,717


22,811


Distributed earnings of affiliated companies


3,562


Payments for drydocking

(8,179

)


(3,327

)

Operating lease liabilities

(22,860

)


(22,969

)

Changes in operating assets and liabilities, net

(1,217

)


2,162


Net cash (used in)/provided by operating activities

(9,181

)


26,119


Cash Flows from Investing Activities:


Acquisition, net of cash acquired


(16,973

)

Expenditures for vessels and vessel improvements

(3,227

)


(20,871

)

Expenditures for other property


(232

)

Net cash used in investing activities

(3,227

)


(38,076

)

Cash Flows from Financing Activities:


Payments on debt

(9,616

)


(7,865

)

Tax withholding on share-based awards

(402

)


(197

)

Payments on principal portion of finance lease liabilities

(1,026

)


(1,037

)

Extinguishment of debt

(301

)


Deferred financing costs paid for debt amendments

(877

)


Issuance of debt, net of issuance and deferred financing costs


80,886


Net cash (used in)/provided by financing activities

(12,222

)


71,787


Net (decrease)/increase in cash, cash equivalents and restricted cash

(24,630

)


59,830


Cash, cash equivalents and restricted cash at beginning of period

69,819


41,677


Cash, cash equivalents and restricted cash at end of period

$

45,189


$

101,507


Spot and Fixed TCE Rates Achieved and Revenue Days

The following table provides a breakdown of TCE rates achieved for spot and fixed charters and the related revenue days for the three months ended March 31, 2021 and the comparable period of 2020. Revenue days in the quarter ended March 31, 2021 totaled 1,473 compared with 1,898 in the prior year quarter.


2021


2020

Three Months Ended March 31,

Spot Earnings


Fixed Earnings


Spot Earnings


Fixed Earnings

Jones Act Handysize Product Carriers:


Average rate

$

24,467


$

65,165


$

61,951


$

60,260


Revenue days

148


477


92


1,052


Non-Jones Act Handysize Product Carriers:


Average rate

$

14,958


$

7,044


$

27,727


$

16,788


Revenue days

180


177


154


182


ATBs:


Average rate

$


$

32,339


$

28,332


$

24,015


Revenue days


180


93


89


Lightering:


Average rate

$

92,524


$


$

78,258


$

61,012


Revenue days

73


91


87


Alaska (a):


Average rate

$


$

58,743


$


$

59,015


Revenue days


238


58


(a) Excludes one Alaska vessel currently in layup.

Fleet Information

As of March 31, 2021, OSG’s operating fleet consisted of 25 vessels, 13 of which were owned, with the remaining vessels chartered-in. Vessels chartered-in are on Bareboat Charters.


Vessels
Owned


Vessels
Chartered-In


Total at March 31, 2021

Vessel Type

Number


Number


Total Vessels


Total dwt (3)

Handysize Product Carriers (1)

6


11


17


810,825


Crude Oil Tankers (2)

3


1


4


772,194


Refined Product ATBs

2


2


54,182


Lightering ATBs

2


2


91,112


Total Operating Fleet

13


12


25


1,728,313


(1)

Includes two owned shuttle tankers, 11 chartered-in tankers, and two non-Jones Act MR tankers that participate in the U.S. Maritime Security Program, all of which are U.S. flagged, as well as two owned Marshall Island flagged non-Jones Act MR tankers trading in international markets.

(2)

Includes three crude oil tankers doing business in Alaska and one crude oil tanker bareboat chartered-in and in layup.

(3)

Total dwt is defined as aggregate deadweight tons for all vessels of that type.

Reconciliation to Non-GAAP Financial Information

The Company believes that, in addition to conventional measures prepared in accordance with GAAP, the following non-GAAP measures provide investors with additional information that will better enable them to evaluate the Company’s performance. Accordingly, these non-GAAP measures are intended to provide supplemental information, and should not be considered in isolation or as a substitute for measures of performance prepared with GAAP.

(A) Time Charter Equivalent (TCE) Revenues

Consistent with general practice in the shipping industry, the Company uses TCE revenues, which represents shipping revenues less voyage expenses, as a measure to compare revenue generated from a voyage charter to revenue generated from a time charter. TCE revenues, a non-GAAP measure, provides additional meaningful information in conjunction with shipping revenues, the most directly comparable GAAP measure, because it assists Company management in making decisions regarding the deployment and use of its vessels and in evaluating their financial performance. Reconciliation of TCE revenues of the segments to shipping revenues as reported in the consolidated statements of operations follows:


Three Months Ended

March 31,


2021


2020

Time charter equivalent revenues

$

65,513


$

97,073


Add: Voyage expenses

15,760


3,786


Shipping revenues

$

81,273


$

100,859


Vessel Operating Contribution

Vessel operating contribution, a non-GAAP measure, is TCE revenues minus vessel expenses and charter hire expenses.


Three Months Ended

March 31,

($ in thousands)

2021


2020

Niche market activities

$

13,142


$

21,706


Jones Act handysize tankers

(12,257

)


12,384


ATBs

3,581


2,805


Alaska crude oil tankers

6,922


1,949


Vessel operating contribution

11,388


38,844


Depreciation and amortization

15,319


14,019


General and administrative

6,365


6,173


Loss on disposal of vessels and other property, including impairments, net

5,493


296


(Loss)/income from vessel operations

$

(15,789

)


$

18,356


(B) EBITDA and Adjusted EBITDA

EBITDA represents net income/(loss) before interest expense, income taxes and depreciation and amortization expense. Adjusted EBITDA consists of EBITDA adjusted to exclude amortization classified in charter hire expenses, interest expense classified in charter hire expenses, loss/(gain) on disposal of vessels and other property, including impairments, net, non-cash stock based compensation expense and loss on repurchases and extinguishment of debt and the impact of other items that we do not consider indicative of our ongoing operating performance. EBITDA and Adjusted EBITDA do not represent, and should not be a substitute for, net income/(loss) or cash flows from operations as determined in accordance with GAAP. Some of the limitations are: (i) EBITDA and Adjusted EBITDA do not reflect our cash expenditures, or future requirements for capital expenditures or contractual commitments; (ii) EBITDA and Adjusted EBITDA do not reflect changes in, or cash requirements for, our working capital needs; and (iii) EBITDA and Adjusted EBITDA do not reflect the interest expense, or the cash requirements necessary to service interest or principal payments, on our debt. While EBITDA and Adjusted EBITDA are frequently used as a measure of operating results and performance, neither of them is necessarily comparable to other similarly titled measures used by other companies due to differences in methods of calculation. The following table reconciles net income/(loss) as reflected in the consolidated statements of operations, to EBITDA and Adjusted EBITDA.


Three Months Ended March 31,

($ in thousands)

2021


2020

Net (loss)/income

$

(15,868

)


$

25,125


Income tax (benefit)/expense

(6,169

)


6,360


Interest expense

6,370


6,074


Depreciation and amortization

15,319


14,019


EBITDA

(348

)


51,578


Amortization classified in charter hire expenses

143


143


Interest expense classified in charter hire expenses

345


379


Loss on disposal of vessels and other property, including impairments, net

5,493


296


Non-cash stock based compensation expense

575


438


Adjusted EBITDA

$

6,208


$

52,834


(C) Total Cash

($ in thousands)

March 31,

2021


December 31,

2020

Cash and cash equivalents

$

45,093


$

69,697


Restricted cash - current

37


49


Restricted cash – non-current

59


73


Total Cash

$

45,189


$

69,819


Category: Earnings


Contacts

Investor Relations & Media Contact:
Susan Allan, Overseas Shipholding Group, Inc.
(813) 209-0620
This email address is being protected from spambots. You need JavaScript enabled to view it.

LOS ANGELES--(BUSINESS WIRE)--#EVs--Fisker Inc. (NYSE: FSR, or "Fisker") – passionate creator of the world’s most sustainable electric vehicles and advanced mobility solutions – announced that it will report its first quarter 2021 financial results after market close on Monday, May 17, 2021. The release will be followed by a conference call at 2 p.m. PT (5 p.m. ET). Speakers on the call will be Henrik Fisker, Chairman and Chief Executive Officer; Dr. Geeta Gupta-Fisker, Chief Operating Officer and Chief Financial Officer; and Dr. Burkhard Huhnke, Chief Technology Officer of Fisker Inc.


The conference call can be accessed via a live webcast accessible on the Events and Presentations page of Fisker’s Investor Relations website: https://investors.fiskerinc.com/. An archive of the webcast will be available shortly after the call and will remain on the website for 12 months thereafter.

Fisker is also announcing the launch of a shareholder Q&A platform to be used for its upcoming earnings call. Starting today, shareholders will be able to submit and upvote questions to management. To submit questions ahead of earnings, please visit the Say platform here; shareholders at brokers with Say can participate directly in their investing app or broker website. The Q&A platform will remain open until 24 hours before the earnings call and can also be accessed in the Events & Presentations section of Fisker’s IR website. Management intends to respond to a selection of questions during the Q&A portion of the call.

Fisker remains on target to start production of the all-electric Fisker Ocean in Q4 of 2022 and to unveil the production version of Ocean at the LA Auto Show in November of 2021.

About Fisker Inc.

California-based Fisker Inc. is revolutionizing the automotive industry by developing the most emotionally desirable and eco-friendly electric vehicles on Earth. Passionately driven by a vision of a clean future for all, the company is on a mission to become the No. 1 e-mobility service provider with the world’s most sustainable vehicles. To learn more, visit www.FiskerInc.com – and enjoy exclusive content across Fisker’s social media channels: Facebook, Instagram, Twitter, YouTube and LinkedIn. Download the revolutionary new Fisker mobile app from the App Store or Google Play store.


Contacts

Fisker Inc.
Simon Sproule, SVP, Communications
310.374.6177
This email address is being protected from spambots. You need JavaScript enabled to view it.

Dan Galves, VP, Investor Relations
This email address is being protected from spambots. You need JavaScript enabled to view it.

WALTHAM, Mass.--(BUSINESS WIRE)--Global Partners LP (NYSE: GLP), today reported financial results for the first quarter ended March 31, 2021.


With more than one-third of the U.S. now fully vaccinated against COVID-19, and a growing number of businesses reopening, the business landscape is improving and industrywide fuel demand is increasing,” said Eric Slifka, Global’s President and Chief Executive Officer. “In the first quarter of 2021 our fuel volumes, though still off from the same period in 2020, showed signs of rebounding from COVID lows, while retail fuel margins remained relatively strong despite a significant first-quarter spike in Wholesale gasoline prices, which were up more than 70 cents through mid-March.

In our Wholesale segment, product margin in the first quarter of 2021 was $25 million better than the same period a year earlier,” Slifka said. “The improvement was driven by more favorable market conditions, primarily in gasoline and other oils and related products, as well as colder temperatures.”

Financial Highlights

The net loss attributable to the Partnership was $4.3 million, or $0.20 per common limited partner unit, for the first quarter of 2021 compared with net income attributable to the Partnership of $3.3 million, or $0.05 per diluted common limited partner unit, for the same period of 2020.

Earnings before interest, taxes, depreciation and amortization (EBITDA) was $40.9 million in the first quarter of 2021 compared with $44.7 million in the comparable period of 2020.

Adjusted EBITDA was $40.4 million in the first quarter of 2021 versus $45.4 million in the year-earlier period.

Distributable cash flow (DCF) was $14.0 million in the first quarter of 2021 compared with $22.0 million in the same period of 2020.

Gross profit in the first quarter of 2021 was $145.0 million compared with $145.7 million in the first quarter of 2020.

Combined product margin, which is gross profit adjusted for depreciation allocated to cost of sales, was $165.1 million in the first quarter of 2021 compared with $166.7 million in the first quarter of 2020.

Combined product margin, EBITDA, Adjusted EBITDA, and DCF are non-GAAP (Generally Accepted Accounting Principles) financial measures, which are explained in greater detail below under “Use of Non-GAAP Financial Measures.” Please refer to Financial Reconciliations included in this news release for reconciliations of these non-GAAP financial measures to their most directly comparable GAAP financial measures for the three months ended March 31, 2021 and 2020.

GDSO segment product margin was $130.4 million in the first quarter of 2021 compared with $155.9 million in the first quarter of 2020, primarily reflecting lower fuel margins and decreased fuel volume.

Wholesale segment product margin was $30.5 million in the first quarter of 2021 compared with $5.5 million in the first quarter of 2020, primarily reflecting more favorable market conditions in gasoline and other oils and related products. In addition, colder temperatures year-over-year in the first quarter of 2021 benefited margins of weather-sensitive products. During the first quarter of 2020, the COVID-19 pandemic and the price war between Saudi Arabia and Russia caused a rapid decline in prices, steepening the forward product pricing curve, which negatively impacted margins.

Commercial segment product margin was $4.2 million compared with $5.3 million in the first quarter of 2020, primarily reflecting a decline in bunkering activity.

Sales were $2.6 billion in the first quarters of 2021 and 2020. Wholesale segment sales were $1.6 billion in the first quarters of 2021 and 2020. GDSO segment sales were $0.9 billion in the first quarter of 2021 and $0.8 billion in the first quarter of 2020. Commercial segment sales were $145.7 million in the first quarter of 2021 compared with $142.6 million in the first quarter of 2020.

Volume in the first quarter of 2021 was 1.3 billion gallons compared with 1.5 billion gallons in the same period of 2020. Wholesale segment volume was 0.9 billion gallons in the first quarter of 2021 compared with 1.1 billion gallons in the first quarter of 2020. GDSO volume was 334.1 million gallons in the first quarter of 2021 compared with 351.4 million gallons in the first quarter of 2020. Commercial segment volume was 81.4 million gallons in the first quarters of 2021 and 2020.

Recent Developments

  • Global successfully completed a public offering of 3,000,000 9.50% Series B Fixed Rate Cumulative Redeemable Perpetual Preferred Units at $25.00 per unit. Global used the net proceeds from this offering to reduce indebtedness under its credit agreement.
  • Global entered into an amended credit agreement that among other things, extended the maturity date from April 2022 to May 2024, reduced the applicable rate for borrowings and letters of credit, increased the working capital revolving credit facility from $770 million to $800 million, and increased the revolving credit facility from $400 million to $450 million.
  • Global launched Project Carbon Freedom, a new coalition to advance clean energy legislation that supports the deployment of renewable liquid heating fuel in order to efficiently, affordably and equitably decarbonize the residential heating sector across the northeastern U.S.
  • Global announced a quarterly cash distribution of $0.5750 per unit, or $2.30 per unit on an annualized basis, on all of its outstanding common units for the period from January 1 to March 31, 2021. The distribution will be paid May 14, 2021 to unitholders of record as of the close of business on May 10, 2021.

Business Outlook

We continue to execute on our strategy to grow through organic initiatives and strategic M&A,” Slifka said. “We have a robust pipeline of retail investments and other projects planned for 2021 and believe that we are well positioned for the future.”

The extent to which the COVID-19 pandemic may affect our operating results remains uncertain. The COVID-19 pandemic has had, and may continue to have, material adverse consequences for general economic, financial and business conditions, and could materially and adversely affect our business, financial condition and results of operations and those of our customers, suppliers and other counterparties.

Financial Results Conference Call

Management will review the Partnership’s first-quarter 2021 financial results in a teleconference call for analysts and investors today.

Time:

10:00 a.m. ET

Dial-in numbers:

(877) 709-8155 (U.S. and Canada)


(201) 689-8881 (International)

Due to the expected high demand on our conference call provider, please plan to dial in to the call at least 20 minutes prior to the start time. The call also will be webcast live and archived on Global’s website, https://ir.globalp.com.

Use of Non-GAAP Financial Measures

Product Margin

Global Partners views product margin as an important performance measure of the core profitability of its operations. The Partnership reviews product margin monthly for consistency and trend analysis. Global Partners defines product margin as product sales minus product costs. Product sales primarily include sales of unbranded and branded gasoline, distillates, residual oil, renewable fuels, crude oil and propane, as well as convenience store sales, gasoline station rental income and revenue generated from logistics activities when the Partnership engages in the storage, transloading and shipment of products owned by others. Product costs include the cost of acquiring products and all associated costs including shipping and handling costs to bring such products to the point of sale as well as product costs related to convenience store items and costs associated with logistics activities. The Partnership also looks at product margin on a per unit basis (product margin divided by volume). Product margin is a non-GAAP financial measure used by management and external users of the Partnership’s consolidated financial statements to assess its business. Product margin should not be considered an alternative to net income, operating income, cash flow from operations, or any other measure of financial performance presented in accordance with GAAP. In addition, product margin may not be comparable to product margin or a similarly titled measure of other companies.

EBITDA and Adjusted EBITDA

EBITDA and Adjusted EBITDA are non-GAAP financial measures used as supplemental financial measures by management and may be used by external users of Global Partners’ consolidated financial statements, such as investors, commercial banks and research analysts, to assess the Partnership’s:

  • compliance with certain financial covenants included in its debt agreements;
  • financial performance without regard to financing methods, capital structure, income taxes or historical cost basis;
  • ability to generate cash sufficient to pay interest on its indebtedness and to make distributions to its partners;
  • operating performance and return on invested capital as compared to those of other companies in the wholesale, marketing, storing and distribution of refined petroleum products, gasoline blendstocks, renewable fuels, crude oil and propane, and in the gasoline stations and convenience stores business, without regard to financing methods and capital structure; and
  • viability of acquisitions and capital expenditure projects and the overall rates of return of alternative investment opportunities.

Adjusted EBITDA is EBITDA further adjusted for gains or losses on the sale and disposition of assets and goodwill and long-lived asset impairment charges. EBITDA and Adjusted EBITDA should not be considered as alternatives to net income, operating income, cash flow from operating activities or any other measure of financial performance or liquidity presented in accordance with GAAP. EBITDA and Adjusted EBITDA exclude some, but not all, items that affect net income, and these measures may vary among other companies. Therefore, EBITDA and Adjusted EBITDA may not be comparable to similarly titled measures of other companies.

Distributable Cash Flow

Distributable cash flow is an important non-GAAP financial measure for the Partnership’s limited partners since it serves as an indicator of success in providing a cash return on their investment. Distributable cash flow as defined by the Partnership’s partnership agreement is net income plus depreciation and amortization minus maintenance capital expenditures, as well as adjustments to eliminate items approved by the audit committee of the board of directors of the Partnership’s general partner that are extraordinary or non-recurring in nature and that would otherwise increase distributable cash flow.

Distributable cash flow as used in our partnership agreement also determines our ability to make cash distributions on our incentive distribution rights. The investment community also uses a distributable cash flow metric similar to the metric used in our partnership agreement with respect to publicly traded partnerships to indicate whether or not such partnerships have generated sufficient earnings on a current or historic level that can sustain distributions on preferred or common units or support an increase in quarterly cash distributions on common units. Our partnership agreement does not permit adjustments for certain non-cash items, such as net losses on the sale and disposition of assets and goodwill and long-lived asset impairment charges.

Distributable cash flow should not be considered as an alternative to net income, operating income, cash flow from operations, or any other measure of financial performance presented in accordance with GAAP. In addition, distributable cash flow may not be comparable to distributable cash flow or similarly titled measures of other companies.

About Global Partners LP

With approximately 1,550 locations primarily in the Northeast, Global Partners is one of the region’s largest independent owners, suppliers and operators of gasoline stations and convenience stores. Global also owns, controls or has access to one of the largest terminal networks in New England and New York, through which it distributes gasoline, distillates, residual oil and renewable fuels to wholesalers, retailers and commercial customers. In addition, Global engages in the transportation of petroleum products and renewable fuels by rail from the mid-continental U.S. and Canada. Global, a master limited partnership, trades on the New York Stock Exchange under the ticker symbol “GLP.” For additional information, visit www.globalp.com.

Forward-looking Statements

Certain statements and information in this press release may constitute “forward-looking statements.” The words “believe,” “expect,” “anticipate,” “plan,” “intend,” “foresee,” “should,” “would,” “could” or other similar expressions are intended to identify forward-looking statements, which are generally not historical in nature, although not all forward-looking statements contain such identifying words. These forward-looking statements are based on Global’s current expectations and beliefs concerning future developments and their potential effect on the Partnership. While management believes that these forward-looking statements are reasonable as and when made, there can be no assurance that future developments affecting the Partnership will be those that it anticipates. Forward-looking statements involve significant risks and uncertainties (some of which are beyond the Partnership’s control) including, without limitation, the impact and duration of the COVID-19 pandemic, uncertainty around the timing of an economic recovery in the United States which will impact the demand for the products we sell and the services that we provide, uncertainty around the impact of the COVID-19 pandemic to our counterparties and our customers and their corresponding ability to perform their obligations and/or utilize the products we sell and/or services we provide, uncertainty around the impact and duration of federal, state and municipal regulations related to the COVID-19 pandemic, and assumptions that could cause actual results to differ materially from the Partnership’s historical experience and present expectations or projections.

For additional information regarding known material factors that could cause actual results to differ from the Partnership’s projected results, please see Global’s filings with the SEC, including its Annual Report on Form 10-K, Quarterly Reports on Form 10-Q and Current Reports on Form 8-K.

Readers are cautioned not to place undue reliance on forward-looking statements, which speak only as of the date hereof. Global undertakes no obligation to publicly update or revise any forward-looking statements after the date they are made, whether as a result of new information, future events or otherwise.

GLOBAL PARTNERS LP
CONSOLIDATED STATEMENTS OF OPERATIONS
(In thousands, except per unit data)
(Unaudited)
 
Three Months Ended
March 31,

2021

2020

Sales $

2,553,327

$

2,595,093

Cost of sales

2,408,295

2,449,355

Gross profit

145,032

145,738

 
Costs and operating expenses:
Selling, general and administrative expenses

46,324

40,923

Operating expenses

80,528

82,553

Amortization expense

2,723

2,712

Net (gain) loss on sale and disposition of assets

(475)

743

Total costs and operating expenses

129,100

126,931

 
Operating income

15,932

18,807

 
Interest expense

(20,359)

(21,601)

 
Loss before income tax benefit

(4,427)

(2,794)

 
Income tax benefit

130

5,869

 
Net (loss) income

(4,297)

3,075

 
Net loss attributable to noncontrolling interest

-

201

 
Net (loss) income attributable to Global Partners LP

(4,297)

3,276

 
Less: General partner's interest in net (loss) income, including
incentive distribution rights

739

22

Less: Preferred limited partner interest in net income

1,820

1,682

 
Net (loss) income attributable to common limited partners $

(6,856)

$

1,572

 
Basic net (loss) income per common limited partner unit (1) $

(0.20)

$

0.05

 
Diluted net (loss) income per common limited partner unit (1) $

(0.20)

$

0.05

 
Basic weighted average common limited partner units outstanding

33,967

33,868

 
Diluted weighted average limited partner units outstanding

34,296

34,275

(1) Under the Partnership's partnership agreement, for any quarterly period, the incentive distribution rights ("IDRs") participate in net income only to the extent of the amount of cash distributions actually declared, thereby excluding the IDRs from participating in the Partnership's undistributed net income or losses. Accordingly, the Partnership's undistributed net income or losses is assumed to be allocated to the common unitholders and to the General Partner's general partner interest. Net income attributable to common limited partners is divided by the weighted average common units outstanding in computing the net income per limited partner unit.
GLOBAL PARTNERS LP
CONSOLIDATED BALANCE SHEETS
(In thousands)
(Unaudited)
 
 
March 31, December 31,

2021

2020

Assets
Current assets:
Cash and cash equivalents $

11,598

$

9,714

Accounts receivable, net

314,179

227,317

Accounts receivable - affiliates

4,520

2,410

Inventories

468,841

384,432

Brokerage margin deposits

31,348

21,661

Derivative assets

8,584

16,556

Prepaid expenses and other current assets

85,949

119,340

Total current assets

925,019

781,430

 
Property and equipment, net

1,075,328

1,082,486

Right of use assets, net

294,027

290,506

Intangible assets, net

34,002

35,925

Goodwill

328,569

323,565

Other assets

27,139

26,588

 
Total assets $

2,684,084

$

2,540,500


Liabilities and partners' equity
Current liabilities:
Accounts payable $

237,991

$

207,873

Working capital revolving credit facility - current portion

202,400

34,400

Lease liability - current portion

74,182

75,376

Environmental liabilities - current portion

4,455

4,455

Trustee taxes payable

40,930

36,598

Accrued expenses and other current liabilities

93,936

126,774

Derivative liabilities

21,001

12,055

Total current liabilities

674,895

497,531

 
Working capital revolving credit facility - less current portion

150,000

150,000

Revolving credit facility

33,400

122,000

Senior notes

738,031

737,605

Long-term lease liability - less current portion

231,105

226,648

Environmental liabilities - less current portion

48,468

49,166

Financing obligations

146,064

146,535

Deferred tax liabilities

56,058

56,218

Other long-term liabilities

61,369

59,298

Total liabilities

2,139,390

2,045,001

 
Partners' equity

544,694

495,499

 
Total liabilities and partners' equity $

2,684,084

$

2,540,500

GLOBAL PARTNERS LP  
FINANCIAL RECONCILIATIONS  
(In thousands)  
(Unaudited)  
  Three Months Ended
  March 31,
 

2021

2020

Reconciliation of gross profit to product margin  
Wholesale segment: (1)  
Gasoline and gasoline blendstocks   $

16,405

$

9,547

Crude oil  

(4,527)

(4,470)

Other oils and related products  

18,615

386

Total  

30,493

5,463

Gasoline Distribution and Station Operations segment:  
Gasoline distribution  

80,252

107,230

Station operations  

50,157

48,641

Total  

130,409

155,871

Commercial segment (1)  

4,190

5,336

Combined product margin  

165,092

166,670

Depreciation allocated to cost of sales  

(20,060)

(20,932)

Gross profit   $

145,032

$

145,738

   
Reconciliation of net (loss) income to EBITDA and Adjusted EBITDA  
Net (loss) income   $

(4,297)

$

3,075

Net loss attributable to noncontrolling interest  

-

201

Net (loss) income attributable to Global Partners LP  

(4,297)

3,276

Depreciation and amortization  

24,975

25,668

Interest expense  

20,359

21,601

Income tax benefit  

(130)

(5,869)

EBITDA  

40,907

44,676

Net (gain) loss on sale and disposition of assets  

(475)

743

Adjusted EBITDA   $

40,432

$

45,419

   
Reconciliation of net cash (used in) provided by operating activities to EBITDA and Adjusted EBITDA  
Net cash (used in) provided by operating activities   $

(105,983)

$

137,917

Net changes in operating assets and liabilities and certain non-cash items  

126,661

(109,067)

Net cash from operating activities and changes in operating  
assets and liabilities attributable to noncontrolling interest  

-

94

Interest expense  

20,359

21,601

Income tax benefit  

(130)

(5,869)

EBITDA  

40,907

44,676

Net (gain) loss on sale and disposition of assets  

(475)

743

Adjusted EBITDA   $

40,432

$

45,419

   
Reconciliation of net (loss) income to distributable cash flow  
Net (loss) income   $

(4,297)

$

3,075

Net loss attributable to noncontrolling interest  

-

201

Net (loss) income attributable to Global Partners LP  

(4,297)

3,276

Depreciation and amortization  

24,975

25,668

Amortization of deferred financing fees  

1,344

1,261

Amortization of routine bank refinancing fees  

(1,037)

(940)

Maintenance capital expenditures  

(7,031)

(7,280)

Distributable cash flow (2)(3)  

13,954

21,985

Distributions to preferred unitholders (4)  

(1,820)

(1,682)

Distributable cash flow after distributions to preferred unitholders   $

12,134

$

20,303

   
Reconciliation of net cash (used in) provided by operating activities to distributable cash flow  
Net cash (used in) provided by operating activities   $

(105,983)

$

137,917

Net changes in operating assets and liabilities and certain non-cash items  

126,661

(109,067)

Net cash from operating activities and changes in operating  
assets and liabilities attributable to noncontrolling interest  

-

94

Amortization of deferred financing fees  

1,344

1,261

Amortization of routine bank refinancing fees  

(1,037)

(940)

Maintenance capital expenditures  

(7,031)

(7,280)

Distributable cash flow (2)(3)  

13,954

21,985

Distributions to preferred unitholders (4)  

(1,820)

(1,682)

Distributable cash flow after distributions to preferred unitholders   $

12,134

$

20,303

(1)

Segment reporting results for the three months ended March 31, 2020 have been reclassified between the Wholesale and Commercial segments to conform to the Partnership's current presentation.

(2)

As defined by the Partnership's partnership agreement, distributable cash flow is not adjusted for certain non-cash items, such as net losses on the sale and disposition of assets and goodwill and long-lived asset impairment charges.

(3)

Distributable cash flow for the three months ended March 31, 2020 includes a $6.3 million income tax benefit related to the CARES Act net operating loss carryback provisions.

(4)

Distributions to preferred unitholders represent the distributions payable to the Series A preferred unitholders and the Series B preferred unitholders earned during the period. Distributions on the Series A preferred units and the Series B preferred unit are cumulative and payable quarterly in arrears on February 15, May 15, August 15 and November 15 of each year.


Contacts

Daphne H. Foster
Chief Financial Officer
Global Partners LP
(781) 894-8800

Edward J. Faneuil
Executive Vice President, General Counsel and Secretary
Global Partners LP
(781) 894-8800

LOS ANGELES--(BUSINESS WIRE)--#EVs--Fisker Inc. (“Fisker” or “Company”) (NYSE: FSR) announced that, following a statement published by the Staff of the U.S. Securities and Exchange Commission on April 12, 2021 (the “Staff Statement”) regarding the accounting and reporting of warrants issued by special purpose acquisition companies (“SPACs”), the consolidated financial statement filed in its Annual Report on Form 10-K for the year ended December 31, 2020 should be restated.


The restatement will be isolated to this change in accounting treatment, which the Company believes also impacts several hundred companies, and has no impact on historical or forward-looking cash flow and operations of the Company.

The restatement pertains to the accounting treatment for both public and private placement warrants that were outstanding at the time of the business combination of legacy Fisker Inc. with Spartan Energy Acquisition Corp. on October 29, 2020.

As of March 31, 2021, Fisker had approximately 3.4 million public warrants and 0 private placement warrants outstanding, approximately 12% of the 27.76 million warrants originally issued by Spartan Energy Acquisition Corp. As of April 19, 2021, upon the completion of the previously announced cashless warrant redemption, there were no longer any warrants outstanding.

Consistent with market practice among SPACs, these warrants had previously been accounted for as equity. In consideration of the Staff Statement, Fisker intends to account for the warrants as liabilities. The Company preliminarily estimates that the change in accounting method will cause non-cash non-operating expenses in the Statement of Operations for the three and twelve months ended December 31, 2020 to increase by approximately $75 to $85 million. The Company expects that there will be no impact to its historically reported cash and cash equivalents, or cash flows from operating, investing or financing activities. The Company anticipates that the impact of remeasuring the Warrants to their fair values on first quarter 2021 non-cash non-operating expense will be between $145 million and $155 million. These estimates are unaudited, preliminary, and subject to change as management completes the restatement.

About Fisker Inc.

California-based Fisker Inc. is revolutionizing the automotive industry by developing the most emotionally desirable and eco-friendly electric vehicles on Earth. Passionately driven by a vision of a clean future for all, the company is on a mission to become the No. 1 e-mobility service provider with the world’s most sustainable vehicles. To learn more, visit www.FiskerInc.com – and enjoy exclusive content across Fisker’s social media channels: Facebook, Instagram, Twitter, YouTube and LinkedIn. Download the revolutionary new Fisker mobile app from the App Store or Google Play store.


Contacts

Fisker Inc.
Simon Sproule, SVP, Communications
310.374.6177
This email address is being protected from spambots. You need JavaScript enabled to view it.

Dan Galves, VP, Investor Relations
This email address is being protected from spambots. You need JavaScript enabled to view it.

Free charging facilities expand to 19,000+ piles across 164 Chinese cities

GUANGZHOU, China--(BUSINESS WIRE)--XPeng Motors (NYSE: XPEV) today announced that its own-brand charging network across China has now reached 1,140 stations, spanning 164 Chinese cities.


XPeng is the first new EV maker in China to offer free lifetime charging services for its customers, demonstrating its strong commitment to popularizing smart EVs by providing easy access to free charging facilities, enhancing customer experience and increasing EV user convenience.

The company has built a comprehensive charging network, now including 19,019 free charging and supercharging piles in 1,140 charging stations, covering city roads and highways across 164 Chinese cities. These complement XPeng’s smart EV product offering and the variety of battery power and range options, offering the flexibility and convenience for different customer needs and driving scenarios.

Last week, XPeng launched another 13 charging stations along the 2,250 km Sichuan – Tibet expressway. XPeng customers now have access to its free charging facilities every 170 km along this scenic route, from 500 meters to 4,100 meters above sea level.

XPeng focuses on facilitating urban mobility, as well as long-distance inter-city driving convenience for customers. It is one of the few smart EV makers in China that is building out its own charging stations, as well as partnering with other established charging networks.

The company plans to expand its free charging service network further during 2021 to 200 cities, covering a broader range of locations, including highways and airports.

About XPeng

XPeng Inc. is a leading Chinese smart electric vehicle company that designs, develops, manufactures, and markets Smart EVs that appeal to the large and growing base of technology-savvy middle-class consumers in China. Its mission is to drive Smart EV transformation with technology and data, shaping the mobility experience of the future. In order to optimize its customers’ mobility experience, XPeng develops in-house its full-stack autonomous driving technology and in-car intelligent operating system, as well as core vehicle systems including powertrain and the electrification/electronic architecture. XPeng is headquartered in Guangzhou, China, with offices in Beijing, Shanghai, Silicon Valley, and San Diego. The Company’s Smart EVs are manufactured at plants in Zhaoqing and Zhengzhou, located in Guangdong and Henan provinces, respectively. For more information, please visit https://en.xiaopeng.com.


Contacts

For Media Enquiries:
Marie Cheung, XPeng Inc. +852-9750-5170 or +86-1550-7577-546 This email address is being protected from spambots. You need JavaScript enabled to view it.

BOCA RATON, Fla.--(BUSINESS WIRE)--MiX Telematics (NYSE: MIXT and JSE: MIX), a leading SaaS global provider of connected fleet and mobile asset management solutions, today announced it will report its fourth quarter and fiscal year 2021 results for the period ended March 31, 2021 before the U.S. financial markets open on Thursday, May 27, 2021.

MiX Telematics management will also host a conference call and audio webcast at 8:00 a.m. (Eastern Daylight Time) and 2:00 p.m. (South African Time) on Thursday, May 27, 2021 to discuss the Company's financial results and current business outlook.

  • The live webcast of the call will be available at the “Investor Information” page of the Company’s website, http://investor.mixtelematics.com.
  • To access the call, dial 1-877-451-6152 (within the United States) or 0 800 983 831 (within South Africa) or 1-201-389-0879 (outside of the United States). The conference ID is 13719688.
  • A replay of this conference call will be available for a limited time at 1-844-512-2921 (within the United States) or 1-412-317-6671 (within South Africa or outside of the United States). The replay conference ID is 13719688.
  • A replay of the webcast will also be available for a limited time at http://investor.mixtelematics.com.

About MiX Telematics Limited

MiX Telematics is a leading global provider of fleet and mobile asset management solutions delivered as SaaS to 750,000 global subscribers spanning more than 120 countries. The company's products and services provide enterprise fleets, small fleets and consumers with solutions for efficiency, safety, compliance and security. MiX Telematics was founded in 1996 and has offices in South Africa, the United Kingdom, the United States, Uganda, Brazil, Mexico, Australia and the United Arab Emirates as well as a network of more than 130 fleet partners worldwide. MiX Telematics shares are publicly traded on the Johannesburg Stock Exchange (JSE: MIX) and on the New York Stock Exchange (NYSE: MIXT). For more information, visit www.mixtelematics.com.


Contacts

Investors:
Brian Denyeau
ICR for MiX Telematics
This email address is being protected from spambots. You need JavaScript enabled to view it.
+1-855-564-9835

JENBACH, Austria--(BUSINESS WIRE)--INNIO Jenbacher’s commitment to a climate-neutral, greener and more secure energy future was recognized by EcoVadis with a Silver Medal Rating for 2021, placing INNIO Jenbacher in the top 17% of its peers working towards sustainability. The prestigious EcoVadis sustainability ratings are based on a methodological framework that takes a deep dive into the policies and actions of companies as well as their published reports on the environment, labor and human rights, ethics and sustainable procurement.


INNIO’s sustainability strategy places sustainable growth at the forefront of its global efforts with its most recent formation of a Sustainability Review Board, tasked with developing INNIO’s Environmental and Social Governance (ESG) goals and strategy in close alignment with INNIO’s growth strategy as well as international standards such as the United Nations’ Sustainable Development Goals (SDGs) and Global Reporting Initiative (GRI).

“At INNIO we believe that the sustainability journey is a collaborative process involving all parts of our organization, from employees to communities to customers to suppliers,” said Carlos Lange, president and CEO of INNIO. “Our holistic approach to sustainability puts our products at the forefront of technology development, looks at reducing greenhouse emissions and waste on-site, fully engages employees at the workplace, and provides communities with unwavering support through diversity and inclusion efforts.”

As a global provider of energy services, equipment and digital solutions for power generation and gas compression at or near the point of use, INNIO is dedicated to assist in the move toward a greener energy future. In its capacity as a thought leader, INNIO always seeks new energy sources and better energy solutions to support its customers and their communities, while investing in its Jenbacher and Waukesha product lines and digital solutions to support the energy transition. Its gas engines—many of which have passed stringent sustainability tests for efficiency and energy savings—offer industry-leading emission levels and reduced carbon footprints. INNIO’s gas engine fleet helps to provide a more sustainable future by developing new, innovative low-carbon technologies, such as its hydrogen-ready Jenbacher gas engine technology. Its Waukesha gas engines help customers achieve low emissions and responsibly produce natural gas now and in the future. INNIO’s digital products and solutions play an important role in reduction of emissions and remote smart management of assets for our customers.

As part of its ESG strategy, INNIO recently took a bold step in advancing sustainability in the power industry. In close collaboration with HanseWerk Natur, INNIO initiated field testing of a 1-megawatt (MW) pilot power plant with a Jenbacher gas engine that represents the world’s first large-scale gas engine in the 1 MW range that can be operated either with 100% natural gas or with variable hydrogen-natural gas mixtures up to 100% hydrogen. This joint project serves as a key milestone on the path toward climate neutrality since green hydrogen is an important part of the solution. A particularly attractive aspect of the innovative Jenbacher gas engine technology is that existing natural gas engines can also be converted to run on hydrogen, offering operators security of investment. This “Green Utility” provides the added benefit that not only can the existing infrastructure be utilized in the longer term, but it can also be deployed in a way that is environmentally sound. INNIO‘s proactive sustainability efforts have been key to transforming climate change challenges into opportunities and extending its contribution and leadership in the global energy transition.

About INNIO

INNIO is a leading provider of renewable gas, natural gas, and hydrogen-based solutions and services for power generation and gas compression at or near the point of use. With our Jenbacher and Waukesha gas engines, INNIO helps to provide communities, industry and the public access to sustainable, reliable and economical power ranging from 200 kW to 10 MW. We also provide life-cycle support and digital solutions to the more than 53,000 delivered gas engines globally, through our service network in more than 100 countries. We deliver innovative technology driven by decarbonization, decentralization, and digitalization to help lead the way to a greener future. Headquartered in Jenbach, Austria, the business also has primary operations in Welland, Ontario, Canada, and Waukesha, Wisconsin, U.S. For more information, visit the company's website at www.innio.com. Follow INNIO on Twitter and LinkedIn.


Contacts

Susanne Reichelt
INNIO
+43 664 80833 2382
This email address is being protected from spambots. You need JavaScript enabled to view it.

  • Company exploring the world’s largest known deposit of battery metals in deep-sea polymetallic nodules can help Europe decarbonise swiftly and effectively.
  • A reliable and responsible supply of metals for the clean energy transition will be key if Europe is to meet its increasingly ambitious emissions reductions targets.
  • Soaring demand for electric vehicle battery metals due to the phaseout of gasoline-powered cars could see shortages of key metals such as nickel and copper as early as 2024.
  • The Metals Company’s deep-sea nodule resource brings the potential for an abundant and low-cost supply of critical battery metals that can be processed in Europe with a fraction of the environmental and social impacts of land ores.

VANCOUVER, British Columbia--(BUSINESS WIRE)--Today, The Metals Company (formerly DeepGreen), a developer of the world’s largest and highest-grade estimated source of battery metals, announced it has joined two of the European Union’s foremost industrial alliances—the European Raw Materials Alliance (ERMA) and the European Battery Alliance (EBA)—as the bloc advances its plans to become a global leader in the sustainable production of the batteries necessary to store clean energy and power electric vehicles (EVs).


As a member of these industrial alliances, The Metals Company—which announced in March its plans to go public via a merger with the Sustainable Opportunities Acquisition Corporation (NYSE: SOAC)—brings a new, scalable source of battery metals to the table in the form of polymetallic nodules found unattached on the deep seafloor in the Pacific Ocean, which can help deliver upon their mandate for a diverse, reliable and responsible supply of critical minerals needed for low-carbon technologies.

Under its Green Deal, the European Union has committed to becoming the first net-zero-carbon continent by 2050 and is investing heavily in electrification to achieve a 90% reduction in transport emissions. Batteries will play a key role in this transition and Europe’s largest automaker, Volkswagen, recently committed to building a collective 240GWh of battery capacity across six gigafactories by 2030—eclipsing total global consumption in 2020. But insufficient supplies of critical minerals could yet imperil strengthened climate action, according to the International Energy Agency (IEA). Dwindling discoveries of new metal deposits means shortages of key metals like nickel and copper can be expected from 2024-2025. Meanwhile, rising raw materials prices risk undermining EV manufacturers’ efforts to drive down the cost of EV batteries necessary for mass adoption.

“We’re pleased to join both ERMA and EBA right at this pivotal time in the mass electrification of Europe’s transportation,” said Gerard Barron, Chairman and CEO of The Metals Company. “Sourcing battery metals is the single biggest hurdle facing the clean energy transition and, as calls for supply chain diversification grow louder, we look forward to bringing our abundant, low-cost source to Europe’s doorstep, which could electrify every car on European roads with a fraction of the ESG impacts.”

Like fossil fuel extraction, conventional metals extraction comes at a steep cost to people and the planet, leading to vast deforestation in some of the planet’s most biodiverse carbon sinks. This is generating the world’s largest industrial waste stream and gigatons of emissions, poisoning ecosystems and human health, and driving potential labor exploitation.

Polymetallic nodules, by contrast, contain high grades of four key metals in a single ore and, lying loose on the seafloor, they can be collected without the drilling or blasting. Lacking any toxic levels of heavy elements, The Metals Company is able to source battery metals from nodules while generating zero solid waste and no toxic tailings, and up to 90% less carbon emissions.

With no need for fixed mine infrastructure, nodules can be shipped anywhere in the world for processing and offer the largest known deposit of battery-grade metals on the planet with which to strengthen domestic sourcing of critical minerals and support Europe’s ambitions to become a global leader in sustainable battery production. The Metals Company has exclusive access to three exploration areas sponsored by Pacific states, containing resources sufficient for 280 million EV batteries. As part of its aim to become a leading metals supplier to the continent, potential sites for up to three processing plants—powered by renewables—are currently under consideration.

Both industry alliances will play a leading role in the development of a domestic battery recycling industry. But a lack of available material means significant quantities of new metal will be needed and, as noted in the IEA’s latest report, even under a significant expansion in the recycling of spent batteries, demand would only be reduced by 10%. The Metals Company sees deep-sea nodules as a means to reducing the environmental bill of conventional metal production, while building up a global inventory and circular economy for metals to dramatically reduce—and eventually eliminate—the need to take them from the planet, in line with the bloc’s Circular Economy Action Plan.

About The Metals Company

The Metals Company Metals Inc. is a Canadian developer of lower-impact battery metals from seafloor polymetallic nodules, on a dual mission: (1) supply metals for the clean energy transition with the least possible negative environmental and social impact and (2) accelerate the transition to a circular metal economy. The company through its subsidiaries holds exploration and commercial rights to three polymetallic nodule contract areas in the Clarion Clipperton Zone of the Pacific Ocean regulated by the International Seabed Authority and sponsored by the governments of Nauru, Kiribati and the Kingdom of Tonga. Earlier this month, The Metals Company announced that it had entered into a business combination agreement with Sustainable Opportunities Acquisition Corporation (SOAC) to accelerate project development and take it public on NASDAQ as ‘The Metals Company’. More information is available at www.deep.green.


Contacts

Media
Rory Usher | DeepGreen Metals | This email address is being protected from spambots. You need JavaScript enabled to view it.
Chelsea Lauber | Antenna Group | This email address is being protected from spambots. You need JavaScript enabled to view it.
Investors
This email address is being protected from spambots. You need JavaScript enabled to view it.

SAN ANTONIO--(BUSINESS WIRE)--Valero Energy Corporation (NYSE: VLO, “Valero”) announced today that it will be participating in the Citi Global Energy & Utilities Virtual Conference on May 12, 2021.


About Valero

Valero Energy Corporation, through its subsidiaries (collectively, “Valero”), is an international manufacturer and marketer of transportation fuels and petrochemical products. Valero is a Fortune 50 company based in San Antonio, Texas, and it operates 15 petroleum refineries with a combined throughput capacity of approximately 3.2 million barrels per day and 13 ethanol plants with a combined production capacity of approximately 1.7 billion gallons per year. The petroleum refineries are located in the United States (U.S.), Canada and the United Kingdom (U.K.), and the ethanol plants are located in the Mid-Continent region of the U.S. Valero is also a joint venture partner in Diamond Green Diesel, which owns and operates a renewable diesel plant in Norco, Louisiana. Diamond Green Diesel is North America’s largest biomass-based diesel plant. Valero sells its products in the wholesale rack or bulk markets in the U.S., Canada, the U.K., Ireland and Latin America. Approximately 7,000 outlets carry Valero’s brand names. Please visit www.investorvalero.com for more information.


Contacts

Valero Contacts
Investors:
Homer Bhullar, Vice President – Investor Relations & Finance, 210-345-1982
Eric Herbort, Senior Manager – Investor Relations, 210-345-3331
Gautam Srivastava, Senior Manager – Investor Relations, 210-345-3992

Media:
Lillian Riojas, Executive Director – Media Relations and Communications, 210-345-5002

MINNEAPOLIS--(BUSINESS WIRE)--Northern Oil and Gas, Inc. (NYSE American: NOG) today announced that its Board of Directors has declared a cash dividend on the Company’s common stock in the amount of $0.03 per share. The dividend is payable on July 30, 2021 to stockholders of record as of the close of business on June 30, 2021.


ABOUT NORTHERN OIL AND GAS

Northern Oil and Gas, Inc. is a company with a primary strategy of investing in non-operated minority working and mineral interests in oil & gas properties, with a core area of focus in the premier basins within the United States.

More information about Northern Oil and Gas, Inc. can be found at www.NorthernOil.com.


Contacts

Mike Kelly, CFA
Chief Strategy Officer
(952) 476-9800
This email address is being protected from spambots. You need JavaScript enabled to view it.

  • $127.5 million in cash and cash equivalents
  • $245.6 million in sales
  • GAAP diluted EPS of $0.02, including significant tax reserves due to proposed state tax positions ($0.06 per share)
  • Free cash flow for the quarter of $11.2 million

HOUSTON--(BUSINESS WIRE)--DXP Enterprises, Inc. (NASDAQ: DXPE) today announced financial results for the first quarter ended March 31, 2021. The following are results for the three months ended March 31, 2021, compared to the three months ended March 31, 2020 and December 31, 2020, where appropriate. A reconciliation of the non-GAAP financial measures can be found in the back of this press release.


First Quarter 2021 financial highlights:

  • Sales increased 5.6 percent sequentially to $245.6 million, compared to $232.7 million for the fourth quarter of 2020 and decreased 18.4% compared to $301.0 million for the first quarter of 2020.
  • Earnings per diluted share for the first quarter was $0.02 based upon 20.0 million diluted shares, compared to $0.31 per share in the first quarter of March 31, 2020, based on 18.6 million diluted shares.
  • Adjusted earnings before interest, taxes, depreciation and amortization (Adjusted EBITDA) for the first quarter of 2021 was $13.9 million compared to $13.6 million for the fourth quarter of 2020 and $18.8 million for the first quarter of 2020.

Post-Quarter highlights:

  • Closed acquisition of Carter & Verplanck
  • Furthers efforts to diversify DXP end markets and create national water and wastewater platform

David R. Little, Chairman and CEO commented, “Our first quarter results reflect sequential sales growth driven by acquisitions, strong free cash flow and continued efforts to match costs to the demand of our business. We are encouraged by the sequential increases. As we look ahead to the rest of 2021, we remain optimistic that the global and U.S. economy will recover from the impact of the pandemic, in particularly, oil demand and capital projects spending which typically lags most cycles. Thank you to all our customers, vendors and DXPeople for the support and efforts in keeping safety at the forefront. DXP’s first quarter 2021 sales were $245.6 million, or a 5.6 percent increase over the fourth quarter. DXP’s industrial end markets, which is 67 percent of our business (including the recent acquisitions), appears to have found some legs and shows signs of positive upward movement. During the first quarter, sales were $186.4 million for Service Centers, $36.0 million for Supply Chain Services and $23.2 million for Innovative Pumping Solutions.

We continue to anticipate a better fiscal year 2021. As such, we remain focused on improving our ability to serve existing and new customers, continuing to focus on enhancing and improving our operational execution, investing in products and people and strategically aligning DXP for the future.”

Kent Yee, CFO commented, “Our first quarter sequential increase of 5.6 percent was great to see in addition to the $11.2 million of free cash flow. We see bright spots as the world attempts to recover from the global pandemic and vaccination efforts increase. As of March 31, 2021, we had $127.5 million in cash and cash equivalents on the balance sheet. Our senior leverage was 2.82:1, well under our covenant of 5.75:1. We continue to execute our acquisition strategy and diversify our end market exposure. We are excited by the tone at DXP and anticipate that this should continue to show in our financial results. We anticipate the second half of the year to be stronger than the first half as momentum builds.”

Financial Strength and Liquidity

Net debt, calculated as total long-term debt, net of cash and cash equivalents, on our balance sheet as of March 31, 2021, was down to $201.7 million compared to $212.6 million at December 31, 2020. As of March 31, 2021, DXP has approximately $258.6 million in liquidity, consisting of $127.4 million in cash on hand and approximately $131.2 million in availability under our ABL facility.

We will host a conference call regarding March 31, 2021 first quarter results on the Company’s website (www.dxpe.com) Friday, May 7, 2021 at 10:30 am CST. Web participants are encouraged to go to the Company’s website at least 15 minutes prior to the start of the call to register, download and install any necessary audio software. The online archived replay will be available immediately after the conference call at www.dxpe.com.

Non-GAAP Financial Measures

DXP supplements reporting of net income with non-GAAP measurements, including EBITDA, adjusted EBITDA, free cash flow, non-GAAP net income and net debt. This supplemental information should not be considered in isolation or as a substitute for the unaudited GAAP measurements. Additional information regarding EBITDA, free cash flow and non-GAAP net income referred to in this press release are included below under “Unaudited Reconciliation of Non-GAAP Financial Information.”

The Company believes EBITDA provides additional information about: (i) operating performance, because it assists in comparing the operating performance of the business, as it removes the impact of non-cash depreciation and amortization expense as well as items not directly resulting from core operations such as interest expense and income taxes and (ii) the performance and the effectiveness of operational strategies. Additionally, EBITDA performance is a component of a measure of the Company’s financial covenants under its credit facility. Furthermore, some investors use EBITDA as a supplemental measure to evaluate the overall operating performance of companies in the industry. Management believes that some investors’ understanding of performance is enhanced by including this non-GAAP financial measure as a reasonable basis for comparing ongoing results of operations. By providing this non-GAAP financial measure, together with a reconciliation from net income, the Company believes it is enhancing investors’ understanding of the business and results of operations, as well as assisting investors in evaluating how well the Company is executing strategic initiatives.

About DXP Enterprises, Inc.

DXP Enterprises, Inc. is a leading products and service distributor that adds value and total cost savings solutions to industrial customers throughout the United States, Canada and Dubai. DXP provides innovative pumping solutions, supply chain services and maintenance, repair, operating and production (“MROP”) services that emphasize and utilize DXP’s vast product knowledge and technical expertise in rotating equipment, bearings, power transmission, metal working, industrial supplies and safety products and services. DXP’s breadth of MROP products and service solutions allows DXP to be flexible and customer-driven, creating competitive advantages for our customers. DXP’s business segments include Service Centers, Innovative Pumping Solutions and Supply Chain Services. For more information, go to www.dxpe.com.

The Private Securities Litigation Reform Act of 1995 provides a “safe-harbor” for forward-looking statements. Certain information included in this press release (as well as information included in oral statements or other written statements made by or to be made by the Company) contains statements that are forward-looking. These forward-looking statements include without limitation those about the Company’s expectations regarding the impact of the COVID-19 pandemic and the impact of low commodity prices of oil and gas; the Company’s business, the Company’s future profitability, cash flow, liquidity, and growth. Such forward-looking information involves important risks and uncertainties that could significantly affect anticipated results in the future; and accordingly, such results may differ from those expressed in any forward-looking statement made by or on behalf of the Company. These risks and uncertainties include, but are not limited to; decreases in oil and natural gas prices; decreases in oil and natural gas industry expenditure levels, which may result from decreased oil and natural gas prices or other factors; ability to obtain needed capital, dependence on existing management, leverage and debt service, domestic or global economic conditions, economic risks related to the impact of COVID-19, ability to manage changes and the continued health or availability of management personnel and changes in customer preferences and attitudes. In some cases, you can identify forward-looking statements by terminology such as, but not limited to, “may,” “will,” “should,” “intend,” “expect,” “plan,” “anticipate,” “believe,” “estimate,” “predict,” “potential,” “goal,” or “continue” or the negative of such terms or other comparable terminology. For more information, review the Company’s filings with the Securities and Exchange Commission. More information on these risks and other potential factors that could affect the Company’s business and financial results is included in the Company’s filings with the SEC, including in the “Risk Factors” and “Management’s Discussion and Analysis of Financial Condition and Results of Operations” sections of the Company’s most recently filed periodic reports on Form 10-K and Form 10-Q and subsequent filings. The Company assumes no obligation to update any forward-looking statements or information, which speak as of their respective dates.

DXP ENTERPRISES, INC. AND SUBSIDIARIES

UNAUDITED CONDENSED CONSOLIDATED STATEMENTS OF OPERATIONS

($ thousands, except per share amounts)


Three Months Ended March 31,


2021


2020

Sales


$

245,616


$

300,983


Cost of sales


174,007


216,998


Gross profit


71,609


83,985


Selling, general and administrative expenses


65,397


73,070


Impairment and other charges


Operating income


6,212


10,915


Other income


(430)


(834)


Interest expense


5,243


4,377


Income before income taxes


1,399


7,372


Provision for income taxes*


1,271


1,724


Net income


128


5,648


Net loss attributable to NCI**


(212)


(62)


Net income attributable to DXP Enterprises, Inc.


340


5,710


Preferred stock dividend


23


23


Net income attributable to common shareholders


$

317


$

5,687


Diluted earnings per share attributable to DXP Enterprises, Inc.


$

0.02


$

0.31


Weighted average common shares and common equivalent shares outstanding


20,026


18,553


*DXP recorded a reserve against its Texas R&D tax credit due to significant proposed amendments to R&D franchise tax credits by the state of Texas that resulted in an unusually high effective tax rate for the period ended March 31, 2021.

**NCI represents non-controlling interest

Business segment financial highlights:

  • Service Centers’ revenue for the first quarter was $186.4 million, a 15.6 percent sequential increase and an increase of 2.1 percent year-over-year with a 11.9 percent operating income margin.
  • Innovative Pumping Solutions’ revenue for the first quarter was $23.2 million, a sequential decrease of 34.7 percent and a decrease of 66.8 percent year-over-year with a 4.1 percent operating income margin.
  • Supply Chain Services’ revenue for the first quarter was $36.0 million, a 0.5 percent sequential increase and a decrease of 25.6 percent year-over-year with a 6.5 percent operating income margin.

SEGMENT DATA
($ thousands, unaudited)


Three Months Ended September 30,

Sales


2021


2020

Service Centers


$

186,398


$

182,585


Innovative Pumping Solutions


23,245


70,021


Supply Chain Services


35,973


48,377


Total DXP Sales


$

245,616


$

300,983


Three Months Ended March 31,

Operating Income


2021


2020

Service Centers


$

22,116


$

16,926


Innovative Pumping Solutions


947


10,428


Supply Chain Services


2,323


3,755


Total segments operating income


$

25,386


$

31,109


Reconciliation of Operating Income for Reportable Segments
($ thousands, unaudited)


Three Months Ended March 31,


2021


2020

Operating income for reportable segments


$

25,386


$

31,109


Adjustment for:


Amortization of intangibles


4,146


3,197


Corporate expenses


15,028


16,997


Total operating income


$

6,212


$

10,915


Interest expense


5,243


4,377


Other income


(430)


(834)


Income before income taxes


$

1,399


$

7,372


Unaudited Reconciliation of Non-GAAP Financial Information
($ thousands, unaudited)

The following table is a reconciliation of EBITDA and adjusted EBITDA, a non-GAAP financial measure, to income before taxes, calculated and reported in accordance with U.S. GAAP.


Three Months Ended March 31,


2021


2020

Income before income taxes


1,399


7,372


Plus: interest expense


5,243


4,377


Plus: depreciation and amortization


6,626


6,025


EBITDA


$

13,268


$

17,774


Plus: NCI loss income before tax*


283


82


Plus: stock compensation expense


380


904


Adjusted EBITDA


$

13,931


$

18,760


* NCI represents non-controlling interest


DXP ENTERPRISES, INC. AND SUBSIDIARIES
UNAUDITED CONDENSED CONSOLIDATED BALANCE SHEETS
($ thousands, except per share amounts)


March 31, 2021


December 31, 2020

ASSETS


Current assets:


Cash


$

127,361


$

117,353


Restricted cash


91


91


Accounts receivable, net of allowances for doubtful accounts


168,003


163,429


Inventories


103,407


97,071


Costs and estimated profits in excess of billings


14,415


18,459


Prepaid expenses and other current assets


7,534


4,548


Federal income taxes receivable


5,773


5,632


Total current assets


$

426,584


$

406,583


Property and equipment, net


54,110


56,899


Goodwill


248,499


248,339


Other intangible assets, net of accumulated amortization


76,008


80,088


Operating lease right-of-use assets


59,949


55,188


Other long-term assets


4,332


4,764


Total assets


$

869,482


$

851,861


LIABILITIES AND EQUITY


Current liabilities:


Current maturities of long-term debt


$

3,300


$

3,300


Trade accounts payable


81,595


75,744


Accrued wages and benefits


19,179


20,621


Customer advances


3,967


3,688


Billings in excess of costs and estimated profits


5,950


4,061


Current-portion operating lease liabilities


17,590


15,891


Other current liabilities


21,775


20,834


Total current liabilities


$

153,356


$

144,139


Long-term debt, less unamortized debt issuance costs


316,741


317,139


Long-term operating lease liabilities


41,267


38,010


Other long-term liabilities


2,930


2,930


Deferred income taxes


2,248


1,777


Total long-term liabilities


$

363,186


$

359,856


Total Liabilities


$

516,542


$

503,995


Equity:


Total DXP Enterprises, Inc. equity


352,354


347,068


Non-controlling interest


586


798


Total Equity


$

352,940


$

347,866


Total liabilities and equity


$

869,482


$

851,861


Unaudited Reconciliation of Non-GAAP Financial Information
($ thousands, unaudited)

The following table is a reconciliation of free cash flow, a non-GAAP financial measure, to cash flow from operating activities, calculated and reported in accordance with U.S. GAAP.


Three Months Ended March 31,


2021


2020


Net cash from operating activities


$

10,552


$

(1,612)


Less: purchases of property and equipment


680


3,235


Plus: proceeds from sales of property and equipment


1,297


Free cash flow


$

11,169


$

(4,847)


Contacts

Kent Yee (713) 996-4700
Senior Vice President, CFO
www.dxpe.com

  • ESS Tech, Inc. has entered into a definitive business combination agreement with ACON S2 Acquisition Corp. (NASDAQ: STWO); upon closing, the combined company expects to be listed on the New York Stock Exchange under the ticker symbol “GWH.”
  • ESS has developed a category-defining technology, an environmentally friendly, low-cost, long-duration storage battery engineered to support renewables and stabilize the electrical grid.
  • Built from earth-abundant materials, the ESS solution can be deployed in a wide variety of environments, can operate across a wide temperature range and poses no explosion risk.
  • Disrupting a large and fast-growing market, ESS is valued at approximately $1.1 billion, offering investors an attractive opportunity to invest in a high-growth, genuinely sustainable business that enables our renewable future.
  • The business combination is expected to provide approximately $465 million in net proceeds to the combined company (assuming no redemptions), including a $250 million fully committed PIPE from top-tier institutional investors, including Fidelity Management & Research Company LLC, primarily to fund manufacturing expansion to 16 GWh across three continents.
  • Additionally, existing investors SB Energy (SoftBank Group Corp.), Breakthrough Energy Ventures and BASF Venture Capital have also participated in the PIPE, increasing their existing equity holdings in ESS, and plan to continue their successful long-term partnership with ESS.


WILSONVILLE, Ore. & WASHINGTON--(BUSINESS WIRE)--ESS Tech, Inc. (“ESS Inc.”, “ESS” or the “Company”), a manufacturer of long-duration iron flow batteries for commercial and utility-scale energy storage applications, and ACON S2 Acquisition Corp. (NASDAQ: STWO), a publicly traded special purpose acquisition company, today announced they have entered into a definitive agreement for a business combination that will result in ESS becoming a publicly listed company.

ESS was founded in 2011 with a mission to develop the cleanest, lowest-cost long-duration energy storage systems on the market. ESS developed an iron flow battery technology with innovative technological breakthroughs that is built to transform the utility grid by enabling safe, environmentally-friendly, long-duration storage. Unlike traditional lithium-ion batteries that are made from hazardous and costly materials, ESS’ patent-protected battery solutions use abundant iron, salt and water, making them environmentally safe and cost-effective energy storage systems.

Renewable energy deployment is increasing dramatically, with installation records set each year and now surpassing other forms of new generation coming online. In the long run, grid-scale energy storage will need the capabilities of long-duration storage to pick up the load for four to twelve hours when variable generation wanes, yet be flexible enough to support fast-changing grid needs. The total addressable market for energy storage systems is expected to grow at a 34% CAGR from $8 billion in 2020 to $56 billion in 2027, driven primarily by growing deployments of solar and wind power, as well as a desire to increase the power grid’s resiliency. ESS’ energy storage systems provide an optimal solution for utilities, independent power producers and microgrids seeking a reliable, safe and durable solution for four- to twelve-hour power storage that doesn’t degrade over time. That is the capability that ESS iron flow battery technology can deliver.

The goal of ESS from its inception has been to develop a fundamentally new, high-performance battery technology,” said ESS CEO Eric Dresselhuys. “Our team has delivered on that goal over the last decade by developing patent-protected iron flow battery technology that is well-suited for the grid and the environment. Unlike currently available approaches, our solution offers a green, lower lifecycle cost, energy storage system with performance that doesn’t degrade over time. We’re excited about today’s announcement as it marks the beginning of our next chapter to capitalize on burgeoning opportunities in the long-duration energy storage market. We are thrilled to team up with ACON S2 to deliver long-term value for our customers, partners, employees, shareholders and the planet as a public company.”

Craig Evans, ESS President and Co-founder stated, “Our team worked diligently for the last decade to create a storage solution that could provide a meaningful addition to the world’s transition to a renewable future. We have made incredible strides to that end and I am very excited about the next phase for ESS and our ability to accelerate our growth.”

ESS offers a remarkable technology that is a game-changer in the world’s transition to clean energy,” said Adam Kriger, CEO of ACON S2 Acquisition Corp. “With its tremendous market opportunity and leadership position in cost, performance and sustainability, ESS has a clear trajectory for growth as it scales. We are thrilled that this transaction aligns with our mission of combining with a leader in Strategic Sustainability; when a business’ pursuit of sustainability—environmental, social and/or economic—is central to driving its performance and success. We look forward to collaborating with Eric, Craig and the entire ESS team.”

Transaction Overview

The business combination values the combined company at a $1.072 billion pro forma enterprise value. The transaction will provide approximately $465 million of pro forma net cash to the combined company, assuming no redemptions by ACON S2 shareholders. Assuming no public shareholders of ACON S2 exercise their redemption rights, ESS’ existing shareholders, including its founders, will own approximately 64% of the combined company. As part of the transaction, ACON S2 raised a $250 million fully committed PIPE from institutional investors including Fidelity Management & Research Company LLC, SB Energy Global Holdings Ltd, a wholly-owned subsidiary of SoftBank Group Corp., Breakthrough Energy Ventures and BASF Venture Capital. In total, investors in the PIPE will own approximately 16% of the issued and outstanding shares of common stock of the combined company at closing. The net proceeds from this transaction will be used to increase manufacturing capacity globally and invest in extending ESS’ technology advantage.

The Boards of Directors of ESS and ACON S2 have unanimously approved the transaction. The transaction is expected to close in the third quarter.

Additional information about the proposed transaction, including a copy of the business combination and investor presentation, will be provided in a Current Report on Form 8-K to be filed by ACON S2 with the Securities and Exchange Commission and will be available on the ESS investor relations page at essinc.com/investors and at www.sec.gov.

Advisors

Deutsche Bank Securities Inc. is serving as capital markets advisor and placement agent to ACON S2. Kirkland & Ellis LLP is serving as legal counsel to ACON S2. Nomura Greentech is serving as financial advisor and Wilson Sonsini Goodrich & Rosati, P.C. is serving as legal counsel to ESS. Fried, Frank, Harris, Shriver & Jacobson LLP is serving as placement agent’s counsel on the PIPE transaction. Deutsche Bank Securities Inc., Cowen and Company and Stifel, Nicolaus & Company served as joint-book running managers for the ACON S2 initial public offering.

Conference Call and Webcast Information

ESS and ACON S2 will host a joint investor conference call to discuss the proposed transaction on May 7, 2021, at 8:00 a.m. EDT. Interested parties may listen to the prepared remarks via telephone by calling (855) 859-2056 in the U.S., or for international callers, by calling (404) 537-3406 and entering conference ID 2588795. A telephone replay will be available until May 19, 2021, by dialing (855) 859-2056 in the U.S., or for international callers, (404) 537-3406 with conference ID 2588795.

Investor Presentation

A link to the company’s investor presentation and other resources related to the transaction can be found here: https://essinc.com/investors/.

About ESS Inc.

ESS Inc. designs, builds and deploys environmentally sustainable, low-cost, iron flow batteries for long-duration commercial and utility-scale energy storage applications requiring from 4 to 12 hours of flexible energy capacity. The Energy Warehouse™ and Energy Center™ use earth-abundant iron, salt, and water for the electrolyte, resulting in an environmentally benign, long-life energy storage solution for the world’s renewable energy infrastructure. Established in 2011, ESS Inc. enables project developers, utilities, and commercial and industrial facility owners to make the transition to more flexible non-lithium-ion storage that is better suited for the grid and the environment. For more information visit www.essinc.com.

About ACON S2 Acquisition Corp.

ACON S2 is a blank check company whose business purpose is to effect a merger, capital stock exchange, asset acquisition, stock purchase, reorganization or similar business combination with one or more businesses. ACON S2 has a focus on businesses that employ a strategic approach to sustainability; that is, a business whose pursuit of sustainability—environmental, social and/or economic—is core to driving its performance and success. ACON S2’s sponsor is an affiliate of ACON Investments, L.L.C.

About ACON Investments, L.L.C.

ACON Investments, L.L.C., headquartered in Washington, DC, is an international private equity firm investing in North America, Latin America and Europe. Founded in 1996, ACON has managed approximately $6 billion of capital to date and has professionals in Washington, DC, Los Angeles, Mexico City, São Paulo, Bogotá and Madrid. For more information, visit www.aconinvestments.com.

Additional Information and Where to Find It

A full description of the terms of the transaction will be provided in a registration statement on Form S-4 to be filed with the SEC by ACON S2 that will include a prospectus with respect to the combined company’s securities to be issued in connection with the business combination and a proxy statement with respect to the shareholder meeting of ACON S2 to vote on the business combination. ACON S2 urges its investors, shareholders and other interested persons to read, when available, the preliminary proxy statement/prospectus as well as other documents filed with the SEC because these documents will contain important information about ACON S2, the Company and the transaction. After the registration statement is declared effective, the definitive proxy statement/prospectus to be included in the registration statement will be mailed to shareholders of ACON S2 as of a record date to be established for voting on the proposed business combination. Once available, shareholders will also be able to obtain a copy of the S-4, including the proxy statement/prospectus, and other documents filed with the SEC without charge, by directing a request to: ACON S2, 1133 Connecticut Avenue NW, Suite 700, Washington, DC 20036. The preliminary and definitive proxy statement/prospectus to be included in the registration statement, once available, can also be obtained, without charge, at the SEC’s website (www.sec.gov).

Participants in the Solicitation

ACON S2 and ESS and their respective directors and officers may be deemed to be participants in the solicitation of proxies from ACON S2’s stockholders in connection with the proposed transaction. Information about ACON S2’s directors and executive officers and their ownership of ACON S2’s securities is set forth in ACON S2’s filings with the SEC. To the extent that holdings of ACON S2’s securities have changed since the amounts printed in ACON S2’s Registration Statement on Form S-1, such changes have been or will be reflected on Statements of Change in Ownership on Form 4 filed with the SEC. Additional information regarding the interests of those persons and other persons who may be deemed participants in the proposed transaction may be obtained by reading the proxy statement/consent solicitation statement/prospectus regarding the proposed transaction when it becomes available. You may obtain free copies of these documents as described in the preceding paragraph.

No Offer or Solicitation

This press release is not a proxy statement or solicitation of a proxy, consent or authorization with respect to any securities or in respect of the potential transaction and shall not constitute an offer to sell or a solicitation of an offer to buy the securities of ACON S2, ESS or the combined company, nor shall there be any sale of any such securities in any state or jurisdiction in which such offer, solicitation, or sale would be unlawful prior to registration or qualification under the securities laws of such state or jurisdiction. No offer of securities shall be made except by means of a prospectus meeting the requirements of the Securities Act.

Forward-Looking Statements

This communication contains certain forward-looking statements, including statements regarding ACON S2’s, ESS’ or their management teams’ expectations, hopes, beliefs, intentions or strategies regarding the future. The words “anticipate”, “believe”, “continue”, “could”, “estimate”, “expect”, “intends”, “may”, “might”, “plan”, “possible”, “potential”, “predict”, “project”, “should”, “would” and similar expressions may identify forward-looking statements, but the absence of these words does not mean that a statement is not forward-looking. These forward-looking statements are based on ACON S2’s and ESS’ current expectations and beliefs concerning future developments and their potential effects on ACON S2, ESS or any successor entity of the proposed transactions. Many factors could cause actual future events to differ materially from the forward-looking statements in this presentation, including but not limited to: (i) the risk that the proposed transactions may not be completed in a timely manner or at all, which may adversely affect the price of ACON S2’s securities, (ii) the failure to satisfy the conditions to the consummation of the proposed transactions, (iii) the occurrence of any event, change or other circumstance that could give rise to the termination of the business combination, (iv) the effect of the announcement or pendency of the proposed transactions on ESS’ business relationships, operating results and business generally, (v) risks that the proposed transactions disrupt current plans and operations of ESS, (vi) changes in the competitive and highly regulated industries in which ESS plans to operate, variations in operating performance across competitors, changes in laws and regulations affecting ESS’ business and changes in the combined capital structure and (vii) the ability to implement business plans, forecasts and other expectations after the completion of the proposed transactions, and identify and realize additional opportunities. There can be no assurance that the future developments affecting ACON S2, ESS or any successor entity of the proposed transactions will be those that we have anticipated. These forward-looking statements involve a number of risks, uncertainties (some of which are beyond ACON S2’s or ESS’ control) or other assumptions that may cause actual results or performance to be materially different from those expressed or implied by these forward-looking statements. You should carefully consider the foregoing factors and the other risks and uncertainties described in the “Risk Factors” section of ACON S2’s registration on Form S-1 (File No. 333-248515), the registration statement on Form S-4 expected to be filed in connection with the business combination, and other documents filed by ACON S2 from time to time with the SEC. These filings identify and address other important risks and uncertainties that could cause actual events and results to differ materially from those contained in the forward-looking statements. Except as required by law, ACON S2 and ESS are not undertaking any obligation to update or revise any forward-looking statements whether as a result of new information, future events or otherwise. Neither ACON S2 nor ESS gives any assurance that either the ACON S2 or ESS, or the combined company, will achieve its expectations.


Contacts

For Investors:
Erik Bylin
This email address is being protected from spambots. You need JavaScript enabled to view it.
510-315-1004

For Media:
Gene Hunt
Trevi Communications, Inc.
978-750-0333 ext. 101
This email address is being protected from spambots. You need JavaScript enabled to view it.

For ACON S2:
Emily Claffey/Julie Rudnick/Kevin Siegel
Sard Verbinnen & Co
This email address is being protected from spambots. You need JavaScript enabled to view it.

DUBLIN--(BUSINESS WIRE)--The "Global Oil and Gas Industry Contracts Review, Q1 2021 - BW Offshore Secures EPCI and Operation Contract for Barossa FPSO in Australia" report has been added to ResearchAndMarkets.com's offering.


The report portrays detailed comparative data on the number of contracts and their value in the quarter, subdivided by region, sector and geographies during the quarter, Additionally, the report provides information on the top contractors and issuers based on the worth of contracts executed in the oil and gas industry during the quarter by geographies and over the year.

Scope

  • Analyze oil and gas contracts in the global arena
  • Review of contracts in the upstream sector - exploration and production, midstream sector - pipeline, transportation, storage and processing, and in the downstream refining and marketing, and petrochemical sector.
  • Information on the top awarded contracts by sector that took place in the oil and gas industry
  • Geographies covered include - North America, Europe, Asia Pacific, South & Central America, and Middle East & Africa
  • Summary of top contractors in the oil and gas industry over the past 12 months subdivided by the sectors
  • Summary of top issuers in the oil and gas industry over the past 12 months subdivided by the sectors

Reasons to Buy

  • Enhance your decision making capability in a more rapid and time sensitive manner
  • Find out the major contracts focused sectors for investments in your industry
  • Understand the contracts activity in the oil and gas industry
  • Evaluate the type of services offered by key contractors during the month
  • Identify growth sectors and regions wherein contracts opportunities are more lucrative
  • Look for key contractors/issuers if you are looking to award a contract or interested in contracts activity within the oil and gas industry

Key Topics Covered:

  • Quarterly Global Oil & Gas Contracts Overview
  • Key Highlights
  • Quarterly Overview
  • Upstream Sector Review
  • Contracts
  • Awarded Contracts
  • Midstream Sector Review
  • Contracts
  • Planned/Rumored Contracts
  • Awarded Contracts
  • Downstream/Petrochemical Sector Review
  • Contracts
  • Awarded Contracts
  • Appendix
  • Abbreviations

For more information about this report visit https://www.researchandmarkets.com/r/pj6opl


Contacts

ResearchAndMarkets.com
Laura Wood, Senior Press Manager
This email address is being protected from spambots. You need JavaScript enabled to view it.

For E.S.T Office Hours Call 1-917-300-0470
For U.S./CAN Toll Free Call 1-800-526-8630
For GMT Office Hours Call +353-1-416-8900

HIGHLIGHTS


  • First quarter production of 38,417 Boe per day, up 7.5% sequentially from the fourth quarter of 2020
  • First quarter GAAP cash flow from operations of $62.8 million inclusive of changes in net working capital and Free Cash Flow (non-GAAP) of $41.7 million. See “Non-GAAP Financial Measures” below
  • Total capital expenditures of $38.1 million, down 22% from the fourth quarter of 2020
  • The Board of Directors has authorized the payment of all accrued and cash dividends on the Series A Preferred Stock in the aggregate amount of $22.0 million to be paid on May 15, 2021
  • The Board of Directors has also declared Northern’s first ever quarterly common stock dividend of $0.03 per share payable July 30, 2021 to stockholders of record on June 30, 2021
  • Closed Appalachian Basin acquisition from Reliance Marcellus, LLC on April 1, 2021
  • Liquidity and balance sheet strengthened through debt and equity offerings with gross proceeds of $690 million in the first quarter. On May 15, Northern will have retired all near term debt maturities

MINNEAPOLIS--(BUSINESS WIRE)--Northern Oil and Gas, Inc. (NYSE American: NOG) (“Northern”) today announced the company’s first quarter results.

MANAGEMENT COMMENTS

“The first quarter performance was above our internal expectations across all metrics as our core Williston & Permian properties continued to deliver,” commented Nick O’Grady, Northern’s Chief Executive Officer. “The Company generated $41.7 million of Free Cash Flow, approximately 6% of our total quarter end market capitalization — in a single quarter. I am also very excited that we were able to continue to improve our liquidity and balance sheet with the completion of our financings in February. These transactions along with the continued growth of our business should provide us with sufficient cash flow to continue our strategy of making additional accretive acquisitions, reducing debt and providing returns to our stockholders. Our first ever quarterly dividend is the culmination of a tireless multi-year effort to put the Company in a position to return cash to its stockholders. As we achieve our targets, we believe we can provide meaningful cash returns to investors over the coming years.”

FIRST QUARTER FINANCIAL RESULTS

Oil and natural gas sales for the first quarter were $157.3 million. First quarter GAAP net loss, inclusive of a $128.6 million non-cash net mark-to-market loss on derivatives, was $90.4 million or $1.66 per diluted share. First quarter Adjusted Net Income was $40.2 million or $0.62 per diluted share, up from $21.7 million or $0.44 per diluted share in the prior year. Adjusted EBITDA in the first quarter was $98.8 million. See “Non-GAAP Financial Measures” below.

PRODUCTION

First quarter production was 38,417 Boe per day, a 7.5% increase from the fourth quarter of 2020. Oil represented 76% of total production in the first quarter. Northern estimates that curtailments and shut-ins still reduced the Company’s average daily production by an average of approximately 2,000 Boe per day in the first quarter, but that was a significant improvement from the fourth quarter of 2020. Northern had 6.7 net wells turned online during the first quarter, compared to 6.9 net wells turned online in the fourth quarter of 2020.

PRICING

During the first quarter, NYMEX West Texas Intermediate (“WTI”) crude oil averaged $58.13 per Bbl, and NYMEX natural gas at Henry Hub averaged $3.37 per million cubic feet (“Mcf”). Northern’s unhedged net realized oil price in the first quarter was $51.57, representing a $6.56 differential to WTI prices. Northern’s unhedged net realized gas price in the first quarter was $4.37 per Mcf, representing approximately 130% realizations compared with Henry Hub pricing.

OPERATING COSTS

Lease operating costs were $34.3 million in the first quarter of 2021, or $9.92 per Boe, up 15.6% on a per unit basis compared to the fourth quarter of 2020. This is consistent with Northern’s prior commentary of extensive workover expense related to bringing curtailed and shut-in production back to sales, and is expected to be transitory in nature. First quarter general and administrative (“G&A”) costs totaled $6.8 million or $1.96 per Boe. This includes $2.5 million of legal and other transaction expenses in connection with the Reliance acquisition and $0.8 million of non-cash stock-based compensation. Northern’s G&A costs excluding these amounts totaled $3.5 million or $1.01 per Boe in the first quarter. Northern expects approximately $2.5 - $3.5 million in additional non-recurring advisory and other transaction costs related to the Reliance acquisition to be incurred in the second quarter of 2021.

CAPITAL EXPENDITURES AND ACQUISITIONS

Capital spending for the first quarter was $38.1 million, made up of $33.1 million of organic drilling and completion (“D&C”) capital and $5.0 million of total acquisition spending and other items, inclusive of ground game D&C spending. Northern added 6.7 net wells to production in the first quarter, and wells in process decreased to 22.7 net wells, down 5.4 net wells from the prior quarter as well completions accelerated. On the ground game acquisition front, Northern closed on 6 transactions during the first quarter totaling 1.3 net wells and 186 net mineral acres.

MARCELLUS SHALE ACQUISITION

On February 3, 2021, Northern announced a definitive agreement to acquire assets from Reliance Marcellus, LLC, a subsidiary of Reliance Industries, Ltd., for $175.0 million in cash plus 3.25 million common stock warrants. The acquisition has an effective date of July 1, 2020 and closed on April 1, 2021. EQT Corporation, the operator of substantially all the assets, elected to exercise its preferential purchase right on a portion of the assets, which (together with the exercise of other preferential purchase rights) reduced the cash purchase price, net to Northern, by approximately $48.6 million, or 28%. Northern retained approximately 99% of the inventory on the assets. Northern has provided guidance for the acquired assets in the guidance section below, identical to what was provided in its fourth quarter 2020 earnings release.

LIQUIDITY AND CAPITAL RESOURCES

Northern had total liquidity of $417.2 million as of March 31, 2021, consisting of cash of $2.7 million, the Reliance acquisition deposit of $17.5 million, and $397.0 million of borrowing availability under the revolving credit facility.

On January 4, 2021, Northern retired $65 million, or 50% of its VEN Bakken Note. In February 2021, Northern additionally strengthened its balance sheet through common equity and debt transactions alongside of its announcement of the Reliance Marcellus acquisition. Northern issued 14.3 million shares of common equity for gross proceeds of $140.3 million. Northern also issued $550 million of 8.125% Senior Unsecured Notes due 2028. With the net proceeds from these transactions, Northern retired the remaining $65 million of its VEN Bakken Note and retired $272.1 million, or 95% of its remaining Senior Secured Notes due 2023 on February 18, 2021. Northern will call the remaining $15.7 million of 2023 Notes on or about May 15, 2021. Northern used the remainder of the proceeds to retire debt under its revolving credit facility and for cash on hand.

On April 1, 2021, upon closing of the Reliance acquisition, Northern funded the adjusted cash purchase price of $120.9 million with cash on hand, the $17.5 million deposit made during the first quarter, and borrowings under its credit facility. The cash purchase price included typical closing adjustments, including a reduction for the net cash flows already received by Reliance from the properties since the effective date, which was July 1, 2020. Northern expects additional cash purchase price reductions to be received over the next several months for net cash flows generated after the effective date, but not received by Reliance prior to the closing date.

STOCKHOLDER RETURNS

On April 23, 2021, Northern’s Board of Directors declared all current and accrued cash dividends for Northern’s Series A Preferred Stock, to be paid on May 15, 2021 in the total amount of $22.0 million.

On May 6, 2021, Northern’s Board of Directors declared its first ever regular quarterly cash dividend for Northern’s common stock of $0.03 per share for stockholders of record as of June 30, 2021, payable July 30, 2021.

2021 ESTIMATED GUIDANCE — WILLISTON AND PERMIAN PROPERTIES

2021 Guidance Ranges:


Annual Production (Boe per day)

37,750 - 42,750

Net Wells Added to Production

32 - 34

Operating Expenses Guidance:


Production Expenses (per Boe)

$8.75 - $9.75

Production Taxes

10% of Net Oil Revenues, $0.06 per Mcf for Natural Gas

Oil as a Percentage of Sales Volumes

78 - 80%

Average Differential to NYMEX WTI

$6.50 - $8.50

2021 ESTIMATED GUIDANCE — RELIANCE MARCELLUS PROPERTIES (FULL YEAR)

2021 Guidance Ranges:


Annual Production (Mmcf per day)

75 - 85

Net Wells Added to Production

3.5 - 3.8

Operating Expenses Guidance:


Production, Asset G&A and Marketing Expenses (per Mcf)

$0.85 - $0.95

Average Differential to NYMEX Henry Hub (per Mcf)

$0.55 - $0.65

2021 ESTIMATED GUIDANCE — CORPORATE


Full Year 2021

General and Administrative Expense (per Boe):


Cash (excluding any one-time transaction costs)

$0.80 - $0.90

Non-Cash

$0.20

Total Capital Expenditures (in millions)

$200 - $250

FIRST QUARTER 2021 RESULTS

The following tables set forth selected operating and financial data for the periods indicated.


Three Months Ended March 31,


2021


2020


% Change

Net Production:


Oil (Bbl)

2,630,178


3,138,380


(16)

%

Natural Gas and NGLs (Mcf)

4,964,263


5,049,120


(2)

%

Total (Boe)

3,457,555


3,979,900


(13)

%


Average Daily Production:


Oil (Bbl)

29,224


34,488


(15)

%

Natural Gas and NGLs (Mcf)

55,158


55,485


(1)

%

Total (Boe)

38,417


43,735


(12)

%


Average Sales Prices:


Oil (per Bbl)

$

51.57


$

37.07


39

%

Effect of Gain (Loss) on Settled Oil Derivatives on Average Price (per Bbl)

(2.32)


10.04


Oil Net of Settled Oil Derivatives (per Bbl)

49.25


47.11


5

%


Natural Gas and NGLs (per Mcf)

4.37


2.75


59

%

Effect of Gain (Loss) on Settled Natural Gas Derivatives on Average Price (per Mcf)

(0.24)


Natural Gas and NGLs Net of Settled Natural Gas Derivatives (per Mcf)

4.13


2.75


50

%


Realized Price on a Boe Basis Excluding Settled Commodity Derivatives

45.50


32.71


39

%

Effect of Gain (Loss) on Settled Commodity Derivatives on Average Price (per Boe)

(2.11)


7.92


Realized Price on a Boe Basis Including Settled Commodity Derivatives

43.39


40.63


7

%


Costs and Expenses (per Boe):


Production Expenses

$

9.92


$

9.38


6

%

Production Taxes

3.89


2.99


30

%

General and Administrative Expenses

1.96


1.22


61

%

Depletion, Depreciation, Amortization and Accretion

9.03


15.53


(42)

%


Net Producing Wells at Period End

482.3


464.8


4

%

HEDGING

Northern hedges portions of its expected production volumes to increase the predictability of its cash flow and to help maintain a strong financial position. The following table summarizes Northern’s open crude oil commodity derivative swap contracts scheduled to settle after March 31, 2021.

Crude Oil Commodity Derivative Swaps(1)

Contract Period


Volume (Bbls)


Volume (Bbls/Day)


Weighted Average Price (per
Bbl)

2021:


Q2


2,179,458


23,950


$56.38

Q3


2,154,410


23,418


$54.41

Q4


2,131,706


23,171


$53.93

2022:


Q1


1,447,000


16,078


$53.40

Q2


1,274,000


14,000


$53.75

Q3


1,058,000


11,500


$51.71

Q4


1,058,000


11,500


$51.63

2023:


Q1


112,500


1,250


$51.65

_____________

(1)


This table does not include volumes subject to swaptions and call options, which could increase the amount of volumes hedged at the option of Northern’s counterparties. This table also does not include basis swaps. For additional information, see Note 11 to our financial statements included in our Form 10-Q filed with the SEC for the quarter ended March 31, 2021.

The following table summarizes Northern’s open natural gas commodity derivative swap contracts scheduled to settle after March 31, 2021.

Natural Gas Commodity Derivative Swaps

Contract Period


Gas (MMBTU)


Volume (MMBTU/Day)


Weighted Average Price (per
Mcf)

2021:


Q2


5,924,507


65,104


$2.74

Q3


8,979,028


97,598


$2.82

Q4


8,784,210


95,481


$2.82

2022:


Q1


3,600,000


40,000


$3.00

Q2


910,000


10,000


$2.61

Q3


920,000


10,000


$2.61

Q4


920,000


10,000


$2.61

The following table presents Northern’s settlements on commodity derivative instruments and unsettled gains and losses on open commodity derivative instruments for the periods presented, which is included in the revenue section of Northern’s statement of operations:


Three Months Ended
March 31,

(In thousands)


2021


2020

Cash Received (Paid) on Derivatives:


$

(7,297)


$

31,506


Non-Cash Gain (Loss) on Derivatives:


(128,638)


345,075


Gain (Loss) on Derivative Instruments, Net


$

(135,935)


$

376,581


CAPITAL EXPENDITURES & DRILLING ACTIVITY

(In millions, except for net well data)


Three Months Ended
March 31, 2021

Capital Expenditures Incurred:


Organic Drilling and Development Capital Expenditures


$

33.1

Ground Game Drilling and Development Capital Expenditures


$

1.8

Ground Game Acquisition Capital Expenditures


$

2.6

Other


$

0.6


Net Wells Added to Production


6.7


Net Producing Wells (Period-End)


482.3


Net Wells in Process (Period-End)


22.7

Decrease in Wells in Process over Prior Period


5.4


Weighted Average Gross AFE for Wells Elected to


$6.9 million

FIRST QUARTER 2021 EARNINGS RELEASE CONFERENCE CALL

In conjunction with Northern’s release of its financial and operating results, investors, analysts and other interested parties are invited to listen to a conference call with management on Friday, May 7, 2021 at 10:00 a.m. Central Time.

Those wishing to listen to the conference call may do so via webcast or phone as follows:

Webcast: https://78449.themediaframe.com/dataconf/productusers/nog/mediaframe/44884/indexl.html
Dial-In Number: (866) 373-3407 (US/Canada) and (412) 902-1037 (International)
Conference ID: 13719253 - Northern Oil and Gas, Inc. First Quarter 2021 Earnings Call
Replay Dial-In Number: (877) 660-6853 (US/Canada) and (201) 612-7415 (International)
Replay Access Code: 13719253 - Replay will be available through May 14, 2021

UPCOMING CONFERENCE SCHEDULE

SPE A&D Symposium
Houston, TX
May 13, 2021

UBS Global Oil and Gas Conference
May 26, 2021

Wells Fargo Energy Conference
June 2-3, 2021

Stifel Cross Sector Insight Conference
June 8, 2021

RBC Energy Conference
June 9, 2021

ABOUT NORTHERN OIL AND GAS

Northern Oil and Gas, Inc. is a company with a primary strategy of investing in non-operated minority working and mineral interests in oil & gas properties, with a core area of focus in the premier basins within the United States. More information about Northern Oil and Gas, Inc. can be found at www.northernoil.com.

SAFE HARBOR

This press release contains forward-looking statements regarding future events and future results that are subject to the safe harbors created under the Securities Act of 1933 (the “Securities Act”) and the Securities Exchange Act of 1934 (the “Exchange Act”). All statements other than statements of historical facts included in this release regarding Northern’s financial position, operating and financial performance, business strategy, plans and objectives of management for future operations, industry conditions, and indebtedness covenant compliance are forward-looking statements. When used in this release, forward-looking statements are generally accompanied by terms or phrases such as “estimate,” “project,” “predict,” “believe,” “expect,” “continue,” “anticipate,” “target,” “could,” “plan,” “intend,” “seek,” “goal,” “will,” “should,” “may” or other words and similar expressions that convey the uncertainty of future events or outcomes. Items contemplating or making assumptions about actual or potential future production and sales, market size, collaborations, and trends or operating results also constitute such forward-looking statements.

Forward-looking statements involve inherent risks and uncertainties, and important factors (many of which are beyond Northern’s control) that could cause actual results to differ materially from those set forth in the forward-looking statements, including the following: changes in crude oil and natural gas prices; the pace of drilling and completions activity on Northern’s properties and properties pending acquisition; Northern’s ability to acquire additional development opportunities; potential or pending acquisition transactions; Northern’s ability to consummate pending acquisitions, and the anticipated timing of such consummation; the projected capital efficiency savings and other operating efficiencies and synergies resulting from Northern’s acquisition transactions; integration and benefits of property acquisitions, or the effects of such acquisitions on Northern’s cash position and levels of indebtedness; changes in Northern’s reserves estimates or the value thereof; disruptions to Northern’s business due to acquisitions and other significant transactions; infrastructure constraints and related factors affecting Northern’s properties; ongoing legal disputes over and potential shutdown of the Dakota Access Pipeline; the COVID-19 pandemic and its related economic repercussions and effect on the oil and natural gas industry; general economic or industry conditions, nationally and/or in the communities in which Northern conducts business; changes in the interest rate environment, legislation or regulatory requirements; conditions of the securities markets; Northern’s ability to raise or access capital; changes in accounting principles, policies or guidelines; and financial or political instability, health-related epidemics, acts of war or terrorism, and other economic, competitive, governmental, regulatory and technical factors affecting Northern’s operations, products and prices.

Northern has based these forward-looking statements on its current expectations and assumptions about future events. While management considers these expectations and assumptions to be reasonable, they are inherently subject to significant business, economic, competitive, regulatory and other risks, contingencies and uncertainties, most of which are difficult to predict and many of which are beyond Northern’s control. Northern does not undertake any duty to update or revise any forward-looking statements, except as may be required by the federal securities laws.

CONDENSED STATEMENTS OF OPERATIONS

(UNAUDITED)


Three Months Ended
March 31,

(In thousands, except share and per share data)


2021


2020

Revenues


Oil and Gas Sales


$

157,331


$

130,196


Gain (Loss) on Commodity Derivatives, Net


(135,935)


376,581


Other Revenue


1


8


Total Revenues


21,397


506,785


Operating Expenses


Production Expenses


34,312


37,335


Production Taxes


13,453


11,896


General and Administrative Expense


6,782


4,871


Depletion, Depreciation, Amortization and Accretion


31,221


61,809


Total Operating Expenses


85,768


115,911


Income (Loss) From Operations


(64,371)


390,875


Other Income (Expense)


Interest Expense, Net of Capitalization


(13,510)


(16,551)


Gain (Loss) on Unsettled Interest Rate Derivatives, Net


240


(677)


Loss on Extinguishment of Debt, Net


(12,594)


(5,527)


Contingent Consideration Loss


(125)


Other Income (Expense)


3


Total Other Income (Expense)


(25,986)


(22,755)


Income (Loss) Before Income Taxes


(90,357)


368,120


Income Tax Provision (Benefit)


(166)


Net Income (Loss)


$

(90,357)


$

368,286


Cumulative Preferred Stock Dividend


(3,830)


(3,729)


Net Income (Loss) Attributable to Common Stockholders


$

(94,188)


$

364,557


Net Income (Loss) Per Common Share – Basic*


$

(1.73)


$

9.03


Net Income (Loss) Per Common Share – Diluted*


$

(1.73)


$

7.33


Weighted Average Common Shares Outstanding – Basic*


54,538,099


40,366,253


Weighted Average Common Shares Outstanding – Diluted*


54,538,099


49,721,264


___________

*Adjusted for the 1-for-10 reverse stock split.

CONDENSED BALANCE SHEETS

(In thousands, except par value and share data)


March 31, 2021


December 31, 2020

Assets


(Unaudited)


Current Assets:


Cash and Cash Equivalents


$

2,729 


$

1,428 


Accounts Receivable, Net


94,804 


71,015 


Advances to Operators


431 


476 


Prepaid Expenses and Other


2,455 


1,420 


Derivative Instruments


2,005 


51,290 


Total Current Assets


102,424 


125,629 


Property and Equipment:


Oil and Natural Gas Properties, Full Cost Method of Accounting


Proved


4,431,977 


4,393,533 


Unproved


9,621 


10,031 


Other Property and Equipment


2,502 


2,451 


Total Property and Equipment


4,444,100 


4,406,015 


Less – Accumulated Depreciation, Depletion and Impairment


(3,701,715)


(3,670,811)


Total Property and Equipment, Net


742,385 


735,204 


Derivative Instruments


356 


111 


Acquisition Deposit


17,500 


— 


Other Noncurrent Assets, Net


10,578 


11,145 


Total Assets


$

873,243 


$

872,089 


Liabilities and Stockholders' Equity (Deficit)

Current Liabilities:


Accounts Payable


$

40,788 


$

35,803 


Accrued Liabilities


72,667 


68,673 


Accrued Interest


5,769 


8,341 


Derivative Instruments


35,108 


3,078 


Contingent Consideration


618 


493 


Current Portion of Long-term Debt


— 


65,000 


Other Current Liabilities


1,018 


1,087 


Total Current Liabilities


155,968 


182,475 


Long-term Debt


817,061 


879,843 


Derivative Instruments


61,987 


14,659 


Asset Retirement Obligations


18,884 


18,366 


Other Noncurrent Liabilities


26 


50 


Total Liabilities


$

1,053,926 


$

1,095,393 


Commitments and Contingencies (Note 8)


Stockholders’ Equity (Deficit)  


Preferred Stock, Par Value $.001; 5,000,000 Shares Authorized; 

2,218,732 Series A Shares Outstanding at 3/31/2021

2,218,732 Series A Shares Outstanding at 12/31/2020


Common Stock, Par Value $.001; 135,000,000* Shares Authorized;

 60,361,547* Shares Outstanding at 3/31/2021

 45,908,779* Shares Outstanding at 12/31/2020


462 


448 


Additional Paid-In Capital


1,689,567 


1,556,602 


Retained Deficit


(1,870,714)


(1,780,356)


Total Stockholders’ Equity (Deficit)


(180,682)


(223,304)


Total Liabilities and Stockholders’ Equity (Deficit)


$

873,243 


$

872,089 


__________

*Adjusted for the 1-for-10 reverse stock split.

Non-GAAP Financial Measures

Adjusted Net Income, Adjusted EBITDA and Free Cash Flow are non-GAAP measures. Northern defines Adjusted Net Income (Loss) as net income (loss) excluding (i) (gain) loss on unsettled commodity derivatives, net of tax, (ii) loss on extinguishment of debt, net of tax, (iii) contingent consideration loss, net of tax, (iv) acquisition transaction costs, net of tax, and (v) gain on unsettled interest rate derivatives, net of tax. Northern defines Adjusted EBITDA as net income (loss) before (i) interest expense, (ii) income taxes, (iii) depreciation, depletion, amortization and accretion, (iv) non-cash stock-based compensation expense, (v) loss on extinguishment of debt, (vi) contingent consideration loss, (vii) acquisition transaction costs, (viii) (gain) loss on unsettled commodity derivatives, and (ix) gain on unsettled interest rate derivatives.


Contacts

Mike Kelly, CFA
Chief Strategy Officer
952-476-9800
This email address is being protected from spambots. You need JavaScript enabled to view it.


Read full story here

MADISON, Wis.--(BUSINESS WIRE)--MGE Energy, Inc. (Nasdaq: MGEE) today issued its first-quarter 2021 financial update presentation.


The update is available on MGE Energy's website at:

mgeenergy.com/financialupdate

About MGE Energy

MGE Energy is an investor-owned public utility holding company headquartered in the state capital of Madison, Wis. It is the parent company of Madison Gas and Electric, which generates and distributes electricity in Dane County, Wis., and purchases and distributes natural gas in seven south-central and western Wisconsin counties. MGE Energy's assets total approximately $2.3 billion, and its 2020 revenues were approximately $539 million.


Contacts

Investor relations contact
Ken Frassetto
Director - Shareholder Services and Treasury Management
608-252-4723 | This email address is being protected from spambots. You need JavaScript enabled to view it.

IRVING, Texas--(BUSINESS WIRE)--Fluor Corporation (NYSE: FLR) announced today that NuScale Power, in which Fluor is the majority investor, has retained Guggenheim Securities, LLC, a leading financial advisory and capital markets firm, to explore financing options to accelerate the commercialization of NuScale’s groundbreaking small modular reactor (SMR) technology.


Fluor has been actively engaged with potential strategic investors in NuScale since 2013, and recent milestones have been achieved which have rapidly increased the number of interested parties. It is expected that any potential proceeds raised through this process would be used by NuScale to accelerate and expand its SMR development program including those elements currently supported by a U.S. Department of Energy (DOE) cost-share award.

Fluor and its partners will continue to provide engineering services, project management and supply chain support to NuScale as part of any contemplated future projects.

NuScale’s SMR technology is the first and only design to receive approval from the U.S. Nuclear Regulatory Commission which occurred in August 2020. NuScale’s innovative and unique, fully passive, safe SMR design is capable of generating 77 megawatts of zero carbon electricity per module using a safer, smaller and scalable version of traditional pressurized light water reactor technology. Modules safely shut down and self-cool, indefinitely, with no need for AC or DC power, operator or computer action, or additional water. The fully factory-made NuScale Power module offers scalable power based on demand and can meet grid capacity needs by providing base-load power to support intermittent wind, solar and hydropower resources.

Fluor and NuScale have an agreement with Utah Associated Municipal Power Systems (UAMPS) to build a NuScale power plant that will bring the United States’ first clean energy, carbon-free SMR project to commercialization. In October 2020, UAMPS received a $1.355 billion, 10-year award from the DOE, subject to annual appropriations, to help fund the project.

About Fluor Corporation

Fluor Corporation (NYSE: FLR) is building a better future by applying world-class expertise to solve its clients’ greatest challenges. Fluor’s 44,000 employees provide professional and technical solutions that deliver safe, well-executed, capital-efficient projects to clients around the world. Fluor had revenue of $15.7 billion in 2020 and is ranked 181 among the Fortune 500 companies. With headquarters in Irving, Texas, Fluor has provided engineering, procurement and construction services for more than 100 years. For more information, please visit www.fluor.com or follow Fluor on Twitter, LinkedIn, Facebook and YouTube.

#corp


Contacts

Brian Mershon
Media Relations
469.398.7621

Jason Landkamer
Investor Relations
469.398.7222

DUBLIN--(BUSINESS WIRE)--The "Global Flexible Shaft Couplings Market 2021-2025" report has been added to ResearchAndMarkets.com's offering.


The publisher has been monitoring the flexible shaft couplings market and it is poised to grow by $198.09 million during 2021-2025, progressing at a CAGR of over 3% during the forecast period.

The report on the flexible shaft couplings market provides a holistic analysis, market size and forecast, trends, growth drivers, and challenges, as well as vendor analysis covering around 25 vendors.

The report offers an up-to-date analysis regarding the current global market scenario, latest trends and drivers, and the overall market environment. The market is driven by the increased demand from high speed and high torque applications and the ease and flexibility in operations.

The flexible shaft couplings market analysis includes the end-user segment and geographic landscape. This study identifies the high efficiency in material handling applications as one of the prime reasons driving the flexible shaft couplings market growth during the next few years.

Companies Mentioned

  • AB SKF
  • ABB Ltd.
  • Altra Industrial Motion Corp.
  • Chr. Mayr GmbH + Co. KG
  • Regal Beloit Corp.
  • Rexnord Corp.
  • Siemens AG
  • The Timken Co.
  • The Tsubaki Group
  • Voith GmbH & Co. KGaA

The report on the flexible shaft couplings market covers the following areas:

  • Flexible shaft couplings market sizing
  • Flexible shaft couplings market forecast
  • Flexible shaft couplings market industry analysis

The study was conducted using an objective combination of primary and secondary information including inputs from key participants in the industry. The report contains a comprehensive market and vendor landscape in addition to an analysis of the key vendors.

The publisher presents a detailed picture of the market by the way of study, synthesis, and summation of data from multiple sources by an analysis of key parameters such as profit, pricing, competition, and promotions. It presents various market facets by identifying the key industry influencers. The data presented is comprehensive, reliable, and a result of extensive research - both primary and secondary. The market research reports provide a complete competitive landscape and an in-depth vendor selection methodology and analysis using qualitative and quantitative research to forecast the accurate market growth.

Key Topics Covered:

1. Executive Summary

  • Market overview

2. Market Landscape

  • Market ecosystem
  • Value chain analysis

3. Market Sizing

  • Market definition
  • Market segment analysis
  • Market size 2020
  • Market outlook: Forecast for 2020 - 2025

4. Five Forces Analysis

  • Five forces analysis 2020 & 2025
  • Bargaining power of buyers
  • Bargaining power of suppliers
  • Threat of new entrants
  • Threat of substitutes
  • Threat of rivalry
  • Market condition

5. Market Segmentation by Product

  • Elastomeric couplings
  • Gear couplings
  • Chain couplings
  • Bellow couplings
  • Disc couplings
  • Other Couplings

6. Market Segmentation by End user

  • Market segments
  • Comparison by End user
  • Oil and gas industry - Market size and forecast 2020-2025
  • Power plants - Market size and forecast 2020-2025
  • Mining and metal industry - Market size and forecast 2020-2025
  • Others - Market size and forecast 2020-2025
  • Market opportunity by End user

7. Customer landscape

8. Geographic Landscape

  • Geographic segmentation
  • Geographic comparison
  • APAC - Market size and forecast 2020-2025
  • Europe - Market size and forecast 2020-2025
  • North America - Market size and forecast 2020-2025
  • South America - Market size and forecast 2020-2025
  • MEA - Market size and forecast 2020-2025
  • Key leading countries
  • Market opportunity by geography
  • Market drivers
  • Market challenges
  • Market trends

9. Vendor Landscape

  • Overview
  • Vendor landscape
  • Landscape disruption

10. Vendor Analysis

  • Vendors covered
  • Market positioning of vendors
  • AB SKF
  • ABB Ltd.
  • Altra Industrial Motion Corp.
  • Chr. Mayr GmbH + Co. KG
  • Regal Beloit Corp.
  • Rexnord Corp.
  • Siemens AG
  • The Timken Co.
  • The Tsubaki Group
  • Voith GmbH & Co. KGaA

11. Appendix

  • Scope of the report
  • Currency conversion rates for US$
  • Research methodology
  • List of abbreviations

For more information about this report visit https://www.researchandmarkets.com/r/yfvot2


Contacts

ResearchAndMarkets.com
Laura Wood, Senior Press Manager
This email address is being protected from spambots. You need JavaScript enabled to view it.

For E.S.T Office Hours Call 1-917-300-0470
For U.S./CAN Toll Free Call 1-800-526-8630
For GMT Office Hours Call +353-1-416-8900

DALLAS--(BUSINESS WIRE)--Flowserve Corporation (NYSE: FLS), a leading provider of flow control products and services for the global infrastructure markets, today announced that Scott Rowe, president and chief executive officer, will present virtually at the Goldman Sachs Industrials and Materials Conference on May 11, 2021 at 2:40 p.m. EDT.

A webcast of Mr. Rowe’s presentation will be available for shareholders and other interested parties at www.flowserve.com under the “Investor Relations” section.

About Flowserve: Flowserve Corp. is one of the world’s leading providers of fluid motion and control products and services. Operating in more than 55 countries, the company produces engineered and industrial pumps, seals and valves as well as a range of related flow management services. More information about Flowserve can be obtained by visiting the company’s Web site at www.flowserve.com.

Safe Harbor Statement: This news release includes forward-looking statements within the meaning of Section 27A of the Securities Act of 1933 and Section 21E of the Securities Exchange Act of 1934, which are made pursuant to the safe harbor provisions of the Private Securities Litigation Reform Act of 1995, as amended. Words or phrases such as "may," "should," "expects," "could," "intends," "plans," "anticipates," "estimates," "believes," "forecasts," "predicts" or other similar expressions are intended to identify forward-looking statements, which include, without limitation, earnings forecasts, statements relating to our business strategy and statements of expectations, beliefs, future plans and strategies and anticipated developments concerning our industry, business, operations and financial performance and condition.

The forward-looking statements included in this news release are based on our current expectations, projections, estimates and assumptions. These statements are only predictions, not guarantees. Such forward-looking statements are subject to numerous risks and uncertainties that are difficult to predict. These risks and uncertainties may cause actual results to differ materially from what is forecast in such forward-looking statements, and include, without limitation, the following: the impact of the global outbreak of COVID-19 on our business and operations; a portion of our bookings may not lead to completed sales, and our ability to convert bookings into revenues at acceptable profit margins; changes in global economic conditions and the potential for unexpected cancellations or delays of customer orders in our reported backlog; our dependence on our customers’ ability to make required capital investment and maintenance expenditures; if we are not able to successfully execute and realize the expected financial benefits from our strategic transformation and realignment initiatives, our business could be adversely affected; risks associated with cost overruns on fixed-fee projects and in taking customer orders for large complex custom engineered products; the substantial dependence of our sales on the success of the oil and gas, chemical, power generation and water management industries; the adverse impact of volatile raw materials prices on our products and operating margins; economic, political and other risks associated with our international operations, including military actions, trade embargoes, epidemics or pandemics or changes to tariffs or trade agreements that could affect customer markets, particularly North African, Russian and Middle Eastern markets and global oil and gas producers, and non-compliance with U.S. export/re-export control, foreign corrupt practice laws, economic sanctions and import laws and regulations; increased aging and slower collection of receivables, particularly in Latin America and other emerging markets; our exposure to fluctuations in foreign currency exchange rates, including in hyperinflationary countries such as Venezuela and Argentina; our furnishing of products and services to nuclear power plant facilities and other critical processes; potential adverse consequences resulting from litigation to which we are a party, such as litigation involving asbestos-containing material claims; expectations regarding acquisitions and the integration of acquired businesses; our relative geographical profitability and its impact on our utilization of deferred tax assets, including foreign tax credits; the potential adverse impact of an impairment in the carrying value of goodwill or other intangible assets; our dependence upon third-party suppliers whose failure to perform timely could adversely affect our business operations; the highly competitive nature of the markets in which we operate; environmental compliance costs and liabilities; potential work stoppages and other labor matters; access to public and private sources of debt financing; our inability to protect our intellectual property in the U.S., as well as in foreign countries; obligations under our defined benefit pension plans; our internal control over financial reporting may not prevent or detect misstatements because of its inherent limitations, including the possibility of human error, the circumvention or overriding of controls, or fraud; the recording of increased deferred tax asset valuation allowances in the future or the impact of tax law changes on such deferred tax assets could affect our operating results; our information technology infrastructure could be subject to service interruptions, data corruption, cyber-based attacks or network security breaches, which could disrupt our business operations and result in the loss of critical and confidential information; ineffective internal controls could impact the accuracy and timely reporting of our business and financial results; and other factors described from time to time in our filings with the Securities and Exchange Commission.

All forward-looking statements included in this news release are based on information available to us on the date hereof, and we assume no obligation to update any forward-looking statement.


Contacts

Investor Contacts:
Jay Roueche, Vice President, Investor Relations & Treasurer, (972) 443-6560
Mike Mullin, Director, Investor Relations, (972) 443-6636

Media Contact:
Lars Rosene, Vice President, Corporate Communications & Public Affairs, (972) 443-6644

FORT WORTH, Texas--(BUSINESS WIRE)--Lonestar Resources US Inc. (OTCQX: LONE) (together with its subsidiaries, “Lonestar”) will release its first quarter 2021 results after the close of trading on Tuesday, May 11th, 2021. The report will be made available via Business Wire and the Company’s website at www.lonestarresources.com.


Management will host a live conference call on Wednesday, May 12th, 2019 at 9:00AM CDT to discuss the first quarter 2021 results and operational highlights.

To access the conference call, participants should dial:

North America: 800-954-0653
International: +1 212-271-4657

About Lonestar

Lonestar Resources is an independent oil and natural gas company based in Fort Worth, Texas, focused on the development, production and acquisition of unconventional oil, natural gas liquids and natural gas properties in the Eagle Ford Shale in Texas.

Cautionary Note Regarding Forward Looking Statements

Disclosures in this press release contain certain forward-looking statements within the meaning of the federal securities laws. Statements that do not relate strictly to historical or current facts are forward-looking. These statements contain words such as “possible,” “if,” “will,” “expect” and “assuming” and involve risks and uncertainties including, among others that our business plans may change as circumstances warrant and securities of the Company may not ultimately be offered to the public because of general market conditions or other factors. Accordingly, readers should not place undue reliance on forward-looking statements as a prediction of actual results. For more information concerning factors that could cause actual results to differ materially from those conveyed in the forward-looking statements, please refer to the “Risk Factors” section of the Company’s Annual Report on Form 10-K for the year ended December 31, 2020, filed with the Securities and Exchange Commission (the “SEC”) on March 31, 2021 and any subsequently filed quarterly reports on Form 10-Q. Any forward-looking statements in this press release are made as of the date of this press release and the Company undertakes no obligation to update or revise such forward-looking statements to reflect events or circumstances that occur, or of which the Company becomes aware, after the date hereof, unless required by law.


Contacts

Chase Booth, 817-921-1889

Offshore Source Logo

Offshore Source keeps you updated with relevant information concerning the Offshore Energy Sector.

Any views or opinions represented on this website belong solely to the author and do not represent those of the people, institutions or organizations that Offshore Source or collaborators may or may not have been associated with in a professional or personal capacity, unless explicitly stated.

Corporate Offices

Technology Systems Corporation
8502 SW Kansas Ave
Stuart, FL 34997

info@tscpublishing.com