Business Wire News

DALLAS--(BUSINESS WIRE)--ESGEN Acquisition Corporation (“ESGEN” or the “Company”) announced today the pricing of its initial public offering of 24,000,000 units at a price of $10.00 per unit. The offering was upsized from an original 20,000,000 unit offering to a 24,000,000 unit offering. The units will be listed on the Nasdaq Global Market and trade under the ticker symbol “ESACU” beginning October 20, 2021.

Each unit consists of one Class A ordinary share and one-half of one redeemable warrant. Each whole warrant entitles the holder thereof to purchase one Class A ordinary share at a price of $11.50 per share. Once the securities comprising the units begin separate trading, the Class A ordinary shares and warrants are expected to be listed on The Nasdaq Global Market under the symbols “ESAC” and “ESACW,” respectively. The Company is a newly organized blank check company incorporated as a Cayman Islands exempted company and formed for the purpose of effecting a merger, share exchange, asset acquisition, share purchase, recapitalization, reorganization or similar business combination with one or more businesses or entities.

ESGEN is led by Chief Executive Officer Andrejka Bernatova and Chief Financial Officer Nader Daylami, and is affiliated with Energy Spectrum Capital, a Dallas-based venture capital firm with long-standing experience building companies across the energy and infrastructure landscapes over multiple decades. The Company intends to concentrate on identifying opportunities in the North American energy and infrastructure value chain and contiguous industries that it believes will fundamentally change the current energy landscape by accelerating a shift to a low-carbon future.

Citigroup and Barclays Capital Inc. are serving as the book-running managers for the offering and Ladenburg Thalman & Co. Inc. acted as co-manager. The Company has granted the underwriters a 45-day option to purchase up to an additional 3,600,000 units at the initial public offering price to cover over-allotments, if any.

The offering is being made solely by means of a prospectus which may be obtained from:

Citigroup Global Markets Inc.
c/o Broadridge Financial Solutions
1155 Long Island Avenue,
Edgewood, NY 11717,
or by telephone at 1-800-831-9146

or

Barclays Capital Inc.
c/o Broadridge Financial Solutions
1155 Long Island Avenue
Edgewood, NY 11717
This email address is being protected from spambots. You need JavaScript enabled to view it.
(888) 603-5847.

This press release shall not constitute an offer to sell or the solicitation of an offer to buy, nor shall there be any sale of these securities in any state or jurisdiction in which such offer, solicitation or sale would be unlawful prior to registration or qualification under the securities laws of any such state or jurisdiction.

The offering is expected to close on October 22, 2021, subject to customary closing conditions.

Cautionary Note Concerning Forward-Looking Statements

This press release contains statements that constitute “forward-looking statements,” including with respect to the proposed initial public offering and the anticipated use of the net proceeds. No assurance can be given that the offering discussed above will be completed on the terms described, or at all, or that the net proceeds of the offering will be used as indicated. Forward-looking statements are subject to numerous conditions, many of which are beyond the control of the Company, including those set forth in the Risk Factors section of the Company’s registration statement and preliminary prospectus for the Company’s offering filed with the Securities and Exchange Commission (“SEC”). Copies are available on the SEC’s website, www.sec.gov. The Company undertakes no obligation to update these statements for revisions or changes after the date of this release, except as required by law.


Contacts

Media:
David Wells or Nick Rust
Prosek Partners
212-279-3115
This email address is being protected from spambots. You need JavaScript enabled to view it. / This email address is being protected from spambots. You need JavaScript enabled to view it.

ELKHART, Ind.--(BUSINESS WIRE)--LCI Industries (NYSE: LCII), which, through its wholly-owned subsidiary, Lippert Components, Inc. ("Lippert"), supplies, domestically and internationally, a broad array of highly engineered components for the leading original equipment manufacturers ("OEMs") in the recreation and transportation product markets, and the related aftermarkets of those industries, will release its third-quarter 2021 financial results before the market opens on Tuesday, November 2, 2021.

LCI Industries will also host a conference call on Tuesday, November 2, 2021, at 8:30 a.m. ET to discuss the results and other business matters. The call will conclude with a question-and-answer session with participation limited to institutional investors and analysts.

The conference call may be accessed by dialing (877) 668-4883 for participants in the U.S./Canada or (825) 312-2360 for participants outside the U.S./Canada using the required conference ID 7996875. Due to the high volume of companies reporting earnings at this time, please be prepared for hold times of up to 15 minutes when dialing in to the call. Individual investors, retail brokers, and the media are invited to listen to a live webcast of the call on the LCI Industries website at www.investors.lci1.com.

A replay of the conference call will be available for two weeks by dialing (800) 585-8367 for participants in the U.S./Canada or (416) 621-4642 for participants outside the U.S./Canada and referencing access code 7996875. A replay of the webcast will be available on the Company’s website immediately following the conclusion of the call.

Participating in the conference call will be:

  • Jason Lippert, CEO
  • Brian Hall, CFO

About LCI Industries

LCI Industries, through its wholly-owned subsidiary, Lippert, manufactures and supplies, domestically and internationally, a broad array of highly engineered components for the leading OEMs in the recreation and transportation product markets, consisting primarily of recreational vehicles and adjacent industries, including buses; trailers used to haul boats, livestock, equipment, and other cargo; trucks; boats; trains; manufactured homes; and modular housing. The Company also supplies engineered components to the related aftermarkets of these industries, primarily by selling to retail dealers, wholesale distributors, and service centers. Lippert's products include steel chassis and related components; axles and suspension solutions; slide-out mechanisms and solutions; thermoformed bath, kitchen, and other products; vinyl, aluminum, and frameless windows; manual, electric, and hydraulic stabilizer and leveling systems; entry, luggage, patio, and ramp doors; furniture and mattresses; electric and manual entry steps; awnings and awning accessories; towing products; truck accessories; electronic components; appliances; air conditioners; televisions and sound systems; and other accessories. Additional information about Lippert and its products can be found at www.lippert.com.


Contacts

Brian Hall, CFO, (574) 535-1125, This email address is being protected from spambots. You need JavaScript enabled to view it.

LONDON--(BUSINESS WIRE)--Dragos, Inc., the global leader in cybersecurity for industrial control systems (ICS)/operational technology (OT) environments, today announced it is expanding its global presence into the UK to provide organisations in this growth market more direct access to its industrial cybersecurity technology and services and to develop and train ICS/OT cybersecurity talent across the region to ensure world-wide customer success. This follows an announcement earlier this year of the company's plan to grow its presence in Australia and New Zealand to support industrial cybersecurity customers across those regions.

The company’s expansion will bolster its EMEA presence and support an expanding set of UK customers across a diverse set of industries—including electric, oil & gas, manufacturing, chemical, food and beverage, and transportation—as the company continues to grow its worldwide operations to address the burgeoning global market for ICS/OT cybersecurity solutions and meet the cybersecurity needs of critical infrastructure for organizations in all regions at any level of size or complexity.

National Grid plc., one of the world’s largest investor-owned utility companies, invested in Dragos in 2018 after subscribing to Dragos’s industrial threat intelligence service to monitor industry-wide ICS threats. London-based National Grid focuses on transmission and distribution of electricity and gas across Great Britain and parts of the U.S. “We invested in Dragos because we saw the value their visibility into ICS threats brought for both our UK and US businesses,” said Lisa Lambert, Chief Technology and Innovation Officer at National Grid and Founder and President of National Grid Partners. “Since then, the threats to critical infrastructure have continued to grow in scale, complexity, and severity. We are glad to see Dragos extend its global footprint and be able to provide more customers in the UK with the operational technology protection they need to stay ahead of adversaries and protect critical assets.”

“The cybersecurity challenges that industrial organizations face are global in nature but local in practice; there’s no one-size-fits-all approach to industrial cybersecurity. To achieve our broader company mission, we have to be where our customers are to ensure we are taking every effort to make ICS/OT-specific cybersecurity expertise and technology more accessible to organizations across the globe,” said Robert M. Lee, Chief Executive Officer and Co-Founder of Dragos, Inc. “This expansion reflects the incredible demand for ICS/OT cybersecurity solutions we are seeing throughout the major markets and will better position us to partner more closely with companies in the UK to ensure that they are successful in each of their distinct industrial cybersecurity journeys. Our presence will also make it easier for us to connect directly with local ICS/OT cybersecurity practitioner communities to help foster and support their growth. The rapid growth in the OT cybersecurity market and demand for skilled OT cybersecurity professionals has far outstripped the available talent so every person we can expose to and welcome into the ICS/OT cybersecurity community is a win for the industry.”

About Dragos, Inc.

Dragos has a global mission: to safeguard civilization from those trying to disrupt the industrial infrastructure we depend on every day. The practitioners who founded Dragos were drawn to this mission through decades of government and private sector experience.

Dragos codifies the knowledge of our cybersecurity experts into an integrated software platform that provides customers critical visibility into ICS and OT networks so that threats are identified and can be addressed before they become significant events. Our solutions protect organizations across a range of industries, including power and water utilities, energy, and manufacturing, and are optimized for emerging applications like the Industrial Internet of Things (IIOT).

Dragos is privately held and headquartered in the Washington, DC area with regional presence around the world, including Canada, Australia, New Zealand, Europe, and the Middle East.


Contacts

US Press contact:
Leslie Kesselring
Kesselring Communications
This email address is being protected from spambots. You need JavaScript enabled to view it.

UK Press contact:
Lucy Harvey
Eskenzi PR
This email address is being protected from spambots. You need JavaScript enabled to view it.

COLLIERVILLE, Tenn.--(BUSINESS WIRE)--Mueller Industries, Inc. (NYSE: MLI) announces results for the third quarter of 2021. (All comparisons are to the prior year quarter.)


  • $233.4 million in operating income versus $69.2 million
  • $171.0 million in net income versus $42.7 million
  • $982.2 million in net sales versus $619.1 million
  • EPS of $3.01 versus $0.76 per share

Third Quarter Financial and Operating Highlights:

  • COMEX copper averaged $4.30 per pound versus $2.93 per pound in the third quarter of last year, a 47% increase.
  • Unit sales growth across all segments, the influence of the higher copper prices and contributions from the first quarter acquisition of the Hart & Cooley Flex duct business all contributed to the increase in net sales.
  • The results include a gain of $50.1 million from the sale of the Fabricated Tube Products and Shoals Tubular businesses.
  • We recorded income of $2.8 million on our investment in Tecumseh Products Company as its restructuring efforts progress, compared to a $5.5 million loss recorded during the prior year period.
  • We reduced our debt by $230.0 million, ending the quarter with a debt to total capitalization below 10 percent and a current ratio of 2.7 to 1.

Regarding the quarter performance and outlook, Greg Christopher, Mueller’s CEO said,

Our strong financial results were driven by continued favorable market demand and our teams’ exceptional operating performance in the face of industry wide labor and supply constraints and rising costs. Building construction demand remains solid, and backlogs in most businesses continue to build.”

He added, “During the quarter, we also completed the sale of two of our smaller manufacturing businesses, Fabricated Tube Products and Shoals Tubular, and divested of a majority interest in Die-Mold Tool. Although growth remains a key priority, we also continually evaluate our portfolio and pursue opportunities to exit businesses that we do not believe provide the up-side growth potential and returns necessary to achieve our long-term strategic goals.

We anticipate that current market conditions will continue for the foreseeable future.”

Mueller Industries, Inc. (NYSE: MLI) is an industrial corporation whose holdings manufacture vital goods for important markets such as air, water, oil and gas distribution; climate comfort; food preservation; energy transmission; medical; aerospace; and automotive. It includes a network of companies and brands throughout North America, Europe, Asia, and the Middle East.

Statements in this release that are not strictly historical may be “forward-looking” statements, which involve risks and uncertainties. These include economic and currency conditions, continued availability of raw materials and energy, market demand, pricing, competitive and technological factors, and the availability of financing, among others, as set forth in the Company’s SEC filings. The words “outlook,” “estimate,” “project,” “intend,” “expect,” “believe,” “target,” “encourage,” “anticipate,” “appear,” and similar expressions are intended to identify forward-looking statements. The reader should not place undue reliance on forward-looking statements, which speak only as of the date of this report. The Company has no obligation to publicly update or revise any forward-looking statements to reflect events after the date of this report.

MUELLER INDUSTRIES, INC.

CONDENSED CONSOLIDATED STATEMENTS OF INCOME

(Unaudited)


For the Quarter Ended


For the Nine Months Ended

(In thousands, except per share data)


September 25,
2021


September 26,
2020


September 25,
2021


September 26,
2020


Net sales


$

982,248


$

619,105


$

2,812,988


$

1,722,192


Cost of goods sold


744,265


500,780


2,212,395


1,412,654


Depreciation and amortization


10,868


10,752


33,757


32,888


Selling, general, and administrative expense


48,524


38,346


137,891


117,749


Gain on sale of businesses


(54,759

)


(54,759

)


Litigation settlement, net


(21,933

)


Operating income


233,350


69,227


483,704


180,834


Interest expense


(1,116

)


(4,885

)


(7,451

)


(15,237

)

Redemption premium


(5,674

)


Other (expense) income, net


(2,548

)


522


(1,288

)


3,634


Income before income taxes


229,686


64,864


469,291


169,231


Income tax expense


(60,229

)


(15,450

)


(120,996

)


(42,623

)

Income (loss) from unconsolidated affiliates, net of foreign tax


2,799


(5,457

)


131


(20,213

)


Consolidated net income


172,256


43,957


348,426


106,395


Net income attributable to noncontrolling interests


(1,276

)


(1,255

)


(5,507

)


(3,322

)


Net income attributable to Mueller Industries, Inc.


$

170,980


$

42,702


$

342,919


$

103,073


Weighted average shares for basic earnings per share


56,077


55,816


55,979


55,805


Effect of dilutive stock-based awards


731


550


784


534


Adjusted weighted average shares for diluted earnings per share


56,808


56,366


56,763


56,339


Basic earnings per share


$

3.05


$

0.77


$

6.13


$

1.85


Diluted earnings per share


$

3.01


$

0.76


$

6.04


$

1.83


Dividends per share


$

0.13


$

0.10


$

0.39


$

0.30


Summary Segment Data:


Net sales:


Piping Systems Segment


$

688,200


$

409,414


$

1,947,564


$

1,128,467


Industrial Metals Segment


182,245


118,831


527,137


338,652


Climate Segment


122,252


97,604


364,986


276,983


Elimination of intersegment sales


(10,449

)


(6,744

)


(26,699

)


(21,910

)


Net sales


$

982,248


$

619,105


$

2,812,988


$

1,722,192


Operating income:


Piping Systems Segment


$

152,199


$

44,863


$

343,805


$

122,613


Industrial Metals Segment


19,052


18,348


58,398


38,403


Climate Segment


21,072


18,156


63,779


43,523


Unallocated income (expenses)


41,027


(12,140

)


17,722


(23,705

)


Operating income


$

233,350


$

69,227


$

483,704


$

180,834


MUELLER INDUSTRIES, INC.

CONDENSED CONSOLIDATED BALANCE SHEETS


(Unaudited)


(In thousands)

September 25,
2021


December 26,
2020

ASSETS


Cash and cash equivalents

$

104,789


$

119,075


Accounts receivable, net

493,960


357,532

Inventories

405,590


315,002

Other current assets

33,604


33,752


Total current assets

1,037,943


825,361


Property, plant, and equipment, net

370,222


376,572

Operating lease right-of-use assets

24,147


29,301


Other assets

296,225


297,334


Total assets

$

1,728,537


$

1,528,568


LIABILITIES AND STOCKHOLDERS’ EQUITY


Current portion of debt

$

1,110


$

41,283


Accounts payable

180,509


147,741

Current portion of operating lease liabilities

6,193


6,259


Other current liabilities

192,286


144,360


Total current liabilities

380,098


339,643


Long-term debt

121,012


286,593

Pension and postretirement liabilities

24,132


26,841

Environmental reserves

20,902


21,256

Deferred income taxes

13,393


16,842

Noncurrent operating lease liabilities

17,399


21,602


Other noncurrent liabilities

25,369


14,731


Total liabilities

602,305


727,508


Total Mueller Industries, Inc. stockholders’ equity

1,107,562


776,745

Noncontrolling interests

18,670


24,315


Total equity

1,126,232


801,060


Total liabilities and equity

$

1,728,537


$

1,528,568


MUELLER INDUSTRIES, INC.

CONDENSED CONSOLIDATED STATEMENTS OF CASH FLOWS

(Unaudited)


For the Nine Months Ended

(In thousands)


September 25,
2021


September 26,
2020


Cash flows from operating activities


Consolidated net income


$

348,426


$

106,395


Reconciliation of consolidated net income to net cash provided by operating activities:


Depreciation and amortization


33,932


33,127


Stock-based compensation expense


7,228


6,332


Provision for doubtful accounts receivable


1,310


953


(Income) loss from unconsolidated affiliates


(131

)


20,213


Redemption premium


5,674


(Gain) loss on disposals of properties


(1,135

)


144


Gain on sale of businesses


(54,759

)


Impairment charges


2,568


3,035


Deferred income tax expense (benefit)


6,304


(836

)

Changes in assets and liabilities, net of effects of businesses acquired and sold:


Receivables


(155,103

)


(45,530

)

Inventories


(96,505

)


41,598


Other assets


(9,335

)


9,053


Current liabilities


85,523


25,913


Other liabilities


8,335


(5,813

)

Other, net


(851

)


2,294


Net cash provided by operating activities


181,481


196,878


Cash flows from investing activities


Capital expenditures


(25,547

)


(29,204

)

Acquisition of businesses, net of cash acquired


(13,935

)


(72,648

)

Proceeds from sale of businesses, net of cash sold


74,250


Investments in unconsolidated affiliates


(1,613

)


Payment received for (issuance of) notes receivable


8,539


(9,155

)

Proceeds from sales of properties


2,124


12


Net cash provided by (used in) investing activities


43,818


(110,995

)


Cash flows from financing activities


Dividends paid to stockholders of Mueller Industries, Inc.


(21,846

)


(16,754

)

Repurchase of common stock


(5,574

)

Payment of contingent consideration


(1,250

)


(7,000

)

Issuance of debt


475,000


150,027


Repayments of debt


(680,572

)


(186,492

)

Repayment of debt by consolidated joint ventures, net


(4,865

)


(299

)

Net cash received (used) to settle stock-based awards


219


(160

)

Debt issuance costs


(1,111

)


Dividends paid to noncontrolling interests


(9,722

)


Net cash used in financing activities


(244,147

)


(66,252

)


Effect of exchange rate changes on cash


(377

)


(3,294

)


(Decrease) increase in cash, cash equivalents, and restricted cash


(19,225

)


16,337


Cash, cash equivalents, and restricted cash at the beginning of the period


127,376


98,042


Cash, cash equivalents, and restricted cash at the end of the period


$

108,151


$

114,379


Contacts

Jeffrey A. Martin
(901) 753-3226

PARIS--(BUSINESS WIRE)--Regulatory News:


Technip Energies (PARIS: TE) (ISIN:NL0014559478) and TÜV Rheinland have signed a strategic alliance to offer Project Management Consulting Services to clients in the infrastructure, energy, chemicals and mining & metals industries.

The 5-year alliance will leverage the two companies’ strengths as world class players in their respective industries and grow the footprint of both parties to better serve clients globally.

This alliance will enable both parties to expand their Project Management Consultancy as well as project controls and supervision capabilities into new market opportunities to create high-value services for clients.

Charles Cessot, Senior Vice President Strategy of Technip Energies, commented:We are proud to have signed this strategic alliance with TÜV Rheinland, one of the world’s leading testing service providers with which we have a strong relationship. This alliance is fully in line with our strategy to grow our services and advisory business. It also further demonstrates how we can bring our core capabilities to expand into adjacent markets and create added-value services.”

Petr Láhner, Executive Vice President Industrial Services & Cybersecurity of TÜV Rheinland, stated:New technologies, new products and new requirements shape our everyday life. The world around us is changing, so are we. It is our ultimate goal to satisfy our customers by providing global, market-driven and innovative services. This is what unites us with Technip Energies, a leading Engineering & Technology Company for the energy transition. We are therefore proud of the strategic cooperation we have now entered into.”

About Technip Energies

Technip Energies is a leading Engineering & Technology company for the energy transition, with leadership positions in Liquefied Natural Gas (LNG), hydrogen and ethylene as well as growing market positions in blue and green hydrogen, sustainable chemistry and CO2 management. The company benefits from its robust project delivery model supported by extensive technology, products and services offering.

Operating in 34 countries, our 15,000 people are fully committed to bringing our client’s innovative projects to life, breaking boundaries to accelerate the energy transition for a better tomorrow.

Technip Energies is listed on Euronext Paris with American depositary receipts (“ADRs”) traded over-the-counter in the United States.

For further information: www.technipenergies.com.

About TÜV Rheinland

TÜV Rheinland stands for safety and quality in virtually all areas of business and life. Founded almost 150 years ago, the company is one of the world’s leading testing service providers with more than 20,600 employees operating at sites on all continents around the globe. TÜV Rheinland’s highly qualified experts test technical systems and products around the world, support innovations in technology and business, train people in numerous professions and certify management systems according to international standards. In doing so, the independent experts generate trust in products as well as processes across global value-adding chains and the flow of commodities. Since 2006, TÜV Rheinland has been a member of the United Nations Global Compact to promote sustainability and combat corruption. For further information: www.tuv.com

Important Information for Investors and Securityholders

Forward-Looking Statement

This release contains “forward-looking statements” as defined in Section 27A of the United States Securities Act of 1933, as amended, and Section 21E of the United States Securities Exchange Act of 1934, as amended. Forward-looking statements usually relate to future events and anticipated revenues, earnings, cash flows or other aspects of Technip Energies’ operations or operating results. Forward-looking statements are often identified by the words “believe,” “expect,” “anticipate,” “plan,” “intend,” “foresee,” “should,” “would,” “could,” “may,” “estimate,” “outlook,” and similar expressions, including the negative thereof. The absence of these words, however, does not mean that the statements are not forward-looking. These forward-looking statements are based on Technip Energies’ current expectations, beliefs and assumptions concerning future developments and business conditions and their potential effect on Technip Energies. While Technip Energies believes that these forward-looking statements are reasonable as and when made, there can be no assurance that future developments affecting Technip Energies will be those that Technip Energies anticipates.

All of Technip Energies’ forward-looking statements involve risks and uncertainties (some of which are significant or beyond Technip Energies’ control) and assumptions that could cause actual results to differ materially from Technip Energies’ historical experience and Technip Energies’ present expectations or projections. Should one or more of these risks or uncertainties materialize, or should underlying assumptions prove incorrect, actual results may vary materially from those set forth in the forward-looking statements.

For information regarding known material factors that could cause actual results to differ from projected results, please see Technip Energies’ risk factors set forth in Technip Energies’ filings with the U.S. Securities and Exchange Commission, which include amendment no. 4 to Technip Energies’ registration statement on Form F-1 filed on February 11, 2021.

Forward-looking statements involve inherent risks and uncertainties and speak only as of the date they are made. Technip Energies undertakes no duty to and will not necessarily update any of the forward-looking statements in light of new information or future events, except to the extent required by applicable law.


Contacts

Investor relations
Phil Lindsay
Vice-President Investor Relations
Tel: +44 203 429 3929
Email: This email address is being protected from spambots. You need JavaScript enabled to view it.

Media relations
Stella Fumey
Director Press Relations & Digital Communications
Tel: +33 (1) 85 67 40 95
Email: This email address is being protected from spambots. You need JavaScript enabled to view it.

Jason Hyonne
Press Relations & Social Media Lead
Tel: +33 1 47 78 22 89
Email: This email address is being protected from spambots. You need JavaScript enabled to view it.

Companies offer coordinated smart charging solutions for electric bus market

BELMONT, Calif. & ATLANTA--(BUSINESS WIRE)--The Mobility House and Heliox announced that Heliox will integrate its latest smart chargers with The Mobility House’s Charging and Energy management solution ChargePilot, which intelligently optimizes charging schedules at the lowest utility electricity rate, to offer a coordinated charge management solution for large scale e-bus installations.


Using The Mobility House’s charging management solution, fleets powered by Heliox rapid chargers can lower charging energy costs by intelligently distributing available grid power and preventing expensive load peaks. The integration also provides a holistic view of all charging operations. Most recently, the combined solution is being leveraged for the Brookville Smart Energy Bus Depot in Maryland, a first-of-its-kind electrification project with more than 44 electric transit buses.

“Heliox is focused on supporting our transit and fleet customers from implementing their first chargers to installing and maintaining charging infrastructure as their e-fleet grows,” said David Aspinwall, President, Heliox North America. “The integration with The Mobility House will expand Heliox’s charge management options and can help customers lower both energy costs and the total cost of ownership of their fleets.”

Heliox is the global market leader in fast charging systems within public transport, e-trucks, marine, mining and port equipment. The company produces a range of chargers from 25kW mobile units up to 450kW en-route charging in the U.S. for the local market. All U.S. made products are UL certified and comply with the Buy America Act.

Designed to be hardware-agnostic and interface with a myriad of charging providers, The Mobility House’s ChargePilot successfully manages hundreds of global projects, including one of the largest U.S. electric fleets as well as the entire Austrian Postal Service fleet. Through ChargePilot, The Mobility House also supports vehicle-to-grid (V2G) integration to reduce strain of electric vehicle charging on the electricity grid and enable grid stabilizing services, a solution already deployed in Europe and Southeast Asia.

"Creating a cleaner, emissions-free climate is a global initiative. Through Heliox and The Mobility House's combined expertise, and commitment to technological innovations, we are on a path to reshaping the transportation industry not only in Europe but across the U.S.," said The Mobility House U.S. Managing Director Gregor Hintler.

The Mobility House and Heliox powerful smart charging technology has also been successfully deployed to Europe’s largest electric fleet of over 100 buses at Schiphol Airport in Amsterdam, the Avinor Airport in Oslo and for public transit operator Rhein-Neckar-Verkehr GmbH.

About Heliox

Founded in 2009, Heliox is the market leader in fast charging systems within public transport, e-trucks, marine, mining and port equipment. The premium quality and highly efficient chargers enable operators to improve their performance while lowering environmental impact. Heliox serves rapid charging needs for Volvo, Transdev-Connexxion and Arriva e-busses as well as MAN trucks.

In 2017, the company installed one of Europe’s first and largest rapid charging networks for the e-bus fleet in Eindhoven, The Netherlands; in 2018, the world’s largest rapid charging network for e-bus depot at Schiphol Airport, Amsterdam; and recently launched a new e-bus project in Montgomery County, Maryland which will debut in Spring 2022. Heliox operates globally with headquarters in the Netherlands and the United States. For more information about Heliox, go to: https://www.heliox-energy.com.

About The Mobility House

The Mobility House’s mission is to create an emissions-free energy and mobility future. Since 2009, the company has developed an expansive partner ecosystem to intelligently integrate electric vehicles into the power grid, including electric vehicle charger manufacturers, 750+ installation companies, 65+ energy suppliers, and automotive manufacturers ranging from Audi to Tesla. The intelligent Charging and Energy Management system ChargePilot and underlying EV Aggregation Platform enable customers and partners to integrate electric vehicles into the grid for optimized and future proof operations. The Mobility House’s unique vendor-neutral and interoperable technology approach to smart charging and energy management has been successful at over 500 commercial installations around the world. The Mobility House has more than 160 employees across its operations in Munich, Zurich and Belmont, Calif. For more information visit mobilityhouse.com.


Contacts

Lisa Langsdorf for Heliox
This email address is being protected from spambots. You need JavaScript enabled to view it. | 347-645-0484

Christine Bennett for The Mobility House
This email address is being protected from spambots. You need JavaScript enabled to view it. | +1 925.330.4783

DALLAS--(BUSINESS WIRE)--Kosmos Energy Ltd. (“Kosmos”) (NYSE/LSE:KOS) announced today that, subject to market conditions, it intends to offer $400 million aggregate principal amount of senior notes due 2027. Kosmos intends to use the net proceeds from the offering, together with cash on hand, to refinance the $400 million aggregate principal amount of private placement notes the Company issued to fund its acquisition of Anadarko WCTP Company.


The securities to be offered will not be registered under the Securities Act of 1933, as amended (the “Securities Act”), or any state securities laws and unless so registered, the securities may not be offered or sold in the United States without registration or an applicable exemption from the registration requirements of the Securities Act and applicable state securities or blue sky laws and foreign securities laws. The senior notes and the related guarantees will be offered only to persons reasonably believed to be qualified institutional buyers in reliance on the exemption from registration set forth in Rule 144A under the Securities Act and, outside the United States, to non-U.S. persons in reliance on the exemption from registration set forth in Regulation S under the Securities Act.

This press release is being issued pursuant to, and in accordance with, Rule 135c under the Securities Act, and is neither an offer to sell nor a solicitation of an offer to buy the notes or any other securities and shall not constitute an offer to sell or a solicitation of an offer to buy, or a sale of, the notes or any other securities in any jurisdiction in which such offer, solicitation or sale is unlawful.

About Kosmos Energy
Kosmos is a full-cycle deepwater independent oil and gas exploration and production company focused along the Atlantic Margins. Our key assets include production offshore Ghana, Equatorial Guinea and the U.S. Gulf of Mexico, as well as a world-class gas development offshore Mauritania and Senegal. We also maintain a sustainable proven basin exploration program in Equatorial Guinea, Ghana and the U.S. Gulf of Mexico. Kosmos is listed on The New York Stock Exchange and London Stock Exchange and is traded under the ticker symbol KOS. As an ethical and transparent company, Kosmos is committed to doing things the right way. The Company’s Business Principles articulate our commitment to transparency, ethics, human rights, safety and the environment.

Forward-Looking Statements
This press release contains forward-looking statements within the meaning of Section 27A of the Securities Act of 1933 and Section 21E of the Securities Exchange Act of 1934. All statements, other than statements of historical facts, included in this press release that address activities, events or developments that Kosmos expects, believes or anticipates will or may occur in the future are forward-looking statements. Kosmos’ estimates and forward-looking statements are mainly based on its current expectations and estimates of future events and trends, which affect or may affect its businesses and operations. Although Kosmos believes that these estimates and forward-looking statements are based upon reasonable assumptions, they are subject to several risks and uncertainties and are made in light of information currently available to Kosmos. When used in this press release, the words “anticipate,” “believe,” “intend,” “expect,” “plan,” “will” or other similar words are intended to identify forward-looking statements. Such statements are subject to a number of assumptions, risks and uncertainties, many of which are beyond the control of Kosmos (including, but not limited to, the impact of the COVID-19 pandemic), which may cause actual results to differ materially from those implied or expressed by the forward-looking statements. Further information on such assumptions, risks and uncertainties is available in Kosmos’ Securities and Exchange Commission (“SEC”) filings. Kosmos undertakes no obligation and does not intend to update or correct these forward-looking statements to reflect events or circumstances occurring after the date of this press release, except as required by applicable law. You are cautioned not to place undue reliance on these forward-looking statements, which speak only as of the date of this press release. All forward-looking statements are qualified in their entirety by this cautionary statement.

European Economic Area and United Kingdom Notices
Financial Conduct Authority (FCA) stabilization rules apply.
MiFIR professionals / ECPs only / No PRIIPs / UK PRIIPs KID - Manufacturer target market (MiFID II product governance) is eligible counterparties and professional clients only (all distribution channels). No PRIIPs regulation key information document (KID) has been prepared as the notes are not available to retail investors in the EEA or the United Kingdom.


Contacts

Investor Relations
Jamie Buckland
+44 (0) 203 954 2831
This email address is being protected from spambots. You need JavaScript enabled to view it.

Media Relations
Thomas Golembeski
+1-214-445-9674
This email address is being protected from spambots. You need JavaScript enabled to view it.

Post-consolidation Trading to Start October 25, 2021

TORONTO--(BUSINESS WIRE)--$NETZ #NETZ--Carbon Streaming Corporation (NEO: NETZ) (FSE: M2QA) (“Carbon Streaming” or the “Company”) is pleased to announce that the Company will start trading on a post-consolidated basis on October 25, 2021. The Company had previously announced its proposed consolidation (the “Consolidation”) of its issued and outstanding common shares (“Common Shares”), common share purchase warrants (“Warrants”) and special warrants (the “Special Warrants”) on September 17, 2021.


“The share consolidation is the latest step in proceeding with our U.S. listing strategy,” said Carbon Streaming CEO, Justin Cochrane. “We believe the potential U.S. listing will provide the Company with increased flexibility, enhanced liquidity and greater potential to achieve our ambitious growth plans.”

Consolidation Highlights:

  • The Consolidation will commence at the opening of trading on October 25, 2021.
  • The Company’s name and trading symbols will remain unchanged.
  • The Common Shares and listed Warrants will continue to trade on a post-Consolidation basis on the NEO Exchange Inc. (the “NEO Exchange”).

The board of directors of the Company previously determined in accordance with the constating documents of the Company that the Consolidation (reverse stock split) will be implemented on the basis of one post-Consolidation Common Share for every five pre-Consolidation Common Shares (1-for-5). The Company will also consolidate all of its issued and outstanding Warrants and Special Warrants on the same basis in accordance with the terms of their governing indentures and certificates. The Company has determined that the Consolidation will take effect after the close of business on Friday, October 22, 2021.

The Company has received NEO Exchange acceptance of the Consolidation, and commencing at the opening of trading on October 25, 2021, the Common Shares and listed Warrants will trade on a post-Consolidation basis on the NEO Exchange. The Company's name and trading symbols will remain unchanged.

In accordance with the provisions of the Business Corporations Act (British Columbia), if, as a result of the Consolidation, a shareholder would otherwise be entitled to a fraction of a Common Share in respect of the total aggregate number of pre-Consolidation Common Shares held by such shareholder, no such fractional Common Share will be awarded. The aggregate number of Common Shares that such shareholder is entitled to will, if the fraction is less than one half of one share, be rounded down to the next closest whole number of Common Shares, and if the fraction is at least one half of one share, be rounded up to one whole Common Share. By way of example, if a shareholder held 999 pre-Consolidation Common Shares, the shareholder would hold 200 Common Shares on a post-Consolidation basis.

Summary of Consolidation

The following table summarizes the structure of the Common Shares, Warrants and the Special Warrants following completion of the Consolidation:

Securities

Pre-Consolidation Terms

Post-Consolidation Terms (effective October 22, 2021)

Common Shares


(NEO: NETZ)


Common Shares in the capital of the Company.

Each holder of Common Shares shall receive one post-Consolidation Common Share for every five pre-Consolidation Common Shares held (1-for-5).


If a shareholder would otherwise be entitled to a fraction of a Common Share in respect of the total aggregate number of pre-Consolidation Common Shares held by such shareholder, no such fractional Common Share will be awarded. The aggregate number of Common Shares that such shareholder is entitled to will, if the fraction is less than one half of one share, be rounded down to the next closest whole number of Common Shares, and if the fraction is at least one half of one share, be rounded up to one whole Common Share.


Listed Warrants expiring on March 2, 2026


(NEO: NETZ.WT)


Each Listed Warrant exercisable to purchase one Common Share at an exercise price of Cdn$1.50 per share.

Each Listed Warrant exercisable to purchase one post-Consolidation Common Share at an exercise price of Cdn$7.50 per share.


All entitlements to fractional post-Consolidation Listed Warrants will be rounded down to the next whole number of post-Consolidation Listed Warrants in accordance with the provisions of the warrant indenture dated March 2, 2021 between the Company and Odyssey Trust Company and no consideration will be paid in lieu of fractional Listed Warrants.


Unlisted Special Warrants issued July 19, 2021


Each Special Warrant is exercisable (or will be deemed to be exercised) to acquire one Common Share and one Warrant.

Each Special Warrant exercisable to acquire one post-Consolidation Common Share and Warrant.


All entitlements to fractional post-Consolidation Special Warrants will be rounded down to the next whole number of post-Consolidation Special Warrants in accordance with the provisions of the special warrant indenture dated July 19, 2021 between the Company and Odyssey Trust Company and no consideration will be paid in lieu of fractional Special Warrants.


Unlisted Warrants expiring on September 19, 2026 *


* These Warrants are underlying the unexercised Special Warrants; the Company intends to list such Warrants on the NEO Exchange following deemed exercise of the Special Warrants

Each Warrant exercisable to purchase one Common Share at an exercise price of US$1.50 per share.

Each Warrant exercisable to purchase one post-Consolidation Common Share at an exercise price of US$7.50 per share.


All entitlements to fractional post-Consolidation Warrants will be rounded down to the next whole number of post-Consolidation Warrants in accordance with the provisions of the warrant indenture dated July 19, 2021 between the Company and Odyssey Trust Company and no consideration will be paid in lieu of fractional Warrants.


Unlisted Warrants represented by certificates (various expiry dates)


Each Warrant exercisable to purchase one Common Share at an exercise price of Cdn$0.125 - Cdn$0.75 per share.


Each Warrant exercisable to purchase one post-Consolidation Common Share at an exercise price of Cdn$0.625 - Cdn$3.75 per share.


Registered Shareholders – Action Required

Registered shareholders holding share certificates or direct registration statements will be mailed a letter of transmittal by the Company’s transfer agent, Odyssey Trust Company, advising of the Consolidation and instructing them to surrender their share certificates representing pre-Consolidation Common Shares for replacement certificates or a direct registration advice representing their post-Consolidation Common Shares. Until surrendered for exchange, following the effective date of the Consolidation, each share certificate or direct registration statement formerly representing pre-Consolidation Common Shares will be deemed to represent the number of whole post-Consolidation Common Shares to which the holder is entitled as a result of the Consolidation.

Beneficial Shareholders – No Action Required

Beneficial shareholders who hold uncertificated Common Shares (that is, Common Shares held in book-entry form and not represented by a physical share certificate or direct registration statement), either as registered holders or beneficial owners, will have their existing book-entry account(s) electronically adjusted by the Company's transfer agent or, for beneficial shareholders, by their brokerage firms, banks, trusts or other nominees that hold in street name for their benefit. Such holders do not need to take any additional actions to exchange their pre-Consolidation Common Shares for post-Consolidation Common Shares. If you hold your shares with such a bank, broker or other nominee, and if you have questions in this regard, you are encouraged to contact your nominee.

Holders of Warrants and Special Warrants – No Action Required

In accordance with their respective governing indentures or warrant certificates, as applicable, following the effective date of the Consolidation, each warrant certificate or special warrant certificate, as applicable, formerly representing pre-Consolidation Warrants or Special Warrants will be deemed to represent the number of whole post-Consolidation Warrants or Special Warrants to which the holder is entitled as a result of the Consolidation.

Holders who hold uncertificated Warrants or Special Warrants (that is, Warrants or Special Warrants held in book-entry form and not represented by a warrant or special warrant certificate or direct registration statement), either as registered holders or beneficial owners, will have their existing book-entry account(s) electronically adjusted by the Company's warrant agent or special warrant agent or, for beneficial shareholders, by their brokerage firms, banks, trusts or other nominees that hold in street name for their benefit. Such holders do not need to take any additional actions to exchange their pre-Consolidation Warrants or Special Warrants for post-Consolidation Warrants or Special Warrants. If you hold your Warrants or Special Warrants with such a bank, broker or other nominee, and if you have questions in this regard, you are encouraged to contact your nominee.

About Carbon Streaming Corporation

Carbon Streaming is a unique ESG principled investment vehicle offering investors exposure to carbon credits, a key instrument used by both governments and corporations to achieve their carbon neutral and net-zero climate goals. Our business model is focused on acquiring, managing and growing a high-quality and diversified portfolio of investments in projects and/or companies that generate or are actively involved, directly or indirectly, with voluntary and/or compliance carbon credits.

The Company invests capital through carbon credit streaming arrangements with project developers and owners to accelerate the creation of carbon offset projects by bringing capital to projects that might not otherwise be developed. Many of these projects will have significant social and economic co-benefits in addition to their carbon reduction or removal potential.

To receive corporate updates via e-mail as soon as they are published, please subscribe here.

Cautionary Statement Regarding Forward-Looking Information

This news release contains certain forward-looking statements and forward-looking information (collectively, ‘forward-looking information’) within the meaning of applicable securities laws. All statements, other than statements of historical fact, that address activities, events or developments that the Company believes, expects or anticipates will or may occur in the future (including, without limitation, statements with respect to the timing of the Consolidation, statements with respect to the potential additional listing of the company on a U.S. exchange and the expected benefits of such listing) are forward-looking information. This forward-looking information is based on the current expectations or beliefs of the Company based on information currently available to the Company. Forward-looking information is subject to a number of risks and uncertainties that may cause the actual results of the Company to differ materially from those discussed in the forward-looking information, and even if such actual results are realized or substantially realized, there can be no assurance that they will have the expected consequences to, or effects on, the Company. Factors that could cause actual results or events to differ materially from current expectations include, among other things: general economic, market and business conditions and the other risks disclosed under the heading “Risk Factors” and elsewhere in the Company’s AIF dated as of September 27, 2021 filed on SEDAR at www.sedar.com.

Any forward-looking information speaks only as of the date on which it is made and, except as may be required by applicable securities laws, the Company disclaims any intent or obligation to update any forward-looking information, whether as a result of new information, future events or results or otherwise. Although the Company believes that the assumptions inherent in the forward-looking information are reasonable, forward-looking information is not a guarantee of future performance and accordingly undue reliance should not be put on such statements due to the inherent uncertainty therein.


Contacts

ON BEHALF OF THE COMPANY:

Justin Cochrane, Chief Executive Officer
Tel: 647.846.7765
This email address is being protected from spambots. You need JavaScript enabled to view it.
www.carbonstreaming.com

INVESTOR INQUIRIES:
This email address is being protected from spambots. You need JavaScript enabled to view it.

Odyssey Trust Company
Tel: 587.885.0960
1-888-290-1175
https://odysseycontact.com/
www.odysseytrust.com

Ahead of COP26, a new IEA report urges rapid action to achieve net zero carbon emissions and identifies a key role for modern bioenergy in this transition

BETHESDA, Md.--(BUSINESS WIRE)--#Bioenergy--Enviva Partners, LP (NYSE: EVA) (“Enviva”) welcomes a new report from the International Energy Agency (IEA) for a more rapid transition to net-zero carbon emissions, a tripling of public investments in clean energy technology, and a growing role for modern bioenergy. The IEA World Energy Outlook (WEO) report, released last week, is designed to provide independent, objective scientific assistance to global decision-makers gathering at next month’s UN Climate Change Conference (COP26) in Glasgow.


The IEA warns that current progress on clean energy remains “far too slow to put global emissions into sustained decline towards net zero” and calls for urgent action from governments around the world. In laying out a more rapid energy transition plan, the report states: “Modern bioenergy plays a key role in meeting net zero pledges.”

“While there is no silver bullet to achieve net zero, sustainable wood bioenergy is a proven technology that can be expanded at scale – today – to accelerate the energy transition,” said John Keppler, Chairman and Chief Executive Officer at Enviva. “The IEA is a prominent member of the growing chorus of respected climate and energy authorities and policymakers that recognize the role modern bioenergy plays as a part of the global solution to climate change.”

To achieve net-zero carbon emissions by 2050, the report calls for coal to be phased out of the global power sector at a more rapid pace and replaced with low emissions energy sources that complement each other, such as wind, solar, nuclear, hydropower, and bioenergy. Displacing coal is a core mission for Enviva as a company. The report further states: “There is a growing role for alternative, low emissions fuels such as modern bioenergy and hydrogen-based fuels in all scenarios … These play a key role in the achievement of net zero targets …”

The IEA report echoes the sentiment of a UN Intergovernmental Panel on Climate Change report issued just a few months ago that time is running out to put in place the measures needed to prevent further irreversible damage from climate change to our planet.

Enviva agrees with the IEA on the need to dramatically increase levels of investment in new clean energy projects and infrastructure. Additionally, we must re-engineer the way capital is deployed globally to identify and support promising low emissions energy technologies faster.

Enviva supports the push for governments to take an active role in reducing carbon emissions and achieving global climate targets – but it is also imperative for industrialists to join in, if not lead, the fight. The private sector must develop a strategic plan to become low-carbon and/or net zero, both in production processes and supply chains. As the world’s largest producer of sustainable wood biomass, Enviva plays a critical role in the clean energy transition by providing a low-carbon alternative to fossil fuels that is reliable and dispatchable. Sustainable wood biomass from Enviva is currently being deployed to meet global demand for electricity and heat and can provide a low emission energy alternative for industrial applications such as the production of steel, cement, and lime.

To take a look at the IEA’s World Energy Outlook 2021 Report click here. To learn more about Enviva and its 2030 net-zero commitment, click here.

About Enviva

Enviva (NYSE: EVA) is the world’s largest producer of industrial wood pellets, a renewable and sustainable energy source that is produced by aggregating a natural resource, wood fiber, and processing it into a transportable form, wood pellets. Enviva sells a significant majority of its wood pellets through long-term, take-or-pay off-take contracts with creditworthy customers in the United Kingdom, the European Union, and Japan. Enviva owns and operates 10 plants with a combined production capacity of approximately 6.2 million metric tons per year in Virginia, North Carolina, South Carolina, Georgia, Florida, and Mississippi. In addition, Enviva exports wood pellets through its deep-water marine terminals at the Port of Chesapeake, Virginia, the Port of Wilmington, North Carolina, and the Port of Pascagoula, Mississippi, and from third-party deep-water marine terminals in Savannah, Georgia, Mobile, Alabama, and Panama City, Florida.

To learn more about Enviva please visit our website at www.envivabiomass.com. Follow Enviva on social media @Enviva.

Cautionary Note Concerning Forward-Looking Statements

The information included herein and in any oral statements made in connection herewith may include “forward-looking statements” within the meaning of Section 27A of the Securities Act of 1933, as amended, and Section 21E of the Securities Exchange Act of 1934, as amended. Forward-looking statements may present expectations regarding future regulatory developments and the evolution of the renewable energy industry and bioenergy’s role within it. Forward-looking statements involve significant risks and uncertainties that could cause such expectations to be materially inaccurate. Readers are cautioned not to place undue reliance on the forward-looking statements contained herein.


Contacts

MEDIA:
Jacob Westfall
This email address is being protected from spambots. You need JavaScript enabled to view it.
+1-301-657-5560

Mississippi Clean Hydrogen Hub Represents Largest Green Hydrogen Project of its Kind in the U.S., Bringing Economic Revitalization and Reliable 100% Carbon-free Energy to Mississippi

JACKSON, Miss.--(BUSINESS WIRE)--Today, Hy Stor Energy LP (Hy Stor Energy) announced its mission to develop and advance the production, storage and delivery of green hydrogen at scale in the United States. Hy Stor Energy, together with its strategic partner Connor, Clark & Lunn Infrastructure (CC&L Infrastructure), will develop, commercialize, and operate large-scale, long-duration hydrogen hubs that will serve as a model for our nation’s green hydrogen development efforts going forward. The first major project, the Mississippi Clean Hydrogen Hub, is under active development and has multiple sites permitted for hydrogen storage.


The planned scale of the Mississippi Clean Hydrogen Hub is up to 10 times larger than any other green hydrogen project under consideration in the U.S. and would be one of the largest in the world. During its first phase, the Mississippi Clean Hydrogen Hub is expected to produce an estimated 110 million kilograms (kg) of green hydrogen annually and store more than 70 million kg of green hydrogen in its underground salt caverns. Pending regulatory approvals and equipment availability, the hub’s first phase is planned to enter commercial service by 2025.

“Mississippi's well-established and robust energy network is strategically positioned to support Hy Stor Energy and the growth of a Mississippi hydrogen hub. We welcome this innovative opportunity to share our unique salt dome storage capacity and our trained workforce,” said Lieutenant Governor of Mississippi Delbert Hosemann.

“The biggest challenge the energy transition faces today is how to bridge the gap to allow renewables to replace fossil fuel electric power generation safely and reliably. In an era of increasingly frequent extreme weather, it’s imperative to have the ability to store large quantities of renewable energy capable of providing multiple days of power over long periods of high demand,” said Laura L. Luce, CEO of Hy Stor Energy. “We believe the approach we’re taking in Mississippi will become the blueprint for future green hydrogen projects that not only address the energy transition challenges we face but also bring new jobs, economic revitalization, and low-cost energy to communities in the region. We see this as an important way of advancing U.S. climate leadership.”

“Green hydrogen will play a vital role in the decarbonization of our global societies by offering a viable pathway towards zero emissions,” said Claire Behar, CCO of Hy Stor Energy. “Hy Stor Energy will serve customers across a variety of industries including transportation, power generation, and difficult to decarbonize sectors, such as manufacturing and industrials, where green hydrogen can replace fossil fuels.”

This project will greatly benefit the state of Mississippi’s economy and environment by providing reliable clean energy, while stimulating growth for the long term. The development and commercialization phases are expected to create hundreds of new jobs and attract new manufacturing and industrial companies to the state. The Mississippi Clean Hydrogen Hub will also bring education and workforce development opportunities, supporting the transition to a local and resilient green hydrogen energy system.

“We’re excited to welcome Hy Stor Energy and hydrogen innovators to Mississippi,” said Speaker of the Mississippi House of Representatives Philip Gunn. “Their investment and eventual success here will improve workforce development, bring high paying jobs to our state, and encourage other businesses to invest in the talent and infrastructure we’ve built together.”

“We have worked with a number of cutting-edge and innovative hydrogen-related projects across the world,” said Matt Weaver, Business Lead – North America of Nel Hydrogen. “Based on that experience, we believe that the Mississippi Clean Hydrogen Hub proposed by Hy Stor Energy is truly groundbreaking and can serve as a model for green hydrogen efforts going forward.”

Hy Stor Energy selected Mississippi to develop its first green hydrogen hub because of the state’s distinct geology, strategic geographic location, abundance of available water and renewable energy from the sun and wind, and collaborative business environment. The region boasts multiple naturally occurring underground salt formations that can support development of large caverns, allowing for the safe and effective storage of several years’ worth of green hydrogen. These strategic locations are enhanced by the proximity to existing infrastructure including an array of interstate gas transportation pipelines and electric transmission lines, as well as interstate highways, rail lines, deep water ports, and the Mississippi River.

About Hy Stor Energy

Hy Stor Energy is facilitating the transition to a fossil-free energy environment by developing and advancing green hydrogen at scale through the development, commercialization, and operation of green hydrogen hub projects. Large, fully integrated projects produce, store, and deliver 100% carbon-free energy, providing customers with safe and reliable renewable energy on-demand. Developed as part of an integrated hub, these projects couple on-site green hydrogen production with integrated long-duration storage and distribution – using scale to reduce costs. Hy Stor Energy, led by energy storage industry and hydrogen technology veteran Laura L. Luce, has an innovative team with deep expertise and is positioned as a leader in the green hydrogen revolution. For more information, please visit www.hystorenergy.com.

About Connor, Clark & Lunn Infrastructure

CC&L Infrastructure invests in middle-market infrastructure assets with highly attractive risk-return characteristics, long lives and the potential to generate stable cash flows. The firm has been an active investor and owner of renewable energy assets for more than 15 years. Its portfolio includes more than 60 hydro, solar, and wind facilities totaling 1.4 GW of clean energy generating capacity globally. CC&L Infrastructure is a part of Connor, Clark & Lunn Financial Group Ltd., a multi-boutique asset management firm whose affiliates collectively manage over CAD$100 billion in assets. For more information, please visit www.cclinfrastructure.com.


Contacts

Darren Goode
Silverline on behalf of Hy Stor Energy LP
202-550-6619
This email address is being protected from spambots. You need JavaScript enabled to view it.

Kaitlin Blainey
Vice President
Connor, Clark & Lunn Infrastructure
(416) 216-8047
This email address is being protected from spambots. You need JavaScript enabled to view it.

LONDON--(BUSINESS WIRE)--Ecofin, a sustainable investment manager, announced the launch of an open-end fund, Ecofin Global Energy Transition Fund (“EETIX” or the “fund”), designed to attempt to benefit from the flow of capital into corporations who are disrupting the way energy is produced and consumed globally.


EETIX invests in companies that are exposed to structural growth opportunities related to the energy transition associated with decarbonization. The fund brings to launch a strong performance track record of more than two years,1 has an A MSCI ESG rating (as of October 15, 2021) and is available to U.S. retail and institutional investors through its institutional and A class shares.

The fund’s portfolio will invest in companies that derive at least 50% of their revenues, profit or assets, or invest a significant portion of their capital expenditures, to activities related to the following major investment themes: electrification, clean transportation, industrial and building efficiency, environment or other activities related to decarbonization and which represent a global portfolio across Asia-Pacific, Europe, and North America.

“The companies in our investment universe are advancing solutions which we believe positively contribute to the energy transition and are well aligned with global climate mitigation goals. Our investment team’s longstanding sustainable investing experience, coupled with proprietary viewpoints on climate change and decarbonization policy framework and laws, seek to drive alpha for our investors,” said Max Slee, Portfolio Manager. “Since inception of the fund’s track record, we have delivered attractive risk-adjusted returns and alpha with a similar beta and lower volatility relative to the broad global equity market by investing in companies that have structurally positive exposure to long-term major energy transition trends.1,2 Please click here for the fund's standardized performance.

Performance data quoted represents past performance; past performance does not guarantee future results. The investment return and principal value of an investment will fluctuate so that an investor’s shares, when redeemed, may be worth more or less than their original cost. Current performance of the fund may be lower or higher than the performance quoted. Performance data current to the most recent month end may be obtained by calling 855-822-3863.

Senior Portfolio Manager Matt Breidert added, “Companies at the sharp end of innovation and developing strategies that enable sustainability goals to be accomplished are growing and we expect their shares to be rewarding for investors. Our investment universe is comprised of six of the eleven GICS® sectors providing broad exposure and upside potential. Additionally, sustainability objectives and environmental, social and governance (ESG) factors are used as a means for identifying structural growth opportunities in the universe.”

“The impact of addressing sustainable issues, such as climate change, has become a compelling investment case and, just as important, not factoring these issues represents an investment risk. We are thrilled to offer U.S. investors open-end funds focused on climate action as we believe investors are materially underweight in their sustainable allocations,” said Brent Newcomb, President of Ecofin.

To learn more about EETIX and key reasons to invest, click here for a short video or visit ecofininvest.com/eetix.

About Ecofin

Ecofin is a sustainable investment firm dedicated to uniting ecology and finance. Our mission is to generate strong risk-adjusted returns while optimizing investors’ impact on society. We are socially-minded, ESG-attentive investors, harnessing years of expertise investing in sustainable infrastructure, energy transition, clean water & environment and social impact. Our strategies are accessible through a variety of investment solutions and seek to achieve positive impacts that align with UN Sustainable Development Goals by addressing pressing global issues surrounding climate action, clean energy, water, education, healthcare and sustainable communities. Ecofin Investments, LLC is the parent of registered investment advisers Ecofin Advisors, LLC and Ecofin Advisors Limited (collectively "Ecofin"). For additional information, please visit ecofininvest.com.

1The Ecofin Global Energy Transition Fund (the Fund) is a newly registered mutual fund. As of the date of this Prospectus the Fund does not have a full calendar year of performance as a mutual fund. Prior performance shown for the period prior to the Fund's registration as a mutual fund is for a series of the Long Only sub-fund of the Ecofin Vista Master Fund Limited, established in May 2019 (the “Predecessor Fund”), an unregistered Cayman Islands limited liability company. The Predecessor Fund was reorganized into the Fund by transferring substantially all of the Predecessor Fund’s assets to the Fund in exchange for Institutional Class shares of the Fund on October 15, 2021, the date that the Fund commenced operations (the “Reorganization”). The Predecessor Fund was managed in a materially equivalent manner as the Fund. The Sub-Adviser served as the investment adviser to the Predecessor Fund for the entire performance period shown and is responsible for the portfolio management and trading for the Fund. Each of the Fund’s portfolio managers was a portfolio manager of the Predecessor Fund at the time of the Reorganization. The Fund’s investment objective, policies, guidelines and restrictions are, in all materially equivalent respects, the same as those of the Predecessor Fund.

2The MSCI ACWI Index captures large and mid cap representation across 23 Developed Markets and 27 Emerging Markets countries. The index covers approximately 85% of the global investable equity opportunity set. MSCI Net Total Return (Net TR) indices reinvest dividends after the deduction of withholding taxes, using (for international indexes) a tax rate applicable to non-resident institutional investors who do not benefit from double taxation treaties.

Before investing in the fund, investors should consider their investment goals, time horizons and risk tolerance. The fund’s investment objective, risks, charges and expenses must be considered carefully before investing. The summary and statutory prospectus contains this and other important information about the fund and may be obtained by calling 855-822-3863 or visiting www.ecofininvest.com. Read it carefully before investing.

Investing involves risks. Principal loss is possible. The fund is non-diversified, meaning it may concentrate its assets in fewer individual holdings than a diversified fund. Therefore, the fund is more exposed to individual stock volatility than a diversified fund. Investing in specific sectors such as energy infrastructure and renewable energy infrastructure may involve greater risk and volatility than less concentrated investments. If for any taxable year the Fund fails to qualify as a RIC, the Fund’s taxable income will be subject to federal income tax at regular corporate rates. The resulting increase to the Fund’s expenses will reduce its performance and its income available for distribution to shareholders. Investments in foreign companies involve risk not ordinarily associated with investments in securities and instruments of U.S. issuers, including risks related to political, social and economic developments abroad, differences between U.S. and foreign regulatory and accounting requirements, tax risk and market practices, as well as fluctuations in foreign currencies. These risks are greater for investments in emerging markets. The fund invests in small and mid-cap companies, which involve additional risks such as limited liquidity and greater volatility than larger companies. Investments in debt securities typically decrease in value when interest rates rise. This risk is usually greater for longer-term debt securities. The fund may also invest in derivatives including options, futures and swap agreements, which can be highly volatile, illiquid and difficult to value, and changes in the value of a derivative held by the fund may not correlate with the underlying instrument or the fund’s other investments and can include additional risks such as liquidity risk, leverage risk and counterparty risk that are possibly greater than risks associated with investing directly in the underlying investments.

The fund applies ESG criteria to the investment process and may exclude securities of certain issuers for non-investment reasons and therefore the Fund may forgo some market opportunities available to funds that do not use ESG criteria.

TCA Advisors is the adviser to the Fund and Ecofin Advisors Limited is the sub-adviser. Primary responsibility for the day-to-day management of the Fund’s portfolio is the joint responsibility of Matthew Breidert and Max Slee, both of the Sub-Adviser. Mr. Breidert is a Senior Portfolio Manager and Managing Director of the Sub- Adviser. Mr. Slee is a Portfolio Manager and Director of the Sub-Adviser. Each portfolio manager has managed the Fund since its inception in October 2021. Mr. Breidert and Mr. Slee were portfolio managers of the Predecessor Fund since its inception in May 2019.

Alpha is a measurement of excess return relative to the return of a benchmark. Beta is a measure of a stock's volatility in relation to the overall market. Volatility is the annualized standard deviation of the monthly NAV returns since inception. Standard deviation is a measure of the dispersion of a set of data from its mean. The more spread apart the data, the higher the deviation. Standard deviation is calculated as the square root of variance and is used by investors as a gauge for the amount of expected volatility. Sharpe ratio measures risk-adjusted performance. It is calculated by subtracting the risk-free rate from the rate of return for a portfolio and dividing the result by the standard deviation of the portfolio returns.

The MSCI ESG rating represents the aggregate ranking of the Fund’s holdings as of 10/15/2021. Certain information ©2021 MSCI ESG Research LLC. Reproduced by permission; no further distribution.

MSCI ESG Research LLC’s (“MSCI ESG”) Fund Metrics and Ratings (the “Information”) provide environmental, social and governance data with respect to underlying securities within more than 31,000 multi-asset class Mutual Funds and ETFs globally. MSCI ESG is a Registered Investment Adviser under the Investment Advisers Act of 1940. MSCI ESG materials have not been submitted to, nor received approval from, the US SEC or any other regulatory body. None of the Information constitutes an offer to buy or sell, or a promotion or recommendation of, any security, financial instrument or product or trading strategy, nor should it be taken as an indication or guarantee of any future performance, analysis, forecast or prediction. None of the Information can be used to determine which securities to buy or sell or when to buy or sell them. The Information is provided “as is” and the user of the Information assumes the entire risk of any use it may make or permit to be made of the Information. The MSCI ESG Fund Ratings is designed to assess the resilience of a fund’s aggregate holdings to long term ESG risks. Highly rated funds consist of issuers with leading or improving management of key ESG risks.

  • AAA, AA: Leader- The companies that the fund invests in tend to show strong and/or improving management of financially relevant environmental, social and governance issues. These companies may be more resilient to disruptions arising from ESG events.
  • A, BB, BB: Average- The fund invests in companies that tend to show average management of ESG issues, or in a mix of companies with both above-average and below-average ESG risk management.
  • B, CCC: Laggard- The fund is exposed to companies that do not demonstrate adequate management of the ESG risks that they face or show worsening management of these issues. These companies may be more vulnerable to disruptions arising from ESG events.

The Fund ESG Rating is calculated as a direct mapping of “Fund ESG Quality Score” to letter rating categories.

  • 8.6- 10: AAA
  • 7.1- 8.6: AA
  • 5.7- 7.1: A
  • 4.3- 5.7: BBB
  • 2.9- 4.3: BB
  • 1.4- 2.9: B
  • 0.0- 1.4: CCC

The “Fund ESG Quality Score” assesses the resilience of a fund’s aggregate holdings to long term ESG risks. Highly rated funds consist of issuers with leading or improving management of key ESG risks, based on a granular breakdown of each issuer’s business: its core product or business segments, the locations of its assets or revenues, and other relevant measures such as outsourced production. The “Fund ESG Quality Score” is provided on a 0-10 score, with 0 and 10 being the respective lowest and highest possible fund scores.

The “Fund ESG Quality Score” is assessed using the underlying holding’s “Overall ESG Scores”, “Overall ESG Ratings”, and “Overall ESG Rating Trends”. It is calculated in a series of 3 steps.

Step 1: Calculate the “Fund Weighted Average ESG Score” of the underlying holding’s “Overall ESG Scores”. The Overall ESG Scores represent either the ESG Ratings Final Industry-Adjusted Score or Government Adjusted ESG Score of the issuer. Methodology for the issuer level scores are available in the MSCI ESG Ratings Methodology document.

Step 2: Calculate adjustment % based on fund exposure to “Fund ESG Laggards (%)”, “Fund ESG Trend Negative (%)”, and “Fund ESG Trend Positive (%)”.

Step 3: Multiply the “Fund Weighted Average ESG Score” by (1 + Adjustment %).

For more information please visit https://www.msci.com/esg-fund-ratings.

Quasar Distributors, LLC, distributor

Safe harbor statement

This press release shall not constitute an offer to sell or a solicitation to buy, nor shall there be any sale of these securities in any state or jurisdiction in which such offer or solicitation or sale would be unlawful prior to registration or qualification under the laws of such state or jurisdiction.

Cautionary Statement Regarding Forward-Looking Statements

This press release contains certain statements that may include “forward-looking statements” within the meaning of Section 27A of the Securities Act of 1933 and Section 21E of the Securities Exchange Act of 1934. All statements, other than statements of historical fact, included herein are "forward-looking statements." Although the fund and its adviser and sub-adviser believe that the expectations reflected in these forward-looking statements are reasonable, they do involve assumptions, risks and uncertainties, and these expectations may prove to be incorrect. Actual results could differ materially from those anticipated in these forward-looking statements as a result of a variety of factors, including those discussed in the fund’s reports that are filed with the Securities and Exchange Commission. You should not place undue reliance on these forward-looking statements, which speak only as of the date of this press release. Other than as required by law, the funds and is adviser and sub-adviser do not assume a duty to update this forward-looking statement.


Contacts

Maggie Zastrow
(913) 981-1020
This email address is being protected from spambots. You need JavaScript enabled to view it.

Accelerating Llanos Basin Development and Exploration Drilling
Index Inclusion to Expand Investor Base

BOGOTA, Colombia--(BUSINESS WIRE)--GeoPark Limited (“GeoPark” or the “Company”) (NYSE: GPRK), a leading independent Latin American oil and gas explorer, operator and consolidator with operations and growth platforms in Colombia, Ecuador, Chile, Brazil, and Argentina, today announced its operational update for the three-month period ended September 30, 2021 (“3Q2021”).


All figures are expressed in US Dollars. Growth comparisons refer to the same period of the prior year, except when otherwise specified.

Highlights

Oil and Gas Production

  • Consolidated oil and gas production of 37,859 boepd, up 4% compared to 2Q2021
  • Oil production of 32,844 bopd, up 6% compared to 2Q2021 due to increased production in Colombia
  • Gas production of 30.1 mmcfpd, down 9% compared to 2Q2021 due to lower production in Chile and Brazil
  • On track to reach 2021 full-year guidance of 38,000-40,000 boepd

Drilling Activity in Colombia Accelerates

Currently operating four drilling rigs and three workover rigs in Colombia

In the Llanos 34 block (GeoPark operated, 45% WI):

  • Drilled and put on production six new wells
  • Successful results in the Tigui field area, potentially expanding its northern and southeast margins and opening new drilling opportunities

In the CPO-5 block (GeoPark non-operated, 30% WI):

  • Civil works and other pre-drilling activities ongoing, with drilling expected to initiate in 4Q2021
  • The operator ONGC signed contracts for two drilling rigs for two years with one rig currently in the block
  • ONGC and GeoPark Technical Workshop held in New Delhi to align and define 2022 work program

In the Platanillo block (GeoPark operated, 100% WI):

  • Spudded the Alea Oeste 1 development well, to be followed by an additional well in 4Q2021

In the Llanos 94 block (GeoPark non-operated, 50% WI):

  • Drilling the Humea exploration prospect in 4Q2021

Drilling Activity in Ecuador Begins

In the Perico block (GeoPark non-operated, 50% WI):

  • Pre-drilling activities underway for the Jandaya exploration prospect to be drilled by year-end 2021 or early 2022

In the Espejo block (GeoPark operated, 50% WI):

  • 3D seismic acquisition of 60 sq km expected to start in 4Q2021

2022 Work Program and Capital Allocation Process

  • Focused on low-risk rapid cash flow generation and production and development growth from the Llanos 34 and CPO-5 blocks
  • Targeting meaningful high potential short-cycle, near-field exploration projects on big proven acreage position adjacent to core Llanos 34 block
  • 2022 work program and investment guidelines to be released in November with 3Q2021 results

ESG+ Actions

  • GeoPark honored with the Equipares Silver Award by Colombian Ministry of Labor, measuring our commitment to promote equality, inclusion and diversity
  • Finalizing details of strategic medium and long-term greenhouse gas reduction policy, to be released in November 2021
  • Released GeoPark’s 2020 annual sustainability report (the SPEED report), available on the Company’s website

Cash and Shareholder Returns

  • Quarterly Dividend increased to $0.041 per share, or $2.5 million (from $1.25 million), paid on August 31, 2021
  • Expedited discretionary share buyback program. Acquired 608,579 shares for $7.2 million since November 6, 2020, while executing self-funded and flexible work programs, and paying down debt

Market Index Inclusion to Continue Expanding GeoPark’s Investor Base

  • In September 2021, GeoPark was included in the S&P Global BMI Index and sub-indexes, including the S&P Emerging BMI, the S&P Colombia BMI, the S&P Latin America BMI, and the S&P Global BMI Energy, among others

Portfolio Consolidation and Management

  • Argentina: expediting divestment with sale agreement expected to be signed in 4Q2021
  • Peru: obtained final approval to transfer 100% of the Morona block to Petroperu following the Supreme Decree issued by the Peruvian Government
  • Brazil: Manati gas field divestment process ongoing, expected to close in 1H2022

Breakdown of Quarterly Production by Country

The following table shows production figures for 3Q2021, as compared to 3Q2020:

3Q2021

3Q2020

Total
(boepd)

Oil
(bopd)a

Gas
(mcfpd)

Total
(boepd)

% Chg.

Colombia

31,565

31,336

1,374


31,297

1%

Chile

2,354

277

12,462


3,610

-35%

Brazil

1,791

24

10,602


1,581

13%

Argentina

2,149

1,207

5,652


2,357

-9%

Total

37,859

32,844

30,090


38,845

-3%

a)

Includes royalties paid in kind in Colombia for approximately 1,213 bopd in 3Q2021. No royalties were paid in kind in Brazil, Chile, or Argentina.

Quarterly Production Evolution

(boepd)

3Q2021

2Q2021

1Q2021

4Q2020

3Q2020

Colombia

31,565

29,571

31,455

31,858

31,297

Chile

2,354

2,584

2,491

3,133

3,610

Brazil

1,791

2,080

1,984

2,167

1,581

Argentina

2,149

2,254

2,201

2,146

2,357

Total

37,859

36,489

38,131

39,304

38,845

Oil

32,844

30,962

32,877

33,238

32,875

Gas

5,015

5,527

5,254

6,065

5,970

Oil and Gas Production Update

Consolidated:

Oil and gas production in 3Q2021 increased by 4% to 37,859 boepd versus 2Q2021. Compared to 3Q2020, oil and gas production decreased by 3%, resulting from lower production in Chile and Argentina, partially offset by higher production in Colombia and Brazil.

Oil represented 87% and 85% of total reported production in 3Q2021 and 3Q2020, respectively.

Colombia:

Average net oil and gas production in Colombia increased by 1% to 31,565 boepd in 3Q2021 compared to 31,297 boepd in 3Q2020.

Oil and gas production in main blocks in Colombia was:

  • Llanos 34 block net average production was 25,130 bopd in 3Q2021 (or 55,845 bopd gross)
  • CPO-5 block net average production was 3,789 bopd (or 12,630 bopd gross) in 3Q2021
  • Platanillo block average production was 2,185 bopd in 3Q2021

Main activities in operated and non-operated blocks:

  • Llanos 34 block: Tigui 17, Tigui Este and Tigui 24 wells were drilled to test northern and southeast boundaries of the Tigui oilfield, opening new potential areas for further delineation. These three wells are currently producing approximately 3,500 bopd gross
  • CPO-5 block: civil works and other pre-drilling activities underway, with rig in the block expecting to spud in 4Q2021
  • Platanillo block: currently spudding the Alea Oeste 1 development well, to be followed by an additional development well in 4Q2021
  • Llanos 94 block: pre-drilling activities underway in the Humea exploration prospect, with spudding expected in 4Q2021
  • Llanos 87 block (GeoPark operated, 50% WI): environmental, permitting and other activities in progress, targeting to initiate exploration drilling in 2022

Chile:

Average net production in Chile decreased by 35% to 2,354 boepd in 3Q2021 compared to 3,610 boepd in 3Q2020, resulting from lower gas production in the Jauke and Jauke Oeste gas fields. The production mix during 3Q2021 was 88% gas and 12% light oil (compared to 90% gas and 10% light oil in 3Q2020).

Brazil:

Average net production in Brazil increased 13% to 1,791 boepd in 3Q2021 compared to 1,581 boepd in 3Q2020 in response to higher gas demand in northern Brazil. The production mix was 99% natural gas and 1% oil and condensate in 3Q2021 and 3Q2020.

At the end of September 2021, Petrobras informed that production in the Manati field was preventatively interrupted due to a small gas leak that affected operations from September 28 to October 3. Production in the field was restored and has been flowing normally since then.

Argentina:

Average net production in Argentina decreased by 9% to 2,149 boepd in 3Q2021 compared to 2,357 boepd in 3Q2020. The production mix during 3Q2021 was 56% oil and 44% natural gas (compared to 59% oil and 41% natural gas in 3Q2020).

OTHER NEWS / RECENT EVENTS

Reporting Date for 3Q2021 Results Release and 2022 Work Program and Investment Guidance

GeoPark will report its 3Q2021 financial results on Wednesday, November 10, 2021 after the market close.

In conjunction with the 3Q2021 results press release, GeoPark management will host a conference call on November 11, 2021 at 10:00 am (Eastern Daylight Time) to discuss the 3Q2021 financial results and the work program and investment guidelines for 2022. To listen to the call, participants can access the webcast located in the Investor Support section of the Company’s website at www.geo-park.com, or by clicking below:

https://event.on24.com/wcc/r/3404998/49B85E71C767F2F0CD2B7D8F29290C79

Interested parties may participate in the conference call by dialing the numbers provided below:

United States Participants: 1 844-200-6205
International Participants: +1-929-526-1599
Passcode: 477606

Please allow extra time prior to the call to visit the website and download any streaming media software that might be required to listen to the webcast.

An archive of the webcast replay will be made available in the Investor Support section of the Company’s website at www.geo-park.com after the conclusion of the live call.

GLOSSARY


ANP

Brazil’s National Agency of Petroleum, Natural Gas and Biofuels


Operating netback

Revenue, less production, and operating costs (net of accrual of stock options and stock awards), selling expenses and realized portion of commodity risk management contracts. Operating netback is equivalent to Adjusted EBITDA net of cash expenses included in Administrative, Geological and Geophysical and Other operating costs 

Bbl

Barrel


Boe

Barrels of oil equivalent 

Boepd

Barrels of oil equivalent per day 

Bopd

Barrels of oil per day 

D&M

DeGolyer and MacNaughton 

F&D costs


Finding and development costs, calculated as capital expenditures divided by the applicable net reserves additions before changes in Future Development Capital

Km

Kilometers


Mboe

Thousand barrels of oil equivalent 

Mmbo

Million barrels of oil 

Mmboe

Million barrels of oil equivalent 

Mcfpd

Thousand cubic feet per day 

Mmcfpd

Million cubic feet per day 

Mm3/day

Thousand cubic meters per day 

NPV10

Present value of estimated future oil and gas revenues, net of estimated direct expenses, discounted at an annual rate of 10% 

PRMS

Petroleum Resources Management System


Sq km

Square Kilometer 

WI

Working Interest


NOTICE

Additional information about GeoPark can be found in the “Investor Support” section on the website at www.geo-park.com.

Rounding amounts and percentages: Certain amounts and percentages included in this press release have been rounded for ease of presentation. Percentage figures included in this press release have not in all cases been calculated based on such rounded figures but based on such amounts prior to rounding. For this reason, certain percentage amounts in this press release may vary from those obtained by performing the same calculations using the figures in the financial statements. In addition, certain other amounts that appear in this press release may not sum due to rounding.

CAUTIONARY STATEMENTS RELEVANT TO FORWARD-LOOKING INFORMATION

This press release contains statements that constitute forward-looking statements. Many of the forward- looking statements contained in this press release can be identified using forward-looking words such as ‘‘anticipate,’’ ‘‘believe,’’ ‘‘could,’’ ‘‘expect,’’ ‘‘should,’’ ‘‘plan,’’ ‘‘intend,’’ ‘‘will,’’ ‘‘estimate’’ and ‘‘potential,’’ among others.

Forward-looking statements that appear in a number of places in this press release include, but are not limited to, statements regarding the intent, belief or current expectations, regarding various matters, including the divestment process of the Manati gas field, expected production growth, expected schedule, economic recovery, payback timing, IRR, drilling activities, demand for oil and gas, oil and gas prices, capital expenditures plan, work program and investment guidelines, our strategic medium and long-term greenhouse gas reduction policy, the potential expansion of our investors’ base, our divestment initiative in Argentina regulatory approvals, reserves and exploration resources. Forward-looking statements are based on management’s beliefs and assumptions, and on information currently available to the management. Such statements are subject to risks and uncertainties, and actual results may differ materially from those expressed or implied in the forward-looking statements due to various factors. Oil and gas production figures included in this release are stated before the effect of royalties paid in kind, consumption, and losses, except when specified.

Forward-looking statements speak only as of the date they are made, and the Company does not undertake any obligation to update them considering new information or future developments or to release publicly any revisions to these statements to reflect later events or circumstances, or to reflect the occurrence of unanticipated events. For a discussion of the risks facing the Company which could affect whether these forward-looking statements are realized, see filings with the U.S. Securities and Exchange Commission.

Readers are cautioned that the exploration resources disclosed in this press release are not necessarily indicative of long-term performance or of ultimate recovery. Unrisked prospective resources are not risked for change of development or chance of discovery. If a discovery is made, there is no certainty that it will be developed or, if it is developed, there is no certainty as to the timing of such development. There is no certainty that any portion of the prospective resources will be discovered. If discovered, there is no certainty that it will be commercially viable to produce any portion of the resources. Prospective resource volumes are presented as unrisked.


Contacts

INVESTORS:
Stacy Steimel
Shareholder Value Director
T: +562 2242 9600
This email address is being protected from spambots. You need JavaScript enabled to view it.

Miguel Bello
Market Access Director
T: +562 2242 9600
This email address is being protected from spambots. You need JavaScript enabled to view it.

Investor Relations Director
Diego Gully
T: +5411 4312 9400
This email address is being protected from spambots. You need JavaScript enabled to view it.

MEDIA:
Communications Department
This email address is being protected from spambots. You need JavaScript enabled to view it.

  • Reported net income of $0.26 per diluted share
  • Adjusted net income of $0.28 per diluted share
  • Cash flow from operating activities of $617 million and free cash flow of $469 million

HOUSTON--(BUSINESS WIRE)--Halliburton Company (NYSE: HAL) announced today net income of $236 million, or $0.26 per diluted share, for the third quarter of 2021. This compares to net income for the second quarter of 2021 of $227 million, or $0.26 per diluted share. Adjusted net income for the third quarter of 2021, excluding special items, was $248 million, or $0.28 per diluted share. Halliburton's total revenue for the third quarter of 2021 was $3.9 billion compared to revenue of $3.7 billion in the second quarter of 2021. Reported operating income was $446 million in the third quarter of 2021 compared to reported operating income of $434 million in the second quarter of 2021. Excluding special items, adjusted operating income was $458 million in the third quarter of 2021.


“Our third quarter performance demonstrates the effectiveness of both our strategy and our execution. Total company revenue increased 4% sequentially, and adjusted operating income grew 6% with solid margins in both divisions,” commented Jeff Miller, Chairman, President and CEO.

“Both operating divisions experienced revenue growth in the international and North America Land markets. Our Completion and Production division delivered solid mid-teens margins, and our Drilling and Evaluation division margins maintained their steady momentum.

“I am pleased with our strengthening free cash flow profile. In the third quarter, we generated $469 million of free cash flow, retired $500 million of debt, and maintained our cash balance at $2.6 billion.

“I see a multi-year upcycle unfolding. Structural global commodity tightness drives increased demand for our services, both internationally and in North America. I believe Halliburton is uniquely positioned in both markets to benefit from this improving environment.

“I believe our value proposition, technology differentiation, digital adoption, and capital efficiency will allow us to deliver profitable growth internationally and maximize value in North America. Halliburton will continue to execute our key strategic priorities to deliver industry-leading returns and strong free cash flow for our shareholders,” concluded Miller.

Operating Segments

Completion and Production

Completion and Production revenue in the third quarter of 2021 was $2.1 billion, an increase of $88 million, or 4%, when compared to the second quarter of 2021, while operating income was $322 million, an increase of $5 million, or 2%. These results were driven by increased activity across multiple product service lines in the Western Hemisphere, higher cementing activity in the Middle East/Asia region, as well as increased well intervention services in the Europe/Africa/CIS region. These improvements were partially offset by accelerated maintenance expenses for our stimulation business in North America, reduced completion tool sales in the Eastern Hemisphere, and lower stimulation activity in the Middle East/Asia region.

Drilling and Evaluation

Drilling and Evaluation revenue in the third quarter of 2021 was $1.7 billion, an increase of $65 million, or 4%, when compared to the second quarter of 2021, while operating income was $186 million, an increase of $11 million, or 6%. These results were due to improved drilling-related services internationally and in North America land, additional testing services and wireline activity across Latin America, along with increased project management activity in Mexico and Ecuador. Partially offsetting these increases were reduced drilling-related services in Norway and the Gulf of Mexico.

Geographic Regions

North America

North America revenue in the third quarter of 2021 was $1.6 billion, a 3% increase when compared to the second quarter of 2021. This increase was primarily driven by higher well construction services, artificial lift activity, and wireline activity in North America land, increased completion tool sales in the Gulf of Mexico, and additional stimulation and drilling activity in Canada. Partially offsetting these increases were reduced drilling-related, wireline, and stimulation activity in the Gulf of Mexico as a result of the impact from Hurricane Ida.

International

International revenue in the third quarter of 2021 was $2.2 billion, a 5% increase when compared to the second quarter of 2021. This improvement was primarily driven by higher activity across multiple product service lines in Latin America as well as higher well intervention services in the Europe/Africa/CIS region and well construction services across the Eastern Hemisphere. Partially offsetting these increases were lower completion tool sales in the Eastern Hemisphere, reduced activity in Norway, and decreased stimulation activity in the Middle East/Asia region.

Latin America revenue in the third quarter of 2021 was $624 million, a 17% increase sequentially. This improvement was driven by increased activity in multiple product service lines in Argentina, Mexico, and Brazil, as well as higher well construction services in Colombia and improved project management activity in Ecuador. These increases were partially offset by reduced fluid services in the Caribbean.

Europe/Africa/CIS revenue in the third quarter of 2021 was $676 million, essentially flat sequentially. Higher well intervention services across the region, increased well construction services and completion tool sales in Nigeria, additional pipeline and fluid services in Russia, and increased activity across multiple product service lines in Senegal, were offset by decreased activity across multiple product service lines in the North Sea and Algeria, and lower completion tool sales in Angola.

Middle East/Asia revenue in the third quarter of 2021 was $945 million, a 2% increase sequentially, resulting from improved well construction activity in the Middle East and Australia. These improvements were partially offset by lower completion tool sales across the region, along with reduced wireline and stimulation activity in Saudi Arabia, lower project management activity in India, and lower stimulation activity in Malaysia.

Other Financial Items

Halliburton closed the structured transaction for our North America real estate assets, which resulted in a $74 million gain. We also discontinued the proposed sale of our Pipeline and Process Services business leading to a depreciation catch-up related to these assets previously classified as held for sale. As a result, among these and other items, we recognized a pre-tax charge of $12 million.

During the third quarter of 2021, Halliburton retired $500 million of 2021 senior notes using cash on hand.

Selected Technology & Highlights

  • Halliburton announced a successful deployment of its SmartFleet™ intelligent fracturing system with a major operator in the Permian Basin. The SmartFleet system integrates intelligent automation and visualization with subsurface measurements across multiple wells to dynamically respond to reservoir behavior. By using the SmartFleet system, operators can achieve real-time control of fracture placement and improve overall completion execution.
  • Halliburton introduced ExpressFiber™, a fiber optic cable that offers accurate, direct subsurface measurements, including cross-well communication, at a price point that enables fracture monitoring on every well pad. ExpressFiber uses distributed acoustic sensing (DAS) to acquire a direct measurement of micro seismic, strain, and temperature unlike other cross-well monitoring techniques that provide indirect estimates. ExpressFiber, paired with our intelligent fracturing and subsurface monitoring services, provides real-time actionable insights of fracture growth and well interference, allowing operators to improve completions designs and gain overall capital efficiency.
  • Halliburton and VoltaGrid LLC announced a successful deployment of an advanced electric fracturing solution on a multi-year contract with Chesapeake Energy Corporation in the Marcellus shale. The solution combines Halliburton’s all-electric fracturing spread featuring the Zeus™ 5,000 horsepower (HHP) electric pumping unit with VoltaGrid’s advanced power generation system. This high-performing solution reduced emissions for Chesapeake by 32% and applied over 25 megawatts of lower-carbon power generation by leveraging Chesapeake’s local field gas network.
  • Halliburton Landmark released the latest version of Geosciences Suite, a DecisionSpace® 365 cloud solution powered by iEnergy®, an E&P hybrid cloud. The software combines innovative technology with a tightly integrated, end-to-end suite of workflows to create a complete and connected geoscience solution that enables a subsurface digital twin. This cloud solution can reduce exploration uncertainty by improving understanding of complex reservoirs to increase recovery.
  • Halliburton introduced IsoBond™, a cement system that reduces sustained casing pressure (SCP) at its source to deliver a barrier that minimizes fluid loss, shortens transition time, and improves shear bonding. The IsoBond cement system alleviates SCP on all fronts, unlike slurries that are only designed to mitigate against fluid loss. Halliburton has pumped over 15,000 barrels of IsoBond across multiple wells in North America and Latin America.
  • Halliburton announced an award of an integrated services contract to execute a drilling and completions campaign for Energean, an independent E&P company focused on developing resources in the Mediterranean and the North Sea. The work follows a successful offshore drilling campaign that Halliburton previously executed for Energean in the Karish and Karish North gas fields.
  • Halliburton released the iStar™ Intelligent Drilling and Logging Platform, a comprehensive measurement platform comprising multiple services for greater control of drilling and logging operations. The platform’s digital architecture supports automation, machine learning, and artificial intelligence for reservoir evaluation, faster drilling, and consistent well delivery.

About Halliburton

Founded in 1919, Halliburton is one of the world's largest providers of products and services to the energy industry. With more than 40,000 employees, representing 130 nationalities in more than 70 countries, the company helps its customers maximize value throughout the lifecycle of the reservoir – from locating hydrocarbons and managing geological data, to drilling and formation evaluation, well construction and completion, and optimizing production throughout the life of the asset. Visit the Company’s website at www.halliburton.com. Connect with Halliburton on Facebook, Twitter, LinkedIn, Instagram and YouTube.

Forward-looking Statements

The statements in this press release that are not historical statements, including statements regarding future financial performance, are forward-looking statements within the meaning of the federal securities laws. These statements are subject to numerous risks and uncertainties, many of which are beyond the company's control, which could cause actual results to differ materially from the results expressed or implied by the statements. These risks and uncertainties include, but are not limited to: the impact of COVID-19 and any variants, the related economic repercussions and resulting negative impact on demand for oil and gas, operational challenges relating to COVID-19 and efforts to mitigate the spread of the virus, including logistical challenges, protecting the health and well-being of our employees, remote work arrangements, performance of contracts and supply chain disruptions; the ability of the OPEC+ countries to agree on and comply with supply limitations; the continuation or suspension of our stock repurchase program, the amount, the timing, and the trading prices of Halliburton common stock, and the availability and alternative uses of cash; changes in the demand for or price of oil and/or natural gas; potential catastrophic events related to our operations, and related indemnification and insurance matters; protection of intellectual property rights and against cyber-attacks; compliance with environmental laws; changes in government regulations and regulatory requirements, particularly those related to oil and natural gas exploration, radioactive sources, explosives, chemicals, hydraulic fracturing services, and climate-related initiatives; compliance with laws related to income taxes and assumptions regarding the generation of future taxable income; risks of international operations, including risks relating to unsettled political conditions, war, the effects of terrorism, foreign exchange rates and controls, international trade and regulatory controls and sanctions, and doing business with national oil companies; weather-related issues, including the effects of hurricanes and tropical storms; changes in capital spending by customers, delays or failures by customers to make payments owed to us, and the resulting impact on our liquidity; execution of long-term, fixed-price contracts; structural changes and infrastructure issues in the oil and natural gas industry; maintaining a highly skilled workforce; availability and cost of raw materials; agreement with respect to and completion of potential dispositions, acquisitions and integration and success of acquired businesses and operations of joint ventures. Halliburton's Form 10-K for the year ended December 31, 2020, Form 10-Q for the quarter ended June 30, 2021, recent Current Reports on Form 8-K and other Securities and Exchange Commission filings discuss some of the important risk factors identified that may affect Halliburton's business, results of operations, and financial condition. Halliburton undertakes no obligation to revise or update publicly any forward-looking statements for any reason.

HALLIBURTON COMPANY

Condensed Consolidated Statements of Operations

(Millions of dollars and shares except per share data)

(Unaudited)


Three Months Ended


September 30


June 30


2021


2020


2021

Revenue:


Completion and Production

$

2,136


$

1,574


$

2,048


Drilling and Evaluation

1,724


1,401


1,659


Total revenue

$

3,860


$

2,975


$

3,707


Operating income:


Completion and Production

$

322


$

212


$

317


Drilling and Evaluation

186


105


175


Corporate and other

(50

)


(42

)


(58

)

Impairments and other charges (a)

(12

)


(133

)


Total operating income

446


142


434


Interest expense, net

(116

)


(122

)


(120

)

Other, net

(14

)


(21

)


(19

)

Income (loss) before income taxes

316


(1

)


295


Income tax provision (b)

(76

)


(18

)


(65

)

Net income (loss)

$

240


$

(19

)


$

230


Net (income) loss attributable to noncontrolling interest

(4

)


2


(3

)

Net income (loss) attributable to company

$

236


$

(17

)


$

227


Basic and diluted net income (loss) per share

$

0.26


$

(0.02

)


$

0.26


Basic and diluted weighted average common shares outstanding

894


882


890


(a)

See Footnote Table 1 for details of the impairments and other charges recorded during the respective periods.

(b)

The tax provision includes the tax effect on impairments and other charges recorded during the three months ended September 30, 2020.

See Footnote Table 1 for Reconciliation of As Reported Operating Income to Adjusted Operating Income.

See Footnote Table 3 for Reconciliation of As Reported Net Income (Loss) to Adjusted Net Income.

HALLIBURTON COMPANY

Condensed Consolidated Statements of Operations

(Millions of dollars and shares except per share data)

(Unaudited)


Nine Months Ended


September 30


2021


2020

Revenue:


Completion and Production

$

6,054


$

6,029


Drilling and Evaluation

4,964


5,179


Total revenue

$

11,018


$

11,208


Operating income (loss):


Completion and Production

$

891


$

713


Drilling and Evaluation

532


452


Corporate and other

(161

)


(152

)

Impairments and other charges (a)

(12

)


(3,353

)

Total operating income (loss)

1,250


(2,340

)

Interest expense, net

(361

)


(380

)

Loss on early extinguishment of debt (b)


(168

)

Other, net

(55

)


(92

)

Income (loss) before income taxes

834


(2,980

)

Income tax benefit (provision) (c)

(193

)


265


Net Income (loss)

$

641


$

(2,715

)

Net (Income) loss attributable to noncontrolling interest

(8

)


5


Net Income (loss) attributable to company

$

633


$

(2,710

)

Basic and diluted net income (loss) per share

$

0.71


$

(3.08

)

Basic and diluted weighted average common shares outstanding

891


879


(a)

See Footnote Table 2 for details of the impairments and other charges recorded during the respective periods.

(b)

During the nine months ended September 30, 2020, Halliburton recognized a $168 million loss on extinguishment of debt related to the early redemption of $1.5 billion aggregate principal amount of senior notes.

(c)

The tax benefit (provision) includes the tax effect on impairments and other charges recorded during the nine months ended September 30, 2020. Additionally, during the nine months ended September 30, 2020, based on market conditions and the expected impact on the Company's business, Halliburton recognized a $310 million tax expense associated with a valuation allowance on its deferred tax assets.

See Footnote Table 2 for Reconciliation of As Reported Operating Income (Loss) to Adjusted Operating Income.

See Footnote Table 4 for Reconciliation of As Reported Net Income (Loss) to Adjusted Net Income.

HALLIBURTON COMPANY

Condensed Consolidated Balance Sheets

(Millions of dollars)

(Unaudited)


September 30


December 31


2021


2020

Assets

Current assets:


Cash and equivalents

$

2,632


$

2,563


Receivables, net

3,525


3,071


Inventories

2,354


2,349


Other current assets

920


1,492


Total current assets

9,431


9,475


Property, plant, and equipment, net

4,235


4,325


Goodwill

2,841


2,804


Deferred income taxes

2,149


2,166


Operating lease right-of-use assets

984


786


Other assets

1,385


1,124


Total assets

$

21,025


$

20,680


Liabilities and Shareholders’ Equity

Current liabilities:


Accounts payable

$

2,011


$

1,573


Accrued employee compensation and benefits

583


517


Current portion of operating lease liabilities

258


251


Current maturities of long-term debt

11


695


Other current liabilities

1,083


1,385


Total current liabilities

3,946


4,421


Long-term debt

9,125


9,132


Operating lease liabilities

907


758


Employee compensation and benefits

547


562


Other liabilities

807


824


Total liabilities

15,332


15,697


Company shareholders’ equity

5,681


4,974


Noncontrolling interest in consolidated subsidiaries

12


9


Total shareholders’ equity

5,693


4,983


Total liabilities and shareholders’ equity

$

21,025


$

20,680


HALLIBURTON COMPANY

Condensed Consolidated Statements of Cash Flows

(Millions of dollars)

(Unaudited)


Nine Months Ended


Three Months
Ended


September 30


September 30


2021


2020


2021

Cash flows from operating activities:


Net Income (loss)

$

641


$

(2,715

)


$

240


Adjustments to reconcile net income (loss) to cash flows from operating activities:


Depreciation, depletion, and amortization

673


829


224


Working capital (a)

81


476


70


Impairments and other charges

12


3,353


12


Deferred income tax provision (benefit)

11


(380

)


11


Other operating activities

(189

)


(320

)


60


Total cash flows provided by operating activities

1,229


1,243


617


Cash flows from investing activities:


Capital expenditures

(483

)


(510

)


(188

)

Proceeds from sales of property, plant, and equipment

145


199


40


Proceeds from a structured real estate transaction

87


87


Other investing activities

(57

)


(33

)


(26

)

Total cash flows used in investing activities

(308

)


(344

)


(87

)

Cash flows from financing activities:


Payments on long-term borrowings

(696

)


(1,653

)


(504

)

Proceeds from issuance of long-term debt, net


994


Dividends to shareholders

(121

)


(238

)


(41

)

Stock repurchase program


(100

)


Other financing activities

7


25


3


Total cash flows used in financing activities

(810

)


(972

)


(542

)

Effect of exchange rate changes on cash

(42

)


(80

)


(14

)

Increase (decrease) in cash and equivalents

69


(153

)


(26

)

Cash and equivalents at beginning of period

2,563


2,268


2,658


Cash and equivalents at end of period

$

2,632


$

2,115


$

2,632


(a)

Working capital includes receivables, inventories, and accounts payable.

See Footnote Table 5 for Reconciliation of Cash Flows from Operating Activities to Free Cash Flow.

HALLIBURTON COMPANY

Revenue and Operating Income Comparison

By Operating Segment and Geographic Region

(Millions of dollars)

(Unaudited)


Three Months Ended


September 30


June 30

Revenue

2021


2020


2021

By operating segment:


Completion and Production

$

2,136


$

1,574


$

2,048


Drilling and Evaluation

1,724


1,401


1,659


Total revenue

$

3,860


$

2,975


$

3,707


By geographic region:


North America

$

1,615


$

984


$

1,569


Latin America

624


380


534


Europe/Africa/CIS

676


649


679


Middle East/Asia

945


962


925


Total revenue

$

3,860


$

2,975


$

3,707


Operating Income


By operating segment:


Completion and Production

$

322


$

212


$

317


Drilling and Evaluation

186


105


175


Total

508


317


492


Corporate and other

(50

)


(42

)


(58

)

Impairments and other charges

(12

)


(133

)


Total operating income

$

446


$

142


$

434


See Footnote Table 1 for Reconciliation of As Reported Operating Income to Adjusted Operating Income.

HALLIBURTON COMPANY

Revenue and Operating Income (Loss) Comparison

By Operating Segment and Geographic Region

(Millions of dollars)

(Unaudited)


Nine Months Ended


September 30

Revenue

2021


2020

By operating segment:


Completion and Production

$

6,054


$

6,029


Drilling and Evaluation

4,964


5,179


Total revenue

$

11,018


$

11,208


By geographic region:


North America

$

4,588


$

4,493


Latin America

1,693


1,242


Europe/Africa/CIS

1,989


2,171


Middle East/Asia

2,748


3,302


Total revenue

$

11,018


$

11,208


Operating Income (Loss)


By operating segment:


Completion and Production

$

891


$

713


Drilling and Evaluation

532


452


Total

1,423


1,165


Corporate and other

(161

)


(152

)

Impairments and other charges

(12

)


(3,353

)

Total operating income (loss)

$

1,250


$

(2,340

)

See Footnote Table 2 for Reconciliation of As Reported Operating Income (Loss) to Adjusted Operating Income.

FOOTNOTE TABLE 1


HALLIBURTON COMPANY

Reconciliation of As Reported Operating Income to Adjusted Operating Income

(Millions of dollars)

(Unaudited)


Three Months Ended


September 30


2021


2020

As reported operating income

$

446


$

142


Impairments and other charges:


Catch-up depreciation

36


Severance

15


83


Long-lived asset impairments


31


Inventory costs and write-downs


11


Gain on real estate transaction

(74

)


Other

35


8


Total impairments and other charges (a)

12


133


Adjusted operating income (b)

$

458


$

275


(a)

During the three months ended September 30, 2021, Halliburton closed the structured transaction for our North America real estate assets, which resulted in a $74 million gain. We also discontinued the proposed sale of our Pipeline and Process Services business leading to a depreciation catch-up related to these assets previously classified as held for sale. As a result, among these and other items, we recognized a $12 million pre-tax charge. During the three months ended September 30, 2020, Halliburton recognized a pre-tax charge of $133 million primarily related to severance costs.

(b)

Management believes that operating income adjusted for impairments and other charges for the three months ended September 30, 2021 and 2020, is useful to investors to assess and understand operating performance, especially when comparing those results with previous and subsequent periods or forecasting performance for future periods, primarily because management views the excluded items to be outside of the company's normal operating results. Management analyzes operating income without the impact of these items as an indicator of performance, to identify underlying trends in the business, and to establish operational goals. The adjustments remove the effect of these items. Adjusted operating income is calculated as: “As reported operating income” plus "Total impairments and other charges" for the respective periods.


Contacts

For Investors:
David Coleman
Halliburton, Investor Relations
This email address is being protected from spambots. You need JavaScript enabled to view it.
281-871-2688

For News Media:
Emily Mir
Halliburton, External Affairs
This email address is being protected from spambots. You need JavaScript enabled to view it.
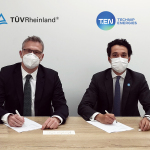
281-871-2601


Read full story here

KANSAS CITY, Mo.--(BUSINESS WIRE)--Kansas City Southern (KCS) (NYSE:KSU) reported revenues of $744.0 million, an increase of 13% from third quarter 2020. Overall, carload volumes were down 3% compared to prior year primarily due to the following commercial impacts:


  • Auto plant shutdowns driven by a global microchip shortage;
  • Service interruptions at Lázaro Cárdenas due to KCSM right-of-way blockages resulting from teachers' protests; and
  • Increased regulation of refined fuel product shipments into Mexico resulting in supply chain disruptions.

Third Quarter 2021

Third quarter revenues were $744.0 million, an increase of 13% primarily resulting from mix, higher fuel surcharge, and the strengthening of the Mexican peso against the U.S. dollar.

Third quarter operating expenses were $492.1 million, including $36.5 million in merger costs. Operating income was $251.9 million and the reported operating ratio was 66.1%. Third quarter net income was $156.5 million, or $1.71 per diluted share. Adjusted third quarter operating income, operating ratio, net income, and diluted earnings per share were as follows:

(in millions, except operating ratio and diluted earnings per share)


Three Months Ended September 30, 2021


Operating
Income


Operating
Ratio


Net Income


Diluted Earnings
per Share

GAAP Operating Results


$

251.9


66.1

%


$

156.5


$

1.71


Merger Costs


36.5


(4.9

)%


28.2


0.31


Other Adjustments, Net


0.3


Adjusted Operating Results (non-GAAP)


$

288.4


61.2

%


$

185.0


$

2.02


See following pages for reconciliations to GAAP


We are encouraged that despite several commercial headwinds, our network is performing extremely well and we are delivering near record velocity and dwell,” stated Patrick J. Ottensmeyer, KCS president and chief executive officer. "Underlying industrial demand is strong, and KCS has maintained resources to prioritize customer service as volumes return to the network. As certain supply chain disruptions are resolved and our revenue environment improves, our network will be well-positioned to handle incremental volume while continuing to provide premium service to our customers.

We are also very pleased to have announced our combination with Canadian Pacific, creating the first single-line rail network linking the U.S., Mexico and Canada. This historic combination will enhance competition, create new options for customers, and support economic growth in North America."

For more information on the transaction and the benefits it is expected to bring to the full range of stakeholders, visit FutureForFreight.com.

Statement Regarding Non-GAAP Financial Measures

In addition to disclosing financial results in accordance with U.S. GAAP, the accompanying third quarter 2021 earnings release contains non-GAAP financial measures. KCS management believes that certain non-GAAP financial measures used to review and in certain cases manage the Company's business fall within the meaning of Regulation G (Disclosure of non-GAAP financial measures) and may provide its users of the financial information with additional meaningful comparison when reviewing the Company's results. KCS management uses non-GAAP information in its planning and forecasting processes and to further analyze its own financial trends and operational performance, as well as making financial comparisons to prior periods presented on a similar basis. Management believes investors and users of the Company's financial information should consider all of the above factors when evaluating KCS's results.

These non-GAAP measures should be viewed as a supplement and not considered a substitute for GAAP measures. Some of KCS's non-GAAP measures may differ from similar measures used by other companies, even if similar terms are used to identify such measures.

GAAP Reconciliations

($ in millions, except per share amounts)


Reconciliation of Diluted Earnings per Share to

Adjusted Diluted Earnings per Share

Three Months Ended September 30, 2021


Income
Before
Income
Taxes


Income Tax
Expense


Net
Income


Diluted
Earnings
per Share

As reported

$

216.7


$

60.2


$

156.5


$

1.71


Adjustments for:


Merger costs

36.5


8.3


28.2


0.31


Foreign exchange loss

0.5


0.2


0.3


Adjusted

$

253.7


$

68.7


185.0


Less: Noncontrolling interest and preferred stock dividends


(0.4

)


Adjusted net income available to common stockholders - see (a) below


$

184.6


$

2.02


GAAP Reconciliations (continued)

($ in millions, except per share amounts)


Three Months Ended September 30, 2020


Income
Before
Income
Taxes


Income Tax
Expense


Net
Income


Diluted
Earnings
per Share

As reported

$

238.7


$

48.5


$

190.2


$

2.01


Adjustments for:


Restructuring charges

0.5


0.1


0.4


Foreign exchange gain

(7.7

)


(2.3

)


(5.4

)


(0.05

)


Foreign exchange component of income taxes


(0.3

)


0.3


Adjusted

$

231.5


$

46.0


185.5


Less: Noncontrolling interest and preferred stock dividends


(0.5

)


Adjusted net income available to common stockholders - see (a) below


$

185.0


$

1.96


Reconciliation of Operating Expenses to Adjusted

Three Months Ended


Nine Months Ended

Operating Expenses

September 30,


September 30,


2021


2020


2021


2020

Operating expenses as reported

$

492.1


$

388.1


$

2,126.3


$

1,198.5


Adjustment for merger costs

(36.5

)


(776.6

)


Adjustment for restructuring charges


(0.5

)


(17.0

)

Adjusted operating expenses - see (b) below

$

455.6


$

387.6


$

1,349.7


$

1,181.5


Operating income as reported

$

251.9


$

271.5


$

73.2


$

740.7


Adjusted operating income - see (b) below

288.4


272.0


849.8


757.7


Operating ratio (c) as reported

66.1

%


58.8

%


96.7

%


61.8

%

Adjusted operating ratio - see (b) and (c) below

61.2

%


58.8

%


61.4

%


60.9

%

(a)

The Company believes adjusted diluted earnings per share is meaningful as it allows investors to evaluate the Company’s performance for different periods on a more comparable basis by adjusting for the impact of changes in foreign currency exchange rates, and items that are not directly related to the ongoing operations of the Company. The income tax expense impacts related to these adjustments are calculated at the applicable statutory tax rate.

(b)

The Company believes adjusted operating expenses, operating income and operating ratio are meaningful as they allow investors to evaluate the Company's performance for different periods on a more comparable basis by adjusting for items that are not directly related to the ongoing operations of the Company.

(c)

Operating ratio is calculated by dividing operating expenses by revenues; or in the case of adjusted operating ratio, adjusted operating expenses divided by revenues.

Investor Conference Call and Webcast

KCS will also hold its third quarter 2021 earnings conference call on Tuesday, October 19, 2021 at 8:45 a.m. eastern time. Shareholders and other interested parties are invited to participate via live webcast or telephone. To participate in the live webcast and to view accompanying presentation materials, please log into investors.kcsouthern.com immediately prior to the presentation. To join the teleconference, please call (844) 308-6428 from the U.S., or (412) 317-5409 from all other countries.

A replay of the presentation will be available by calling (877) 344-7529 from the U.S., (855) 669-9658 from Canada or (412) 317-0088 from all other countries and entering conference ID 10152592. The webcast replay and presentation materials will be archived on the company’s website.

About Kansas City Southern

Headquartered in Kansas City, Mo., Kansas City Southern (KCS) (NYSE: KSU) is a transportation holding company that has railroad investments in the U.S., Mexico and Panama. Its primary U.S. holding is The Kansas City Southern Railway Company, serving the central and south central U.S. Its international holdings include Kansas City Southern de Mexico, S.A. de C.V., serving northeastern and central Mexico and the port cities of Lázaro Cárdenas, Tampico and Veracruz, and a 50 percent interest in Panama Canal Railway Company, providing ocean-to-ocean freight and passenger service along the Panama Canal. KCS' North American rail holdings and strategic alliances with other North American rail partners are primary components of a unique railway system, linking the commercial and industrial centers of the U.S., Mexico and Canada. More information about KCS can be found at www.kcsouthern.com

Forward-Looking Information

This news release contains forward-looking statements within the meaning of Section 27A of the Securities Act of 1933, as amended, Section 21E of the Securities Exchange Act of 1934, as amended and the Private Securities Litigation Reform Act of 1995. In addition, management may make forward-looking statements orally or in other writing, including, but not limited to, in press releases, quarterly earnings calls, executive presentations, in the annual report to stockholders and in other filings with the Securities and Exchange Commission. Readers can usually identify these forward-looking statements by the use of such words as "may," "will," "should," "likely," "plans," "projects," "expects," "anticipates," "believes" or similar words. These statements involve a number of risks and uncertainties. Actual results could materially differ from those anticipated by such forward-looking statements as a result of a number of factors or combination of factors including, but not limited to: the merger with Canadian Pacific Railway Limited ("CP") is subject to various closing conditions and there can be no assurances as to whether and when it may be completed; failure to complete the Company’s merger with CP could negatively impact the Company’s stock price and future business and financial results; Company’s stockholders cannot be sure of the value of the merger consideration they will receive from CP in the merger; lawsuits may be filed against the Company and/or CP challenging the transactions contemplated by the merger between, among others, the Company and CP; the shares of CP common stock to be received by the Company’s stockholders upon completion of the merger will have different rights from shares of the Company’s common stock; after completion of the merger, CP may fail to realize the projected benefits and cost savings of the merger; public health threats or outbreaks of communicable diseases, such as the ongoing COVID-19 pandemic (including its variants) and its impact on KCS’s business, suppliers, consumers, customers, employees and supply chains; rail accidents or other incidents or accidents on KCS’s rail network or at KCS’s facilities or customer facilities involving the release of hazardous materials, including toxic inhalation hazards; legislative and regulatory developments and disputes, including environmental regulations; loss of the rail concession of Kansas City Southern’s subsidiary, Kansas City Southern de México, S.A. de C.V.; North American and global economic, political and social conditions; disruptions to the Company’s technology infrastructure, including its computer systems; increased demand and traffic congestion; the level of trade between the United States and Asia or Mexico; fluctuations in the peso-dollar exchange rate; natural events such as severe weather, hurricanes and floods; the outcome of claims and litigation involving the Company or its subsidiaries; changes in business strategy and strategic opportunities; competition and consolidation within the transportation industry; the business environment in industries that produce and use items shipped by rail; the termination of, or failure to renew, agreements with customers, other railroads and third parties; the satisfaction of by third parties of their obligations; fluctuation in prices or availability of key materials, fluctuations in commodity demand; in particular diesel fuel; access to capital; sufficiency of budgeted capital expenditures in carrying out business plans; services infrastructure; climate change and the market and regulatory responses to climate change; dependency on certain key suppliers of core rail equipment; changes in securities and capital markets; unavailability of qualified personnel; labor difficulties, including strikes and work stoppages; acts of terrorism or risk of terrorist activities, war or other acts of violence; and other factors affecting the operation of the business; and other risks identified in this news release, in KCS's Annual Report on Form 10-K for the year ended December 31, 2020, and in other reports filed by KCS with the Securities and Exchange Commission.

Forward-looking statements reflect the information only as of the date on which they are made. KCS does not undertake any obligation to update any forward-looking statements to reflect future events, developments, or other information.


Kansas City Southern and Subsidiaries

Consolidated Statements of Operations

(In millions, except share and per share amounts)

(Unaudited)


Three Months Ended


Nine Months Ended


September 30,


September 30,


2021


2020


2021


2020

Revenues

$

744.0


$

659.6


$

2,199.5


$

1,939.2


Operating expenses:


Compensation and benefits

133.3


117.4


391.2


354.6


Purchased services

51.4


47.3


161.0


145.2


Fuel

78.0


50.8


227.9


165.2


Equipment costs

19.6


23.9


64.8


63.9


Depreciation and amortization

90.5


89.2


273.7


267.9


Materials and other

82.8


59.0


231.1


184.7


Merger costs

36.5


776.6


Restructuring charges


0.5


17.0


Total operating expenses

492.1


388.1


2,126.3


1,198.5


Operating income

251.9


271.5


73.2


740.7


Equity in net earnings (losses) of affiliates

3.8


(1.3

)


13.2


(0.1

)

Interest expense

(39.0

)


(39.5

)


(117.1

)


(111.8

)

Foreign exchange gain (loss)

(0.5

)


7.7


(1.0

)


(44.0

)

Other income, net

0.5


0.3


0.7


2.5


Income (loss) before income taxes

216.7


238.7


(31.0

)


587.3


Income tax expense

60.2


48.5


37.1


134.5


Net income (loss)

156.5


190.2


(68.1

)


452.8


Less: Net income attributable to noncontrolling interest

0.3


0.4


1.2


1.5


Net income (loss) attributable to Kansas City Southern and subsidiaries

156.2


189.8


(69.3

)


451.3


Preferred stock dividends

0.1


0.1


0.2


0.2


Net income (loss) available to common stockholders

$

156.1


$

189.7


$

(69.5

)


$

451.1


Earnings (loss) per share:


Basic earnings (loss) per share

$

1.72


$

2.02


$

(0.76

)


$

4.76


Diluted earnings (loss) per share

$

1.71


$

2.01


$

(0.76

)


$

4.74


Average shares outstanding (in thousands):


Basic

90,806


93,876


90,777


94,672


Effect of dilution

566


504


477


Diluted

91,372


94,380


90,777


95,149


Kansas City Southern and Subsidiaries

Revenue & Carload/Units by Commodity - Third Quarter 2021 and 2020


Revenues


Carloads and Units


Revenue per


(in millions)


(in thousands)


Carload/Unit


Third Quarter


%


Third Quarter


%


Third Quarter


%


2021


2020


Change


2021


2020


Change


2021


2020


Change


Chemical & Petroleum


Chemicals

$

71.0


$

60.1


18

%


27.0


24.3


11

%


$

2,630


$

2,473


6

%

Petroleum

93.7


95.1


(1

%)


41.8


48.5


(14

%)


2,242


1,961


14

%

Plastics

39.4


36.7


7

%


18.1


18.7


(3

%)


2,177


1,963


11

%

Total

204.1


191.9


6

%


86.9


91.5


(5

%)


2,349


2,097


12

%


Industrial & Consumer Products


Forest Products

71.6


59.6


20

%


26.7


25.3


6

%


2,682


2,356


14

%

Metals & Scrap

54.1


41.5


30

%


30.6


25.6


20

%


1,768


1,621


9

%

Other

33.3


25.3


32

%


21.7


22.8


(5

%)


1,535


1,110


38

%

Total

159.0


126.4


26

%


79.0


73.7


7

%


2,013


1,715


17

%


Agriculture & Minerals


Grain

87.0


74.6


17

%


40.4


37.8


7

%


2,153


1,974


9

%

Food Products

35.4


38.2


(7

%)


13.1


15.3


(14

%)


2,702


2,497


8

%

Ores & Minerals

7.5


5.5


36

%


9.7


7.7


26

%


773


714


8

%

Stone, Clay & Glass

9.9


7.0


41

%


3.9


3.2


22

%


2,538


2,188


16

%

Total

139.8


125.3


12

%


67.1


64.0


5

%


2,083


1,958


6

%


Energy


Utility Coal

45.8


28.9


58

%


45.6


32.9


39

%


1,004


878


14

%

Coal & Petroleum Coke

12.8


10.2


25

%


15.4


13.5


14

%


831


756


10

%

Frac Sand

4.0


2.3


74

%


3.0


2.0


50

%


1,333


1,150


16

%

Crude Oil

12.0


5.4


122

%


9.4


3.1


203

%


1,277


1,742


(27

%)

Total

74.6


46.8


59

%


73.4


51.5


43

%


1,016


909


12

%


Intermodal

86.9


89.1


(2

%)


231.6


264.7


(13

%)


375


337


11

%

Automotive

40.1


48.5


(17

%)


22.4


32.1


(30

%)


1,790


1,511


18

%

TOTAL FOR COMMODITY GROUPS

704.5


628.0


12

%


560.4


577.5


(3

%)


$

1,257


$

1,087


16

%

Other Revenue

39.5


31.6


25

%


TOTAL

$

744.0


$

659.6


13

%


Kansas City Southern and Subsidiaries

Revenue & Carload/Units by Commodity - Year to Date September 30, 2021 and 2020


Revenues


Carloads and Units


Revenue per


(in millions)


(in thousands)


Carload/Unit


Year to Date


%


Year to Date


%


Year to Date


%


2021


2020


Change


2021


2020


Change


2021


2020


Change


Chemical & Petroleum


Chemicals

$

196.4


$

174.8


12

%


76.4


70.1


9

%


$

2,571


$

2,494


3

%

Petroleum

361.8


261.5


38

%


161.9


131.7


23

%


2,235


1,986


13

%

Plastics

109.7


112.7


(3

%)


53.6


56.2


(5

%)


2,047


2,005


2

%

Total

667.9


549.0


22

%


291.9


258.0


13

%


2,288


2,128


8

%


Industrial & Consumer Products


Forest Products

191.9


186.3


3

%


75.0


76.9


(2

%)


2,559


2,423


6

%

Metals & Scrap

151.4


144.2


5

%


85.2


80.4


6

%


1,777


1,794


(1

%)

Other

94.3


75.5


25

%


65.5


67.8


(3

%)


1,440


1,114


29

%

Total

437.6


406.0


8

%


225.7


225.1


1,939


1,804


7

%


Agriculture & Minerals


Grain

250.6


216.5


16

%


116.8


106.2


10

%


2,146


2,039


5

%

Food Products

109.0


119.9


(9

%)


41.6


47.0


(11

%)


2,620


2,551


3

%

Ores & Minerals

18.8


16.6


13

%


24.7


22.4


10

%


761


741


3

%

Stone, Clay & Glass

25.7


21.2


21

%


10.6


9.2


15

%


2,425


2,304


5

%

Total

404.1


374.2


8

%


193.7


184.8


5

%


2,086


2,025


3

%


Energy


Utility Coal

108.7


75.7


44

%


122.2


87.7


39

%


890


863


3

%

Coal & Petroleum Coke

35.2


31.3


12

%


42.5


43.0


(1

%)


828


728


14

%

Frac Sand

11.6


7.8


49

%


9.0


6.6


36

%


1,289


1,182


9

%

Crude Oil

31.1


27.6


13

%


24.4


15.9


53

%


1,275


1,736


(27

%)

Total

186.6


142.4


31

%


198.1


153.2


29

%


942


930


1

%


Intermodal

259.3


241.3


7

%


714.7


689.3


4

%


363


350


4

%

Automotive

133.6


118.0


13

%


76.5


75.9


1

%


1,746


1,555


12

%

TOTAL FOR COMMODITY GROUPS

2,089.1


1,830.9


14

%


1,700.6


1,586.3


7

%


$

1,228


$

1,154


6

%

Other Revenue

110.4


108.3


2

%


TOTAL

$

2,199.5


$

1,939.2


13

%


Contacts

KCS: Ashley Thorne, 816-983-1530, This email address is being protected from spambots. You need JavaScript enabled to view it.

Space-based data addresses port congestion, saves fuel for maritime vessels and streamlines today’s strained global supply chains

VIENNA, Va.--(BUSINESS WIRE)--Today, Spire Global, Inc. (NYSE: SPIR) (“Spire” or the “Company”), a leading global provider of space-based data, analytics, and space services, announced the availability of Maritime 2.0, an update to Spire’s maritime solutions that provides marine data on vessel locations, weather conditions, and global shipping activity so that organizations can optimize real-time decision making.


Supported by GraphQL, the Maritime 2.0 API services update will improve the quality of the vessel tracking Automatic Identification System (AIS) data coverage Spire provides and support new data delivery. Spire Maritime 2.0 is the first satellite AIS maritime data solution to offer GraphQL, an open-source query language.

Spire’s latest Maritime 2.0 offers:

  • Smarter, cleaner AIS data - New algorithms offer high quality, accurate vessel identification with logic to clean up duplicate data sets and create improved routing models.
  • Enhanced Global Coverage - Users will see a 20% increase in daily messages from global terrestrial data.
  • Improved, Scalable Delivery - For the first time, customers will be able to use GraphQL, deployed at other leading enterprise technology platforms including Atlassian, GitHub, New Relic, Intuit, and Shopify, to query Spire data, integrate easily with outside platforms and simplify how developers can access and iterate on data.

“Our customers have asked for more coverage, precision at scale and even cleaner data delivery,” said John Lusk, SVP of Spire Global. “We are committed to providing continuous innovation across our maritime solutions. Maritime 2.0 delivers on this promise with the data and analytics needed to address port congestion, save fuel for maritime vessels and streamline today’s strained global supply chains.”

"It has been excellent to have had access to the Beta release of the Maritime 2.0 GraphQL API. As data volumes increase, customer requirements expand and diversify, and technology evolves, it is integral for data providers to continuously improve how they deliver their data. It is innovations such as the Maritime 2.0 GraphQL API that embody why Spire is a leader in AIS data and delivery,” said Ryan Lloyd, Head of Research and Development, Geollect, a geospatial company using Spire’s AIS data to map vessel locations and make global insights.

Spire’s Maritime 2.0 solution is currently available. For more information, visit https://spire.com/maritime/.

About Spire Global, Inc.

Spire is a leading global provider of space-based data, analytics, and space services, offering access to unique datasets and powerful insights about Earth from the ultimate vantage point so that organizations can make decisions with confidence, accuracy, and speed. Spire uses one of the world’s largest multi-purpose satellite constellations to source hard to acquire, valuable data and enriches it with predictive solutions. Spire then provides this data as a subscription to organizations around the world so they can improve business operations, decrease their environmental footprint, deploy resources for growth and competitive advantage, and mitigate risk. Spire gives commercial and government organization’s the competitive advantage they seek to innovate and solve some of the world’s toughest problems with insights from space. Spire has offices in San Francisco, Boulder, Washington DC, Glasgow, Luxembourg, and Singapore. To learn more, visit spire.com.


Contacts

For Spire Global, Inc.:
Janine Kromhout
This email address is being protected from spambots. You need JavaScript enabled to view it.

OKLAHOMA CITY--(BUSINESS WIRE)--Gulfport Energy Corporation (NYSE: GPOR) announced today that it will host a teleconference and webcast to discuss its third quarter 2021 results beginning at 9:00 a.m. ET (8:00 a.m. CT) on Wednesday, November 3, 2021. Gulfport plans to issue a news release containing its third quarter 2021 financial and operational results on Tuesday, November 2, 2021, after market close.


The conference call can be heard live through a link on the Gulfport website, www.gulfportenergy.com. In addition, you may participate in the conference call by dialing 866-373-3408 domestically or 412-902-1039 internationally. A replay of the conference call will be available on the Gulfport website and a telephone audio replay will be available from November 3, 2021 to November 17, 2021, by calling 877-660-6853 domestically or 201-612-7415 internationally and then entering the replay passcode 13724300.

About Gulfport

Gulfport is an independent natural gas-weighted exploration and production company focused on the exploration, acquisition and production of natural gas, crude oil and NGL in the United States with primary focus in the Appalachia and Anadarko basins. Our principal properties are located in Eastern Ohio targeting the Utica formation and in central Oklahoma targeting the SCOOP Woodford and SCOOP Springer formations.


Contacts

Investor Contact
Jessica Antle – Director, Investor Relations
This email address is being protected from spambots. You need JavaScript enabled to view it.
405-252-4550

Thomas Renouard – Senior Analyst, Investor Relations
This email address is being protected from spambots. You need JavaScript enabled to view it.
405-252-4550

Media Contact
Reevemark
Hugh Burns / Paul Caminiti / Nicholas Leasure
212-433-4600

Groundbreaking for New Jersey Wind Port project took place in September

DALLAS--(BUSINESS WIRE)--AECOM (NYSE: ACM), the world’s trusted infrastructure consulting firm, announced today that its AECOM Tishman business has been selected to manage construction of the New Jersey Wind Port, the nation’s first purpose-built offshore wind marshaling and manufacturing port, located in Lower Alloways Creek Township, NJ, on the eastern shore of the Delaware River.

A flagship economic development investment for the State of New Jersey through the New Jersey Economic Development Authority (NJEDA), the 200-acre infrastructure project will serve the unique staging, manufacturing and assembly needs of future offshore wind projects on the East Coast of the United States. Over the next 15 years, the East Coast is expected to see over $150 billion of investment in offshore wind, creating 83,000 jobs.

We are excited to partner with the New Jersey Economic Development Authority to develop the first greenfield offshore wind port in the United States as we help our clients advance their expanding sustainability initiatives to create positive impact for communities and deliver a better world,” said Troy Rudd, AECOM’s chief executive officer. “At AECOM, we integrate ESG principles into everything we do through our Sustainable Legacies strategy, and this forward thinking, purpose-built offshore wind port project is another example of how we are bringing that strategy to life in partnership with our clients.”

AECOM Tishman is proud to play this role in building a sustainable future for both the State of New Jersey and the United States as a whole,” said Jay Badame, president of AECOM Tishman. “The Wind Port project will leave a legacy for future generations, fostering growth in the renewable energy sector and is anticipated to serve as a catalyst for the creation of tens of thousands of jobs and more than $100-billion in investment. We are grateful to the State of New Jersey for entrusting us to deliver on this bold vision.”

Establishing New Jersey as a global capital of offshore wind is a top priority for Governor Phil Murphy. It will move us closer to achieving his clean energy goals and drive billions of dollars in economic growth. The New Jersey Wind Port is a transformational investment that will support this fast-growing industry and create thousands of good jobs throughout New Jersey,” said NJEDA Chief Executive Officer Tim Sullivan. “The NJEDA is proud to work with AECOM Tishman to execute on this critical infrastructure project in a way that aligns with the State’s commitments to using union labor and setting a new standard for diversity and inclusion at all stages of construction and operation at the Wind Port.”

AECOM Tishman was selected by the State of New Jersey to serve as construction manager on the project in July. The project will support hundreds of construction jobs and includes worker diversity goals of 18 percent people of color and 6.9 percent women. AECOM Tishman is also committed to ensuring at least 25 percent of subcontractors are small businesses and at least 15 percent are women-, minority-, or veteran - owned.

This project provides a vital opportunity for economic development in Salem County, New Jersey. It is important that the people and businesses of this community participate in bringing the Wind Port project to fruition, and that we work to make sure we expand the talent pool for hiring and contracting,” said Flora Ramos, AECOM Tishman Director of Community Relations. “We are fully committed to meeting or exceeding the aggressive MWBE and workforce diversity goals that the State of New Jersey set for this project.”

AECOM is committed to delivering its transformative environmental, social, and governance objectives through its Sustainable Legacies strategy, ensuring the work it does in partnership with clients leaves a positive impact for years to come.

About AECOM
AECOM (NYSE: ACM) is the world’s trusted infrastructure consulting firm, delivering professional services throughout the project lifecycle – from planning, design and engineering to program and construction management. On projects spanning transportation, buildings, water, new energy and the environment, our public- and private-sector clients trust us to solve their most complex challenges. Our teams are driven by a common purpose to deliver a better world through our unrivaled technical expertise and innovation, a culture of equity, diversity and inclusion, and a commitment to environmental, social and governance priorities. AECOM is a Fortune 500 firm and its Professional Services business had revenue of $13.2 billion in fiscal year 2020. See how we are delivering sustainable legacies for generations to come at aecom.com and @AECOM.

About AECOM Tishman
AECOM Tishman is one of the world's leading builders, spanning over 100 years and responsible for managing construction of more than 600 million square feet, including iconic projects such as the World Trade Center, Manhattan West, One Vanderbilt, and Hudson Yards. AECOM Tishman is part of AECOM, the world’s trusted infrastructure consulting firm, delivering professional services throughout the project lifecycle – from planning, design and engineering to program and construction management. On projects spanning transportation, buildings, water, new energy and the environment, our public- and private-sector clients trust us to solve their most complex challenges. Our teams are driven by a common purpose to deliver a better world through our unrivaled technical expertise and innovation, a culture of equity, diversity and inclusion, and a commitment to environmental, social and governance priorities. AECOM is a Fortune 500 firm and its Professional Services business had revenue of $13.2 billion in fiscal year 2020. See how we are delivering sustainable legacies for generations to come at aecom.com and @AECOM.

Forward-Looking Statements
All statements in this communication other than statements of historical fact are “forward-looking statements” for purposes of federal and state securities laws, including any statements of the plans, strategies and objectives for future operations, profitability, strategic value creation, coronavirus impacts, risk profile and investment strategies, and any statements regarding future economic conditions or performance, and the expected financial and operational results of AECOM. Although we believe that the expectations reflected in our forward-looking statements are reasonable, actual results could differ materially from those projected or assumed in any of our forward-looking statements. Important factors that could cause our actual results, performance and achievements, or industry results to differ materially from estimates or projections contained in our forward-looking statements include, but are not limited to, the following: our business is cyclical and vulnerable to economic downturns and client spending reductions; impacts caused by the coronavirus and the related economic instability and market volatility, including the reaction of governments to the coronavirus, including any prolonged period of travel, commercial or other similar restrictions, the delay in commencement, or temporary or permanent halting of construction, infrastructure or other projects, requirements that we remove our employees or personnel from the field for their protection, and delays or reductions in planned initiatives by our governmental or commercial clients or potential clients; losses under fixed-price contracts; limited control over operations run through our joint venture entities; liability for misconduct by our employees or consultants; failure to comply with laws or regulations applicable to our business; maintaining adequate surety and financial capacity; high leverage and potential inability to service our debt and guarantees; exposure to Brexit; exposure to political and economic risks in different countries; currency exchange rate fluctuations; retaining and recruiting key technical and management personnel; legal claims; inadequate insurance coverage; environmental law compliance and adequate nuclear indemnification; unexpected adjustments and cancellations related to our backlog; partners and third parties who may fail to satisfy their legal obligations; AECOM Capital real estate development projects; managing pension cost; cybersecurity issues, IT outages and data privacy; risks associated with the benefits and costs of the Power transaction and other recent acquisitions and divestitures, including the risk that the expected benefits of such transactions or any contingent purchase price will not be realized within the expected time frame, in full or at all; the risk that costs of restructuring transactions and other costs incurred in connection with recent acquisitions and divestitures will exceed our estimates or otherwise adversely affect our business or operations; as well as other additional risks and factors that could cause actual results to differ materially from our forward-looking statements set forth in our reports filed with the Securities and Exchange Commission. Any forward-looking statements are made as of the date hereof. We do not intend, and undertake no obligation, to update any forward-looking statement.


Contacts

Media:
Brendan Ranson-Walsh
Vice President, Global Communications &
Corporate Responsibility
1.213.996.2367
This email address is being protected from spambots. You need JavaScript enabled to view it.

Investor:
Will Gabrielski
Senior Vice President, Finance, Treasurer
1.213.593.8208
This email address is being protected from spambots. You need JavaScript enabled to view it.

SAN DIEGO--(BUSINESS WIRE)--$DFCO #BrianBonar--Dalrada Corporation (OTCQB: DFCO, “Dalrada”) is excited to share that the Company is recognized as one of the Best San Diego-Based Clean Energy Companies. An innovation company, Dalrada and its subsidiaries provide value by making available timely and impactful products & services within clean energy & industrial engineering, health & wellness, and information technology sectors.


Brian Bonar, Chairman, and CEO of Dalrada, states, “Innovating effective solutions to complex problems is Dalrada’s mission. The Company would like to express our sincere appreciation for recognition as one of San Diego’s Top 10 Energy Companies and as a business leader in Corporate Social Responsibility and Inclusion.”

After reviewing data sourced from Crunchbase and SemRush, Futurology selected a spectrum of companies from utilities (Sempra) to independent power generation & waste energy recycling (Dalrada). All are recognized for taking a variety of approaches to innovating the Clean Energy industry.

Dalrada’s subsidiary, Likido®, was chosen based on Innovation (ideas, route to market, products), Growth (exceptional strategy and progress), and Management (societal impact). Also selected by the San Diego Business Journal as a leader in Corporate Social Responsibility and Inclusion, Dalrada is recognized for its business practices, including brand activism, employer and volunteer programs, green and environmental stewardship, and organizational transparency.

Bonar continues, “How to reduce greenhouse gas emissions to a level of neutrality by the year 2050 is on everyone’s minds. In support of vital environmental sustainability initiatives, Likido® Energy solutions enable the transition to renewable and sustainable energy sources for heating and cooling uses. Likido® significantly reduces greenhouse gas emissions and GWP with significant cost savings on traditional energy sources and is engineered to scale with industrial, commercial, business, and consumer applications.”

Energy solutions from Dalrada include Likido®ONE that recycles waste energy for heating and cooling, Likido®CRYO for extraction, chilling, storage, and distribution of biomaterials and vaccines, and Likido®VOLT independent clean power generators for on-grid and off-grid use. In development are Likido®HOME water heaters.

Bonar concludes, “Unprecedented times call for unprecedented solutions. Dalrada is committed to providing energy efficient technologies to support the transformation to a clean energy society. Dalrada thanks its shareholders, investors, clients, industry alliances, and operations teams for their continued support and recognition of this collective effort.”

Continuously building on its core practices of engineering, life sciences, and technology, Dalrada operates under the tenet of bringing innovative products and services to a complex new world. As consumers, businesses, and governments seek alternative solutions, Dalrada’s subsidiaries respond with affordable, available, accessible, and impactful innovations.

For more information on Dalrada and its subsidiaries, visit www.dalrada.com.

About Dalrada (DFCO)

With perseverance, valor, dedication, and vision, Dalrada Corporation is dedicated to tackling worldwide challenges of today and tomorrow.

Dalrada is a global company that operates under the tenet of creating impactful innovations that matter for the world. The Company works continually to produce disruptive solutions that bridge the gap of accessibility and accelerate positive change for current and future generations.

Established in 1982, the Company has since grown its footprint to include the business divisions: Dalrada Health, Dalrada Precision, and Dalrada Technologies. Each of Dalrada’s subsidiaries actively produces affordable and accessible world-class solutions to global problems. For more information, please visit www.dalrada.com

Disclaimer

Statements in this press release that are not historical facts are forward-looking statements, including statements regarding future revenues and sales projections, plans for future financing, the ability to meet operational milestones, marketing arrangements and plans, and shipments to and regulatory approvals in international markets. Such statements reflect management's current views, are based on certain assumptions, and involve risks and uncertainties. Actual results, events, or performance may differ materially from the above forward-looking statements due to a number of important factors and will be dependent upon a variety of factors including, but not limited to, our ability to obtain additional financing that will allow us to continue our current and future operations and whether demand for our products and services in domestic and international markets will continue to expand. The Company undertakes no obligation to publicly update these forward-looking statements to reflect events or circumstances that occur after the date hereof or to reflect any change in the Company's expectations with regard to these forward-looking statements or the occurrence of unanticipated events. Factors that may impact the Company's success are more fully disclosed in the Company's most recent public filings with the U.S. Securities and Exchange Commission ("SEC"), including its annual report on Form 10-K.


Contacts

Denise Mahaffey
858.283.1253
This email address is being protected from spambots. You need JavaScript enabled to view it.
HOUSTON--(BUSINESS WIRE)--Westlake Chemical Partners (NYSE: WLKP) will release its third quarter earnings for 2021 prior to the market opening on Tuesday, November 2, 2021. The company will host a conference call at 12:00 p.m. Eastern Time (11:00 p.m. Central Time) on the same day to discuss the earnings release.


To access the conference call, dial (855) 765-5686, or (234) 386-2848 for international callers, approximately 10 minutes prior to the scheduled start time and reference passcode 8285407.

The conference call will also be available via webcast at https://edge.media-server.com/mmc/p/9ssoi6jp and the earnings release can be obtained via the company's Web page at, https://investors.wlkpartners.com/corporate-profile/default.aspx.

A replay of the conference call will be available beginning two hours after its conclusion for seven days. To hear a replay, dial (855) 859-2056 or (404) 537-3406 for international callers. The replay passcode is 8285407.

About Westlake Chemical Partners:

Westlake Chemical Partners is a limited partnership formed by Westlake Chemical Corporation to operate, acquire and develop ethylene production facilities and other qualified assets. Headquartered in Houston, the Partnership owns an 22.8% interest in Westlake Chemical OpCo LP. Westlake Chemical OpCo LP's assets consist of three ethylene production facilities in Calvert City, Kentucky, and Lake Charles, Louisiana and an ethylene pipeline. For more information about Westlake Chemical Partners LP, please visit http://www.wlkpartners.com.


Contacts

Media Relations – L. Ben Ederington – 713.585.2900

Investor Relations – Steve Bender – 713.585.2900

MILPITAS, Calif.--(BUSINESS WIRE)--SolarEdge Technologies, Inc. (Nasdaq: SEDG), a global leader in smart energy technology, will report financial results for the third quarter 2021 after market close on Tuesday, November 2, 2021. Management will host a conference call at 4:30 P.M. ET on Tuesday, November 2, 2021 to discuss these results.

The call will be available, live, to interested parties by dialing:

United States/Canada Toll Free:

800-635-7637

International Toll:

+1 334-777-6980

Conference ID:

5961090

A live webcast will be available in the Investor Relations section of SolarEdge’s website at: Event Calendar | SolarEdge Technologies, Inc.

A replay of the webcast will be available in the Investor Relations section of the company’s web site approximately two hours after the conclusion of the call and remain available for approximately 30 calendar days.

About SolarEdge

SolarEdge is a global leader in smart energy technology. By leveraging world-class engineering capabilities and with a relentless focus on innovation, SolarEdge creates smart energy solutions that power our lives and drive future progress. SolarEdge developed an intelligent inverter solution that changed the way power is harvested and managed in photovoltaic (PV) systems. The SolarEdge DC optimized inverter seeks to maximize power generation while lowering the cost of energy produced by the PV system. Continuing to advance smart energy, SolarEdge addresses a broad range of energy market segments through its PV, storage, EV charging, batteries, UPS, electric vehicle powertrains, and grid services solutions. SolarEdge is online at www.solaredge.com.


Contacts

Investor Contacts
SolarEdge Technologies, Inc.
Lior Danziger, Director of Investor Relations and Finance Operations
+1 510-498-3263
This email address is being protected from spambots. You need JavaScript enabled to view it.
Sapphire Investor Relations, LLC
Erica Mannion or Michael Funari
+1 617-542-6180
This email address is being protected from spambots. You need JavaScript enabled to view it.
Offshore Source Logo

Offshore Source keeps you updated with relevant information concerning the Offshore Energy Sector.

Any views or opinions represented on this website belong solely to the author and do not represent those of the people, institutions or organizations that Offshore Source or collaborators may or may not have been associated with in a professional or personal capacity, unless explicitly stated.

Corporate Offices

Technology Systems Corporation
8502 SW Kansas Ave
Stuart, FL 34997

info@tscpublishing.com