Business Wire News

Howard Wenger to Continue with Solaria as Board Director and Strategic Advisor

FREMONT, Calif.--(BUSINESS WIRE)--$SPWRA #Aesthetic--Solaria Corporation, a global provider of premium solar energy products, today announced the appointment of solar industry veteran Vikas Desai as the company’s new president. Solaria’s current president Howard Wenger will continue with the company as a board member and strategic advisor.


An accomplished solar industry executive, Mr. Desai served as senior vice president and general manager of SunPower Corporation’s (NASDAQ: SPWRA) residential and light commercial business unit, which he founded and scaled up to $1 billion in annualized revenues. Vikas Desai also held CEO roles at EchoFirst (acquired by SunEdison) and Powerside, a power analytics provider, and served as senior vice president and general manager at the distributed solar divisions of both SunEdison and Flextronics.

“Vikas has a passion for building teams and go-to-market channels; we are very pleased that he is joining the outstanding professionals on Solaria’s leadership team,” said Solaria CEO Tony Alvarez. “Vikas has built multiple businesses in both the solar and related technology realms. He brings deep experience and expertise in residential solar, having scaled multiple distributed solar businesses globally.”

“I’m thrilled to be part of a team that is dedicated to developing and delivering unparalleled products with excellent customer service, powered by our network of Pro Partners,” noted Mr. Desai. “Solaria offers unrivaled advanced technology. I look forward to working with Solaria’s talented team to help accelerate the company’s growth and scale its success as it expands its offerings and global reach.”

“We are looking forward to this next chapter in Solaria’s evolution,” added Tony Alvarez. “I want to thank Howard Wenger for serving as president during a very challenging time – and for helping us develop a vision of what the company can become. We are delighted that Howard will be continuing with us as board member and strategic advisor to help Solaria become a leading solar brand.”

About Solaria

Solaria Corporation is a US-based solar PV technology and systems company, with a 20-year history in solar power innovation and product development. Solaria is paving the way for distributed, clean power generation by delivering state-of-the-art engineering and automation to provide superior field performance and unrivaled aesthetics. Solaria is headquartered in California, USA. For more information, please visit www.solaria.com.


Contacts

Susan DeVico This email address is being protected from spambots. You need JavaScript enabled to view it. +1 415 235-8758

Marqeta’s modern card issuing platform and Branch’s digital wallet enable Uber Freight to pay carriers after each load, bringing innovation and transparency to the trucking industry

LAS VEGAS--(BUSINESS WIRE)--On stage at Money 20/20, Marqeta (NASDAQ: MQ), the global modern card issuing platform, today announced it is partnering with Branch, a leading workforce payments platform, and Uber Freight to bring fast, reliable payments and carrier-first financial services to the logistics and transportation industries.


Uber Freight’s driver-first carrier tools empower trucking companies and their drivers to book loads and manage their businesses seamlessly. To expand their offerings and extend that speed, control, and transparency to the carrier payment experience, Uber Freight has partnered with Marqeta and Branch. Through Marqeta’s modern card issuing platform and Branch’s digital wallet, Uber Freight can pay carriers significantly faster than the industry standard, at no additional cost. Rather than waiting 30 days or longer for the traditional accounts payable process, carriers on Uber Freight can get paid two hours after approved proof of delivery, a 99.7% reduction in wait time.

“We’re seeing growing demand for faster payments that better reflect the real-time nature of today’s workers,” said Renata Caine, SVP of International, Strategy and Planning, Marqeta. “Uber Freight is a leader in the transportation industry and their deep knowledge of logistics makes them a fantastic partner to bring our modern card issuing and Branch’s accelerated payments to a new market.”

According to the American Trucking Association, the U.S. trucking industry is responsible for transporting 70% of all goods in the country and the industry’s total revenue reached $879 billion in 2020. But with relatively few technological advances in the industry, driver experiences have largely remained unchanged for decades. E-commerce purchases jumped 33% to $792 billion during the COVID-19 pandemic, making up 14% of all retail sales and putting more pressure on shipping companies to satisfy customers and improve the experience for carriers in an increasingly competitive industry. Developed with the growing number of small carriers in mind, this new solution can provide carriers with greater cash flow and helps them afford the large upfront investments and expenses required to keep their businesses running and growing.

“We started Uber Freight with a commitment to empowering carriers of all sizes to get the most out of their workday. We were first to market with transparent pricing and have grown to support the world’s largest network of digital carriers,” said Lior Ron, Head of Uber Freight. “This partnership allows us to continue building our suite of carrier-first tools and offer the small carriers on our platform — the mom and pop shops and new authority carriers just starting their businesses — the opportunity to take advantage of lightning-fast payments, fuel discounts, and other benefits typically reserved for larger carriers. We’re proud to give underserved carriers this competitive edge and help them grow their businesses.”

In addition to faster payments, Branch’s digital wallet features a suite of financial services to help carriers grow their businesses including a fee-free, FDIC-insured checking account and a commercial card specifically designed to enable the fastest carrier settlements in the trucking industry. The Uber Freight Card powered by Branch provides Uber Freight carriers a free-to-use card to easily spend funds from the Branch Wallet, and fuel rewards to support drivers on their biggest expense.

“Uber Freight is not only offering carriers greater customization and visibility in the load booking process, but also setting a new standard in the payments experience for the trucking and logistics industry,” said Branch CEO Atif Siddiqi. “With more independent owner-operators than ever, we’re thrilled to partner with Uber Freight and Marqeta to empower a new generation of entrepreneurs with faster payments, increased cash flow, and financial services tailored to carriers’ and drivers’ unique needs.”

About Marqeta (NASDAQ: MQ)

Marqeta’s modern card issuing platform empowers its customers to create customized and innovative payment cards. Marqeta’s modern architecture gives its customers the ability to build more configurable and flexible payment experiences, accelerating time-to-market and democratizing access to card issuing technology. Marqeta's open APIs provide instant access to highly scalable, cloud-based payment infrastructure that enables customers to launch and manage their own card programs, issue cards and authorize and settle payment transactions. Marqeta is headquartered in Oakland, California and is certified to operate in 36 countries globally.

For more information on Marqeta please visit: www.marqeta.com.

About Branch

Branch is the leading workforce payments platform that partners with businesses to accelerate payments and empower working Americans. Companies can make contractor payments instantly and automate reporting through Branch’s digital wallet and optional card, creating a more streamlined, uniform payments experience. Independent contractors that sign up with Branch can receive a zero-fee bank account, faster payments for completed jobs, and personal finance tools to help them manage their cash flow. Branch allows companies to reduce payroll costs, recruit and retain talent, support independent contractors with free financial services, and remove logistical burdens and cash flow concerns. To learn more about Branch, visit https://www.branchapp.com and follow us on Twitter, Facebook, and LinkedIn.

About Uber Freight

Uber Freight is a logistics platform built on the power of Uber with the goal to reshape global logistics and deliver reliability, flexibility and transparency for shippers and carriers. Since launching in 2017, Uber Freight has built one of the world’s largest digitally-enabled carrier networks and transformed entrenched practices around pricing and booking freight to reduce inefficiencies and increase opportunities for business growth and industry collaboration. Today, the business counts over 70,000 carriers in its network and thousands of shippers as customers, from small businesses to Fortune 500 companies, including AB Inbev, Nestle, LG, Land O’Lakes and many more.


Contacts

Media:
James Robinson
530-913-0844
This email address is being protected from spambots. You need JavaScript enabled to view it.

Adrianne Ho
612-601-1122
This email address is being protected from spambots. You need JavaScript enabled to view it.

ANN ARBOR, Mich.--(BUSINESS WIRE)--The Coretec Group, Inc., (OTCQB: CRTG), developers of engineered silicon and 3D volumetric displays, is pleased to announce the promotions of Dr. Michelle Tokarz to Vice President of Partnerships & Innovation and Dr. Ramez Elgammal to Chief Technology Officer.


As The Coretec Group moves forward in the development of multiple technologies across a range of sectors including batteries, quantum dots, and semiconductors, the need for further development and expertise has never been so apparent. As the company continues to expand its IP and in turn its range of applications, the company is also growing and promoting its team.

Dr. Michelle Tokarz is the perfect blend of scientist and businessperson. Dr. Tokarz developed her science and business acumen in the pharmaceutical industry holding research chemistry and subsequent production roles for Merck and Eli Lilly. Participating with and assisting several groups in NSF ICorp customer discovery sessions, she led several teams through the initial, as well as the full-scale, national program. Dr. Tokarz has also participated in several NSF SBIR review boards. Dr. Tokarz earned her Ph.D. in Materials Science and a dual Master’s degree in Mechanical Engineering and Materials Science from the University of Michigan in Ann Arbor.

Dr. Ramez Elgammal has a broad background in science, engineering, and entrepreneurship. He is a Senior Research Associate at the University of Tennessee where he manages a broad spectrum of projects in energy storage and energy generating devices including fuel cells, flow batteries, and lithium-ion batteries. Dr. Elgammal served as Director of New Applications for Sylvatex Inc. developing advanced lithium-ion battery materials and prior to that he co-founded two clean-tech companies: Novoform Technologies (which develops catalysts for gas-to-liquid conversion and was acquired in 2014) and Saratoga Energy Research Partners (focused on electrochemical CO2 conversion process to synthesize carbon nanomaterials for lithium-ion battery anodes). He has over 40 publications and conference proceedings and 7 patents pending. Dr. Elgammal earned his M.Sc. in Applied Physics and Ph.D. in Chemistry at the California Institute of Technology (CalTech) as a Rosen Fellow and holds an honor’s B.S. in Chemistry from Central Michigan University where he was a Centralis Scholar.

“Michelle and Ramez are key players in the growth of The Coretec Group. Their combined knowledge, industry connections, and expertise are unsurpassed, but more importantly they share the entrepreneurial spirit that drives our team,” said Matthew Kappers, CEO.

About The Coretec Group

The Coretec Group, Inc. is developing a portfolio of engineered silicon to improve energy-focused verticals, including electric vehicle and consumer batteries, solid-state lighting (LEDs), and semiconductors, as well as 3D volumetric displays and printable electronics. The Coretec Group serves the global technology markets in energy, electronics, semiconductor, solar, health, environment, and security.

For more information, please visit www.thecoretecgroup.com. Follow The Coretec Group on Twitter and LinkedIn.

Forward-Looking Statements:

The statements in this press release that relate to The Coretec Group’s expectations with regard to the future impact on the Company’s results from operations are forward-looking statements, and may involve risks and uncertainties, some of which are beyond our control. Such risks and uncertainties are described in greater detail in our filings with the U.S. Securities and Exchange Commission. Since the information in this press release may contain statements that involve risk and uncertainties and are subject to change at any time, the Company’s actual results may differ materially from expected results. We make no commitment to disclose any subsequent revisions to forward-looking statements. This release does not constitute an offer to sell or a solicitation of offers to buy any securities of any entity.


Contacts

Corporate contact:
The Coretec Group, Inc.
Lindsay McCarthy
This email address is being protected from spambots. You need JavaScript enabled to view it.
+1 (866) 916-0833

Media contact:
The Coretec Group, Inc.
Allison L. Gabrys
This email address is being protected from spambots. You need JavaScript enabled to view it.
+1 (866) 916-0833

LAS VEGAS--(BUSINESS WIRE)--MP Materials Corp. (NYSE: MP), the largest rare earth materials producer in the Western Hemisphere, today announced that a member of its executive management team is scheduled to participate in a fireside chat at the 45th Annual Gabelli Automotive Symposium in Las Vegas, Nevada, on Monday, November 1, 2021, at 12:30 p.m. Pacific Time.

Live webcasts and replays will be available at https://investors.mpmaterials.com/.

About MP Materials

MP Materials Corp. (NYSE: MP) is the largest producer of rare earth materials in the Western Hemisphere. The Company owns and operates the Mountain Pass Rare Earth Mine and Processing Facility (“Mountain Pass”), the only rare earth mining and processing site of scale in North America. MP Materials produced approximately 15% of the rare earth content consumed in the global market in 2020. Separated rare earth elements are critical inputs for the magnets that enable the mobility of electric vehicles, drones, defense systems, wind turbines, robotics and many other high-growth, advanced technologies. MP Materials’ integrated operations at Mountain Pass combine low production costs with high environmental standards, thereby restoring American leadership to a critical industry with a strong commitment to sustainability. More information is available at https://mpmaterials.com/.

Join the MP Materials community on Twitter, Instagram and LinkedIn.


Contacts

Investors:
This email address is being protected from spambots. You need JavaScript enabled to view it.

Media:
Matt Sloustcher
This email address is being protected from spambots. You need JavaScript enabled to view it.

Largest solar panel installation for Keysight globally accelerates company’s commitment to net zero emissions with on-site renewable energy generation

SANTA ROSA, Calif.--(BUSINESS WIRE)--$KEYS #CSR--Keysight Technologies, Inc. (NYSE: KEYS), a leading technology company that delivers advanced design and validation solutions to help accelerate innovation to connect and secure the world, announced the installation of a rooftop solar array at the company’s largest site, located in Penang, Malaysia, with completion estimated for Spring 2022.


Keysight is committed to achieving net zero emissions in company operations by the end of fiscal year 2040, in alignment with the Paris Agreement's preferred goal to limit global warming to 1.5°C.

“One of Keysight’s top priorities is mitigating the impacts of climate change and leaving a healthier planet for future generations. Social responsibility is one of the key values of the Keysight Leadership Model and is at the core of our DNA,” said Alicia Benson, global director of Keysight’s Workplace Solutions. “This solar installation project is an example of our commitment to a low carbon future, and proof that we are making steady progress toward achieving our goals.”

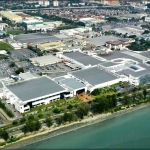
Covering the rooftops of all eight buildings at the Bayan Lepas site in Penang, Malaysia, this is the largest solar power generation system for Keysight globally and the largest industry rooftop PV system in Penang. It is a 5.8 megawatt (MW) peak solar installation, creating approximately 7.9 million kWh of energy annually, which is more than 16 percent of the total current annual energy consumption at the site. It will reduce the equivalent of approximately 5,000 metric tons of carbon dioxide emissions in the first year and more than 95,000 metric tons over 20 years.

“Despite the challenges of the recent pandemic, we have continued to make progress on this project and many other initiatives towards our CSR objectives. We remain steadfast in our commitment to building a better planet and supporting local communities where we operate,” said Gooi Soon Chai, Keysight senior vice president and president of Keysight Malaysia and Singapore. “As a leading industry player in Malaysia for the past 50 years, we are also extremely proud to contribute to Malaysia’s 2050 carbon neutral goal as outlined in the Twelfth Malaysia Plan. We welcome and support the shift to more sustainable economic practices in countries worldwide.”

About Keysight Technologies

Keysight delivers advanced design and validation solutions that help accelerate innovation to connect and secure the world. Keysight’s dedication to speed and precision extends to software-driven insights and analytics that bring tomorrow’s technology products to market faster across the development lifecycle, in design simulation, prototype validation, automated software testing, manufacturing analysis, and network performance optimization and visibility in enterprise, service provider and cloud environments. Our customers span the worldwide communications and industrial ecosystems, aerospace and defense, automotive, energy, semiconductor and general electronics markets. Keysight generated revenues of $4.2B in fiscal year 2020. For more information about Keysight Technologies (NYSE: KEYS), visit us at www.keysight.com.

Additional information about Keysight Technologies is available in the newsroom at https://www.keysight.com/go/news and on Facebook, LinkedIn, Twitter and YouTube.


Contacts

Geri Lynne LaCombe, Americas/Europe
+1 303 662 4748
This email address is being protected from spambots. You need JavaScript enabled to view it.

Fusako Dohi, Asia
+81 42 660-2162
This email address is being protected from spambots. You need JavaScript enabled to view it.

HOUSTON--(BUSINESS WIRE)--Hess Midstream LP (NYSE: HESM) (“Hess Midstream”), today announced that the Board of Directors of its general partner declared a quarterly cash distribution of $0.5104 per Class A share for the quarter ended September 30, 2021. The distribution represents a 1.2% increase compared to the distribution on the Hess Midstream Class A shares for the second quarter of 2021, which equals a 5% increase on an annualized basis. The distribution will be payable on November 12, 2021 to shareholders of record as of the close of business on November 4, 2021.


About Hess Midstream

Hess Midstream LP is a fee-based, growth-oriented midstream company that operates, develops and acquires a diverse set of midstream assets to provide services to Hess Corporation and third-party customers. Hess Midstream owns oil, gas and produced water handling assets that are primarily located in the Bakken and Three Forks Shale plays in the Williston Basin area of North Dakota. More information is available at www.hessmidstream.com.


Contacts

Investor Contact:
Jennifer Gordon
(212) 536-8244

Media Contact:
Robert Young
(346) 319 8783

DUBLIN, Ireland & AUSTIN, Texas--(BUSINESS WIRE)--Gazelle Wind Power announced the opening of its U.S. office in Austin, Texas, at 1250 South Capital of Texas Highway. This is the company's first office in the United States, signaling Gazelle's entry into the American wind energy marketplace. Gazelle's unique concept is the first and only offshore floating wind system of its kind to be verified by DNV.


Gazelle Wind Power has reinvented the floating wind platform to be lighter, flexible, and more stable, positioning the company as a fundamental driver for opening the massive deep-water offshore wind market.

"The addition of this U.S. office is a significant milestone for Gazelle as we take our innovative technology to the global market. We chose Austin for our U.S. office because several leading sources rank the city as a top cleantech innovation hub, which gives us unparalleled access to potential partners," said Jon Salazar, founder, and president of Gazelle Wind Power. "Austin also provides Gazelle with convenient access to the robust offshore wind market that is taking off in the Gulf Coast region and throughout the United States."

Wind energy in the U.S. is growing at a record pace. The U.S. Department of Energy reports that a record-breaking 17 GW of new wind capacity was installed in 2020, bringing the nation's cumulative total to 122 GW.

Still, wind power only represents about 8.4% of total U.S. utility-scale electricity generation, according to the U.S. Energy Information Administration. This leaves a great deal of room for growth.

With land constraints severely restricting onshore expansion, wind energy's next development phase requires opening the massive offshore wind market. Last year, the U.S. offshore wind energy pipeline increased by 24% to a potential generating capacity of 35 GW.

The floating offshore wind market is projected to reach 250 GW by 2050, according to DNV. Based in Norway, DNV is a global independent classification, assurance and risk management provider, it is one of the world’s leading certification bodies, helping businesses assure the performance of their organisations, products, people, facilities and supply chains.

Reaching the maximum amount of energy production requires developing wind farms in waters deeper than 60 meters with substantially larger turbines. But, at these depths, it's harder to build, secure, and maintain fixed platforms to the seafloor. Gazelle's innovative, hybrid attenuated mooring platform is designed and engineered by leading naval engineers to enable floating offshore wind production in deeper waters farther out at sea. Its unique platform design is a hybrid of the semi-submersible and tension leg platform designs, incorporating all their advantages.

Lighter than conventional platforms, it uses approximately 70% less steel and is one-third the weight of other floating platforms. It has a tilt of less than 1 degree and has 80% less mooring tension load than tension leg platforms. The Gazelle platform is more compact and simpler to build, deploy, and maintain than other floating platforms, which translates to dramatically lower levelized cost of energy (LCOE).

Gazelle is led by a group of policymakers, government officials, engineers, and CEOs with extensive energy, policy, and business experience. In addition to its U.S. office, Gazelle has opened offices in Dubai, London, Madrid, and Paris.

About Gazelle Wind Power

Gazelle Wind Power Limited is unlocking the massive deep-water offshore wind market to achieve global decarbonisation. The company's durable, disruptive hybrid floating platform with a high stability attenuated pitch surmounts the current barriers of buoyancy and geographic limitations while reducing costs and preserving fragile marine environments. The company is based in Dublin and has a presence in Dubai, London, Madrid, Paris, and Texas. For more information, visit www.gazellewindpower.com.


Contacts

Mercom Communications
Wendy Prabhu
Tel: 1-512-215-4452
Email: This email address is being protected from spambots. You need JavaScript enabled to view it.

STAMFORD, Conn.--(BUSINESS WIRE)--Crane Co., a diversified manufacturer of highly engineered industrial products, today announced its regular quarterly dividend of $0.43 per share for the fourth quarter of 2021. The dividend is payable on December 8, 2021 to shareholders of record as of the close of business on November 30, 2021.


Crane Co. is a diversified manufacturer of highly engineered industrial products. Founded in 1855, Crane Co. provides products and solutions to customers in the chemicals, oil & gas, power, automated payment solutions, banknote design and production and aerospace & defense markets, along with a wide range of general industrial and consumer related end markets. The Company has four business segments: Aerospace & Electronics, Process Flow Technologies, Payment & Merchandising Technologies and Engineered Materials. On May 24, 2021, Crane announced that it had signed an agreement to divest its Engineered Materials segment; that sale is pending, subject to customary closing conditions and regulatory approval. Crane Co. has approximately 11,000 employees in the Americas, Europe, the Middle East, Asia and Australia. Crane Co. is traded on the New York Stock Exchange (NYSE:CR). For more information, visit www.craneco.com.


Contacts

Jason D. Feldman
Vice President, Investor Relations
203-363-7329
www.craneco.com

DUBLIN--(BUSINESS WIRE)--The "Nigeria Power Report 2021/22" report has been added to ResearchAndMarkets.com's offering.


The Nigeria Power Report 2021/22 shows that the challenges facing the power sector are likely to continue in the medium-term. The lack of gas supply, insufficient T&D infrastructure, and sector illiquidity will contribute to an environment where new IPPs are unlikely to emerge in the coming years. However, after many false dawns the prospect of long-promised recovery may be in sight.

Government policies, supported by the World Bank, look to resolve some of the key issues holding the sector back. Their success will lead to improvements in transmission and distribution - both financial and infrastructural - while the recent passing of the Petroleum Industry Bill will provide much needed clarity for the sector and could unlock new gas supply to the domestic market, as will the construction of major gas pipeline projects. Combined, these may break down some of the major barriers for new IPPs.

In the near term, opportunities for private participation are emerging beyond new build generation. Plans are afoot to privatise the Transmission Company of Nigeria, while state-owned National Integrated Power Projects are being retendered after an unsuccessful privatisation attempt several years ago.

Analysis is underpinned and informed by independent power generation forecasts based on the actual project development pipeline, with data drawn from African Energy Live Data - a proprietary database of more than 6,700 power projects and plant.

The report examines the progress and impact of the government's reform programme alongside the wider challenges facing the electricity supply industry as it tries to improve electricity supply.

  • Independent supply and demand outlook - Installed capacity is woefully insufficient to meet demand and hampered by numerous constraints. The report includes African Energy's five-year supply and demand forecast analysing installed generation capacity, available generation, fuel supply and network constraints.
  • T&D opportunities - The government continues its privatisation drive with plans to sell Nigeria's transmission entity and the proposed franchising of distribution. The report examines the impact of these moves, the role of mini-grids, and what possible opportunities may arise for T&D participants.
  • Gas supply will be crucial - Gas will continue to fuel Nigeria's power sector for many years to come while oil continues to play a key role in the country's economy. The report includes a detailed assessment of the Petroleum Industry Bill and a forward-looking projection of gas availability for the power sector.
  • Off-grid growth opportunities - the use of backup diesel generators is widespread, but opportunities for renewables solutions are growing. The report examines the regulations for off-grid generation and distribution and the emerging opportunities for entering this growing sub-sector.
  • Political and economic risk - With President Buhari reaching the mid-way point of his final term and the economy reeling from the impacts of Covid-19 and the fall in oil prices from their early 2010s peak, the report explores the political dynamics influencing the future of Nigeria's government and questions whether the bleak economic picture will improve in the coming years.

Key Topics Covered:

  • Executive summary
  • Risk management report
  • Political risk
  • Macroeconomic overview
  • ESI Overview
  • Power sector policy
  • Regulation and procurement
  • Oil, gas and other resources
  • Demand and supply outlook
  • Transmission and distribution
  • Off-grid
  • Commercial and industrial market
  • Competitive landscape
  • Installed capacity data (including breakdowns by fuel, technology, ownership, and for individual states)
  • Power general projects (operating, under construction, in development)


Companies Mentioned

  • 4Power Consortium Ltd
  • Abuja Electricity Distribution Company
  • Amperion Power Distribution Ltd
  • Aura Energy Ltd
  • Azura Power
  • Benin Electricity Distribution Company
  • Bureau of Public Enterprises (BPE)
  • China National Electric Engineering Company (CNEEC)
  • Engie
  • Eko Electricity Distribution Company
  • Eni
  • Enugu Electricity Distribution Company
  • GE
  • Ibadan Electricity Distribution Company
  • Ikeja Electricity Distribution Company
  • Integrated Energy Distributing and Marketing Ltd
  • Interstate Electrics Ltd
  • Jos Electricity Distribution Company
  • Kano Electricity Distribution Company
  • Korea Electric Power Corporation (Kepco)
  • Mainstream Energy Solutions
  • New Electric Distribution Company
  • Nigeria Bulk Electricity Trading Company (NBET)
  • Niger Delta Power Holding Company (NDPHC)
  • Nigeria Electricity Regulatory Commission (Nerc)
  • Nigerian National Petroleum Corporation
  • North South Power Company
  • Paras Energy
  • Pacific Energy
  • Port Harcourt Electricity Distribution Company
  • Quest Electricity Nigeria Ltd
  • Rockson Engineering Nigeria Ltd
  • Sahelian Power
  • Shanghai Municipal Electric Power Company
  • Shell Petroleum Development Company (SPDC)
  • Sinohydro
  • Transcorp Ughelli Power
  • Transmission Company of Nigeria (TCN)
  • Vergnet
  • Vigeo Power Ltd
  • Wartsila
  • West Power and Gas Ltd
  • Winch Energy
  • World Bank Group
  • Yola Electricity Distribution Company

For more information about this report visit https://www.researchandmarkets.com/r/sjehsa

About ResearchAndMarkets.com

ResearchAndMarkets.com is the world's leading source for international market research reports and market data. We provide you with the latest data on international and regional markets, key industries, the top companies, new products and the latest trends.


Contacts

ResearchAndMarkets.com
Laura Wood, Senior Press Manager
This email address is being protected from spambots. You need JavaScript enabled to view it.

For E.S.T Office Hours Call 1-917-300-0470
For U.S./CAN Toll Free Call 1-800-526-8630
For GMT Office Hours Call +353-1-416-8900

AKRON, Ohio--(BUSINESS WIRE)--$BW--On October 20, 2021, Babcock & Wilcox Enterprises, Inc. (the “Company”) received a letter from the staff of the Division of Enforcement of the Atlanta Regional office of the U.S. Securities and Exchange Commission (“Commission”) confirming that the staff has concluded its investigation of the Company that the Company has previously disclosed in its SEC filings and that it does not intend to recommend to the Commission that an enforcement action be brought against the Company.

“We have cooperated with the SEC throughout the duration of this investigation which began in 2017 and are pleased to put this matter behind us,” commented Kenneth M. Young, CEO and Chairman of the Company.

About B&W
Headquartered in Akron, Ohio, Babcock & Wilcox Enterprises, Inc., is a global leader in energy and environmental technologies and services for the power and industrial markets. Follow us on LinkedIn and learn more at www.babcock.com.


Contacts

Investor Contact:
Megan Wilson
Vice President, Corporate Development & Investor Relations
Babcock & Wilcox
330-860-6802 | 704.625.4944
This email address is being protected from spambots. You need JavaScript enabled to view it.

Media Contact:
Ryan Cornell
Public Relations
Babcock & Wilcox
330.860.1345
This email address is being protected from spambots. You need JavaScript enabled to view it.

SAN DIEGO--(BUSINESS WIRE)--#army--XENDEE Corporation and its subcontractor Colombara Romeo Engineering will perform economic and electrical energy resilience modeling for US Army Base Longare to verify the current system capabilities and explore opportunities to add sustainable generation options such as photovoltaic and battery energy storage systems.


The intent of this DoD project is to analyze the current condition, identify existing deficiencies, and determine what elements would be necessary to implement a more resilient electrical infrastructure in the most cost effective manner. Additionally, as this facility serves mission critical loads for a foreign base, the new upgrades must also enable the Microgrid to function in islanded operation for an extended period of time.

“XENDEE’s engineers will use our platform to determine the optimal configuration and operation of the Distributed Energy Resources to generate the most optimal mix of technologies, installation topology, and operation of the Microgrid to meet the DoD’s project goals,” said Michael Stadler, CTO of XENDEE.

The first stage of the project, the field investigation, will examine the existing infrastructure to determine the condition and appropriate sizing for future capacities to meet loads and generation challenges associated with energy resilience alternatives in the Microgrid.

“With the field investigation complete, we can explore ideal placing and sizing for the considered Distributed Energy Resources (DER). This will enable us to provide a design recommendation, project specifications, an equipment list and a cost estimate to implement the new distributed energy upgrades on base,” said Romeo Colombara, founder of Colombara Romeo Engineering.

With the onsite information gathered, XENDEE’s engineers will use the data and design recommendations to model multiple optimization scenarios for the possible infrastructure upgrades. These can be selected and prioritized to maximize savings, resilience, environmental impact reduction, and reliability. The optimized scenarios will also make it easy to assess the resilience and cost targets for each option, giving decision makers a variety of design alternatives that can be employed to achieve the desired objectives for that site location.

Additionally, XENDEE will provide an optimized dispatch for each scenario, giving US Army Base Longare a precise framework for Microgrid operation to capture the lowest prices and highest efficiency based on the technologies selected.

For more information on the XENDEE Microgrid Decision Support Platform, please schedule a demonstration at xendee.com/demo.

About XENDEE: XENDEE develops world-class Microgrid decision support software that helps designers and investors optimize and certify the Fight-Through™ resilience and financial performance of projects with confidence. The XENDEE Microgrid platform enables a broad audience; from business decision makers to scientists, with the objective of supporting investments in Microgrids and maintaining electric power reliability when integrating sources of renewable generation.

About Colombara Romeo Engineering: Colombara is a firm located in Vicenza, Italy with experience in Engineering & Energy Management Services for U.S. Military sites. Colombara has extensive experience in electricity studies, renovation of electric substations, energy control and distribution systems, construction management and build cost estimation to meet both Italian and U.S. building standards.


Contacts

Jay Gadbois | This email address is being protected from spambots. You need JavaScript enabled to view it.

Third Quarter 2021 Highlights

  • GAAP earnings from continuing operations per diluted share (EPS) of $1.87 compared to $0.84 in the third quarter of 2020.
  • Excluding Special Items, record EPS from continuing operations ("adjusted EPS") of $1.89 increased 103% compared to $0.93 in the third quarter of 2020.
  • Core year-over-year sales growth of 20% and core year-over-year order growth of 31%.
  • Raising and narrowing GAAP EPS from continuing operations guidance to $6.50-$6.60, from $6.05-$6.25.
  • Raising and narrowing EPS from continuing operations guidance, excluding Special Items, to $6.35-$6.45, from $5.95-$6.15.
  • Announced new $300 million share repurchase authorization.

STAMFORD, Conn.--(BUSINESS WIRE)--Crane Co. (NYSE: CR), a diversified manufacturer of highly engineered industrial products, reported third quarter 2021 financial results and updated its full-year 2021 outlook.

Max Mitchell, Crane Co. President and Chief Executive Officer stated: “We delivered extremely strong results in the third quarter with record EPS. Performance was outstanding across all of our businesses, and we were able to achieve 20% core year-over-year sales growth and high-teens adjusted operating margins even in the face of continued inflationary pressures and ongoing supply chain challenges. These results are a testament to the hard work and passion of our 11,000 global associates who drive the Crane culture for all stakeholders every day, and who successfully navigated through the myriad challenges of the last two years. "

"Looking ahead, we see further broad-based strengthening across our primary end markets which is reflected in our 31% core year-over-year order growth and 13% core year-over-year backlog growth. Considering our strong performance in the third quarter and our outlook for the balance of the year, we are raising the midpoint of our adjusted EPS guidance by $0.35 to a range of $6.35-$6.45 reflecting an approximate 80% year-over-year increase. The midpoint of our guidance range is also now well above our prior-peak 2019 total adjusted EPS of $6.02 despite Engineered Materials' current classification as discontinued operations, and with many of our end markets still in the very early stages of recovery. In addition to our outstanding performance and near-term outlook, I continue to be very excited about the momentum we have with our ongoing investments in technology and our strategic growth initiatives, all of which are positioning Crane for long-term sustainable above-market growth."

Third Quarter 2021 Results from Continuing Operations

Third quarter 2021 GAAP earnings from continuing operations per diluted share (EPS) of $1.87, compared to $0.84 in the third quarter of 2020. Excluding Special Items, third quarter 2021 EPS from continuing operations was $1.89, compared to $0.93 in the third quarter of 2020. (Please see the attached Non-GAAP Financial Measures tables for a detailed reconciliation of reported results to adjusted measures.)

Third quarter 2021 sales were $834 million, an increase of 21% compared to the third quarter of 2020. The sales increase was comprised of a $134 million, or 20%, increase in core sales, and a $13 million, or 2%, benefit from favorable foreign exchange.

Third quarter 2021 operating profit was $138 million, compared to $76 million in the third quarter of 2020. Operating profit margin was 16.6%, compared to 11.1% last year, with the improvement driven primarily by higher volumes. Excluding Special Items, third quarter 2021 operating profit was $140 million, compared to $83 million last year. Excluding Special Items, operating profit margin was a record 16.8%, compared to 12.0% last year. (Please see the attached Non-GAAP Financial Measures tables for a detailed reconciliation of reported results to adjusted measures.)

Summary of Third Quarter 2021 Results from Continuing Operations


Third Quarter


Change

(dollars in millions)


2021


2020


$


%

Net sales (GAAP)


$

834


$

686


$

147


21%

Core sales


134


20%

Foreign exchange


13


2%


Operating profit


$

138


$

76


$

62


82%

Operating profit, before special Items (adjusted)*


$

140


$

83


$

57


69%


Operating profit margin


16.6

%


11.1

%


550bps

Operating profit margin, before special items (adjusted)*


16.8

%


12.0

%


480bps

*Please see the attached Non-GAAP Financial Measures tables

Cash Flow and Other Financial Metrics

Cash provided by operating activities from continuing operations in the first nine months of 2021 was $312 million, compared to $197 million last year. Capital expenditures in the first nine months of 2021 were $25 million, compared to $20 million last year. Free cash flow (cash provided by operating activities less capital spending) for the first nine months of 2021 was $286 million, compared to $177 million last year.

The Company held cash and short-term investments of $451 million at September 30, 2021, compared to $581 million at December 31, 2020. Total debt was $842 million at September 30, 2021, compared to $1,219 million at December 31, 2020.

On October 25, 2021, Crane Co. also announced that its Board of Directors has approved a $300 million share repurchase authorization.

Rich Maue, Crane Co. Senior Vice President and Chief Financial Officer, added: “The combination of improving end market demand and excellent operational execution has driven robust cash generation, further strengthening our balance sheet and credit metrics, and enhancing our financial flexibility. We believe that share repurchases are attractive at this time given very high confidence in our medium- and long-term outlook, paired with our stock's current discount to both trading peers and fully synergized acquisition multiples. We will continue to evaluate all capital deployment and strategic portfolio options to drive shareholder return with strict financial discipline and a focus on long-term sustainable value creation.”

Third Quarter 2021 Segment Results

All comparisons detailed in this section refer to operating results for the third quarter 2021 versus the third quarter 2020.

Aerospace & Electronics


Third Quarter


Change

(dollars in millions)


2021


2020


$


%

Net sales


$

169


$

157


$

12


7%


Operating profit


$

33


$

25


$

8


33%


Operating profit margin


19.3

%


15.6

%


370bps

Sales of $169 million increased 7% compared to the prior year. Operating profit margin improved to 19.3%, from 15.6% last year, primarily reflecting higher volumes, productivity, and benefits from 2020 cost actions. Aerospace & Electronics' order backlog was $479 million at September 30, 2021, compared to $491 million at December 31, 2020, and compared to $498 million at September 30, 2020.

Process Flow Technologies


Third Quarter


Change

(dollars in millions)


2021


2020


$


%

Net sales


$

299


$

252


$

47


19%

Core sales


39


16%

Foreign exchange


8


3%


Operating profit


$

44


$

26


$

18


71%

Operating profit, before special Items (adjusted)*


$

46


$

29


$

17


60%


Operating profit margin


14.8

%


10.3

%


450bps

Operating profit margin, before special items (adjusted)*


15.5

%


11.4

%


410bps

*Please see the attached Non-GAAP Financial Measures tables

Sales of $299 million increased $47 million, or 19%, driven by a $39 million, or 16%, increase in core sales, and an $8 million, or 3%, benefit from favorable foreign exchange. Operating profit margin increased to 14.8%, compared to 10.3% last year, primarily reflecting higher volumes and productivity benefits. Excluding Special Items, operating margin increased to 15.5%, compared to 11.4% last year. Process Flow Technologies order backlog was $351 million at September 30, 2021, compared to $313 million at December 31, 2020, and compared to $305 million at September 30, 2020.

Payment & Merchandising Technologies


Third Quarter


Change

(dollars in millions)


2021


2020


$


%

Net sales


$

366


$

277


$

89


32

%

Net sales, including acquisition-related deferred revenue*


366


280


86


31

%

Core sales


84


30

%

Foreign exchange


5


2

%


Operating profit


$

84


$

41


43


107

%

Operating profit, before special Items (adjusted)*


$

83


$

44


38


87

%


Operating profit margin


22.9

%


14.6

%


830bps

Operating profit margin, before special items (adjusted)*


22.6

%


15.8

%


680bps

*Please see the attached Non-GAAP Financial Measures tables

Sales of $366 million increased $89 million, or 32%, driven by an $84 million, or 30%, increase in core sales, and a $5 million, or 2%, benefit from favorable foreign exchange. Operating profit margin increased to 22.9%, from 14.6% last year, primarily reflecting higher volumes. Excluding Special Items, operating profit margin increased to 22.6%, from 15.8% last year.

Updating Full Year Outlook

On May 24, 2021, Crane Co. announced that it had signed an agreement to sell its Engineered Materials segment. Consequently, starting with second quarter 2021 financial results, Engineered Materials has been presented as discontinued operations. All components of guidance, both GAAP and adjusted, are provided on a continuing operations basis and exclude all contribution from Engineered Materials.

We are raising our 2021 full year GAAP EPS from continuing operations guidance to a range of $6.50-$6.60, compared to the prior range of $6.05-$6.25.

We are raising our 2021 full year EPS from continuing operations guidance excluding Special Items (adjusted) to a range of $6.35-$6.45, compared to the prior range of $5.95-$6.15. Revised guidance now assumes core sales growth of +10% to +12%, an adjusted tax rate of approximately 17.5%, and corporate expense of $90 million. Additional details of our revised guidance are shown in the following table (Please see the attached non-GAAP Financial Measures tables.)

Full Year 2021 Guidance Details (Continuing Operations Basis)*

($ Millions, except per share amounts)

Prior Guidance (7/26/2021)

Updated Guidance

Net sales

$3,100

$3,150

Core sales growth

+7% to +9%

+10% to +12%

Acquisition benefit

~$5

~$5

FX translation

+3.5%

+2.5%

Diluted earnings per share, GAAP

$6.05 to $6.25

$6.50 to $6.60

Diluted earnings per share, non-GAAP (adjusted)

$5.95 to $6.15

$6.35 to $6.45

Operating cash flow

$390 to $420

$400 to $425

Capital expenditures

$70

$60

Free cash flow

$320 to $350

$340 to $365

Corporate expense

$80

$90

Adjusted tax rate

~20.5%

~17.5%

Non-operating expense, net

$31

$31

Full-year diluted share count

~59 million

~59 million

*Please see the attached Non-GAAP Financial Measures tables

Additional Information

Share repurchases under the authorization may occur from time to time in open market transactions at prevailing prices or by other means in accordance with federal securities laws. The timing and amount of any repurchases will be determined by the Company’s management based on its evaluation of market conditions and other factors. There is no guarantee as to the number of shares that will be repurchased or the amount that will be spent on repurchases, and the repurchases may be extended, suspended, or discontinued at any time without prior notice at the Company’s discretion. This announcement is neither an offer to sell, or the solicitation of an offer to purchase, any securities.

Additional information with respect to the Company’s asbestos liability and related accounting provisions and cash requirements is set forth in the Current Report on Form 8-K filed with a copy of this press release.

Conference Call

Crane Co. has scheduled a conference call to discuss the third quarter financial results on Tuesday, October 26, 2021 at 10:00 A.M. (Eastern). All interested parties may listen to a live webcast of the call at http://www.craneco.com. An archived webcast will also be available to replay this conference call directly from the Company’s website under Investors, Events & Presentations. Slides that accompany the conference call will be available on the Company’s website.

Crane Co. is a diversified manufacturer of highly engineered industrial products. Founded in 1855, Crane Co. provides products and solutions to customers in the chemicals, oil & gas, power, automated payment solutions, banknote design and production and aerospace & defense markets, along with a wide range of general industrial and consumer related end markets. The Company has four business segments: Aerospace & Electronics, Process Flow Technologies, Payment & Merchandising Technologies, and Engineered Materials. On May 24, 2021, Crane announced that it had signed an agreement to divest its Engineered Materials segment; that sale is pending, subject to customary closing conditions and regulatory approvals. Crane Co. has approximately 11,000 employees in the Americas, Europe, the Middle East, Asia and Australia. Crane Co. is traded on the New York Stock Exchange (NYSE:CR). For more information, visit www.craneco.com.

This press release may contain forward-looking statements as defined by the Private Securities Litigation Reform Act of 1995. These statements are based on the management’s current beliefs, expectations, plans, assumptions and objectives regarding Crane Co.’s future financial performance and are subject to significant risks and uncertainties. Any discussions contained in this press release, except to the extent that they contain historical facts, are forward-looking and accordingly involve estimates, assumptions, judgments and uncertainties. There are a number of factors, including risks and uncertainties related to the ongoing COVID-19 pandemic, that could cause actual results or outcomes to differ materially from those expressed or implied in these forward-looking statements. Such factors also include, among others: uncertainties regarding the extent and duration of the impact of the COVID-19 pandemic on many aspects of our business, operations and financial performance; changes in economic, financial and end-market conditions in the markets in which we operate; fluctuations in raw material prices; the financial condition of our customers and suppliers; economic, social and political instability, currency fluctuation and other risks of doing business outside of the United States; competitive pressures, including the need for technology improvement, successful new product development and introduction and any inability to pass increased costs of raw materials to customers; our ability to value and successfully integrate acquisitions, to realize synergies and opportunities for growth and innovation, and to attract and retain highly qualified personnel and key management; the risks that any regulatory approval that may be required for the Engineered Materials divestiture is delayed or is not obtained, that the Engineered Materials divestiture does not close or that the related transaction agreement is terminated, or that the benefits expected from the Engineered Materials divestiture will not be realized or will not be realized within the expected time period; a reduction in congressional appropriations that affect defense spending and our ability to predict the timing and award of substantial contracts in our banknote business; adverse effects on our business and results of operations, as a whole, as a result of increases in asbestos claims or the cost of defending and settling such claims; adverse effects as a result of environmental remediation activities, costs, liabilities and related claims; investment performance of our pension plan assets and fluctuations in interest rates, which may affect the amount and timing of future pension plan contributions; and other risks noted in reports that we file with the Securities and Exchange Commission, including the Company’s Annual Report on Form 10-K for the fiscal year ended December 31, 2020 and subsequent reports filed with the Securities and Exchange Commission. Crane Co. does not undertake any obligation to update or revise any forward-looking statements.

(Financial Tables Follow)

CRANE CO.

Income Statement Data

(in millions, except per share data)


Three Months Ended

September 30,

Nine Months Ended

September 30,


2021

2020

2021

2020

Net sales:


Aerospace & Electronics

$

168.6


$

157.0


$

480.2


$

507.3


Process Flow Technologies

299.1


252.3


897.9


748.2


Payment & Merchandising Technologies

365.8


277.2


1,031.4


822.1


Total net sales

$

833.5


$

686.5


$

2,409.5


$

2,077.6


Operating profit:


Aerospace & Electronics

$

32.5


$

24.5


$

89.3


$

87.8


Process Flow Technologies

44.3


25.9


140.9


74.1


Payment & Merchandising Technologies

83.7


40.5


247.4


68.9


Corporate

(22.3

)

(15.0

)

(62.5

)

(44.5

)

Total operating profit

$

138.2


$

75.9


$

415.1


$

186.3


Interest income

$

0.2


$

0.6


$

1.1


$

1.3


Interest expense

(11.0

)

(14.4

)

(36.0

)

(41.3

)

Miscellaneous, net

3.6


4.4


17.2


10.6


Income from continuing operations before income taxes

131.0


66.5


397.4


156.9


Provision for income taxes

19.6


17.1


71.9


36.6


Net income from continuing operations attributable to common shareholders

111.4


49.4


325.5


120.3


Income from discontinued operations, net of tax 1

5.2


7.2


37.8


13.9


Net income attributable to common shareholders

$

116.6


$

56.6


$

363.3


$

134.2


Earnings per diluted share from continuing operations

$

1.87


$

0.84


$

5.50


$

2.04


Earnings per diluted share from discontinued operations

0.09


0.13


0.64


0.24


Earnings per diluted share

$

1.96


$

0.97


$

6.14


$

2.28


Average diluted shares outstanding

59.5


58.5


59.2


58.9


Average basic shares outstanding

58.7


58.1


58.5


58.4


Supplemental data:


Cost of sales

$

509.1


$

444.8


$

1,456.5


$

1,344.2


Selling, general & administrative

186.2


165.8


537.9


547.1


Acquisition-related and integration charges 2


2.7


10.3


Disposition costs 2

0.6


1.3


Repositioning related charges (gains), net 2

0.8


1.4


(8.6

)

25.9


Depreciation and amortization 2

29.1


31.6


89.8


92.6


Stock-based compensation expense 2

6.0


5.6


18.3


15.8


1 The nine-month period ended September 30, 2021 includes $21.5 million of deferred tax benefit associated with the pending disposition of the Engineered Materials segment.

2 Amounts included within Cost of sales and/or Selling, general & administrative costs.

CRANE CO.

Condensed Balance Sheets

(in millions)


September 30,
2021


December 31,
2020

Assets


Current assets


Cash and cash equivalents


$

450.8


$

551.0


Accounts receivable, net


512.7


423.9


Current insurance receivable - asbestos


14.4


14.4


Inventories, net


445.8


429.7


Other current assets


110.8


137.3


Current assets held for sale


227.0


17.4


Total current assets


1,761.5


1,573.7


Property, plant and equipment, net


525.8


573.7


Long-term insurance receivable - asbestos


62.3


72.5


Other assets


707.0


757.5


Goodwill


1,417.9


1,437.7


Long-term assets held for sale


199.9


Total assets


$

4,474.5


$

4,615.0


Liabilities and equity


Current liabilities


Short-term borrowings


$


$

375.7


Accounts payable


244.3


198.9


Current asbestos liability


66.5


66.5


Accrued liabilities


395.4


388.0


Income taxes


19.9


0.1


Current liabilities held for sale


39.1


27.4


Total current liabilities


765.2


1,056.6


Long-term debt


842.2


842.9


Long-term deferred tax liability


50.6


53.6


Long-term asbestos liability


563.9


603.6


Other liabilities


442.2


501.0


Long-term liabilities held for sale


26.2


Total equity


1,810.4


1,531.1


Total liabilities and equity


$

4,474.5


$

4,615.0


CRANE CO.

Condensed Statements of Cash Flows

(in millions)


Three Months Ended

September 30,

Nine Months Ended

September 30,


2021

2020

2021

2020

Operating activities from continuing operations:


Net income from continuing operations attributable to common shareholders

$

111.4


$

49.4


$

325.5


$

120.3


Gain on sale of property


(18.5

)


Depreciation and amortization

29.1


31.6


89.8


92.6


Stock-based compensation expense

6.0


5.6


18.3


15.8


Defined benefit plans and postretirement credit

(1.8

)

(1.8

)

(6.0

)

(4.5

)

Deferred income taxes

(4.5

)


(4.4

)

7.5


Cash (used for) provided by operating working capital

(11.0

)

44.1


(36.5

)

(2.3

)

Defined benefit plans and postretirement contributions

(5.6

)

(0.8

)

(22.8

)

(3.1

)

Environmental payments, net of reimbursements

(0.9

)

0.8


(4.6

)

(2.9

)

Asbestos related payments, net of insurance recoveries

(9.4

)

(4.5

)

(29.6

)

(23.7

)

Other

1.0


(2.8

)

0.5


(2.7

)

Total provided by operating activities from continuing operations

$

114.3


$

121.6


$

311.7


$

197.0


Investing activities from continuing operations:


Payments for acquisitions, net of cash acquired

$


$

3.1


$


$

(169.2

)

Proceeds from disposition of capital assets


1.2


23.3


3.9


Capital expenditures

(11.5

)

(6.7

)

(25.3

)

(20.0

)

Purchase of marketable securities


(60.0

)

(10.0

)

(60.0

)

Proceeds from sale of marketable securities


40.0


Total (used for) provided by investing activities from continuing operations

$

(11.5

)

$

(62.4

)

$

28.0


$

(245.3

)

Financing activities from continuing operations:


Dividends paid

$

(25.2

)

$

(25.0

)

$

(75.5

)

$

(75.4

)

Reacquisition of shares on open market


(70.0

)

Stock options exercised, net of shares reacquired

4.6


3.6


9.9


4.2


Debt issuance costs


(0.1

)


(1.3

)

Proceeds from issuance of commercial paper with maturities greater than 90 days


251.3


Repayments of commercial paper with maturities greater than 90 days


(92.1

)

(27.1

)

(188.6

)

Net repayments from issuance of commercial paper with maturities of 90 days or less

(15.0

)

(14.0

)


(76.8

)

Proceeds from revolving credit facility


77.2


Repayments of revolving credit facility


(77.2

)

Proceeds from term loan


343.9


Repayment of term loan


(348.1

)


Total (used for) provided by financing activities from continuing operations

$

(35.6

)

$

(127.6

)

$

(440.8

)

$

187.3


Discontinued operations:


Total provided by operating activities

$

6.0


$

9.9


$

15.3


$

11.1


Total used for investing activities

(0.6

)

(0.4

)

(1.4

)

(0.6

)

Increase in cash and cash equivalents from discontinued operations

5.4


9.5


13.9


10.5


Effect of exchange rate on cash and cash equivalents

(8.5

)

11.4


(13.0

)

1.2


Increase (decrease) in cash and cash equivalents

64.1


(47.5

)

(100.2

)

150.7


Cash and cash equivalents at beginning of period

386.7


592.1


551.0


393.9


Cash and cash equivalents at end of period

$

450.8


$

544.6


$

450.8


$

544.6


CRANE CO.

Order Backlog

(in millions)


September 30,

2021


June 30,

2021


March 31,

2021


December 31,

2020


September 30,

2020

Aerospace & Electronics


$

478.5


$

472.9


$

481.6


$

491.2


$

498.1


Process Flow Technologies


351.4


344.1


325.4


313.4


304.8


Payment & Merchandising Technologies


387.9


374.7


337.0


347.6


270.1


Total backlog


$

1,217.8


$

1,191.7


$

1,144.0


$

1,152.2


$

1,073.0


CRANE CO.

Non-GAAP Financial Measures

(in millions, except per share data)


Three Months Ended September 30,


2021


2020


% Change


$


Per Share


$


Per Share


(on $)

Net sales (GAAP)


$

833.5


$

686.5


21.4

%

Acquisition-related deferred revenue1


2.6


Net sales before special items (adjusted)


$

833.5


$

689.1


21.0

%


Operating profit (GAAP)


$

138.2


$

75.9


82.1

%

Operating profit margin (GAAP)


16.6

%


11.1

%


Special items impacting operating profit:


Acquisition-related deferred revenue 1


2.6


Acquisition-related and integration charges


2.7


Disposition costs


0.6


Repositioning related charges, net


0.8


1.4


Operating profit before special items (adjusted)


$

139.6


$

82.6


69.0

%

Operating profit margin before special items (adjusted)


16.8

%


12.0

%


Net income from continuing operations attributable to common shareholders (GAAP)


$

111.4


$

1.87


$

49.4


$

0.84


125.5

%


Special items, net of tax, impacting net income from continuing operations attributable to common shareholders:


Acquisition-related deferred revenue 1


1.9


0.03


Acquisition-related and integration charges


2.1


0.04


Disposition costs


0.5


0.01


Repositioning related charges, net


0.7


0.01


1.1


0.02


Net income from continuing operations, net of tax, attributable to common shareholders before special items (adjusted)


$

112.6


$

1.89


$

54.5


$

0.93


106.6

%


Special items impacting provision for income taxes from continuing operations:


Provision for income taxes (GAAP)


$

19.6


$

17.1


Tax effect of acquisition-related deferred revenue 1


0.7


Tax effect of acquisition-related and integration charges


0.6


Tax effect of disposition costs


0.1


Tax effect of repositioning related charges, net


0.2


0.3


Provision for income taxes before special items (adjusted)


$

19.9


$

18.7


1 Acquisition-related revenue that would otherwise be recognized but for the purchase accounting treatment of acquisitions.

Totals may not sum due to rounding


Contacts

Jason D. Feldman
Vice President, Investor Relations
203-363-7329
www.craneco.com


Read full story here

New York’s Landmark Climate Leadership and Community Protection Act Demonstrates to the Nation how to Confront a Rapidly Changing Climate

SAN DIEGO--(BUSINESS WIRE)--EDF Renewables North America today announced the start of construction on three community solar projects which will deliver 16.4 megawatts (MW) of clean energy to National Grid customers in central New York. This marks the first phase of a 50 MW Community Solar project portfolio consisting of eight projects in the towns of Vernon, Verona, Oswegatchie, Frankfort and Rosendale.


National Grid customers who enroll in the community solar program are eligible to receive clean renewable energy at a guaranteed discount over the standard electricity costs. This comes at a time when New York State’s Climate Leadership and Community Protection Act (Climate Act) empowers every citizen in the State to fight climate change.

The ambitious plan sets New York State goals of 100% zero-emission electricity by 2040 and reduced emissions by at least 85% below 1990 levels by 2050. EDF Renewables’ 50 MW portfolio of projects will produce enough clean electricity to power 8,200 average New York homes1. This is equivalent to avoiding 40,000 metric tons of CO2 annually or removing 9,000 cars from the road.

“EDF Renewables is excited to bring clean renewable energy to New York and appreciates the collaboration of the communities in which we work to help us build Community Solar projects that support New York climate goals,” said This email address is being protected from spambots. You need JavaScript enabled to view it., Senior Business Development Manager at EDF Renewables. “Now that New York Governor Kathy Hochul has expanded goals for the installation of distributed solar from 6 gigawatts (GW) to at least 10 GW by 2030, EDF Renewables is similarly expanding our efforts to bring clean renewable distributed solar projects to help power New York.”

The Climate Act will transform how every New Yorker generates and uses electricity; the way they heat their homes, and how they commute to work and school. It further brings with it numerous benefits to communities and diversifies revenue sources for participating landowners thus creating stability for generations.

EDF Renewables North America is a market leading independent power producer and service provider with 35 years of expertise in renewable energy. The Company delivers grid-scale power: wind (onshore and offshore), solar photovoltaic, and storage projects; distribution-scale power: solar and storage; asset optimization: technical, operational, and commercial expertise to maximize performance of generating projects, and onsite solutions, through the Company’s PowerFlex subsidiary, offering a full suite of onsite energy solutions for commercial and industrial customers: solar, storage, EV charging, energy management systems, and microgrids. EDF Renewables’ North American portfolio consists of 20 GW of developed projects and 13 GW under service contracts. EDF Renewables North America is a subsidiary of EDF Renewables, the dedicated renewable energy affiliate of the EDF Group. For more information visit: www.edf-re.com. Connect with us on LinkedIn, Facebook and Twitter.

1 According to U.S. Energy Information Administration (EIA) 2019 Residential Electricity Sales and U.S. Census Data and typical transmission assumptions.
2 According to U.S. EPA Greenhouse Gas Equivalencies calculations and typical transmission assumptions.


Contacts

Sandi Briner, +1 858-521-3525
This email address is being protected from spambots. You need JavaScript enabled to view it.

  • Petroleum Additives Third Quarter Shipments Strong, Up 11.9%
  • Rising Costs Continue to Pressure Margins
  • 10.5% Increase in Dividend Declared During the Third Quarter
  • 292,392 Shares Repurchased in the Third Quarter

RICHMOND, Va.--(BUSINESS WIRE)--NewMarket Corporation (NYSE:NEU) Chairman and Chief Executive Officer, Thomas E. Gottwald, released the following earnings report of the Company’s operations for the third quarter and first nine months of 2021.

Net income for the third quarter of 2021 was $52.0 million, or $4.80 per share, compared to net income of $95.8 million, or $8.77 per share, for the third quarter of 2020. For the first nine months of 2021, net income was $173.7 million, or $15.94 per share, compared to $203.7 million or $18.52 per share, for the first nine months of last year. Both prior year periods include a gain of $16.5 million related to the sale of a non-operating parcel of real estate.

Sales for the petroleum additives segment for the third quarter of 2021 were $619.1 million, up from $510.3 million in the third quarter of 2020. Shipments increased 11.9% between periods, with increases in both lubricant additives and fuel additives shipments across all regions except Europe, which reported a decrease in fuel additives shipments. Petroleum additives operating profit for the third quarter of 2021 was $72.1 million, compared to $102.2 million for the same period last year. The decrease was mainly due to higher raw material and conversion costs, partially offset by increased selling prices and higher shipments.

Petroleum additives sales for the first nine months of the year were $1.8 billion compared to sales in the first nine months of last year of $1.5 billion. Shipments increased 16.6% between periods, with increases in both lubricant additives and fuel additives shipments. The regional drivers for those increases were consistent with the drivers in the third quarter mentioned above. Petroleum additives operating profit for the first nine months of the year was $240.4 million compared to $248.9 million for the first nine months of 2020. The decrease was due mainly to higher raw material costs, partially offset by increased selling prices and higher shipments. Petroleum additives operating margin for the first nine months of 2021 was 13.6% compared to 16.9% in the prior year nine month period.

We have continued to see downward pressure on our operating margins due to rising raw material costs, energy costs, transportation network issues, and other costs associated with the continuing global supply chain disruptions affecting supply and distribution. While we have made some progress in adjusting our selling prices, our costs have continued to rise. Margin improvement will continue to be a priority until we see margins consistently within our historical ranges.

During the third quarter of 2021, we increased our quarterly dividend by 10.5% to $2.10 per share, and we repurchased 292,392 shares of our common stock for a total of $99.5 million. Through the first nine months of 2021, we funded capital expenditures of $64.0 million and paid dividends of $64.1 million.

We will remain focused on our long-term objectives. We believe the fundamentals of how we run our business – a long-term view, safety and people first culture, customer-focused solutions, technology-driven product offerings, and a world-class supply chain capability – will continue to be beneficial for all our stakeholders.

Sincerely,

Thomas E. Gottwald

The petroleum additives segment consists of the North America (the United States and Canada), Latin America (Mexico, Central America, and South America), Asia Pacific, and Europe/Middle East/Africa/India (Europe or EMEAI) regions.

The Company has disclosed the non-GAAP financial measure EBITDA and the related calculation in the schedules included with this earnings release. EBITDA is defined as income from continuing operations before the deduction of interest and financing expenses, income taxes, depreciation (on property, plant and equipment) and amortization (on intangibles and lease right-of-use assets). The Company believes that even though this item is not required by or presented in accordance with United States generally accepted accounting principles (GAAP), this additional measure enhances understanding of the Company’s performance and period to period comparability. The Company believes that this item should not be considered an alternative to net income determined under GAAP.

As a reminder, a conference call and Internet webcast is scheduled for 3:00 p.m. EDT on Tuesday, October 26, 2021 to review third quarter results. You can access the conference call live by dialing 1-888-506-0062 (domestic) or 1-973-528-0011 (international) and requesting the NewMarket conference call. To avoid delays, callers should dial in five minutes early. A teleconference replay of the call will be available until November 2, 2021 at 3:00 p.m. EDT by dialing 1-877-481-4010 (domestic) or 1-919-882-2331 (international). The replay passcode number is 43080. The call will also be broadcast via the Internet and can be accessed through the Company’s website at www.NewMarket.com or www.webcaster4.com/Webcast/Page/2001/43080. A webcast replay will be available for 30 days.

NewMarket Corporation, through its subsidiaries Afton Chemical Corporation and Ethyl Corporation, develops, manufactures, blends, and delivers chemical additives that enhance the performance of petroleum products. From custom-formulated additive packages to market-general additives, the NewMarket family of companies provides the world with the technology to make engines run smoother, machines last longer, and fuels burn cleaner.

Some of the information contained in this press release constitutes forward-looking statements within the meaning of the Private Securities Litigation Reform Act of 1995. Although NewMarket’s management believes its expectations are based on reasonable assumptions within the bounds of its knowledge of its business and operations, there can be no assurance that actual results will not differ materially from expectations.

Factors that could cause actual results to differ materially from expectations include, but are not limited to, the availability of raw materials and distribution systems; disruptions at production facilities, including single-sourced facilities; hazards common to chemical businesses; the ability to respond effectively to technological changes in our industry; failure to protect our intellectual property rights; sudden or sharp raw material price increases; competition from other manufacturers; current and future governmental regulations; the gain or loss of significant customers; failure to attract and retain a highly-qualified workforce; an information technology system failure or security breach; the occurrence or threat of extraordinary events, including natural disasters; terrorist attacks and health-related epidemics such as the COVID-19 pandemic; risks related to operating outside of the United States; political, economic, and regulatory factors concerning our products; the impact of substantial indebtedness on our operational and financial flexibility; the impact of fluctuations in foreign exchange rates; resolution of environmental liabilities or legal proceedings; limitation of our insurance coverage; our inability to realize expected benefits from investment in our infrastructure or from recent or future acquisitions, or our inability to successfully integrate recent or future acquisitions into our business; the underperformance of our pension assets resulting in additional cash contributions to our pension plans; and other factors detailed from time to time in the reports that NewMarket files with the Securities and Exchange Commission, including the risk factors in Item 1A. “Risk Factors” of our 2020 Annual Report on Form 10-K, which is available to shareholders upon request.

You should keep in mind that any forward-looking statement made by NewMarket in the foregoing discussion speaks only as of the date on which such forward-looking statement is made. New risks and uncertainties arise from time to time, and it is impossible for us to predict these events or how they may affect the Company. We have no duty to, and do not intend to, update or revise the forward-looking statements in this discussion after the date hereof, except as may be required by law. In light of these risks and uncertainties, you should keep in mind that the events described in any forward-looking statement made in this discussion, or elsewhere, might not occur.

NEWMARKET CORPORATION AND SUBSIDIARIES

SEGMENT RESULTS AND OTHER FINANCIAL INFORMATION

(In thousands, except per-share amounts, unaudited)


Third Quarter Ended

September 30,


Nine Months Ended

September 30,


2021


2020


2021


2020

Revenue:


Petroleum additives


$

619,070


$

510,280


$

1,770,555


$

1,476,355


All other


3,137


2,589


8,988


6,795


Total


$

622,207


$

512,869


$

1,779,543


$

1,483,150


Segment operating profit:


Petroleum additives


$

72,128


$

102,186


$

240,399


$

248,918


All other


(151

)


2,015


(798

)


1,951


Segment operating profit


71,977


104,201


239,601


250,869


Corporate unallocated expense


(8,731

)


(5,565

)


(16,591

)


(15,263

)

Interest and financing expenses


(9,345

)


(6,466

)


(24,557

)


(20,575

)

Other income (expense), net


7,252


25,448


19,128


39,933


Income before income tax expense


$

61,153


$

117,618


$

217,581


$

254,964


Net income


$

52,038


$

95,794


$

173,702


$

203,684


Earnings per share - basic and diluted


$

4.80


$

8.77


$

15.94


$

18.52


NEWMARKET CORPORATION AND SUBSIDIARIES

CONSOLIDATED STATEMENTS OF INCOME

(In thousands, except per-share amounts, unaudited)


Third Quarter Ended

September 30,


Nine Months Ended

September 30,


2021


2020


2021


2020

Net sales


$

622,207


$

512,869


$

1,779,543


$

1,483,150

Cost of goods sold


483,986


346,262


1,338,570


1,038,898

Gross profit


138,221


166,607


440,973


444,252

Selling, general, and administrative expenses


39,729


34,690


111,379


105,837

Research, development, and testing expenses


35,387


33,113


107,241


102,168

Operating profit


63,105


98,804


222,353


236,247

Interest and financing expenses, net


9,345


6,466


24,557


20,575

Other income (expense), net


7,393


25,280


19,785


39,292

Income before income tax expense


61,153


117,618


217,581


254,964

Income tax expense


9,115


21,824


43,879


51,280

Net income


$

52,038


$

95,794


$

173,702


$

203,684

Earnings per share - basic and diluted


$

4.80


$

8.77


$

15.94


$

18.52

Cash dividends declared per share


$

2.10


$

1.90


$

5.90


$

5.70

NEWMARKET CORPORATION AND SUBSIDIARIES

CONSOLIDATED BALANCE SHEETS

(In thousands except share amounts, unaudited)


September 30,

2021


December 31,

2020

ASSETS


Current assets:


Cash and cash equivalents


$

59,613


$

125,172


Marketable securities


378,902


0


Trade and other accounts receivable, less allowance for credit losses


414,847


336,395


Inventories


479,039


401,031


Prepaid expenses and other current assets


34,459


35,480


Total current assets


1,366,860


898,078


Property, plant, and equipment, net


677,481


665,147


Intangibles (net of amortization) and goodwill


128,125


129,944


Prepaid pension cost


139,760


137,069


Operating lease right-of-use assets


67,586


61,329


Deferred charges and other assets


57,404


42,308


Total assets


$

2,437,216


$

1,933,875


LIABILITIES AND SHAREHOLDERS' EQUITY


Current liabilities:


Accounts payable


$

250,658


$

189,937


Accrued expenses


86,677


78,422


Dividends payable


20,600


15,184


Income taxes payable


5,202


3,760


Operating lease liabilities


15,231


13,410


Other current liabilities


13,029


11,742


Total current liabilities


391,397


312,455


Long-term debt


991,919


598,848


Operating lease liabilities - noncurrent


52,319


48,324


Other noncurrent liabilities


228,808


214,424


Total liabilities


1,664,443


1,174,051


Shareholders' equity:


Common stock and paid-in capital (with no par value; issued and outstanding shares - 10,637,047 at September 30, 2021 and 10,921,377 at December 31, 2020)


0


717


Accumulated other comprehensive loss


(172,374

)


(173,164

)

Retained earnings


945,147


932,271


Total shareholders' equity


772,773


759,824


Total liabilities and shareholders' equity


$

2,437,216


$

1,933,875


NEWMARKET CORPORATION AND SUBSIDIARIES

SELECTED CONSOLIDATED CASH FLOW DATA

(In thousands, unaudited)


Nine Months Ended

September 30,


2021


2020

Net income


$

173,702


$

203,684


Depreciation and amortization


63,075


63,045


Unrealized (gain) loss on marketable securities


3,414


0


Cash pension and postretirement contributions


(7,820

)


(7,717

)

Working capital changes


(98,426

)


(33,493

)

Deferred income tax expense


6,205


5,405


Purchases of marketable securities


(391,429

)


0


Proceeds from sales and maturities of marketable securities


9,894


0


Capital expenditures


(64,025

)


(60,133

)

Issuance of 2.70% senior notes


395,052


0


Debt issuance costs


(3,897

)


(1,349

)

Net borrowings (repayments) under revolving credit facility


1,000


(34,678

)

Repurchases of common stock


(91,711

)


(101,434

)

Dividends paid


(64,116

)


(62,667

)

Proceeds from sale of land


0


20,000


Gain on sale of land


0


(16,483

)

All other


3,523


(876

)

Decrease in cash and cash equivalents


$

(65,559

)


$

(26,696

)

NEWMARKET CORPORATION AND SUBSIDIARIES

NON-GAAP FINANCIAL INFORMATION

(In thousands, unaudited)


Third Quarter Ended

September 30,


Nine Months Ended

September 30,


2021


2020


2021


2020

Net Income


$

52,038


$

95,794


$

173,702


$

203,684

Add:


Interest and financing expenses, net


9,345


6,466


24,557


20,575

Income tax expense


9,115


21,824


43,879


51,280

Depreciation and amortization


20,862


20,414


61,780


61,982

EBITDA


$

91,360


$

144,498


$

303,918


$

337,521


Contacts

FOR INVESTOR INFORMATION:
Brian D. Paliotti
Investor Relations
Phone: 804.788.5555
Fax: 804.788.5688
Email: This email address is being protected from spambots. You need JavaScript enabled to view it.

TULSA, Okla.--(BUSINESS WIRE)--Williams’ (NYSE: WMB) board of directors has approved a regular dividend of $0.41 per share, or $1.64 annualized, on the company’s common stock, payable on Dec. 27, 2021, to holders of record at the close of business on Dec. 10, 2021.


The dividend is consistent with the third-quarter 2021 dividend and is a 2.5% increase from Williams’ fourth-quarter 2020 quarterly dividend of $0.40 per share, paid in December 2020.

Some portion of this distribution may be considered a return of capital for tax purposes. Additional information regarding return of capital distributions is available at Williams’ investor relations website.

Williams has paid a common stock dividend every quarter since 1974.

About Williams

Williams (NYSE: WMB) is committed to being the leader in providing infrastructure that safely delivers natural gas products to reliably fuel the clean energy economy. Headquartered in Tulsa, Oklahoma, Williams is an industry-leading, investment grade C-Corp with operations across the natural gas value chain including gathering, processing, interstate transportation and storage of natural gas and natural gas liquids. With major positions in top U.S. supply basins, Williams connects the best supplies with the growing demand for clean energy. Williams owns and operates more than 30,000 miles of pipelines system wide – including Transco, the nation’s largest volume and fastest growing pipeline – and handles approximately 30 percent of the natural gas in the United States that is used every day for clean-power generation, heating and industrial use. www.williams.com

Portions of this document may constitute “forward-looking statements” as defined by federal law. Although the company believes any such statements are based on reasonable assumptions, there is no assurance that actual outcomes will not be materially different. Any such statements are made in reliance on the “safe harbor” protections provided under the Private Securities Reform Act of 1995. Additional information about issues that could lead to material changes in performance is contained in the company’s annual and quarterly reports filed with the Securities and Exchange Commission.


Contacts

MEDIA:
This email address is being protected from spambots. You need JavaScript enabled to view it.
(800) 945-8723

INVESTOR CONTACT:
Danilo Juvane
(918) 573-5075

TULSA, Okla.--(BUSINESS WIRE)--NGL Energy Partners LP (NYSE: NGL) announced today that NGL plans to issue its fiscal 2022 second quarter ended September 30, 2021, earnings press release post-market close on Tuesday, November 9, 2021. Members of NGL’s management team intend to host an earnings call following this release on Tuesday, November 9, 2021 at 4:00 pm CST to discuss its financial results. Analysts, investors, and other interested parties may join the webcast via the event link: https://www.webcaster4.com/Webcast/Page/2808/43431 or by dialing (888) 506-0062 and providing access code: 646174. An archived audio replay of the call will be available for 14 days, which can be accessed by dialing (877) 481-4010 and providing replay passcode 43431.


Forward Looking Statements

This press release includes “forward-looking statements.” All statements other than statements of historical facts included or incorporated herein may constitute forward-looking statements. Actual results could vary significantly from those expressed or implied in such statements and are subject to a number of risks and uncertainties. While NGL believes such forward-looking statements are reasonable, NGL cannot assure they will prove to be correct. The forward-looking statements involve risks and uncertainties that affect operations, financial performance, and other factors as discussed in filings with the Securities and Exchange Commission. Other factors that could impact any forward-looking statements are those risks described in NGL’s annual report on Form 10-K, quarterly reports on Form 10-Q, and other public filings. You are urged to carefully review and consider the cautionary statements and other disclosures made in those filings, specifically those under the heading “Risk Factors.” NGL undertakes no obligation to publicly update or revise any forward-looking statements except as required by law.

About NGL Energy Partners LP

NGL Energy Partners LP, a Delaware limited partnership is a diversified midstream energy company that transports, stores, markets and provides other logistics services for crude oil, natural gas liquids and other products and transports, treats and disposes of produced water generated as part of the oil and natural gas production process. For further information, visit the Partnership’s website at www.nglenergypartners.com.

This release is a qualified notice under Treasury Regulation Section 1.1446-4(b). Brokers and nominees should treat 100% of NGL Energy Partner LP’s distributions to foreign investors as being attributable to income that is effectively connected with a United States trade or business. Therefore, distributions to foreign investors are subject to federal income tax withholding at the highest applicable effective tax rate.


Contacts

NGL Energy Partners LP
Linda J. Bridges, 918.481.1119
Executive Vice President, Chief Financial Officer and Treasurer
This email address is being protected from spambots. You need JavaScript enabled to view it.
or
David Sullivan, 918.481.1119
Vice President – Finance
This email address is being protected from spambots. You need JavaScript enabled to view it.

HOUSTON--(BUSINESS WIRE)--#batterystorage--Consolidated Asset Management Services (CAMS), an industry leading asset management and operations and maintenance (O&M) services provider, announced today that it has been awarded two contracts by Broad Reach Power (Broad Reach) to provide O&M services at two battery energy storage sites.


Located in Texas, the projects CAMS will support include 100 megawatts (MW) at Bat Cave Energy Storage in Mason County and an additional 100 MW at North Fork Energy Storage in Williamson County.

The addition of the projects solidifies CAMS as one of the largest third-party battery O&M providers in the country, now delivering O&M at 12 sites totaling 300 MW.

“We are excited to expand our partnership with Broad Reach by supporting Bat Cave and North Fork which are among the most advanced and largest energy storage projects in North America,” said Brian Ivany, Co-President of CAMS Renewable Services. “These projects will provide greater reliability to the grid which continues to experience increased volatility from renewable penetration and severe weather events.”

CAMS was named the O&M operator following a competitive bidding process.

“This partnership is a fantastic recognition of the strength of CAMS’ service offering and further grows our renewables footprint,” said Rick Knauth, Co-President of CAMS Renewable Services. “It also supports our commitment to the transition of energy generation toward renewable sources and ESG-focused business practices.”

“As our Broad Reach portfolio of standalone energy storage assets continues to grow in megawatt scale, we look forward to furthering our relationship with CAMS to support the operational performance, reliability and safety of our critical infrastructure,” said Doug Moorehead, Managing Partner & Chief Technology Officer of Broad Reach Power.

About CAMS

CAMS is a privately held company providing Operations and Maintenance (O&M), Asset Management, Environmental, Social, and Governance (ESG), and Optimization services for energy and infrastructure assets. We add value through superior management and operation of our clients’ assets located throughout the U.S. and internationally. To this end, we empower our employees to pursue creative and sustainable business practices in the field and at our corporate office that contribute to operational excellence, financial performance, a safe workplace, and a better community and environment. For additional information, visit www.camstex.com.

About Broad Reach Power

Broad Reach Power is the leading utility-scale storage independent power producer in the United States. Based in Houston, Broad Reach Power is backed by leading energy investors EnCap Investments L.P., Yorktown Partners and Mercuria Energy. The company owns a 13-gigawatt portfolio of utility-scale solar and energy storage power projects in Montana, California, Wyoming, Utah and Texas which give utilities, generators and customers access to technological insight and tools for managing merchant power risk so they can better match supply and demand. Broad Reach is led by a team comprised of solar, wind and storage experts who have delivered more than four gigawatts of projects and have a combined 80 years of experience in the field. For more information about the company, visit http://www.broadreachpower.com.


Contacts

Corporate Communications
Deanna Werner
Consolidated Asset Management Services
713.358.9736 | This email address is being protected from spambots. You need JavaScript enabled to view it.

  • Petroteq shareholders to receive C$0.74 in cash per common share
  • Offer represents a premium of 279% over the most recent TSX-V closing price and a 1,032% premium over the TSX-V volume weighted average price for the 52 weeks preceding the German purchase offer announced in April
  • All-cash Offer provides full and certain value and liquidity for all shareholders
  • Offer enables shareholders to avoid significant risks with the status quo

TORONTO--(BUSINESS WIRE)--Viston United Swiss AG (“Viston”) and its indirect, wholly-owned subsidiary, 2869889 Ontario Inc. (the “Offeror”) today announced that the Offeror has commenced a formal offer (the “Offer”) to acquire all of the issued and outstanding common shares (the “Common Shares”) of Petroteq Energy Inc. (“Petroteq”) (TSX-V:PQE; OTC:PQEFF; FSE:PQCF). All financial information in this news release is presented Canadian dollars.

The Offer to Purchase and Circular (the “Offer to Purchase and Circular”) and related documents were mailed to Petroteq shareholders (“Shareholders”) on October 25, 2021 and the Offer commenced the same day. The Offer to Purchase and Circular have been filed with the Canadian securities regulators on SEDAR under Petroteq’s profile at www.sedar.com and with the United States Securities and Exchange Commission at www.sec.gov.

Under the terms of the Offer, Shareholders will receive C$0.74 in cash for each Common Share. The Offer represents a significant premium of approximately 279% based on the closing price of C$0.195 per Common Share on the TSX-V on August 6, 2021, being the last trading day prior to the issuance of a cease trade order by the Ontario Securities Commission (“OSC”) at which time the TSX-V halted trading in the Common Shares. The Offer also represents a premium of approximately 1,032% to the volume weighted average trading price of C$0.065 per Common Share on the TSX-V for the 52-weeks preceding the German voluntary public purchase offer in April. The Offer is open for acceptance until 5:00 p.m. (Toronto time) on February 7, 2022, unless the Offer is extended, accelerated or withdrawn by the Offeror in accordance with its terms.

Benefits of the Offer

The Offeror believes that the Offer is compelling, and represents a clearly superior alternative to continuing on the course set by the current Petroteq board of directors and management team, for reasons that include the following:

  • Premium to market price. The Offer represents a significant premium of 279.49% based on the closing price of C$0.195 per Common Share on the TSX-V on August 6, 2021 (the last trading day prior to the announcement by Petroteq of the cease trade order issued by the OSC at which time the TSX-V halted trading in the Common Shares. The Offer also represents a premium of 1,031.75% to the volume weighted average trading price of C$0.065 per Common Share on the TSX-V for the 52-week period prior to April 15 2021 (the last trading day prior to the publication of a voluntary public purchase offer in the German Federal Gazette).
  • Liquidity and certainty of value. The Offer provides 100% cash consideration for the Common Shares, giving Shareholders certainty of value and immediate liquidity in the face of volatile markets and against a backdrop of historically poor performance of Petroteq shares.
  • The status quo leaves Shareholders with considerable risk. If the Offer is not successful and no competing transaction is made, the Offeror believes it is likely the trading price of the Common Shares will decline to significantly lower levels. Petroteq has never been profitable and currently has limited cash to fund capital projects and debt obligations.
  • Project execution and development risk. The Offeror believes that the Offer provides Shareholders with the value inherent in Petroteq’s portfolio of projects, including the oil extraction plant, without the long-term risks associated with the development and execution of those projects.
  • The Petroteq board and management team have driven a significant destruction of shareholder value. The current leadership team has demonstrated an inability to increase earnings or achieve profitability, having accumulated losses of US$97 million since inception, a working capital deficit of US$13 million and nearly US$20 million of total debt. There is a risk of significant dilution to Shareholders, given that, as of May 31, 2021, outstanding options, warrants and convertible debentures were exercisable for/convertible into a total of 207,360,625 Common Shares, and that Petroteq has disclosed that it intends to issue further convertible securities and Common Shares in order to finance its operations and developments. Further issuance of Common Shares in this way will have a dilutive effect on the percentage ownership held by holders of its Common Shares. Viston believes this is a direct result of several poor strategic capital allocation decisions.

These and other benefits of the Offer to Shareholders are described in more detail in the Offer to Purchase and Circular.

Through its representatives, Viston made attempts to engage in discussions with the Petroteq Board, including an initial outreach through counsel on July 22, 2021, followed by the sharing of proof of funds for the Amended German Offer on August 24, 2021, and the entering into of a confidentiality agreement effective September 17, 2021, which disclosed Viston’s identity. In light of the significant premium being offered for the Common Shares, the Offeror expected that the Petroteq Board would accept Viston’s invitation to negotiate with a view to delivering value to its Shareholders but no progress was made.

Offer Details

The Offer is subject to specified conditions being satisfied or waived by the Offeror. These conditions include, without limitation: at least 50% +1 of the outstanding Common Shares on a fully diluted basis being validly deposited under the Offer and not withdrawn; the Offeror having determined, in its reasonable judgment, that no Material Adverse Effect exists; and receipt of all necessary regulatory approvals.

The Offer is not subject to a financing condition. The Offeror intends to fund the Offer from cash resources available to Viston, who has secured, on a firm, committed basis, up to EUR 420 million to fund the consideration payable for the Common Shares and to complete the transaction.

All cash payments under the Offer will be made in Canadian dollars; however, a Shareholder can elect to receive payment in U.S. dollars by checking the appropriate box in the Letter of Transmittal.

The Offeror encourages Shareholders to read the full details of the Offer set forth in the Offer to Purchase and Circular, which contains the full terms and conditions of the Offer and other important information, as well as detailed instructions on how Shareholders can tender their Common Shares to the Offer.

For More Information and How to Tender Shares to the Offer

Shareholders who hold Common Shares through a broker or intermediary should promptly contact them directly and provide their instructions to tender to the Offer, including any U.S. dollar currency election. Taking no action and not accepting the Offer comes with significant risks of shareholder dilution and constrained share prices. The deadline for Shareholders to tender their shares is February 7, 2022.

For assistance or to ask any questions, Shareholders should visit www.petroteqoffer.com or contact Kingsdale Advisors, the Information Agent and Depositary in connection with the Offer, within North America toll-free at 1-866-581-1024, outside North America at 1-416-867-2272 or by e-mail at This email address is being protected from spambots. You need JavaScript enabled to view it..

Advisors

The Offeror has engaged Gowling WLG (Canada) LLP (“Gowling”) to advise on certain Canadian legal matters and Dorsey & Whitney LLP to advise on certain U.S. legal matters. Kingsdale Advisors is acting as Information Agent and Depositary.

About the Offeror

The Offeror is an indirect, wholly-owned subsidiary of Viston, a Swiss company limited by shares (AG) established in 2008 under the laws of Switzerland. The Offeror was established on September 28, 2021 under the laws of the Province of Ontario. The Offeror’s registered office is located at 100 King Street West, Suite 1600, 1 First Canadian Place, Toronto, Ontario, Canada M5X 1G5. The registered and head office of Viston is located at Haggenstreet 9, 9014 St. Gallen, Switzerland.

Viston was created to invest in renewable energies and clean technologies, as well as in the environmental protection industry. Viston aims to foster innovative technologies, environmentally-friendly and clean fossil fuels and to help shape the future of energy. Since October 2008, Viston has undertaken its research, development and transfer initiatives in Saint Gallen, Switzerland. Viston has been working to optimize and adapt these technologies to current market requirements to create well-engineered products. Viston’s work also includes the determination of technical and economic risks, as well as the search for financing opportunities.

Caution Regarding Forward-Looking Statements

Certain statements contained in this news release contain “forward-looking information” and are prospective in nature. Forward-looking information is not based on historical facts, but rather on current expectations and projections about future events, and are therefore subject to risks and uncertainties that could cause actual results to differ materially from the future results expressed or implied by the forward-looking information. Often, but not always, forward-looking information can be identified by the use of forward-looking words such as “plans”, “expects”, “intends”, “anticipates”, or variations of such words and phrases or statements that certain actions, events or results “may”, “could”, “should”, “would”, “might” or “will” be taken, occur or be achieved. Forward-looking information contained in this news release includes, but is not limited to, statements relating to the following items: expectations relating to the Offer and information concerning the Offeror’s plans for Petroteq in the event the Offer is successful; the satisfaction or waiver of the conditions to consummate the Offer; the benefits of the Offer; the results, effects and timing of the Offer and completion of any Compulsory Acquisition or Subsequent Acquisition Transaction; expectations regarding the availability of financing and the Offeror’s plans for any refinancing transactions; expectations that there is a low likelihood of a competing offer and the likelihood that the price of the Common Shares will decline back to pre-Offer levels if the Offer is not successful; expectations regarding the process for obtaining regulatory approvals; the tax treatment of Shareholders; intentions to delist the Common Shares and to cause Petroteq to cease to be a reporting issuer and to cease to have public reporting obligations in any jurisdiction where it currently has such obligations, if permitted under applicable Law; and the completion of a Compulsory Acquisition or a Subsequent Acquisition Transaction.

Although the Offeror and Viston believe that the expectations reflected in such forward-looking information are reasonable, such statements involve risks and uncertainties, and undue reliance should not be placed on such statements. Certain material factors or assumptions are applied in making forward-looking information, and actual results may differ materially from those expressed or implied in such statements. Important factors that could cause actual results, performance or achievements of the Offeror or the completion of the Offer to differ materially from any future results, performance or achievements expressed or implied by such forward-looking information include, among other things, the ultimate outcome of any possible transaction between Viston and Petroteq, including the possibility that Petroteq will not accept a transaction with Viston or enter into discussions regarding a possible transaction, actions taken by Petroteq, actions taken by security holders of Petroteq in respect of the Offer, that the conditions of the Offer may not be satisfied or waived by Viston at the expiry of the Offer period, the ability of the Offeror to acquire 100% of the Common Shares through the Offer, the ability to obtain regulatory approvals and meet other closing conditions to any possible transaction, including any necessary shareholder approvals, potential adverse reactions or changes to business relationships resulting from the announcement, pendency or completion of the Offer transaction or any subsequent transaction, competitive responses to the announcement or completion of the Offer, unexpected costs, liabilities, charges or expenses resulting from the proposed transaction, exchange rate risk related to the financing arrangements, litigation relating to the proposed transaction, the inability to engage or retain key personnel, any changes in general economic and/or industry-specific conditions, industry risk, risks inherent in the running of the business of the Offeror or its affiliates, legislative or regulatory changes, Petroteq’s structure and its tax treatment, competition in the oil & gas industry, obtaining necessary approvals, financial leverage for additional funding requirements, capital requirements for growth, interest rates, dependence on skilled staff, labour disruptions, geographical concentration, credit risk, liquidity risk, changes in capital or securities markets and that there are no inaccuracies or material omissions in Petroteq’s publicly available information, and that Petroteq has not disclosed events which may have occurred or which may affect the significance or accuracy of such information. These are not necessarily all of the important factors that could cause actual results to differ materially from those expressed in any of the Offeror’s forward-looking information. Other unknown and unpredictable factors could also impact its results. Many of these risks and uncertainties relate to factors beyond the Offeror’s ability to control or estimate precisely. Consequently, there can be no assurance that the actual results or developments anticipated by the Offeror will be realized or, even if substantially realized, that they will have the expected consequences for, or effects on, the Offeror, its future results and performance.

Forward-looking information in this news release is based on the Offeror and Viston’s beliefs and opinions at the time the information is given, and there should be no expectation that this forward-looking information will be updated or supplemented as a result of new information, estimates or opinions, future events or results or otherwise, and each of the Offeror and Viston disavows and disclaims any obligation to do so except as required by applicable Law. Nothing contained herein shall be deemed to be a forecast, projection or estimate of the future financial performance of the Offeror or any of its affiliates or Petroteq.

Unless otherwise indicated, the information concerning Petroteq contained herein has been taken from or is based upon Petroteq’s and other publicly available documents and records on file with the Securities Regulatory Authorities and other public sources at the time of the Offer. Although the Offeror and Viston have no knowledge that would indicate that any statements contained herein relating to Petroteq, taken from or based on such documents and records are untrue or incomplete, neither the Offeror, Viston nor any of their respective officers or directors assumes any responsibility for the accuracy or completeness of such information, or for any failure by Petroteq to disclose events or facts that may have occurred or which may affect the significance or accuracy of any such information, but which are unknown to the Offeror and Viston.

Additional Information

This news release relates to a tender offer which Viston, through the Offeror, has made to Shareholders. The Offer is being made pursuant to a tender offer statement on Schedule TO (including the Offer to Purchase and Circular, the letter of transmittal and other related offer documents) filed by Viston on October 25, 2021. These materials, as may be amended from time to time, contain important information, including the terms and conditions of the Offer. Subject to future developments, Viston (and, if applicable, Petroteq) may file additional documents with the Securities and Exchange Commission (the “SEC”). This press release is not a substitute for any tender offer statement, recommendation statement or other document Viston and/or Petroteq may file with the SEC in connection with the proposed transaction.

This communication does not constitute an offer to buy or solicitation of an offer to sell any securities. Investors and security holders of Petroteq are urged to read the tender offer statement (including the Offer to Purchase and Circular, the letter of transmittal and other related offer documents) and any other documents filed with the SEC carefully in their entirety if and when they become available as they will contain important information about the proposed transaction. Any investors and security holders may obtain free copies of these documents (if and when available) and other documents filed with the SEC by Viston through the web site maintained by the SEC at www.sec.gov or by contacting Kingsdale Advisors, the Information Agent and Depositary in connection with the offer, within North America toll-free at 1-866-581-1024, outside North America at 1-416-867-2272 or by e-mail at This email address is being protected from spambots. You need JavaScript enabled to view it..


Contacts

For More Information

Media inquiries:

Ian Robertson
President, Canada
Kingsdale Advisors
Direct: 416-867-2333
Cell: 647-621-2646
This email address is being protected from spambots. You need JavaScript enabled to view it.

For assistance in depositing Petroteq Common Shares to the Offer, please contact:

Kingsdale Advisors
130 King Street West, Suite 2950
Toronto, ON M5X 1E2
North American Toll Free: 1-866-581-1024
Outside North America: 1-416-867-2272
Email: This email address is being protected from spambots. You need JavaScript enabled to view it.
www.petroteqoffer.com

With the acquisition of Marina di Portisco – IGY’s global network now spans 22 marinas across 13 countries and enhances the company’s ability to offer unique benefits to superyachts that directly support owners, agents, management companies, charter operators, shipyards, captains and crew.

SARDINIA, Italy--(BUSINESS WIRE)--Island Global Yachting (IGY Marinas), the world’s only global superyacht marina company, and Transport S.A.S., a leading Sardinian business conglomerate, have acquired the long-term concession rights to Marina di Portisco. The marina, re-branded IGY Portisco Marina, is located in the popular cruising waters of Sardinia’s northeast coast, boasting 589 berths with 41 superyacht berths and the ability to accommodate vessels up to 90 meters (295′).


"Each new IGY marina addition is carefully selected to bring the highest value to our global yachting clients. We are absolutely delighted to further promote Italy as a leading yachting destination through the addition of Marina di Portisco to the IGY portfolio,” says Kenny Jones, IGY’s EVP of Operations. “Aligned with IGY’s continued global growth strategy, our comprehensive services and uniquely packaged dockage products make all aspects of global yachting easier and more efficient for the owner and the amazing people in the superyacht industry.”

“IGY has the largest and most diverse superyacht berth inventory in the world. IGY Portisco Marina adds further depth to our inventory and to the services we offer IGY’s global clientele including dockage, crew, and yacht management services. We intend to introduce an innovative suite of global solutions for our clients in the months to come,” comments Tom Mukamal, CEO of IGY Marinas.

IGY Portisco Marina is beautifully situated between Porto Cervo and Olbia, in the Gulf of Cugnana. Protected by a natural setting and long outer breakwater, and with an exceptionally deep draft of 10 meters (32.8’), it is one of the few ports in the region capable of accommodating the world’s largest superyachts. The marina’s customer-centric layout features on-site services, shops and restaurants, a refit facility, yacht provisioning, 24-hour security, and a convenient fuel service managed by Transport S.A.S.

“We are very happy to strengthen our position in IGY Portisco Marina alongside IGY. With over 15 years’ experience in fuel management services, our team is confident that the joint efforts, skills, and capabilities of IGY and the Taula group will enhance the customer experience to new levels,” states Vittorio Taula, CEO of Transport S.A.S.

IGY was advised by Morri Rossetti e Associati and Transport S.A.S. was advised by Ashurst LLP. IGY and Transport were also advised by Sistema Iniziative Locali SpA (Sinloc).

IGY Portisco Marina sits in the heart of one of the most stunning and popular yachting destinations in the world. Sardinia offers luxurious beaches, world-class dining, splendid culture and much more. IGY Portisco Marina is the ideal starting point for exploring Sardinia and is conveniently located 20 minutes from Olbia Costa Smeralda Airport.


Contacts

Kay Mellinger
This email address is being protected from spambots. You need JavaScript enabled to view it.

PLANO, Texas--(BUSINESS WIRE)--#blueoil--Denbury Onshore, LLC (“Denbury”), a subsidiary of Denbury Inc. (NYSE: DEN) (collectively “Denbury”) and Mitsui E&P USA LLC (“MEPUSA”), a subsidiary of Mitsui & Co., Ltd (“Mitsui”), announce they have commenced a joint evaluation of potential opportunities in the U.S. Gulf Coast to develop carbon-negative oil assets utilizing anthropogenic CO2 via Carbon Capture, Utilization, and Storage (“CCUS”). As part of the evaluation, MEPUSA and Denbury seek to jointly pursue CO2 offtake opportunities from Mitsui’s potential projects along the U.S. Gulf Coast. MEPUSA will also identify international CCUS opportunities in which Denbury and MEPUSA could further collaborate.


Chris Kendall, Denbury’s President and Chief Executive Officer, commented, “We are very pleased to have reached this agreement with Mitsui, which further highlights our strategy of creating significant shareholder value through our CCUS leadership. We look forward to working collaboratively with the great team at Mitsui to identify and execute impactful CCUS projects.”

Toru Matsui, Chief Operating Officer of Mitsui’s Energy Business Unit, said, “We are pleased to begin this exciting and impactful partnership with Denbury. Through this joint evaluation, we hope to deepen our relationship with Denbury to further develop our CCUS value chain in the U.S. Through our involvement in developing CCUS projects globally, Mitsui aims to achieve net-zero carbon emissions and create a sustainable and eco-friendly society.”

ABOUT DENBURY

Denbury is an independent energy company with operations and assets focused on Carbon Capture, Use and Storage (CCUS) and Enhanced Oil Recovery (EOR) in the Gulf Coast and Rocky Mountain regions. For over two decades, the Company has maintained a unique strategic focus on utilizing CO2 in its EOR operations and since 2013 has been active in CCUS through the injection of captured industrial-sourced CO2. The Company currently injects over three million tons of captured industrial-sourced CO2 annually, and its objective is to fully offset its Scope 1, 2, and 3 CO2 emissions within this decade, primarily through increasing the amount of captured industrial-sourced CO2 used in its operations. For more information about Denbury, visit www.denbury.com.

Follow us on Twitter and Linkedin.

ABOUT MITSUI & CO

Mitsui & Co., Ltd. (8031: JP) is a global trading and investment company with a diversified business portfolio that spans approximately 64 countries in Asia, Europe, North, Central & South America, The Middle East, Africa and Oceania.

Mitsui has over 5,600 employees and deploys talent around the globe to identify, develop, and grow businesses in collaboration with a global network of trusted partners. Mitsui has built a strong and diverse core business portfolio covering the Mineral and Metal Resources, Energy, Machinery and Infrastructure, and Chemicals industries.

Leveraging its strengths, Mitsui has further diversified beyond its core profit pillars to create multifaceted value in new areas, including innovative Energy Solutions, Healthcare & Nutrition and through a strategic focus on high-growth Asian markets. This strategy aims to derive growth opportunities by harnessing some of the world’s main mega-trends: sustainability, health & wellness, digitalization and the growing power of the consumer.

For more information on Mitsui & Co’s businesses visit http://www.mitsui.com/jp/en/.

This press release contains forward-looking statements that involve risks and uncertainties, including Denbury and Mitsui developing, documenting, building and commencing operations of carbon-negative projects and facilities. Achievement of these milestones are subject to a wide range of business risks, and there is no assurance that these goals can or will be met. These forward-looking statements represent the parties’ expectations only as of today and should not be relied upon as representing its estimates as of any future date. The parties assume no obligation to update these forward-looking statements.


Contacts

Brad Whitmarsh, Executive Director, Investor Relations, 972.673.2020, This email address is being protected from spambots. You need JavaScript enabled to view it.
Susan James, Manager, Investor Relations, 972.673.2593, This email address is being protected from spambots. You need JavaScript enabled to view it.

Offshore Source Logo

Offshore Source keeps you updated with relevant information concerning the Offshore Energy Sector.

Any views or opinions represented on this website belong solely to the author and do not represent those of the people, institutions or organizations that Offshore Source or collaborators may or may not have been associated with in a professional or personal capacity, unless explicitly stated.

Corporate Offices

Technology Systems Corporation
8502 SW Kansas Ave
Stuart, FL 34997

info@tscpublishing.com