Business Wire News

~Company advances clean energy program with the installation of solar array and linear generators in California’s Inland Empire~

~Partnering with PowerFlex and Mainspring Energy, Lineage’s Colton Agua Mansa facility installs two linear generators, and among the first of its kind to integrate a linear generator with solar panels~

~This announcement is part of Lineage’s broader energy reduction strategy through which the Company commits to achieving net-zero carbon emissions by 2040~

NOVI, Mich.--(BUSINESS WIRE)--#onelineage--Lineage Logistics, LLC, the world’s largest and most innovative temperature-controlled industrial REIT and logistics solutions provider, today announced the installation of groundbreaking clean energy advancements at its facility in Colton, CA to establish the first facility in the Lineage network to generate 100% of its energy consumption on-site.


This announcement comes in tandem with Lineage’s commitment to becoming net-zero carbon by 2040 as a signatory of The Climate Pledge, representing the Company’s industry-leading charge for a more sustainable cold chain.

Aligned with President Biden’s announcement on October 13, 2021 to invest in a secure and sustainable supply chain in the United States, Lineage has installed a 3.3MW solar array and 460kW of linear generators at its Colton Agua Mansa facility in California’s Inland Empire that, combined, will produce 100% of the facility’s energy consumption on a net basis. These advancements are indicative of Lineage’s continued prioritization of energy reduction, which started with the introduction of the Company’s responsible energy reduction roadmap in 2015.

“Lineage always strives to be responsible leaders in the communities where we live and work, and our commitment to advancing the future of renewable energy at our locations is no exception,” said Chris Thurston, head of renewable energy projects for Lineage. “Lineage is already a model for the industry with our innovative development and deployment of industry-leading technologies. Responsibly creating our own energy is an important sustainability milestone, and I am excited to see how this achievement further inspires our commitment to carbon neutrality by 2040.”

Lineage partnered with PowerFlex, a national provider of renewable energy infrastructure, to install the rooftop solar array in Colton – the second largest solar array in the Company’s leading global network of temperature-controlled warehouses. The facility has 8,426 individual solar panels that will generate an estimated 5.4 million kilowatt-hours (kWh) of clean energy annually. The Colton array is one of several onsite solar installations that PowerFlex is supporting across Lineage’s distribution centers in the United States.

“As Lineage’s long-term partner in renewable energy, we are incredibly proud to share and help execute their bold vision for impactful solar solutions across their extensive network,” said PowerFlex Director Danny Ptak. “The onsite solar project in Colton demonstrates Lineage’s ongoing commitment to deploying innovative solutions to ensure that its operations are as sustainable as humanly possible.”

The onsite linear generators, a new technology launched in March by Mainspring Energy, create electricity using a low-temperature reaction of fuel and air. Distinct from an engine or fuel cell, a linear generator directly converts motion into electricity using chemical or thermal energy. The units ramp up and down usage to enable maximum use of the building’s solar array, ensuring reliability and optimal use of renewable power at all times. This increases the site’s resiliency by reducing grid dependency and lowers operating costs. Lineage’s Colton location is the first facility in the world with two linear generators, and the first of its kind to integrate a linear generator with solar panels. The two generators were installed in October.

“Commercial and industrial buildings account for more than a third of electricity usage in the United States and play an essential role in the energy transition,” said Mainspring CEO Shannon Miller. “Mainspring designed the linear generator to accelerate this transition by delivering resilient, sustainable, and affordable generation that is also ideal for pairing with solar and other renewables. We are proud to partner with Lineage, an industry leader and pioneer in deploying innovative energy technologies.”

In December 2020, Lineage’s increased its commitment to energy reduction by implementing new and innovative technologies. In 2021, Lineage was recognized by the United States Department of Energy for Outstanding Accomplishments in Energy Efficiency for the third year in a row and the Department of Energy’s Better Plants Challenge with a commitment to reduce energy intensity by 25% by 2024.

About Lineage Logistics

Lineage Logistics is the world’s largest temperature-controlled industrial REIT and logistics solutions provider. It has a global network of over 400 strategically located facilities totaling over 2 billion cubic feet of capacity which spans 19 countries across North America, Europe and Asia-Pacific. Lineage’s industry-leading expertise in end-to-end logistical solutions, its unrivaled real estate network, and development and deployment of innovative technology help increase distribution efficiency, advance sustainability, minimize supply chain waste, and most importantly, as a Visionary Partner of Feeding America, help feed the world. In recognition of the company’s leading innovations and sustainability initiatives, Lineage was listed as No. 17 in the 2021 CNBC Disruptor 50 list, the No 1. Data Science company, and 23rd overall, on Fast Company’s 2019 list of The World’s Most Innovative Companies, in addition to being included on Fortune’s Change The World list in 2020. (www.lineagelogistics.com)

About PowerFlex

PowerFlex delivers commercial and industrial customers a full range of turnkey clean energy solutions: solar, storage, smart EV charging, microgrids, and energy management systems. The Company was founded in 2017 by a Caltech research group who developed a patented Adaptive Load Management (ALM) technology to optimize power consumption across a large network of charging stations. PowerFlex Systems was acquired by EDF Renewables North America in 2019, and consolidated with EnterSolar, a leading commercial solar developer, in 2021 to expand its onsite solar offerings. For more information, visit www.powerflex.com.

About Mainspring Energy

Driven by its vision of the affordable, reliable, net-zero carbon grid of the future, Mainspring is delivering a new category of power generation — the linear generator — that delivers onsite, dispatchable, fuel-flexible power at low cost. Based in Menlo Park, Calif., Mainspring is backed by top-tier venture, strategic, and financial investors. www.mainspringenergy.com.


Contacts

Lineage Logistics
Megan Hendricksen
949.247.5172
This email address is being protected from spambots. You need JavaScript enabled to view it.

AMES, Iowa--(BUSINESS WIRE)--$REGI #REGI--Renewable Energy Group, Inc. (NASDAQ: REGI) announced today that two new Board members have been appointed to the company’s Board of Directors.


Joining the Board are Mr. Dylan Glenn, Senior Executive at Eldridge Industries, and Ms. Niharika Taskar Ramdev, a former General Motors Executive. Both were appointed at the company’s November 9th board meeting.

“We are thrilled to add Dylan and Niharika to our board. As the company advances its growth strategy, diversifying our board will continue to guide the company’s mission of delivering sustainable solutions and leading the way in the energy transition,” said Jeff Stroburg, Chairman of the Board. “Dylan and Niharika both bring impressive backgrounds and relative experience to REG’s areas of growth.”

Dylan Glenn is a senior executive at Eldridge Industries, a diversified holding company based in Greenwich, Connecticut. Prior to joining Eldridge, Mr. Glenn was CEO of KBBO Americas, LP, a U.S.-based investment vehicle for the KBBO Group, headquartered in the United Arab Emirates. Prior to KBBO Americas LP, Mr. Glenn was Senior Managing Director of Guggenheim Partners, where he joined in 2005. Glenn also has experience in the government and regulatory space, serving as Deputy Chief of Staff to Governor Sonny Perdue of Georgia and Special Assistant for Economic Policy to the President in the White House of George W. Bush.

Niharika Taskar Ramdev is a seasoned finance executive with global experience and has worked in the United States, India, China and Singapore. Ms. Ramdev held senior positions at General Motors for over twenty years. Her experience includes having served as Chief Financial Officer of the Global Cadillac division from 2018 to 2019, Chief Financial Officer of General Motors International from 2015 to 2018, Vice President of Finance and Treasurer from 2014 to 2015 and Chief Financial Officer for Global Purchasing and Supply Chain from 2011 to 2014.

Glenn will serve as a Class II Director and his term will expire at the company’s 2022 annual meeting. Ramdev will serve as a Class III Director and her term will expire at the company’s 2023 annual meeting.

About Renewable Energy Group

Renewable Energy Group, Inc. is leading the energy and transportation industries’ transition to sustainability by converting renewable resources into high-quality, sustainable fuels. Renewable Energy Group is an international producer of sustainable fuels that significantly lower greenhouse gas emissions to immediately reduce carbon impact. Renewable Energy Group utilizes a global integrated procurement, distribution and logistics network to operate 12 biorefineries in the U.S. and Europe. In 2020, Renewable Energy Group produced 519 million gallons of cleaner fuel delivering 4.2 million metric tons of carbon reduction. Renewable Energy Group is meeting the growing global demand for lower-carbon fuels and leading the way to a more sustainable future.

Note Regarding Forward-Looking Statements

This press release contains certain forward-looking statements within the meaning of the Private Securities Litigation Reform Act of 1995, as amended, including statements regarding the company advancing its growth strategy, its mission and its ability to lead the way in the energy transition. These forward-looking statements are based on current expectations, estimates, assumptions and projections that are subject to change, and actual results may differ materially from the forward-looking statements. Factors that could cause actual results to differ materially include, but are not limited to, the company’s ability to successfully execute its strategy and other risks and uncertainties described in REG’s annual report on Form 10-K for the year ended December 31, 2020 and subsequently filed Form 10-Q and other periodic filings with the Securities and Exchange Commission. All forward-looking statements are made as of the date of this press release and REG does not undertake to update any forward-looking statements based on new developments or changes in our expectations.


Contacts

Media Contact for Renewable Energy Group:
Katie Stanley
This email address is being protected from spambots. You need JavaScript enabled to view it.

Investor Relations Contact for Renewable Energy Group:
Todd Robinson
This email address is being protected from spambots. You need JavaScript enabled to view it.

- Energy management, emission reduction, sustainability and air quality solutions driving record growth -

TORONTO--(BUSINESS WIRE)--Kontrol Technologies Corp. (NEO:KNR) (OTCQB:KNRLF) (FSE:1K8) ("Kontrol" or the "Company"), a leader in smart building technologies, announces that it continues to scale its technology and solutions as it surpasses 400 customer buildings and is set to double its market share in 2022. Accelerating energy costs, GHG emission penalties, stakeholder activism demanding more robust sustainability initiatives and the need for healthy buildings is driving record growth in the Company’s operating platform.


“The commercial, multi-residential and industrial building sectors are facing severe challenges with rising energy costs and the shift by Governments to penalize excessive GHG emissions,” said Paul Ghezzi, CEO of Kontrol Technologies. “In addition, shareholder activism is demanding that large real estate asset managers, owners and operators take immediate action to reduce emissions across their building portfolios. All of these factors are creating tailwinds in our business across our energy, emissions and air quality technology and service offerings.”

The Company has previously announced preliminary record revenues for Q3, 2021 of at least $18 Million (see press release dated October 13th, 2021). Final results for Q3 will be presented on November 15th.

Including the recent acquisition of Global HVAC and Automation (“Global”), the Company has previously announced a record order book of $160 Million. Based on its current order book and the new opportunities across its operating platform, Kontrol anticipates that it will double its customer building footprint in 2022 to 800 buildings. This is an internal management estimate based on the existing confirmed order book, the current quoting activity and the Company’s 2022 outlook. The growth in customer buildings should be considered forward looking information.

“The recent rise in energy and utility costs, coupled with concerns over GHG emissions and the importance of embedded intelligence to drive healthy and sustainable buildings is accelerating the building modernization cycle. We are currently quoting at record levels across our operating platform,” continues Ghezzi. “Kontrol continues to increase its brand and technology solutions platform for a growing blue chip customer base.”

About Kontrol Technologies Corp.

Kontrol Technologies Corp., a Canadian public company, is a leader in smart buildings and cities through IoT, Cloud and SaaS technology. Kontrol provides a combination of software, hardware, and service solutions to its customers to improve energy management, air quality and continuous emission monitoring.

Additional information about Kontrol Technologies Corp. can be found on its website at www.kontrolcorp.com and by reviewing its profile on SEDAR at www.sedar.com

https://facebook.com/kontroltechcorp/
https://twitter.com/kontrolgroup
https://www.linkedin.com/company/kontrol-group

Neither IIROC nor any stock exchange or other securities regulatory authority accepts responsibility for the adequacy or accuracy of this release.

Forward-Looking Statements

This news release contains “forward-looking information” within the meaning of applicable securities laws. All statements contained herein that are not clearly historical in nature may constitute forward-looking information. In some cases, forward-looking information can be identified by words or phrases such as “may”, “will”, “expect”, “likely”, “should”, “would”, “plan”, “anticipate”, “intend”, “potential”, “proposed”, “estimate”, “believe” or the negative of these terms, or other similar words, expressions, and grammatical variations thereof, or statements that certain events or conditions “may” or “will” happen, or by discussions of strategy.

Where Kontrol expresses or implies an expectation or belief as to future events or results, such expectation or belief is based on assumptions made in good faith and believed to have a reasonable basis. Such assumptions include, without limitation, that sufficient capital will be available to the Company and that technology will be as effective as anticipated.

However, forward-looking statements are subject to risks, uncertainties, and other factors, which could cause actual results to differ materially from future results expressed, projected, or implied by such forward-looking statements. Such risks include, but are not limited to, that sufficient capital and financing cannot be obtained on reasonable terms, or at all; that those technologies will not prove as effective as expected; those customers and potential customers will not be as accepting of the Company's product and service offering as expected; government and regulatory factors impacting the energy conservation industry, as well as the commercial, multi-residential and industrial building sectors

Accordingly, undue reliance should not be placed on forward-looking statements and the forward-looking statements contained in this press release are expressly qualified in their entirety by this cautionary statement. The forward-looking statements contained herein are made as at the date hereof and are based on the beliefs, estimates, expectations, and opinions of management on such date. Kontrol does not undertake any obligation to update publicly or revise any such forward-looking statements or any forward-looking statements contained in any other documents whether as a result of new information, future events or otherwise or to explain any material difference between subsequent actual events and such forward-looking information, except as required under applicable securities law. Readers are cautioned to consider these and other factors, uncertainties, and potential events carefully and not to put undue reliance on forward-looking information.


Contacts

Kontrol Technologies Corp.
Paul Ghezzi
CEO
This email address is being protected from spambots. You need JavaScript enabled to view it.
180 Jardin Drive, Unit 9, Vaughan, ON L4K 1X8
Tel: (905) 766.0400

Investor Relations:
Brooks Hamilton
MZ Group – MZ North America
This email address is being protected from spambots. You need JavaScript enabled to view it.
Tel: +1 (949) 546.6326

Additional TEAF announcements include:
Upcoming distribution dates and amounts
Availability of third calendar quarter commentary
October monthly portfolio update


OVERLAND PARK, Kan.--(BUSINESS WIRE)--Ecofin Sustainable and Social Impact Term Fund (NYSE: TEAF) today announced that the Board approved the adoption of a managed distribution policy and a 6.7% increase in its monthly distributions to $0.08 per share beginning in December and payable on the dates noted below. Based on TEAF’s current price of $14.91, the distribution represents an annualized distribution rate of 6.44%.

“This distribution increase coincides with the notable constructive outlook we hold for the underlying assets in the TEAF portfolio and further shift to sustainable investments moving into 2022. We are confident in the income generation and expected long-term total return of the portfolio, driven by the low correlation and differentiated income streams of the underlying assets, and we expect to monetize a portion of total return over time and return to shareholders in the form of monthly distributions,” said Nick Holmes, Managing Director and Portfolio Manager.

Upcoming distribution dates and amounts

TEAF monthly distributions are payable on December 31, 2021, January 31, 2022, and February 28, 2022, to shareholders of record on the respective dates of December 24, 2021, January 24, 2022, and February 21, 2022.

For book purposes, the source of distributions for TEAF is estimated to be approximately 90 to 100% ordinary income, with the remainder as return of capital. For tax purposes, the characterization will not be made until determination of earnings and profits after year end.

Availability of third calendar quarter commentary

TEAF commentary has been published for the third calendar quarter of 2021. The commentary piece highlights fund performance of the public and direct investments in the essential asset sectors in which the fund invests. A copy of the commentary piece is available here on the company website.

October monthly portfolio update

Additionally, an update on TEAF’s direct investments, portfolio asset allocation, structure types and impact statistics as of October 31, 2021 are provided on the company website here. On a monthly basis, details on each private deal that has taken place over the prior month will be published here. The list includes all deals completed since the fund’s inception through October 31, 2021. Updates will continue to be posted on a monthly basis until the fund reaches its target of 60% direct investments.

2021 Tax Characterization Information

For tax purposes, 60 to 80% of TEAF’s 2021 distributions are expected to be characterized as dividend income with the remainder as return of capital. A final determination of the characterization will be made in January 2022, and you will receive a form 1099-DIV for each fund in which you are invested.

For additional information on this fund, please visit cef.tortoiseecofin.com.

About Ecofin

Ecofin is a sustainable investment firm dedicated to uniting ecology and finance. Our mission is to generate strong risk-adjusted returns while optimizing investors’ impact on society. We are socially minded, ESG-attentive investors, harnessing years of expertise investing in sustainable infrastructure, energy transition, clean water & environment and social impact. Our strategies are accessible through a variety of investment solutions and seek to achieve positive impacts that align with UN Sustainable Development Goals by addressing pressing global issues surrounding climate action, clean energy, water, education, healthcare and sustainable communities. Ecofin Investments, LLC is the parent of registered investment advisers Ecofin Advisors, LLC and Ecofin Advisors Limited (collectively “Ecofin”). To learn more, please visit www.ecofininvest.com.

Tortoise Capital Advisors, L.L.C. (also dba TCA Advisors) (“TCA”) is the adviser to Ecofin Sustainable and Social Impact Term Fund and Ecofin Advisors Limited is the fund’s sub-adviser.

Safe harbor statement

This press release shall not constitute an offer to sell or a solicitation to buy, nor shall there be any sale of these securities in any state or jurisdiction in which such offer or solicitation or sale would be unlawful prior to registration or qualification under the laws of such state or jurisdiction.

Cautionary Statement Regarding Forward-Looking Statements

This press release contains certain statements that may include “forward-looking statements” within the meaning of Section 27A of the Securities Act of 1933, as amended, and Section 21E of the Securities Exchange Act of 1934, as amended. All statements, other than statements of historical fact, included herein are "forward-looking statements." Although the fund and TCA believe that the expectations reflected in these forward-looking statements are reasonable, they do involve assumptions, risks and uncertainties, and these expectations may prove to be incorrect. Actual results could differ materially from those anticipated in these forward-looking statements as a result of a variety of factors, including those discussed in the fund’s reports that are filed with the Securities and Exchange Commission. You should not place undue reliance on these forward-looking statements, which speak only as of the date of this press release. Other than as required by law, the fund and TCA do not assume a duty to update this forward-looking statement.


Contacts

For more information contact Maggie Zastrow at (913) 981-1020 or This email address is being protected from spambots. You need JavaScript enabled to view it..

HOUSTON--(BUSINESS WIRE)--Tellurian Inc. (Tellurian or the Company) (NYSE American: TELL) today announced that it has closed its previously announced underwritten public offering of $50 million aggregate principal amount of 8.25% senior notes due 2028. Proceeds from the offering, after deducting underwriting discounts and commissions, the structuring and advisory fee and estimated fees and expenses, were approximately $47.1 million. The Company has granted the underwriters a 30-day option to purchase an additional $7.5 million aggregate principal amount of senior notes in connection with the offering. The Company intends to use the net proceeds from this offering for general corporate purposes, including the potential acquisition of upstream assets.


Tellurian and this issuance of notes both received an investment grade rating of BBB+ from Egan-Jones Ratings Company, an independent, unaffiliated rating agency.

B. Riley Securities, Inc., Ladenburg Thalmann & Co. Inc. and William Blair & Company, L.L.C. acted as joint book-running managers for the offering. EF Hutton, division of Benchmark Investments, LLC, acted as lead manager, and Aegis Capital Corp., Boenning & Scattergood, Inc., Colliers Securities LLC, Newbridge Securities Corporation, Revere Securities LLC, Wedbush Securities Inc. and B.C. Ziegler and Company acted as co-managers for the offering.

The offering was made pursuant to an effective shelf registration statement of the Company previously filed with the Securities and Exchange Commission (the SEC). The offering was made only by means of a prospectus supplement and the accompanying prospectus. Copies of the prospectus supplement for the offering and the accompanying prospectus may be obtained by sending a request to B. Riley Securities, Inc., Attention: Prospectus Department, 1300 North 17th Street, Suite 1300, Arlington, Virginia 22209; Telephone: (703) 312-9580, or by emailing This email address is being protected from spambots. You need JavaScript enabled to view it..

This press release shall not constitute an offer to sell or the solicitation of an offer to buy, nor shall there be any sale of these securities, in any state or jurisdiction in which such offer, solicitation or sale of these securities would be unlawful prior to registration or qualification under the securities laws of any such state or jurisdiction.

About Tellurian Inc.

Tellurian is developing a portfolio of natural gas production, LNG marketing and trading, and infrastructure that includes an ~ 27.6 mtpa LNG export facility and an associated pipeline. Tellurian is based in Houston, Texas, and its common stock is listed on the NYSE American under the symbol “TELL.”

CAUTIONARY INFORMATION ABOUT FORWARD-LOOKING STATEMENTS

Statements in this press release related to the use of proceeds from the Company’s public offering of senior notes and all other statements other than statements of historical fact are forward-looking statements that are made pursuant to the Safe Harbor Provisions of the Private Securities Litigation Reform Act of 1995. Forward-looking statements are subject to a number of risks and uncertainties that may cause actual results to differ materially from the forward-looking statements. Tellurian urges you to carefully review and consider the cautionary statements made in this press release, the registration statement, the “Risk Factors” section of the prospectus supplement for the offering and of the Company’s Annual Report on Form 10-K for the fiscal year ended December 31, 2020, and other filings with the SEC for further information on risks and uncertainties that could affect the Company’s business, financial condition and results of operations. The Company cautions you not to place undue reliance on forward-looking statements, which speak only as of the date made. Tellurian undertakes no obligation to update any forward-looking statements in order to reflect any event or circumstance occurring after the date of this press release or currently unknown facts or conditions or the occurrence of unanticipated events. All forward-looking statements are qualified in their entirety by this cautionary statement.


Contacts

Media:
Joi Lecznar
EVP Public and Government Affairs
Phone +1.832.962.4044
This email address is being protected from spambots. You need JavaScript enabled to view it.

Investors:
Matt Phillips
Vice President, Investor Relations
Phone +1.832.320.9331
This email address is being protected from spambots. You need JavaScript enabled to view it.

HOUSTON--(BUSINESS WIRE)--Expro Group Holdings N.V. (NYSE: XPRO) today announced that Michael Jardon, Chief Executive Officer, will present to members of the investment community at the Bank of America Securities 2021 Global Energy Conference at 1:00 p.m. ET on Thursday, November 18, 2021.


A live webcast of Expro’s presentation will be available via the Investor section of www.expro.com. Please log on at least 15 minutes early to register and to download any necessary audio software. A replay of the webcast will be available at the Investor section of Expro’s website for 90 days following the presentation. In addition, the conference presentation and script may be accessed via the Investor section of www.expro.com.

ABOUT EXPRO

Working for clients across the entire well life cycle, Expro is a leading provider of energy services, offering cost-effective, innovative solutions and best-in-class safety and service quality. The company's extensive portfolio of capabilities spans well construction, well flow management, subsea well access, and well integrity and intervention.

Founded in 1938, Expro has more than 6,600 employees and provides services and solutions to leading exploration and production companies in both onshore and offshore environments in approximately 60 countries with over 100 locations.

For more information, please visit: expro.com and connect with Expro on Twitter @ExproGroup and LinkedIn @Expro.


Contacts

Investor contact:
Karen David-Green – Chief Communications, Stakeholder & Sustainability Officer
This email address is being protected from spambots. You need JavaScript enabled to view it.
+1 281 994 1056

Media contact:
Hannah Rumbles – Global Marketing and Communications Manager
This email address is being protected from spambots. You need JavaScript enabled to view it.
+44 1224 796729

Renewable Energy Group Invests in Booster and Becomes an Exclusive Supplier of Renewable Fuels

AMES, Iowa--(BUSINESS WIRE)--$REGI #REG--Booster, the tech-enabled energy delivery service, and Renewable Energy Group (REG) (NASDAQ:REGI), a leading producer and provider of lower carbon fuels, today announced a first-of-its-kind partnership to provide mobile delivery of renewable diesel, biodiesel and blended fuels to fleets. The service started in California in August and has the potential to grow nationally.


The Booster / REG collaboration makes low-carbon fuels more accessible to clients, with convenient mobile fueling services provided by Booster. As businesses and fleets look for more sustainable solutions, REG’s bio-based diesel is easy to adopt and immediately begins reducing fossil carbon emissions. Under the new partnership, REG UltraClean Blend™ and other renewable and biodiesel fuels will be delivered to customers via Booster’s proprietary trucks, last-mile technology platform and certified drivers.

"This new service will let companies seamlessly transition their fleets to much lower-emission fuels with no equipment or infrastructure costs," said Frank Mycroft, CEO and co-founder, Booster. "Our partnership with REG will provide fleet operators with an ‘easy button’ to solve their sustainability, energy reliability and operational efficiency needs. Combining Booster and REG capabilities also offers fleet managers the data and intelligence required to meet increasingly ambitious environmental standards and business optimization targets.”

As part of the partnership, REG will be an exclusive supplier of bio-based diesel to Booster, and has become an investor in the company. Booster will also be an exclusive mobile fueler to REG and will partner with REG to explore expansion opportunities together.

“This collaboration is a perfect match for us, bringing together two innovative, sustainable solutions and building on our downstream strategy to reach customers and provide a first-class experience,” said REG Senior Vice President, Sales & Marketing, Bob Kenyon. “The energy transition is happening and this is the right place and right time for customers to adopt bio-based diesel and immediately reduce emissions in an easy and efficient manner. Our investment in Booster solidifies our commitment to enabling consumers with the ability to access clean fuel choices.”

Enterprise Holdings is a customer of Booster, and the company’s venture capital arm, Enterprise Holdings Ventures, is a Booster investor. In addition, the company’s affiliate, Enterprise Fleet Management, partners with Booster to deliver fuel services to small-to-medium sized fleets.

“We applaud Booster and REG for expanding service to include diverse renewable products that help existing fleets reduce environmental impact and realize their sustainability goals. This innovation is an essential component to the important vehicle decisions fleet operators make,” said Brice Adamson, Executive Vice President, Enterprise Fleet Management.

The REG / Booster collaboration will initially focus on servicing fleet customers in California, starting with the San Francisco Bay Area and Orange County, with additional markets to follow.

For more information about the service and partnership, visit the Booster and REG websites.

About Renewable Energy Group, Inc.

Renewable Energy Group (REG) is leading the energy industry's transition to sustainability by converting renewable resources into high-quality, cleaner fuels. REG is an international producer of cleaner fuels and one of North America’s largest producers of advanced biodiesel. REG solutions are alternatives for petroleum diesel and produce significantly lower carbon emissions. REG utilizes an integrated procurement, distribution and logistics network to operate 12 biorefineries in the U.S. and Europe. In 2020, REG produced 519 million gallons of cleaner fuel, delivering 4.2 million metric tons of carbon reduction. REG is meeting the growing global demand for lower-carbon fuels and leading the way to a more sustainable future. For more information, visit regi.com.

About Booster

Booster is a tech-enabled mobile energy delivery company providing a more sustainable fueling experience to fleets and consumers. The company’s proprietary mini-tankers deliver energy directly to fleet and consumer customers to help them save on costs and meet decarbonization goals. At the same time, Booster’s data insights help fleet managers optimize their businesses. Booster has raised more than $108 million in funding from firms such as Invus Opportunities, Conversion Capital, Enterprise Holdings Ventures, Madrona Venture Group, Maveron, Perot Jain, L.P., Total Carbon Neutrality Ventures and Vulcan Capital. For more information, visit boosterusa.com.

Forward-Looking Statements

This press release contains certain forward-looking statements within the meaning of the Private Securities Litigation Reform Act of 1995, as amended, including statements regarding REG’s strategic growth plans, customer demand for low carbon fuels and the strategic partnership between REG and Booster. These forward-looking statements are based on current expectations, estimates, assumptions and projections that are subject to change, and actual results may differ materially from the forward-looking statements. Factors that could cause actual results to differ materially include, but are not limited to, the failure of REG and Booster to achieve the goals of their strategic partnership, customer’s desire for clean fuel options, and other risks and uncertainties described in REG’s annual report on Form 10-K for the year ended December 31, 2020 and subsequently filed Form 10-Q and other periodic filings with the Securities and Exchange Commission. All forward-looking statements are made as of the date of this press release and REG does not undertake to update any forward-looking statements based on new developments or changes in our expectations.


Contacts

Media Contact for Booster Fuels:
Jordan Valdés
This email address is being protected from spambots. You need JavaScript enabled to view it.

Media Contact for Renewable Energy Group:
Katie Stanley
This email address is being protected from spambots. You need JavaScript enabled to view it.

Distribution Amounts and Dates Declared for:
Tortoise Energy Infrastructure Corp. (NYSE: TYG)
Tortoise Midstream Energy Fund, Inc. (NYSE: NTG)
Tortoise Pipeline & Energy Fund, Inc. (NYSE: TTP)
Tortoise Energy Independence Fund, Inc. (NYSE: NDP)
Tortoise Power and Energy Infrastructure Fund, Inc. (NYSE: TPZ)


OVERLAND PARK, KS--(BUSINESS WIRE)--TortoiseEcofin and the Board of its closed-end funds today announced a fourth consecutive and noteworthy increase to quarterly distributions for TYG and NTG of 23.3% and 48.1%, respectively. As previously announced, TTP, NDP and TPZ have adopted managed distribution policies and those distribution amounts will be reviewed in February 2022, in accordance with their policies.

“The distribution increases for TYG and NTG are due to steady NAV growth and a refueling in demand within the energy infrastructure sector. The increases raise the distributions of both funds to levels in accordance with their distribution policies,” said Matt Sallee, President – Tortoise. “In alignment with the energy evolution taking place across the globe, TYG continues its strategic shift, positioning for the future of energy growth and toward a target portfolio of ~40% renewables and power infrastructure. Furthermore, we see tremendous opportunity and exceptional yields in midstream energy infrastructure, where NTG primarily invests, and we intend to pass that income to shareholders.”

Tortoise closed-end funds distribution details are as follows:

Fund

Ticker

Distribution
Amount

Distribution
Frequency

Tortoise Energy Infrastructure Corp.

TYG

$0.450

Quarterly

Tortoise Midstream Energy Fund, Inc.

NTG

$0.570

Quarterly

Tortoise Pipeline & Energy Fund, Inc.

TTP

$0.370

Quarterly

Tortoise Energy Independence Fund, Inc.

NDP

$0.310

Quarterly

Tortoise Power and Energy Infrastructure Fund, Inc.

TPZ

$0.060

Monthly

TYG, NTG, TTP and NDP quarterly distributions are payable on November 30, 2021, to shareholders of record on November 23, 2021. TPZ is expected to continue to declare distributions monthly, with the November distribution payable on November 30, 2021, to shareholders of record on November 23, 2021.

2021 Tax Characterization Information

For tax purposes, 80 to 100% of TYG and NTG’s 2021 distributions are expected to be characterized as qualified dividend income, with the remainder as return of capital; 0 to 10% of TTP and NDP’s 2021 distributions are expected to be characterized as dividend income, with the remainder as return of capital; and 40 to 60% of TPZ’s 2021 distributions are expected to be characterized as dividend income with the remainder as return of capital. A final determination of the characterization will be made in January 2022, and you will receive a form 1099-DIV for each fund in which you are invested.

For book purposes, the source of distributions for TYG and NTG is estimated to be 100% return of capital, and the source of distributions for NDP is estimated to be approximately 10 to 20% ordinary income, with the remainder as return of capital.

You should not draw any conclusions about TTP’s or TPZ’s investment performance from the amount of these distributions or from the terms of TTP’s or TPZ’s distribution policy.

TTP and TPZ estimate that they have distributed more than their income and net realized capital gains; therefore, a portion of the distribution may be return of capital. A return of capital may occur, for example, when some or all of the money that you invested in TTP and TPZ is paid back to you. A return of capital distribution does not necessarily reflect TTP’s and TPZ’s investment performance and should not be confused with “yield” or “income.”

TTP and TPZ will report the sources for their distributions at the time of the payment in the applicable Section 19(a) Notice. The amounts and sources of distributions TTP and TPZ report are only estimates and are not being provided for tax reporting purposes. The actual amounts and sources of the amounts for tax reporting purposes will depend upon TTP’s and TPZ’s investment experience during the remainder of their fiscal years and may be subject to changes based on tax regulations.

About TortoiseEcofin

TortoiseEcofin focuses on essential assets – those assets and services that are indispensable to the economy and society. We strive to make a positive impact on clients and communities by investing in energy infrastructure and the transition to cleaner energy and by providing capital for social impact projects focused on education and senior living. TortoiseEcofin brings together strong legacies from Tortoise, with expertise investing across the energy value chain for more than 20 years, and from Ecofin, which unites ecology and finance and has roots back to the early 1990s. For additional information, please visit www.TortoiseEcofin.com.

Tortoise Capital Advisors, L.L.C. (also dba TCA Advisors) (“TCA”) is the adviser to Tortoise Energy Infrastructure Corp., Tortoise Midstream Energy Fund, Inc., Tortoise Pipeline & Energy Fund, Inc., Tortoise Energy Independence Fund, Inc., and Tortoise Power and Energy Infrastructure Fund, Inc.

For additional information on these funds, please visit cef.tortoiseecofin.com.

Safe harbor statement

This press release shall not constitute an offer to sell or a solicitation to buy, nor shall there be any sale of these securities in any state or jurisdiction in which such offer or solicitation or sale would be unlawful prior to registration or qualification under the laws of such state or jurisdiction.

Cautionary Statement Regarding Forward-Looking Statements

This press release contains certain statements that may include “forward-looking statements” within the meaning of Section 27A of the Securities Act of 1933 and Section 21E of the Securities Exchange Act of 1934. All statements, other than statements of historical fact, included herein are "forward-looking statements." Although the funds and TCA believe that the expectations reflected in these forward-looking statements are reasonable, they do involve assumptions, risks and uncertainties, and these expectations may prove to be incorrect. Actual results could differ materially from those anticipated in these forward-looking statements as a result of a variety of factors, including those discussed in the fund’s reports that are filed with the Securities and Exchange Commission. You should not place undue reliance on these forward-looking statements, which speak only as of the date of this press release. Other than as required by law, the funds and TCA do not assume a duty to update this forward-looking statement.


Contacts

Maggie Zastrow
(913) 981-1020
This email address is being protected from spambots. You need JavaScript enabled to view it.

The award-winning cleantech consulting firm, Momentum (BuildMomentum.io) welcomes John Friedrich as a new strategist focused on electrification.


SACRAMENTO, Calif.--(BUSINESS WIRE)--#CleanTech--Momentum (Buildmomentum.io) is thrilled to announce the addition of John Friedrich to the company’s strategist team. Friedrich will work with clients to advance innovations in sustainability, clean energy, and electrification. He will support project implementation, developing and executing long-term innovation campaigns, fund and grant proposal development, and strategic communication.

Friedrich joins the team after decades of experience in electric vehicles, energy efficiency, distributed renewable energy generation programs, and environmental sustainability. He's currently serving on the South Lake Tahoe City Council and is a Tahoe Regional Planning Agency Governing Board member.

Friedrich is also the founder of the Tahoe Green Jobs Coalition and served as the organization's director. Friedrich built a diverse coalition of participating agencies, organizations, businesses, and funders through this organization.

"I'm passionate about decarbonizing transportation and moving toward a zero-emission energy future. I've long admired Momentum’s mission and values, and I’m excited to join the top-notch team," said Friedrich.

Friedrich is joining Momentum's newly minted Strategy Team, along with experts in utilities, ports and fleets, water, and renewable fuels.

"We've seen accelerated investment by organizations in decarbonization and sustainability plans, and we're here to guide them on that journey. John's background and experience make him a perfect guide for our clients looking to bring new electric vehicle projects online," said Momentum President Matt Hart. "We're extremely fortunate to have him on board."

Momentum has designed and deployed some of the most significant electric vehicles projects to date, from developing charging infrastructure from Mexico to Canada to rolling out more than 100 pieces of zero- and near-zero emission equipment at California's ports. Momentum will continue to push industries toward zero emissions, and Friedrich will be a crucial player in that push.

About Momentum

Momentum is a cleantech solutions firm based in Sacramento. The Momentum team of experts designs, develops, and deploys innovation campaigns for organizations working on transformative water, energy, transportation, and manufacturing technologies.

The Momentum team is driven by a vision of a world where clean energy, water, and transportation are abundant, affordable, and available to all.


Contacts

Melody White, Creative Director, Momentum — This email address is being protected from spambots. You need JavaScript enabled to view it.

AUSTIN, Texas--(BUSINESS WIRE)--Hyliion Holdings Corp. (NYSE: HYLN) (“Hyliion”), a leader in electrified powertrain solutions for Class 8 semi-trucks, today reported its third quarter 2021 financial results.

Key Business Highlights

  • Announced the addition of Secretary Elaine Chao and Mary Gustanski to the Hyliion Board of Directors
  • Secured a 40-unit reservation from Mone Transport and partnered with GreenPath Logistics for the initial controlled fleet trials of the Hypertruck ERX
  • Unveiled new Hypertruck ERX showcase unit at ACT Expo, generating strong fleet, industry and regulatory interest
  • Launched improved Hybrid powertrain solution called “Hybrid eX” and expect to begin recognizing revenue on these units in the fourth quarter of 2021
  • Initiating the Hypertruck ERX Roadshow, beginning at Wegmans headquarters on November 10th, to allow fleets to experience the flagship product firsthand
  • Supply chain shortages and long lead times for components, coupled with the required development, testing and validation of the Hypertruck ERX, are impacting the commercialization timeline

Executive Commentary

Thomas Healy, Hyliion’s Founder and Chief Executive Officer, said, “After a first half of the year filled with rapid progress and growth for Hyliion, our team continues to build on this momentum as evidenced by the commercial launch of our Hybrid eX powertrain and accomplishment of some major milestones in our Hypertruck ERX Multi-Phase Development Program.”

"Today we begin our Hypertruck ERX Roadshow at the headquarters of Wegmans Food Markets, one of our Hypertruck Innovation Council Members, with a two-day showcase event focused on demonstrating the features and benefits of the powertrain firsthand. As we continue providing these showcases to our Hypertruck Innovation Council Members and other interested fleets, we expect to see a continued increase in the customer interest that we have already been receiving.”

Board of Directors Expansion

Hyliion elected to expand the size of its board of directors from seven to nine members, adding Secretary Elaine Chao and Mary Gustanski.

Secretary Elaine Chao is a highly experienced leader of large public, private and non-profit organizations. Secretary Chao brings an invaluable perspective on global competitiveness, workforce development, trends in governmental policies, and corporate governance. While Secretary of Transportation, she advanced an agenda of American innovation in building the transportation system of the future. During her time at the Department of Labor, she focused on increasing the competitiveness of America’s workforce in the global economy.

Mary Gustanski has spent her nearly 40-year career bringing new technology to market in the ever-evolving automotive industry, with an emphasis on the development and commercialization of innovative solutions. As Senior Vice President and Chief Technology Officer of Delphi Technologies—formerly Delphi Automotive—she was responsible for the company’s global technology production, including advanced propulsion systems for future vehicle electrification.

Hypertruck ERX Fleet Update

Hyliion has secured a 40-unit reservation for the Hypertruck ERX from Mone Transport, a Texas-based carrier company, who is also an early adopter of the Hyliion Hybrid solution. Mone Transport believes the future of trucking is sustainable, but as part of their business model, their trucks need to travel hundreds of miles every day, which is where the Hypertruck ERX can offer a low-cost, low-emission and long-range electric solution. The purchase and sale of the 40 Hypertruck ERX units is subject to the execution of a final agreement between Hyliion and Mone Transport.

The unveiling of the Hypertruck ERX showcase unit at the ACT Expo on August 31, 2021, marked the start of a robust marketing program for this flagship product. Hyliion received overwhelmingly positive feedback from fleets and suppliers that were able to see this solution up close for the first time. Shortly after the tradeshow, Hyliion showcased the vehicle with the oil and gas industry at the Daniel Energy Partners’ event in Odessa, Texas.

In October, Hyliion executed on a select number of ‘ride along’ events with the Hypertruck ERX at its headquarters in Austin, Texas. One participant was the CEO of GreenPath Logistics, a member of the Hypertruck Innovation Council. After a very positive experience of riding in the Hypertruck ERX, GreenPath Logistics requested to further collaborate with Hyliion and begin initial deployments of controlled fleet trials in their operations. With GreenPath located in Dallas, Texas, Hyliion’s team will be able to closely monitor these trucks to ensure strong vehicle performance as fleet trials begin.

Today, Hyliion is embarking on another critical milestone with the kickoff of its Hypertruck ERX Roadshow. This program begins with the first stop at the Wegmans Food Markets headquarters in Rochester, NY. These events will consist of ride-alongs and in-depth product education. Hyliion plans to host another larger showcase event at its Austin, Texas headquarters in early December along with other future events to allow more Hypertruck Innovation Council members and additional interested fleets to experience the Hypertruck ERX firsthand.

Hypertruck ERX Timing Update

While Hyliion recently achieved critical product milestones, supply chain challenges and enhancements to the Multi-Phase Development Program have led to an extension in the go-forward development timeline. Similar to others in the automotive industry, the shortage of semiconductors, as well as several other key components, is extending the Company’s timelines longer than expected. These supply chain challenges have been especially prominent in the trucking industry, and one of the impacts has been significantly extended lead times for ordering new trucks. Fleets are experiencing lead times on new truck purchases that extend out for delivery into 2023. Hyliion has already placed orders for all vehicles needed in 2022 and is working to secure build slots for the 2023 calendar year in an effort to mitigate further supply chain impacts to Hyliion’s updated Hypertruck ERX development schedule. In addition, the Multi-Phase Development Program timeline has been extended to allow for design verification and additional testing inclusive of critical summer and winter seasons, as well as the accumulation of up to one million miles prior to production.

Hyliion expects to complete design verification and initial controlled fleet trials, as mentioned above, by the end of 2022. This will then be followed by additional key milestones including additional fleet trials, incorporating any of the learnings from validation into the finalized design, and obtaining final regulatory approvals prior to the start of production. Hyliion continues to work closely with its current supply base to improve delivery of components for the quarters ahead and is diligently seeking alternative sources of supply for components that meet its technical specifications with shorter lead times.

Commercial Hybrid eX Launch and Sales Update

Hyliion officially launched its commercial Hybrid eX powertrain solution on August 31, 2021, at the ACT Expo in Long Beach, CA. Compared to previous Hyliion Hybrid systems, the Hybrid eX offers fleets a lighter solution that is easier to install, service and operate. The Hybrid eX draws upon the real-world feedback Hyliion has received from customers and the millions of miles logged with the previous system.

Hyliion recently delivered its first Hybrid eX system to Werner Enterprises, a Hypertruck Innovation Council member and new Hybrid eX customer. As previously announced, due to shortages of various components caused by global supply chain disruptions, Hyliion is experiencing longer delivery times to customers which is causing some of Hyliion’s deliveries to be delayed into early 2022. In addition, the Company is assessing the potential demand impact for its Hybrid eX product offering in light of recent changes within the competitive landscape.

Financial Highlights and Operating Expense Guidance

Hyliion ended the third quarter 2021 with over $588 million available to fund its current commercialization plans for its Hybrid eX and Hypertruck ERX powertrains. This is divided into $289.5 million in cash and cash equivalents on its balance sheet, short-term investments of $144.5 million and long-term investments of $155.0 million.

Hyliion expects to begin recognizing revenue on its Hybrid eX deliveries in the fourth quarter of 2021, achieving the target outlined on the second quarter 2021 earnings call.

For the first three quarters of 2021, Hyliion’s operating expenses totaled $67.0 million, and Hyliion now expects full year 2021 operating expenses to range between $110 million and $120 million, a reduction compared to previously disclosed guidance range of $130 million to $140 million, due primarily to timing delays of truck chassis purchases for development purposes.

Third Quarter 2021 Conference Call

Hyliion will host a conference call and webcast for investors and other interested parties to review its third quarter 2021 financial results on Wednesday, Nov. 10, 2021 at 11:00 a.m. Eastern Time. A live webcast of the call, as well as an archived replay following, will be available online on the Investor Relations section of Hyliion’s website. Those wishing to participate can access the call using the links below:

Conference Call Online Registration: http://www.directeventreg.com/registration/event/2279822

Webcast: https://investors.hyliion.com/events-and-presentations/default.aspx

Third quarter 2021 financial results for Hyliion Holdings Corp. (f/k/a Tortoise Acquisition Corp.) on a consolidated basis will also be filed with the SEC on Form 10-Q.

About Hyliion

Hyliion’s mission is to reduce the carbon intensity and greenhouse gas (GHG) emissions of Class 8 commercial trucks by being a leading provider of electrified powertrain solutions. Leveraging advanced software algorithms and data analytics capabilities, Hyliion offers fleets an easy, efficient system to decrease fuel and operating expenses while seamlessly integrating with their existing fleet operations. Headquartered in Austin, Texas, Hyliion designs, develops, and sells electrified powertrain solutions that are designed to be installed on most major Class 8 commercial trucks, with the goal of transforming the commercial transportation industry’s environmental impact at scale. For more information, visit www.hyliion.com.

Forward Looking Statements

The information in this press release includes “forward-looking statements” within the meaning of Section 27A of the Securities Act of 1933, as amended, and Section 21E of the Securities Exchange Act of 1934, as amended. All statements, other than statements of present or historical fact included in this press release, regarding Hyliion and its future financial and operational performance, as well as its strategy, future operations, estimated financial position, estimated revenues, and losses, projected costs, prospects, plans and objectives of management are forward looking statements. When used in this press release, including any oral statements made in connection therewith, the words “could,” “should,” “will,” “may,” “believe,” “anticipate,” “intend,” “estimate,” “expect,” “project,” the negative of such terms and other similar expressions are intended to identify forward-looking statements, although not all forward-looking statements contain such identifying words. These forward-looking statements are based on management’s current expectations and assumptions about future events and are based on currently available information as to the outcome and timing of future events. Except as otherwise required by applicable law, Hyliion expressly disclaims any duty to update any forward-looking statements, all of which are expressly qualified by the statements herein, to reflect events or circumstances after the date of this press release. Hyliion cautions you that these forward-looking statements are subject to numerous risks and uncertainties, most of which are difficult to predict and many of which are beyond the control of Hyliion. These risks include, but are not limited to, Hyliion’s ability to disrupt the powertrain market, Hyliion’s focus in 2021 and beyond, the effects of Hyliion’s dynamic and proprietary solutions on its commercial truck customers, accelerated commercialization of the Hypertruck ERX, the ability to meet 2021 and future product milestones, the impact of COVID-19 on long-term objectives, the ability to reduce carbon intensity and greenhouse gas emissions and the other risks and uncertainties set forth in “Risk Factors” section of Hyliion’s annual report on Form 10-K/A filed with the Securities and Exchange Commission (the “SEC”) on May 17, 2021 for the year ended December 31, 2020. Given these risks and uncertainties, readers are cautioned not to place undue reliance on such forward-looking statements. Should one or more of the risks or uncertainties described in this press release occur, or should underlying assumptions prove incorrect, actual results and plans could different materially from those expressed in any forward-looking statements. Additional information concerning these and other factors that may impact Hyliion’s operations and projections can be found in its filings with the SEC. Hyliion’s SEC Filings are available publicly on the SEC’s website at www.sec.gov, and readers are urged to carefully review and consider the various disclosures made in such filings.


HYLIION HOLDINGS CORP.
UNAUDITED CONDENSED CONSOLIDATED STATEMENTS OF OPERATIONS
(Dollar amounts in thousands, except share and per share data)


Three Months Ended September 30,


Nine Months Ended September 30,


2021


2020


2021


2020

Operating expenses:


Research and development

$

(18,150)


$

(2,909)


$

(40,871)


$

(8,134)


Selling, general and administrative

(8,660)


(2,140)


(26,111)


(3,705)


Loss from operations

(26,810)


(5,049)


(66,982)


(11,839)


Other income (expense):


Interest expense


(2,230)


(5,458)


Interest income

195


561


Change in fair value of convertible notes payable derivative liabilities


(1,813)


(1,358)


Other expense


(12)


(12)


Total other income (expense)

195


(4,055)


561


(6,828)


Net loss

$

(26,615)


$

(9,104)


$

(66,421)


$

(18,667)


Weighted-average shares outstanding, basic and diluted

172,987,672


87,398,704


171,842,664


86,981,200


Net loss per share, basic and diluted

$

(0.15)


$

(0.10)


$

(0.39)


$

(0.21)


HYLIION HOLDINGS CORP.
CONDENSED CONSOLIDATED BALANCE SHEETS
(Dollar amounts in thousands, except share and per share data)


September 30,
2021


December 31,
2020


(Unaudited)


Assets


Current assets:


Cash and cash equivalents

$

289,486


$

389,705


Accounts receivable

359


92


Prepaid expenses and other current assets

5,516


20,690


Short-term investments

144,465


201,881


Total current assets

439,826


612,368


Property and equipment, net

2,820


1,171


Operating lease right-of-use assets

8,474


5,055


Intangible assets, net

259


332


Other assets

920


193


Long-term investments

154,981


35,970


Total assets

$

607,280


$

655,089


Liabilities and stockholders’ equity


Current liabilities:


Accounts payable

$

7,527


$

1,890


Current portion of operating lease liabilities

827


734


Accrued expenses and other current liabilities

7,623


6,313


Total current liabilities

15,977


8,937


Operating lease liabilities, net of current portion

8,749


5,076


Debt, net of current portion


908


Total liabilities

24,726


14,921


Stockholders’ Equity:


Common stock, $0.0001 par value; 250,000,000 shares authorized; 173,120,988 and 169,316,421 shares issued and outstanding at September 30, 2021 and December 31, 2020, respectively

20


19


Additional paid-in capital

373,804


364,998


Retained earnings

208,730


275,151


Total stockholders’ equity

582,554


640,168


Total liabilities and stockholders’ equity

$

607,280


$

655,089


HYLIION HOLDINGS CORP.
UNAUDITED CONDENSED CONSOLIDATED STATEMENTS OF CASH FLOWS
(Dollar amounts in thousands)


For the Nine Months Ended
September 30,


2021


2020

Cash Flows from Operating Activities:


Net loss

$

(66,421)


$

(18,667)


Adjustments to reconcile net loss to net cash used in operating activities:


Depreciation and amortization

657


665


Amortization of investment premiums and discounts

1,318


Noncash lease expense

720


722


Paid-in-kind interest on convertible notes payable


1,081


Amortization of debt discount


4,237


Share-based compensation

3,972


165


Change in fair value of convertible notes payable derivative liabilities


1,358


Changes in operating assets and liabilities:


Accounts receivable

(267)


130


Prepaid expenses and other assets

3,646


(668)


Accounts payable

5,617


353


Accrued expenses and other current liabilities

1,309


391


Operating lease liabilities

(373)


(752)


Net cash used in operating activities

(49,822)


(10,985)


Cash Flows from Investing Activities:


Purchase of property and equipment

(2,213)


(105)


Proceeds from sale of property and equipment


22


Payments for security deposit, net

(29)


Purchase of investments

(268,714)


Proceeds from sale and maturity of investments

205,355


Net cash used in investing activities

(65,601)


(83)


Cash Flows from Financing Activities:


Proceeds from exercise of stock warrants, net of issuance costs

16,257


Proceeds from term loan


10,100


(Payments for)/proceeds from Paycheck Protection Program loan

(908)


908


Proceeds from exercise of common stock options

553


119


Proceeds from convertible notes payable issuance and derivative liabilities


3,200


Payments for deferred transaction costs


(1,316)


Payments for deferred financing costs


(468)


Repayments on finance lease obligations


(195)


Net cash provided by financing activities

15,902


12,348


Net (decrease) increase in cash and cash equivalents and restricted cash

(99,521)


1,280


Cash and cash equivalents - beginning of the period

389,705


6,285


Cash and cash equivalents and restricted cash - end of the period

$

290,184


$

7,565


Contacts

Hyliion Holdings Corp.
Investor Contact
Louis Baltimore
This email address is being protected from spambots. You need JavaScript enabled to view it.

Press Contact
Ryann Malone
This email address is being protected from spambots. You need JavaScript enabled to view it.
(833) 495-4466

DUBLIN--(BUSINESS WIRE)--The "India Solar Water Pumping System Market (2021-2027): Market Forecast By Power Rating, By Design Type, By Drive Type, By Applications, By Regions and Competitive Landscape." report has been added to ResearchAndMarkets.com's offering.


India's Solar Water Pumping Systems Market size is projected to grow at CAGR of 7.0% during 2021-2027

This report comprehensively covers the market by power rating, design type, drive type, applications, and regions. The market report provides an unbiased and detailed analysis of the ongoing market trends, opportunities, high growth areas, and market drivers, which would help the stakeholders to devise and align their market strategies according to the current and future market dynamics.

Indian Solar Water Pumping Systems Market Synopsis

India's Solar Water Pumping Systems Market has been exhibiting substantial growth over the past few years. Growing adoption of renewable energy resources, especially solar, along with government initiatives such as the "Pradhan Mantri - Kisan Urja Suraksha evam Utthan Mahabhiyaan (PM KUSUM)" scheme with the aim to install 20 lakh units of standalone Solar Water Pumping Systems by 2022, would act as driving forces behind growing market demand for solar water pumps.

Further, subsidy provisions and lower operating costs of the Solar Water Pumping Systems would incentivize the farmers to increase the adoption of solar water pumps over the coming years. However, COVID- 19 pandemic impacted on the growth of the deployment of the pumps across the country, but state governments and central government policies such as Maharashtra's Mukhyamantri Saur Krishi Pump Yojana, solar program by NREDCAP, among others, are expected to increase the annual sales of the Solar Water Pumping Systems in the coming years.

India Solar Water Pumping Systems market is mainly subsidy driven, where direct sales accounts for a negligible share in the market. The financial aid is only extended for up to the 7.5HP solar water pumping category. Thus, the growth in the respective segment of solar-based water pumping system showed a better increase in past years.

However, falling prices of the Solar Water Pumping Systems of the ratings mentioned above on the back of increasing competitiveness in the market are expected to create a moderate drag on the growth of market revenues over the coming years.

Market Analysis by Power Rating

Among power ratings, solar pumps with lower power ratings bagged the highest volume share in 2020. Moreover, up to 3 HP segment is projected to exhibit the highest growth rate during the forecast period, attributed to its affordability, durability, and higher incentives and subsidies provided by the government on such pumps.

Also, with the lower groundwater level, the demand for submersible Solar Water Pumping Systems outweighs the demand for its other counterpart. However, the surface solar water pumping segment is projected to exhibit high growth over the coming years.

Key Attractiveness of the Report

  • COVID-19 Impact on the Market
  • 10 Years Market Numbers
  • Historical Data Ranging from 2017 to 2020
  • Key Performance Indicators Impacting the Market
  • Major Upcoming Developments and Projects

Key Topics Covered:

1. Executive Summary

2. Introduction

3. India Solar Water Pumping System Market Overview

3.1. India Solar Water Pumping System Market Revenues & Volume (2016-2027F)

3.2. India Solar Water Pumping System Market Revenue & Volume Share (2020 & 2027F)

3.3. India Solar Water Pumping System Market Porter's Five Forces

3.4. India Solar Water Pumping System Market Ecosystem

3.5. India Solar Water Pumping System Cost Analysis

4. India Solar Water Pumping System Market Dynamics

4.1. Impact Analysis

4.2. Market Drivers

4.3. Market Restraints

5. India Solar Water Pumping System Market Trends

6. India Solar Off-Grid Water Pumping System Market Overview

6.1. India Solar Off-Grid Water Pumping System Market Revenues and Volume (2016-2027F)

6.2. India Solar Off-Grid Water Pumping System Market Revenue & Volume Share, By Power Rating (2020 & 2027F)

6.3. India Solar Off-Grid Water Pumping System Market Revenue & Volume Share, By Design Type (2020 & 2027F)

6.4. India Solar Off-Grid Water Pumping System Market Revenue & Volume Share, By Drive Type (2020 & 2027F)

6.5. India Solar Off-Grid Water Pumping System Market Revenue & Volume Share, By Applications (2020 & 2027F)

6.6. India Solar Off-Grid Water Pumping System Market Revenue Share, By Regions (2020 & 2027F)

7. India Solar On-Grid Water Pumping System Market Overview

7.1. India Solar On-Grid Water Pumping System Market Revenues and Volume (2016-2027F)

7.2. India Solar On-Grid Water Pumping System Market Revenue & Volume Share, By Power Rating (2020 & 2027F)

7.2.1. India Solar On-Grid Water Pumping System Market Revenues, By Power Rating (2016-2027F)

7.2.2. India Solar On-Grid Water Pumping System Market Volume, By Power Rating (2016-2027F)

8. India Solar Water Pumping System Market, Price Trend Analysis

9. India Solar Water Pumping System Market Opportunity Assessment

9.1. India Off-Grid Solar Water Pumping System Market Opportunity Assessment, By Power Rating (2027F)

9.2. India Off-Grid Solar Water Pumping System Market Opportunity Assessment, By Design Type (2027F)

9.3. India On-Grid Solar Water Pumping System Market Opportunity Assessment, By Power Rating (2027F)

10. India Solar Water Pumping System Market, Competitive Landscape

10.1. India Solar Water Pumping System Market Revenue Share, By Company, 2020

10.2. India Solar Water Pumping System Market Competitive Benchmarking, By Technical Parameter

10.3. India Solar Water Pumping System Market Competitive Benchmarking, By Operating Parameter

11. Company Profiles

11.1. Alpex Solar Private Limited

11.2. Bright Solar Private Limited

11.3. C.R.I. Pumps Private Limited

11.4. Claro Energy Private Limited

11.5. Grundfos Pump India Private Limited

11.6. Jain Irrigation Systems Limited

11.7. Lubi Industries LLP

11.8. Ravindra Energy Limited

11.9. Rotomag Motors & Control Private Limited

11.10. Shakti Pumps (India) Limited

11.11. Tata Power Solar Systems Limited

11.12. Topsun Energy Limited

11.13. Waaree Energies Limited

12. Key Strategic Recommendations

For more information about this report visit https://www.researchandmarkets.com/r/rzivn8


Contacts

ResearchAndMarkets.com
Laura Wood, Senior Press Manager
This email address is being protected from spambots. You need JavaScript enabled to view it.

For E.S.T Office Hours Call 1-917-300-0470
For U.S./CAN Toll Free Call 1-800-526-8630
For GMT Office Hours Call +353-1-416-8900

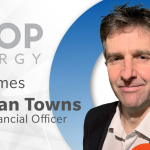
VANCOUVER, British Columbia--(BUSINESS WIRE)--Loop Energy (TSX: LPEN), a developer and manufacturer of hydrogen fuel cell solutions, is pleased to announce Damian Towns will join the company as Chief Financial Officer on November 15, 2021.


Mr. Towns joins Loop Energy from Photon Control, a Richmond, BC-based optical sensors supplier to the world's largest semi-conductor OEMs. As the Chief Financial Officer and Corporate Secretary, Mr. Towns guided Photon's exponential growth and maximized shareholder revenue through its recent acquisition. He brings deep expertise and technical knowledge in corporate finance, financial planning, accounting, governance, and investor relations. Loop Energy is also excited to draw on Mr. Towns' strategic and financial experience managing organizations with manufacturing operations and research & development activities.

Mr. Towns brings over 25 years of experience in progressive and rapid-growth companies, spending 15 years leading organizations at the executive level. Prior to his role at Photon Control, Mr. Towns served as an Executive Director, CFO and Corporate Secretary at Liberty Defense (TSXV: SCAN), a technology company that provides Active 3D Imaging and AI software to address security challenges. His career also includes over 12 years as CFO and Corporate Secretary at Marimaca Copper (TSX: MARI), formerly Coro Mining. Mr. Towns holds both CPA and CA designations, along with a First-Class Honours degree in accounting and finance from the University of Otago, New Zealand.

The arrival of Mr. Towns continues to strengthen Loop Energy as a leader in hydrogen fuel cell technology. With significant international experience in high-growth companies, he is well-positioned to provide strategic oversight as Loop enters new markets and expands its global footprint. Mr. Towns will also oversee investor relations initiatives.

"I am excited to be joining Loop Energy's world-class team and to augment the existing leadership team already in place," said Damian Towns. "Hydrogen fuel cells have an increasingly important role to play in reducing global carbon emissions and supporting the clean energy transition. l believe Loop's technology, innovation and performance will place it at the forefront of the electrification industry growth curve."

"Damian's experience scaling progressive companies both internationality and in North America will be an important addition as Loop continues to expand in various markets," said Ben Nyland, President & Chief Executive Officer at Loop Energy. "We believe Damian is a tremendous hire and one that will bring strategic value to our executive team as we continue to grow."

About Loop Energy Inc.

Loop Energy is a leading designer and manufacturer of fuel cell systems targeted for the electrification of commercial vehicles, including, light commercial vehicles, transit buses and medium and heavy-duty trucks. Loop's products feature the Company's proprietary eFlow™ technology in the fuel cell stack's bipolar plates. eFlow™ was designed to enable commercial customers to achieve performance maximization and cost minimization. Loop works with OEMs and major vehicle sub-system suppliers to enable the production of hydrogen fuel cell electric vehicles. For more information about how Loop is driving towards a zero-emissions future, visit www.loopenergy.com.

This press release may contain forward-looking information within the meaning of applicable securities legislation, which reflect management's current expectations and projections regarding future events. Forward-looking information is based on a number of assumptions and is subject to a number of risks and uncertainties, many of which are beyond the Company's control and could cause actual results and events to vary materially from those that are disclosed, or implied, by such forward-looking information. Such risks and uncertainties include, but are not limited to, the ability of the Company to execute on its strategy and the factors discussed under "Risk Factors" in the Company's Annual Information Form dated March 30, 2021. Loop disclaims any obligation to update these forward-looking statements.


Contacts

Loop Energy Media Contact: Ethan Hugh | Tel: +1.604.222.3400 x 304 | This email address is being protected from spambots. You need JavaScript enabled to view it.
Loop Energy Business Contact: George Rubin | Tel: +1.604.828.8185 | This email address is being protected from spambots. You need JavaScript enabled to view it.

DUBLIN--(BUSINESS WIRE)--The "Nigerian Diesel Genset Market (2021-2027): Market Forecast by kVA Rating, by Verticals, by Regions, and Competitive Landscape" report has been added to ResearchAndMarkets.com's offering.


The Nigerian Diesel Genset Market declined by -5.2% in 2017- 2020 but is expected to grow at a CAGR of 3.7% during 2021-2027

Nigeria occupies 1st position in terms of the market size in the African Diesel Genset market.

In terms of market by kVA ratings, 375.1KVA-750kVA dominates the market and is expected to remain in a dominant position in the coming years. However, 75.1kVA-375kVA rating is expected to have the fastest growth rate among all ratings.

In terms of application, the industrial sector dominates the market and is expected to remain in a dominant position in the coming years. However, the commercial sector is expected to have the fastest growth rate among all applications.

The Nigerian Diesel Genset Market report comprehensively covers the market by kVA ratings, applications, and regions. The Nigerian Diesel Genset Market outlook report provides an unbiased analysis of the ongoing Nigeria Diesel Genset market trends, opportunities/high growth areas, and market drivers which would help the stakeholders to devise and align their market strategies according to the current and future market dynamics.

Key Topics Covered:

1 Executive Summary

2 Introduction

2.1 Key Highlights of the Report

2.2 Report Description

2.3 Market Scope & Segmentation

2.4 Research Methodology

2.5 Assumptions

3 Nigeria Diesel Genset Market Overview

3.1 Nigeria Country Macro Economic Indicators

3.2 Nigeria Diesel Genset Market Revenues & Volume, 2020 & 2027F

3.3 Nigeria Diesel Genset Market - Industry Life Cycle

3.4 Nigeria Diesel Genset Market - Porter's Five Forces

3.5 Nigeria Diesel Genset Market Revenues & Volume Share, By KVA, 2020 & 2027F

3.6 Nigeria Diesel Genset Market Revenues & Volume Share, By Application, 2020 & 2027F

4 Nigeria Diesel Genset Market Dynamics

4.1 Impact Analysis

4.2 Market Drivers

4.3 Market Restraints

5 Nigeria Diesel Genset Market Trends

6 Nigeria Diesel Genset Market, By Types

6.1 Nigeria Diesel Genset Market, By KVA

6.1.1 Overview and Analysis

6.1.2 Nigeria Diesel Genset Market Revenues & Volume, By KVA, 2018 - 2027F

6.1.3 Nigeria Diesel Genset Market Revenues & Volume, By 5 - 75 KVA, 2018 - 2027F

6.1.4 Nigeria Diesel Genset Market Revenues & Volume, By 75.1 - 375 KVA, 2018 - 2027F

6.1.5 Nigeria Diesel Genset Market Revenues & Volume, By 375.1 - 750 KVA, 2018 - 2027F

6.1.6 Nigeria Diesel Genset Market Revenues & Volume, By 750.1 - 1000 KVA, 2018 - 2027F

6.1.7 Nigeria Diesel Genset Market Revenues & Volume, By Above 1000 KVA, 2018 - 2027F

6.2 Nigeria Diesel Genset Market, By Application

6.2.1 Overview and Analysis

6.2.2 Nigeria Diesel Genset Market Revenues & Volume, By Residential, 2018 - 2027F

6.2.3 Nigeria Diesel Genset Market Revenues & Volume, By Commercial , 2018 - 2027F

6.2.4 Nigeria Diesel Genset Market Revenues & Volume, By Industrial, 2018 - 2027F

6.2.5 Nigeria Diesel Genset Market Revenues & Volume, By Transportation & Public Infrastructure, 2018 - 2027F

7 Nigeria Diesel Genset Market Import-Export Trade Statistics

7.1 Nigeria Diesel Genset Market Export to Major Countries

7.2 Nigeria Diesel Genset Market Imports from Major Countries

8 Nigeria Diesel Genset Market Key Performance Indicators

9 Nigeria Diesel Genset Market - Opportunity Assessment

9.1 Nigeria Diesel Genset Market Opportunity Assessment, By KVA, 2020 & 2027F

9.2 Nigeria Diesel Genset Market Opportunity Assessment, By Application, 2020 & 2027F

10 Nigeria Diesel Genset Market - Competitive Landscape

10.1 Nigeria Diesel Genset Market Revenue Share, By Companies, 2020

10.2 Nigeria Diesel Genset Market Competitive Benchmarking, By Operating and Technical Parameters

11 Company Profiles

  • Caterpillar Inc.
  • Cummins Inc.
  • Denyo Co, Ltd.
  • Honda Manufacturing (Nigeria), Ltd
  • JMG Limited.
  • Jubaili Bros Engineering Ltd.
  • Kirloskar Oil Engines Ltd.
  • Mikano International Ltd.
  • YorPower Ltd.

For more information about this report visit https://www.researchandmarkets.com/r/osu3uu


Contacts

ResearchAndMarkets.com
Laura Wood, Senior Press Manager
This email address is being protected from spambots. You need JavaScript enabled to view it.

For E.S.T Office Hours Call 1-917-300-0470
For U.S./CAN Toll Free Call 1-800-526-8630
For GMT Office Hours Call +353-1-416-8900

KANSAS CITY, Mo.--(BUSINESS WIRE)--CorEnergy Infrastructure Trust, Inc. (NYSE: CORR, CORRPrA) ("CorEnergy" or the "Company") today announced financial results for the third quarter, ended September 30, 2021.


Third Quarter 2021 and Recent Highlights

  • Reported consolidated revenue of $37.0 million for the three months ended September 30, 2021 including a nonrecurring $2.2 million pipeline measurement gain.
  • Average transported crude oil volumes increased 1.6% from second quarter.
  • Declared a third quarter 2021 Common Stock dividend of $0.05 per share and a 7.375% Series A Cumulative Redeemable Preferred Stock dividend of $0.4609375 per depositary share. Both dividends will be paid on November 30, 2021, to stockholders of record on November 16, 2021.

Management Commentary

“Production volumes improved slightly in the third quarter, as did volumes transported on Crimson's pipelines, but remained below pre-COVID levels primarily due to permitting constraints in California and producers electing to return capital to stakeholders,” said Dave Schulte, Chief Executive Officer. “Since the crude production rebound and additional commercial opportunities did not materialize as quickly as anticipated, management is reducing our outlook for the back half of 2021 but believe we will continue to earn and pay our $0.20 annualized common dividend. When these constraints are relaxed, current crude prices make underlying production economics attractive, potentially leading to additional volume growth.”

“As a result of the shareholder vote, a substantial portion of the equity used in the Crimson and internalization transactions is held by management and subordinated to our common shares, demonstrating our confidence in the long-term financial performance of the business. We believe that CorEnergy has become an industry leading platform to own infrastructure assets, including energy transition opportunities, providing stockholders with dividend stability and prospects for modest long-term growth.”

Third Quarter Performance Summary

Third quarter 2021 reflects full impact of the activity from Crimson. Third quarter financial highlights are as follows:


For the Three Months Ended


September 30, 2021


Per Share


Total3

Basic

Diluted

Net Income (Attributable to Common Stockholders)

$

376,156

$

0.02

$

0.02

Net Cash Provided by Operating Activities

$

7,879,944


Adjusted Net Income1,3

$

6,116,491


Cash Available for Distribution (CAD)1,3

$

3,165,203


Adjusted EBITDA2,3

$

13,265,903


Dividends Declared to Common Stockholders


$

0.05


1 Adjusted Net Income excludes special items of $213 thousand which are transaction costs; however CAD has not been so adjusted. Reconciliations of Adjusted Net Income and CAD, as presented, to Net Income (Loss) and Net Cash Provided by Operating Activities are included at the end of this press release. See Note 1 below for additional information.

2 Adjusted EBITDA excludes special items of $213 thousand which are transaction costs. Reconciliation of Adjusted EBITDA, as presented, to Net Income (Loss) is included at the end of this press release. See Note 2 below for additional information.

3 Our third quarter results include a $2.2 million pipeline measurement gain which is not recurring. Over time, we expect the measurement gains and losses to cancel out.

Business Development Activities

CorEnergy maintains an active pipeline of business development opportunities, including traditional infrastructure and potential-alternative uses for its rights of way. The Company closely evaluates potential opportunities to ensure alignment with REIT qualifying business activities. CorEnergy has identified multiple opportunities for negotiated transactions that could expand the Company's market reach or REIT qualifying revenue sources. The Company will continue to prudently advance these opportunities.

Outlook

We have reduced our previously provided outlook for the second half of 2021 to annualized EBITDA of $42-44 million (excluding the $2.2 million nonrecurring measurement gain) as a result of current market conditions, including natural gas cost for heating, plus the impact of the pipeline shut-in due to the off-shore oil spill in California. The Company expects to provide its 2022 outlook no later than in connection with the filing of its Form 10-K for 2021.

Dividend and Distribution Declarations

The Company currently expects all of its 2021 Common Stock and Preferred Stock dividends will be characterized as Return of Capital for tax purposes.

Common Stock: A third quarter 2021 dividend of $0.05 per share was declared for CorEnergy's common stock. The dividend will be paid on November 30, 2021, to stockholders of record on November 16, 2021.

Preferred Stock: For the Company's 7.375% Series A Cumulative Redeemable Preferred Stock, a cash dividend of $0.4609375 per depositary share was declared. The preferred stock dividend, which equates to an annual dividend payment of $1.84375 per depositary share, will be paid on November 30, 2021, to stockholders of record on November 16, 2021.

Class A-1 Units: Pursuant to the terms of the Crimson transaction, the holders of Crimson Class A-1 Units received a cash distribution of $0.4609375 per unit based on the Company’s declared Series A Preferred dividend.

Class A-2 and Class A-3 Units: Pursuant to the terms of the Crimson transaction, the holders of Crimson Class A-2 and Class A-3 Units did not receive a cash distribution this quarter, since no dividend was declared on the underlying Class B Common Stock.

Third Quarter Results Call

CorEnergy will host a conference call on Tuesday, November 9, 2021 at 10:00 a.m. Central Time to discuss its financial results. Please dial into the call at +1-201-689-8035 at least five minutes prior to the scheduled start time. The call will also be webcast in a listen-only format. A link to the webcast will be accessible at corenergy.reit.

A replay of the call will be available until 10:00 a.m. Central Time on December 9, 2021, by dialing +1-919-882-2331. The Conference ID is 40743. A webcast replay of the conference call will also be available on the Company’s website, corenergy.reit.

About CorEnergy Infrastructure Trust, Inc.

CorEnergy Infrastructure Trust, Inc. (NYSE: CORR, CORRPrA) is a real estate investment trust that owns and operates or leases regulated natural gas transmission and distribution lines and crude oil gathering, storage and transmission pipelines and associated rights-of-way. For more information, please visit corenergy.reit.

Forward-Looking Statements

This press release contains certain statements that may include "forward-looking statements" within the meaning of Section 27A of the Securities Act of 1933 and Section 21E of the Securities Exchange Act of 1934. All statements, other than statements of historical fact, included herein are "forward-looking statements." Although CorEnergy believes that the expectations reflected in these forward-looking statements are reasonable, they do involve assumptions, risks and uncertainties, and these expectations may prove to be incorrect. Actual results could differ materially from those anticipated in these forward-looking statements as a result of a variety of factors, including, among others, failure to realize the anticipated benefits of the Crimson transaction; the risk that CPUC approval is not obtained, is delayed or is subject to unanticipated conditions that could adversely affect CorEnergy or the expected benefits of the Crimson transaction; risks related to the uncertainty of the projected financial information with respect to Crimson, and those factors discussed in CorEnergy’s reports that are filed with the Securities and Exchange Commission. You should not place undue reliance on these forward-looking statements, which speak only as of the date of this press release. Other than as required by law, CorEnergy does not assume a duty to update any forward-looking statement. In particular, any distribution paid in the future to our stockholders will depend on the actual performance of CorEnergy, its costs of leverage and other operating expenses and will be subject to the approval of CorEnergy’s Board of Directors and compliance with leverage covenants.

Notes

1 Management uses CAD as a measure of long-term sustainable performance. Adjusted Net Income and CAD are non-GAAP measures. Adjusted Net Income represents net income (loss) adjusted for gain on sale of equipment and transaction-related costs. CAD represents Adjusted Net Income adjusted for depreciation, amortization and ARO accretion (cash flows) and deferred tax expense (benefit) less transaction costs; maintenance capital expenditures; preferred dividend requirements and mandatory debt amortization. Reconciliations of Adjusted Net Income and CAD to Net Income (Loss) and Net Cash Provided By Operating Activities are included in the additional financial information attached to this press release.

2 Management uses Adjusted EBITDA as a measure of operating performance. Adjusted EBITDA represents net income (loss) adjusted for items such as gain on sale of equipment; and transaction-related costs. Adjusted EBITDA is further adjusted for depreciation, amortization and ARO accretion expense; income tax expense (benefit) and interest expense. The reconciliation of Adjusted EBITDA to Net Income (Loss) is included in the additional financial information attached to this press release.

Consolidated Balance Sheets


September 30, 2021

December 31, 2020

Assets

(Unaudited)


Property and equipment, net of accumulated depreciation of $32,592,641 and $22,580,810 (Crimson VIE: $341,422,699, and $0, respectively)

$

445,250,237


$

106,224,598


Leased property, net of accumulated depreciation of $247,893 and $6,832,167


1,278,135


64,938,010


Financing notes and related accrued interest receivable, net of reserve of $600,000 and $600,000


1,078,072


1,209,736


Cash and cash equivalents (Crimson VIE: $4,129,699 and $0, respectively)


15,091,957


99,596,907


Accounts and other receivables (Crimson VIE: $11,426,137 and $0, respectively)


14,573,047


3,675,977


Due from affiliated companies (Crimson VIE: $953,806 and $0, respectively)


953,806


Deferred costs, net of accumulated amortization of $250,564 and $2,130,334


891,783


1,077,883


Inventory (Crimson VIE: $3,229,161 and $0, respectively)


3,342,111


87,940


Prepaid expenses and other assets (Crimson VIE: $5,159,383 and $0, respectively)


10,550,792


2,054,804


Operating right-of-use assets (Crimson VIE: $5,950,501 and $0, respectively)


6,433,505


85,879


Deferred tax asset, net


4,060,239


4,282,576


Goodwill


16,210,020


1,718,868


Total Assets

$

519,713,704


$

284,953,178


Liabilities and Equity


Secured credit facilities, net of deferred financing costs of $1,427,667 and $0

$

102,572,333


$


Unsecured convertible senior notes, net of discount and debt issuance costs of $2,548,595 and $3,041,870


115,501,404


115,008,130


Asset retirement obligation


8,762,579


Accounts payable and other accrued liabilities (Crimson VIE: $14,416,975 and $0, respectively)


20,901,358


4,628,847


Management fees payable


971,626


Income tax liability


33,027


Due to affiliated companies (Crimson VIE: $765,228 and $0, respectively)


765,228


Operating lease liability (Crimson VIE: $5,826,885 and $0, respectively)


6,281,014


56,441


Unearned revenue (Crimson VIE $315,000 and $0, respectively)


6,001,622


6,125,728


Total Liabilities

$

252,055,986


$

135,553,351


Commitments and Contingencies


Equity


Series A Cumulative Redeemable Preferred Stock 7.375%, $129,525,675 and $125,270,350 liquidation preference ($2,500 per share, $0.001 par value), 10,000,000 authorized; 51,810 and 50,108 issued and outstanding at September 30, 2021 and December 31, 2020, respectively

$

129,525,675


$

125,270,350


Common stock, non-convertible, $0.001 par value; 14,866,799 and 13,651,521 shares issued and outstanding at September 30, 2021 and December 31, 2020, respectively (100,000,000 shares authorized)


14,866


13,652


Class B Common Stock, $0.001 par value; 683,761 and 0 shares issued and outstanding at September 30, 2021 and December 31, 2020, respectively (11,896,100 shares authorized)


684


Additional paid-in capital


341,331,070


339,742,380


Retained deficit


(324,749,301

)


(315,626,555

)

Total CorEnergy Equity


146,122,994


149,399,827


Non-controlling interest (Crimson)


121,534,724


Total Equity


267,657,718


149,399,827


Total Liabilities and Equity

$

519,713,704


$

284,953,178


Consolidated Statements of Operations (Unaudited)


For the Three Months Ended


September 30, 2021

September 30, 2020

Revenue


Transportation and distribution revenue

$

34,286,394


$

4,573,155


Pipeline loss allowance subsequent sales


2,124,581


Lease revenue


32,915


20,126


Other revenue


584,992


32,099


Total Revenue


37,028,882


4,625,380


Expenses


Transportation and distribution expenses


16,089,414


1,438,443


Pipeline loss allowance subsequent sales cost of revenue


2,718,038


General and administrative


5,156,087


2,793,568


Depreciation, amortization and ARO accretion expense


3,690,856


2,169,806


Total Expenses


27,654,395


6,401,817


Operating Income (Loss)

$

9,374,487


$

(1,776,437

)

Other Income (Expense)


Other income

$

4,040


$

29,654


Interest expense


(3,351,967

)


(2,247,643

)

Total Other Expense


(3,347,927

)


(2,217,989

)

Income (Loss) before income taxes


6,026,560


(3,994,426

)

Taxes


Current tax benefit


(6,927

)


(2,431

)

Deferred tax expense (benefit)


113,516


(72,897

)

Income tax expense (benefit), net


106,589


(75,328

)

Net income (Loss)


5,919,971


(3,919,098

)

Less: Net income attributable to non-controlling interest


3,155,685


Net income (Loss) attributable to CorEnergy Stockholders

$

2,764,286


$

(3,919,098

)

Preferred dividend requirements


2,388,130


2,309,672


Net income (loss) attributable to Common Stockholders

$

376,156


$

(6,228,770

)


Earnings (loss) Per Common Share:


Basic

$

0.02


$

(0.46

)

Diluted

$

0.02


$

(0.46

)

Weighted Average Shares of Common Stock Outstanding:


Basic


15,426,226


13,651,521


Diluted


15,426,226


13,651,521


Dividends declared per share

$

0.050


$

0.050


Consolidated Statements of Cash Flows (Unaudited)


For the Nine Months Ended


September 30, 2021

September 30, 2020

Operating Activities


Net loss

$

(2,346,883

)

$

(303,395,899

)

Adjustments to reconcile net loss to net cash provided by operating activities:


Deferred income tax, net


222,337


225,628


Depreciation, amortization and ARO accretion


11,530,460


12,441,775


Loss on impairment of leased property


140,268,379


Loss on impairment and disposal of leased property


5,811,779


146,537,547


Loss on termination of lease


165,644


458,297


Deferred rent receivable write-off, noncash


30,105,820


(Gain) loss on extinguishment of debt


861,814


(11,549,968

)

Non-cash lease expense


373,847


Gain on sale of equipment


(16,508

)


(3,542

)

Changes in assets and liabilities:


Deferred rent receivable


(247,718

)

Accounts and other receivables


702,251


1,040,064


Financing note accrued interest receivable


(8,780

)


(11,293

)

Inventory


(1,572,534

)


Prepaid expenses and other assets


(2,409,857

)


(1,056,726

)

Due from affiliated companies, net


(188,578

)


Management fee payable


(971,626

)


(700,194

)

Accounts payable and other accrued liabilities


987,899


(2,551,374

)

Income tax liability


33,027


Operating lease liability


(496,900

)


Unearned revenue


(439,106

)


(838,422

)

Net cash provided by operating activities


12,238,286


10,722,374


Investing Activities


Acquisition of Crimson Midstream Holdings, net of cash acquired


(69,002,053

)


Acquisition of Corridor InfraTrust Management, net of cash acquired


952,487


Purchases of property and equipment, net


(15,024,412

)


(885,711

)

Proceeds from sale of property and equipment


97,210


7,500


Proceeds from insurance recovery


60,153


Principal payment on financing note receivable


113,595


43,333


Decrease in financing note receivable


26,849


Net cash used in investing activities


(82,776,171

)


(834,878

)

Financing Activities


Debt financing costs


(2,735,922

)


Repurchases of Series A preferred stock


(161,997

)

Dividends paid on Series A preferred stock


(7,007,474

)


(6,933,124

)

Dividends paid on Common Stock


(1,799,268

)


(11,603,792

)

Common stock issued under director's compensation plan


22,500


Cash paid for maturity of convertible notes


(1,676,000

)

Cash paid for repurchase of convertible notes


(1,316,250

)

Cash paid for settlement of Pinedale Secured Credit Facility


(3,074,572

)

Distributions to non-controlling interest


(1,446,901

)


Advances on revolving line of credit


19,000,000


Payments on revolving line of credit


(16,000,000

)


Principal payments on Crimson secured credit facility


(4,000,000

)


Principal payments on secured credit facilities


(1,764,000

)

Net cash used in financing activities

$

(13,967,065

)

$

(26,529,735

)

Net change in Cash and Cash Equivalents

$

(84,504,950

)

$

(16,642,239

)

Cash and Cash Equivalents at beginning of period


99,596,907


120,863,643


Cash and Cash Equivalents at end of period

$

15,091,957


$

104,221,404


Supplemental Disclosure of Cash Flow Information


Interest paid

$

10,206,280


$

9,066,335


Income taxes paid (net of refunds)


(635,730

)


(466,382

)


Non-Cash Investing Activities


Proceeds from sale of leased property provided directly to secured lender

$


$

18,000,000


In-kind consideration for the Grand Isle Gathering System provided as partial consideration for the Crimson Midstream Holdings acquisition


48,873,169


Crimson Credit Facility assumed and refinanced in connection with the Crimson Midstream Holdings acquisition


105,000,000


Equity consideration attributable to non-controlling interest holder in connection with the Crimson Midstream Holdings acquisition


116,205,762


Purchases of property, plant and equipment in accounts payable and other accrued liabilities


313,859


Series A preferred stock issued due to internalization transaction


4,245,112


Common Stock issued due to internalization transaction


7,096,153


Class B Common Stock issued due to internalization transaction


3,288,890


Non-Cash Financing Activities


Change in accounts payable and accrued expenses related to debt financing costs

$

235,198


$


Common Stock issued upon exchange and conversion of convertible notes


419,129


Proceeds from sale of leased property used in settlement of Pinedale Secured Credit Facility


(18,000,000

)

Crimson A-2 Units dividends payment in kind


610,353


Non-GAAP Financial Measurements (Unaudited)

The following table presents a reconciliation of Net Income (Loss), as reported in the Consolidated Statements of Operations, to Adjusted Net Income (Loss) and CAD:


For the Three Months Ended


September 30, 2021

September 30, 2020

Net Income (loss)

$

5,919,971


$

(3,919,098

)

Add:


Gain on the sale of equipment


(16,508

)


Transaction costs


213,028


946,817


Adjusted Net Income (Loss), excluding special items


6,116,491


(2,972,281

)

Add:


Depreciation, amortization and ARO accretion (Cash Flows)


4,102,916


2,477,867


Deferred tax expense (benefit)


113,516


(72,897

)

Less:


Transaction costs


213,028


946,817


Maintenance capital expenditures


1,757,350


Preferred dividend requirements - Series A


2,388,130


2,309,672


Preferred dividend requirements - Non-controlling interest


809,212


Mandatory debt amortization

$

2,000,000


$


Cash Available for Distribution (CAD)

$

3,165,203


$

(3,823,800

)

The following table reconciles net cash provided by operating activities, as reported in the Consolidated Statements of Cash Flows to CAD:


For the Three Months Ended


September 30, 2021

September 30, 2020

Net cash provided by (used in) operating activities

$

7,879,944


$

(5,699,427

)

Changes in working capital


2,174,551


4,185,299


Non-cash lease expense


65,400


Maintenance capital expenditures


(1,757,350

)


Preferred dividend requirements


(2,388,130

)


(2,309,672

)

Preferred dividend requirements - non-controlling interest


(809,212

)


Mandatory debt amortization included in financing activities

$

(2,000,000

)

$


Cash Available for Distribution (CAD)


3,165,203


(3,823,800

)


Other Special Items:


Transaction costs

$

213,028


$

946,817


Other Cash Flow Information:


Net cash used in investing activities


(4,708,954

)


(800,567

)

Net cash used in financing activities


(5,774,491

)


(2,992,248

)

The following table presents a reconciliation of Net Income (Loss), as reported in the Consolidated Statements of Operations, to Adjusted EBITDA:


For the Three Months Ended


September 30, 2021

September 30, 2020

Net Income (loss)

$

5,919,971


$

(3,919,098

)

Add:


Gain on the sale of equipment


(16,508

)


Transaction costs


213,028


946,817


Depreciation, amortization and ARO accretion expense


3,690,856


2,169,806


Income tax expense (benefit), net


106,589


(75,328

)

Interest expense, net


3,351,967


2,247,643


Adjusted EBITDA

$

13,265,903


$

1,369,840


Source: CorEnergy Infrastructure Trust, Inc.


Contacts

CorEnergy Infrastructure Trust, Inc.
Investor Relations
Debbie Hagen or Matt Kreps
877-699-CORR (2677)
This email address is being protected from spambots. You need JavaScript enabled to view it.

SAN FRANCISCO--(BUSINESS WIRE)--The Business Council on Climate Change (BC3), a multi-sector partnership dedicated to incubating, scaling, and sharing world-leading solutions to address climate change, has launched a major new effort to catalyze carbon removal investments by the corporate sector.


Carbon removals--the removal or sequestration of carbon from the atmosphere through natural or engineered solutions--are an increasingly important strategy alongside emissions reductions for meeting global climate goals. Carbon removals can also deliver broader ecological benefits and bring socio-economic advantages to local communities, including those that are most impacted by climate change and ecosystem loss.

“We need bold and immediate action to meet the urgency of the climate crisis,” said BC3 Executive Director Maura McKnight. “Collaboration by the corporate sector in the growing carbon removals space can spur the innovation needed to bring it to scale and maximize its impact.”

The Science Based Targets initiative (SBTi), in launching its new Net-Zero Corporate Standard last week, emphasized that companies will need to neutralize residual emissions through carbon removals to reach net zero. A number of corporate climate leaders, including several BC3 members, have already included it in their strategies, but the market is complex and immature, and many companies are just starting to explore it. In September, BC3 released a Quick Start Guide to Carbon Removals, in partnership with member companies Atlassian and Autodesk and subject experts Carbon180 and Anthesis, to help companies learn about removals and the market, and kick-start their investments.

BC3, which has a history of bringing members together to create innovative aggregate purchasing for solar energy and invest in soil carbon sequestration research, is also convening a carbon removals buyers forum. The forum brings together members, outside experts, and other companies interested in expanding their sustainability investments to foster collaborative learning, problem solving and action. Coordinated corporate investments and inclusion of carbon removals in companies’ sustainability strategies will send a strong “demand signal” from the corporate sector to help scale the removals market and strengthen emerging companies and technologies.

“​​BC3 members have the critical opportunity to launch the carbon removal industry with early investments that will bring down the cost for everyone, leading to a prosperous economy that removes more carbon than it emits,” said Peter Minor, Director of Science & Innovation at Carbon180. “Carbon180 looks forward to working with early leaders like BC3 member companies, and building the policy landscape needed to support them.”

“In contributing to this effort, Anthesis is delighted for the opportunity to support newcomers to the carbon removal space to quickly get up to speed so they can focus their time and energy on developing meaningful investment strategies,” said Emma Armstrong, Executive Director, Anthesis North America. “This is well aligned with Anthesis’ mission to help organizations to activate sustainable performance.”


Contacts

Maura McKnight
This email address is being protected from spambots. You need JavaScript enabled to view it.
415.350.7652

  • Investment will advance development of a novel methane pyrolysis technology platform to produce cleaner and lower cost turquoise hydrogen
  • Compared to the traditional steam methane reforming process used for producing industrial scale hydrogen, Ekona’s novel methane pyrolysis process can produce hydrogen with drastically lower carbon dioxide emissions
  • Technology applicable for multiple markets including refineries, ammonia or chemical plants, as well as natural gas transmission and distribution companies looking to reduce their GHG emissions footprint

HOUSTON & VANCOUVER, British Columbia--(BUSINESS WIRE)--Baker Hughes (NYSE: BKR), an energy technology company, has announced an investment in Ekona Power Inc., a growth stage company developing novel turquoise hydrogen production technology. Through its investment, Baker Hughes will enhance its broader hydrogen and natural gas decarbonization solutions portfolio, further contributing to the energy transition.


Turquoise hydrogen is made from methane using pyrolysis, also known as splitting, or cracking. Ekona’s methane pyrolysis solution uses combustion and high-speed gas dynamics in a reactor to separate feedstock methane into hydrogen and solid carbon, drastically reducing carbon dioxide emissions versus the traditional and prevalent steam methane reforming process. The innovative solution is designed to easily integrate with standard equipment for natural gas and hydrogen applications including carbon separation and hydrogen purification, thus simplifying industrial process integration.

The two companies will join efforts to accelerate the scale up and industrialization of the technology by identifying suitable pilot projects and leveraging Baker Hughes’ leading turbomachinery portfolio as well as established technical expertise in providing modular and scalable solutions for global hydrogen and natural gas projects.

“This strategic investment further demonstrates our commitment to advancing new energy frontiers by accelerating the pace at which novel technologies are being brought to market,” said Rod Christie, executive vice president of Turbomachinery & Process Solutions at Baker Hughes. “Ekona Power’s methane pyrolysis platform for the production of cleaner and lower cost turquoise hydrogen builds on our growing and diverse portfolio of decarbonization technologies, including blue and green hydrogen, CCUS and emissions management solutions. Through the adoption of this technology, the industry can leverage existing and abundant natural gas reserves to produce lower carbon hydrogen and accelerate its use across the energy value chain.”

“At Ekona, we are deeply committed to delivering cleaner energy solutions that cost-effectively address industry pain points. Our innovative technology has the potential to produce hydrogen at costs on par with conventional steam methane reformers, while drastically reducing greenhouse gas emissions. In addition, our solution isn’t reliant on CO2 sequestration, so it has the potential to be quickly and broadly deployed across various industries and market regions,” Chris Reid, chief executive officer of Ekona Power Inc. “This important investment from Baker Hughes who is an established global player is a key step to commercializing our technology.”

Baker Hughes will take an approximately 20% stake in Ekona to help advance new project development and commercialization. Baker Hughes will also assume a seat on Ekona’s Board of Directors. Fort Capital Partners acted as advisors to Ekona Power. Along with lead investor Baker Hughes, Ekona has been supported by numerous Canadian Federal and Provincial partners, including the BC Innovative Clean Energy (ICE) Fund, National Research Council (NRC), Natural Resources Canada (NRCan) Breakthrough Energy Solutions Canada (BESC) Program, Emissions Reduction Alberta (ERA), the Natural Gas Innovation Fund (NGIF) and Pacific Economic Development Canada. In addition, BDC Capital’s Cleantech Practice invested in 2020 to help fund Ekona’s technology development program.

About Baker Hughes:

Baker Hughes (NYSE: BKR) is an energy technology company that provides solutions for energy and industrial customers worldwide. Built on a century of experience and with operations in over 120 countries, our innovative technologies and services are taking energy forward – making it safer, cleaner and more efficient for people and the planet. Visit us at bakerhughes.com.

About Ekona Power Inc.

Ekona is a Vancouver-based venture established by Evok Innovations and Innovative Breakthrough Energy Technologies. Ekona is developing a revolutionary technology that transforms the way we produce clean hydrogen. Our solution is an innovative and low-cost methane pyrolysis platform that converts natural gas into hydrogen and solid carbon, virtually eliminating greenhouse gas emissions. Visit us at ekonapower.com


Contacts

For Baker Hughes:
Media Relations
Stephanie Price
+1 281 605 8399
This email address is being protected from spambots. You need JavaScript enabled to view it.

Investor Relations
Jud Bailey
+1 281-809-9088
This email address is being protected from spambots. You need JavaScript enabled to view it.

For Ekona Power Inc.:
Anuneet Makan
This email address is being protected from spambots. You need JavaScript enabled to view it.
+ 1 604-339-6671

Bitmain Announces High Efficiency, Carbon Credit Initiative ANTMINER S19 XP as Bitcoin Reaches All Time High

DENVER--(BUSINESS WIRE)--Crusoe Energy Systems Inc. (Crusoe), a Denver-based energy technology company focused on powering computation with stranded energy resources, is proud to receive allocations of the new ANTMINER S19 XP that has a hashrate of 140 TH, which improves the power efficiency by 27% compared to the previous model from premier ASIC manufacturer Bitmain Technologies (Bitmain). This selected batch of the newest release of Bitcoin mining hardware was designed to achieve market leading environmental performance through best in class energy efficiency as well as a carbon offset program to neutralize emissions from the manufacturing process and the first year of operation. When combined with Crusoe’s computing operations powered by otherwise wasted and stranded energy resources like flaring natural gas, Bitmain and Crusoe aim to jointly deliver the world’s most climate-optimized Bitcoin infrastructure and operations.


Bitmain has made initial allocations of the ANTMINER S19 XP 140TH available to a limited number of preferred customers selected on the basis of commitment to environmental operating practices. Crusoe is proud to be among the first customers to access Bitmain’s cutting edge hardware on this basis. Crusoe’s selection for the first production allocations of the ANTMINER S19 XP 140TH, Bitmain’s most powerful ASIC to date, was announced at the World Digital Mining Summit held in Dubai today when Bitmain publicly announced the new model ANTMINER S19 XP 140TH. Bitmain announced that it had purchased carbon credits to offset emissions incurred during production and the first year of operation of these selected units. The resulting hardware is the first carbon credit initiative miners available from the manufacturer. Initial production will have limited availability and is being offered only to five of Bitmain’s longstanding and strategic partners.

Crusoe CEO and Co-Founder, Chase Lochmiller, said, “It is exciting to see the industry rapidly evolving towards environmentally-oriented ways of thinking and operating. Bitcoin mining has historically been conflated with carbon emissions. We believe mining can be leveraged as a tool to help reduce emissions and also accelerate the energy transition, providing critical infrastructure for both the bitcoin network and the future of energy infrastructure. It's great to have partners like Bitmain that have passion for our long term mission to align the future of computing infrastructure with the future of the climate.”

Crusoe mines cryptocurrency in custom engineered modular, mobile data centers. The data centers are deployed directly to energy sources that are otherwise wasted, such as flaring natural gas. The company’s patented Digital Flare Mitigation® technology provides an emission reduction solution by utilizing otherwise wasted flare gas, one of the largest sources of emission from oil production, to power mining operations onsite. In this process, Crusoe is able to significantly reduce uncombusted methane emissions and achieve an estimated 63% reduction in CO2-equivalent emissions compared to continued flaring. Crusoe has prevented more than 1 billion cubic feet of gas flaring and has reduced emissions equivalent to hundreds of thousands of cars.

Irene Gao, Bitmain BD Director of NCSA Region said, “After many years of strategic and long standing partnership, Bitmain is proud to deliver Crusoe early access to the ANTMINER S19 XP, our most energy efficient, powerful and carbon mitigated systems ever. Bitmain is committed to innovation in all regards ranging from design to manufacturing and production. As part of our commitment to positive environmental change, Bitmain is constantly looking for ways to improve our product and the industry as a whole and recognizes the value in offsetting emissions in all areas of mining. Crusoe is a leader in this regard, and we are pleased to partner with them going forward.”

Bitmain is the world leader in ASIC manufacturing for the cryptocurrency industry. Bitmain exhibited their newest generation mining hardware at the World Digital Mining Summit hosted at the Atlantis hotel in Dubai.

About Crusoe Energy Systems Inc.

Crusoe Energy is on a mission to unlock value in stranded energy resources through the power of computation. The company aims to align the long term interests of the climate with the future of global computing infrastructure. As data centers consume an exponentially growing power footprint to deliver technology to all connected devices, we are inspired by making sure that the energy meeting that demand is sourced in an environmentally responsible fashion. Crusoe colocates mobile data centers with stranded energy resources, like flare gas and underloaded renewables, to deliver low-cost, carbon-negative distributed computing solutions. Island Cloud is a managed cloud services platform powered by Crusoe that enables climate-friendly innovation in computationally intensive fields including artificial intelligence, graphics rendering and computational biology.

Bitmain Technologies Limited

Founded in 2013, Bitmain transforms computing by building industry-defining technology in cryptocurrency and blockchain. Bitmain leads the industry in the production of integrated circuits for cryptocurrency mining, as well as mining hardware under the ANTMINER brand. Bitmain technology supports a wide range of blockchain platforms and startups.

More Information:

Please reach out to This email address is being protected from spambots. You need JavaScript enabled to view it. or visit www.crusoeenergy.com to learn more, and follow Crusoe on Linkedin and Twitter.


Contacts

Cully Cavness
720-795-6484
This email address is being protected from spambots. You need JavaScript enabled to view it.

Kaizen Clean Energy Secures Investment To Fund the Manufacturing of Hydrogen Generators To Displace Aging & Unreliable Solutions For EV Charging, Hydrogen Distribution, & Microgrids


HOUSTON--(BUSINESS WIRE)--#cleanenergy--Kaizen Clean Energy (“KCE”), announced today it has secured funding to accelerate commercial deployment of its hydrogen generators for distributed Battery Electric Vehicle (EV) charging, hydrogen Fuel Cell Electric Vehicles (FCEVs) fueling and standby power generation in the United States.

The funding positions KCE to deliver hydrogen generators to its customers in the second half of 2022.

Eric Smith, Co-CEO & Chief Commercial Officer said, “Last week’s passing of the US Infrastructure Bill underscores the bipartisan need for a solution that provides clean, reliable, and affordable distributed energy. KCE’s Hydrogen Generators help our clients accelerate their Zero Emission Vehicle deployments without having to rely on aging electric grids and traditional hydrogen solutions that lack reliable supply, don’t scale, and require capital-intensive infrastructure. Our funding allows clients the ability to secure leases of KCE’s Hydrogen Generators to show the versatility and economic benefits of this proven technology.”

KCE’s Hydrogen Generator reforms methanol to deliver on-demand ISO Grade hydrogen at the point of use, eliminating the high cost of transporting and storing compressed or cryogenic hydrogen. Clients can leverage our hydrogen generators and existing methanol bunkering across the U.S. to lower their delivered cost of hydrogen and utilize growing renewable methanol production to scale their Carbon Intensity to meet their requirements.

Stanfield and Dupre, Kaizen Clean Energy’s General Counsel, supported the financial transaction.

About Kaizen Clean Energy:

Founded in 2021, KCE is a future fuels-focused company, headquartered in Houston, TX, specializing in the design, development, and manufacture of hydrogen generators for distributed power generation and hydrogen production.

For more information about Kaizen Clean Energy, please visit www.kaizencleanenergy.com.


Contacts

Eric Smith
Co-CEO
Kaizen Clean Energy
Phone: +1.346.337.7788
E-mail: This email address is being protected from spambots. You need JavaScript enabled to view it.

TULSA, Okla.--(BUSINESS WIRE)--NGL Energy Partners LP (NYSE:NGL) (“NGL,” “our,” “we,” or the “Partnership”) today reported its second quarter Fiscal 2022 results. Highlights for the quarter include:


  • Loss from continuing operations for the second quarter of Fiscal 2022 of $1.2 million, compared to income from continuing operations of $6.0 million for the second quarter of Fiscal 2021. Excluding losses on the disposal or impairment of assets, income from continuing operations for the second quarter of Fiscal 2022 was $12.5 million, compared to $11.9 million for the second quarter of Fiscal 2021
  • Adjusted EBITDA1 from continuing operations for the second quarter of Fiscal 2022 of $146.3 million, compared to $138.0 million for the second quarter of Fiscal 2021
  • Record quarterly Adjusted EBITDA of $87.4 million in the Water Solutions segment, a 43% increase versus the second quarter of Fiscal 2021
  • Produced water volumes processed increased approximately 37% versus the same period in the prior year, with volumes growing approximately 94,000 barrels per day, or 5.6%, versus the preceding quarter
  • Fiscal 2022 Adjusted EBITDA guidance of $570 million - $600 million and expected full year capital expenditures of approximately $115 million2

“Our Water Solutions segment achieved strong growth due to increased customer activities in the Delaware basin. Produced water volumes have grown meaningfully year-over-year and sequentially quarter-over-quarter. We expect water volumes to continue to grow for the foreseeable future. Operational free cash flow, reduction in working capital requirements and asset sale proceeds will be deployed to the balance sheet to reduce leverage,” stated Mike Krimbill, NGL’s CEO. “Our top priority is to reduce absolute debt and drive leverage below 4.75 times,” Krimbill concluded.

Quarterly Results of Operations

The following table summarizes operating income (loss) and Adjusted EBITDA from continuing operations by reportable segment for the periods indicated:


Quarter Ended


September 30, 2021


September 30, 2020


Operating
Income (Loss)


Adjusted
EBITDA


Operating
Income (Loss)


Adjusted
EBITDA


(in thousands)

Water Solutions


$

32,772


$

87,424


$

(13,277

)


$

61,047


Crude Oil Logistics


28,231


48,776


48,239


65,181


Liquids Logistics


11,461


18,465


14,338


21,257


Corporate and Other


(7,646

)


(8,404

)


(12,984

)


(9,514

)

Total


$

64,818


$

146,261


$

36,316


$

137,971


Water Solutions

The Partnership processed approximately 1.8 million barrels of water per day during the quarter ended September 30, 2021, a 37.3% increase when compared to approximately 1.3 million barrels of water per day processed during the quarter ended September 30, 2020, due to higher production volumes primarily in the Delaware Basin driven by the recovery in crude oil prices from the prior year.

Revenues from recovered crude oil, including the impact from realized skim oil hedges, totaled $19.3 million for the quarter ended September 30, 2021, an increase of $6.8 million from the prior year period. This was due to higher crude oil prices, larger amounts of skim oil recovered per barrel of water processed and increasing producer activity.

Operating expenses in the Water Solutions segment decreased to $0.26 per barrel compared to $0.27 per barrel in the comparative quarter last year primarily due to continued efforts to reduce operating costs per barrel along with higher produced water volumes processed.

Crude Oil Logistics

Operating income for the second quarter of Fiscal 2022 decreased compared to the second quarter of Fiscal 2021 primarily due to lower revenues related to the Grand Mesa Pipeline, which was primarily the result of the court-approved rejection of the Extraction transportation agreement (as part of its bankruptcy) as well as decreased production in the DJ Basin. During the three months ended September 30, 2021, financial volumes on the Grand Mesa Pipeline averaged approximately 80,000 barrels per day, compared to approximately 123,000 barrels per day for the three months ended September 30, 2020. For the quarter, our margins, excluding the impact of derivatives, benefited from higher crude oil prices which increased contracted rates with some producers.

Liquids Logistics

Operating income for the Liquids Logistics segment totaled $11.5 million, including a loss on the sale of a facility of $11.7 million, for the quarter ended September 30, 2021. Excluding the loss on the sale of the facility, operating income increased by $8.9 million compared to the quarter ended September 30, 2020, due to higher product margins, including the impact of derivatives.

Propane volumes decreased by approximately 72.4 million gallons, or 28.6%, compared to the quarter ended September 30, 2020, due to backwardation in the propane market and deferred purchases from customers. Butane volumes decreased by approximately 18.5 million gallons, or 12.9%, compared to the quarter ended September 30, 2020, due to the tight supply market as a result of decreased refinery runs and an increase in demand for exports.

Corporate and Other

Corporate and Other expenses decreased from the comparable prior year period primarily due to lower legal expenses.

Capitalization and Liquidity

Total liquidity (cash plus available capacity on our asset-based revolving credit facility) was approximately $207 million as of September 30, 2021. Borrowings on the Partnership’s revolving credit facility totaled approximately $146.0 million. The balance increase from March 31, 2021 was primarily due to increases in working capital balances driven by increased inventory volumes and higher commodity prices.

The Partnership is in compliance with all of its debt covenants and has no significant debt maturities before November 2023. The Partnership expects to generate operational free cash flow in Fiscal Year 2022, which will be utilized to repay outstanding indebtedness and improve leverage.

Second Quarter Conference Call Information

A conference call to discuss NGL’s results of operations is scheduled for 4:00 pm Central Time on Tuesday, November 9, 2021. Analysts, investors, and other interested parties may join the webcast via the event link: https://www.webcaster4.com/Webcast/Page/2808/43431 or by dialing (888) 506-0062 and providing access code: 646174. An archived audio replay of the call will be available for 14 days, which can be accessed by dialing (877) 481-4010 and providing replay passcode 43431.

Non-GAAP Financial Measures

NGL defines EBITDA as net income (loss) attributable to NGL Energy Partners LP, plus interest expense, income tax expense (benefit), and depreciation and amortization expense. NGL defines Adjusted EBITDA as EBITDA excluding net unrealized gains and losses on derivatives, lower of cost or net realizable value adjustments, gains and losses on disposal or impairment of assets, gains and losses on early extinguishment of liabilities, equity-based compensation expense, acquisition expense, revaluation of liabilities, certain legal settlements and other. NGL also includes in Adjusted EBITDA certain inventory valuation adjustments related to TransMontaigne Product Services, LLC (“TPSL”), our refined products business in the mid-continent region of the United States (“Mid-Con”) and our gas blending business in the southeastern and eastern regions of the United States (“Gas Blending”), which are included in discontinued operations, and certain refined products businesses within NGL’s Liquids Logistics segment, as discussed below. EBITDA and Adjusted EBITDA should not be considered as alternatives to net (loss) income, (loss) income from continuing operations before income taxes, cash flows from operating activities, or any other measure of financial performance calculated in accordance with GAAP, as those items are used to measure operating performance, liquidity or the ability to service debt obligations. NGL believes that EBITDA provides additional information to investors for evaluating NGL’s ability to make quarterly distributions to NGL’s unitholders and is presented solely as a supplemental measure. NGL believes that Adjusted EBITDA provides additional information to investors for evaluating NGL’s financial performance without regard to NGL’s financing methods, capital structure and historical cost basis. Further, EBITDA and Adjusted EBITDA, as NGL defines them, may not be comparable to EBITDA, Adjusted EBITDA, or similarly titled measures used by other entities.

Other than for certain businesses within NGL’s Liquids Logistics segment, for purposes of the Adjusted EBITDA calculation, NGL makes a distinction between realized and unrealized gains and losses on derivatives. During the period when a derivative contract is open, NGL records changes in the fair value of the derivative as an unrealized gain or loss. When a derivative contract matures or is settled, NGL reverses the previously recorded unrealized gain or loss and records a realized gain or loss. NGL does not draw such a distinction between realized and unrealized gains and losses on derivatives of certain businesses within NGL’s Liquids Logistics segment. The primary hedging strategy of these businesses is to hedge against the risk of declines in the value of inventory over the course of the contract cycle, and many of the hedges cover extended periods of time. The “inventory valuation adjustment” row in the reconciliation table reflects the difference between the market value of the inventory of these businesses at the balance sheet date and its cost, adjusted for the impact of seasonal market movements related to our base inventory and the related hedge. NGL includes this in Adjusted EBITDA because the unrealized gains and losses associated with derivative contracts associated with the inventory of this segment, which are intended primarily to hedge inventory holding risk and are included in net income, also affect Adjusted EBITDA. In NGL’s Crude Oil Logistics segment, they purchase certain crude oil barrels using the West Texas Intermediate (“WTI”) calendar month average (“CMA”) price and sell the crude oil barrels using the WTI CMA price plus the Argus CMA Differential Roll Component (“CMA Differential Roll”) per NGL’s contracts. To eliminate the volatility of the CMA Differential Roll, NGL entered into derivative instrument positions in January 2021 to secure a margin of approximately $0.20 per barrel on 1.5 million barrels per month from May 2021 through December 2023. Due to the nature of these positions, the cash flow and earnings recognized on a GAAP basis will differ from period to period depending on the current crude oil price and future estimated crude oil price which are valued utilizing third-party market quoted prices. NGL is recognizing in Adjusted EBITDA the gains and losses from the derivative instrument positions entered into in January 2021 to properly align with the physical margin NGL is hedging each month through the term of this transaction. This representation aligns with management’s evaluation of the transaction.

Distributable Cash Flow is defined as Adjusted EBITDA minus maintenance capital expenditures, income tax expense, cash interest expense, preferred unit distributions and other. Maintenance capital expenditures represent capital expenditures necessary to maintain the Partnership’s operating capacity. For the CMA Differential Roll transaction, as discussed above, we have included an adjustment to Distributable Cash Flow to reflect, in the period for which they relate, the actual cash flows for the positions that settled that are not being recognized in Adjusted EBITDA. Distributable Cash Flow is a performance metric used by senior management to compare cash flows generated by the Partnership (excluding growth capital expenditures and prior to the establishment of any retained cash reserves by the Board of Directors) to the cash distributions expected to be paid to unitholders. Using this metric, management can quickly compute the coverage ratio of estimated cash flows to planned cash distributions. This financial measure also is important to investors as an indicator of whether the Partnership is generating cash flow at a level that can sustain, or support an increase in, quarterly distribution rates. Actual distribution amounts are set by the Board of Directors.

Forward-Looking Statements

This press release includes “forward-looking statements.” All statements other than statements of historical facts included or incorporated herein may constitute forward-looking statements. Actual results could vary significantly from those expressed or implied in such statements and are subject to a number of risks and uncertainties. While NGL believes such forward-looking statements are reasonable, NGL cannot assure they will prove to be correct. The forward-looking statements involve risks and uncertainties that affect operations, financial performance, and other factors as discussed in filings with the Securities and Exchange Commission. Other factors that could impact any forward-looking statements are those risks described in NGL’s Annual Report on Form 10-K, Quarterly Reports on Form 10-Q, and other public filings. You are urged to carefully review and consider the cautionary statements and other disclosures made in those filings, specifically those under the heading “Risk Factors.” NGL undertakes no obligation to publicly update or revise any forward-looking statements except as required by law.

NGL provides Adjusted EBITDA guidance that does not include certain charges and costs, which in future periods are generally expected to be similar to the kinds of charges and costs excluded from Adjusted EBITDA in prior periods, such as income taxes, interest and other non-operating items, depreciation and amortization, net unrealized gains and losses on derivatives, lower of cost or net realizable value adjustments, gains and losses on disposal or impairment of assets, gains and losses on early extinguishment of liabilities, equity-based compensation expense, acquisition expense, revaluation of liabilities and items that are unusual in nature or infrequently occurring. The exclusion of these charges and costs in future periods will have a significant impact on the Partnership’s Adjusted EBITDA, and the Partnership is not able to provide a reconciliation of its Adjusted EBITDA guidance to net income (loss) without unreasonable efforts due to the uncertainty and variability of the nature and amount of these future charges and costs and the Partnership believes that such reconciliation, if possible, would imply a degree of precision that would be potentially confusing or misleading to investors.

About NGL Energy Partners LP

NGL Energy Partners LP, a Delaware limited partnership, is a diversified midstream energy company that transports, stores, markets and provides other logistics services for crude oil, natural gas liquids and other products and transports, treats and disposes of produced water generated as part of the oil and natural gas production process.

For further information, visit the Partnership’s website at www.nglenergypartners.com.

_______

1 See the “Non-GAAP Financial Measures” section of this release for the definition of Adjusted EBITDA and a discussion of this non-GAAP financial measure.

2 See the “Forward-Looking Statements” section of this release for more information.


NGL ENERGY PARTNERS LP AND SUBSIDIARIES

Unaudited Condensed Consolidated Balance Sheets

(in Thousands, except unit amounts)


September 30, 2021


March 31, 2021

ASSETS


CURRENT ASSETS:


Cash and cash equivalents

$

5,531


$

4,829


Accounts receivable-trade, net of allowance for expected credit losses of $2,257 and $2,192, respectively

863,228


725,943


Accounts receivable-affiliates

8,979


9,435


Inventories

319,895


158,467


Prepaid expenses and other current assets

140,434


109,164


Total current assets

1,338,067


1,007,838


PROPERTY, PLANT AND EQUIPMENT, net of accumulated depreciation of $844,605 and $776,279, respectively

2,524,287


2,706,853


GOODWILL

744,439


744,439


INTANGIBLE ASSETS, net of accumulated amortization of $532,901 and $517,518, respectively

1,170,468


1,262,613


INVESTMENTS IN UNCONSOLIDATED ENTITIES

21,029


22,719


OPERATING LEASE RIGHT-OF-USE ASSETS

133,868


152,146


OTHER NONCURRENT ASSETS

49,634


50,733


Total assets

$

5,981,792


$

5,947,341


LIABILITIES AND EQUITY


CURRENT LIABILITIES:


Accounts payable-trade

$

819,094


$

679,868


Accounts payable-affiliates

97


119


Accrued expenses and other payables

165,110


170,400


Advance payments received from customers

18,651


11,163


Current maturities of long-term debt

2,278


2,183


Operating lease obligations

45,456


47,070


Total current liabilities

1,050,686


910,803


LONG-TERM DEBT, net of debt issuance costs of $49,214 and $55,555, respectively, and current maturities

3,419,352


3,319,030


OPERATING LEASE OBLIGATIONS

87,388


103,637


OTHER NONCURRENT LIABILITIES

110,909


114,615


CLASS D 9.00% PREFERRED UNITS, 600,000 and 600,000 preferred units issued and outstanding, respectively

551,097


551,097


EQUITY:


General partner, representing a 0.1% interest, 129,724 and 129,724 notional units, respectively

(52,375

)


(52,189

)

Limited partners, representing a 99.9% interest, 129,593,939 and 129,593,939 common units issued and outstanding, respectively

448,501


582,784


Class B preferred limited partners, 12,585,642 and 12,585,642 preferred units issued and outstanding, respectively

305,468


305,468


Class C preferred limited partners, 1,800,000 and 1,800,000 preferred units issued and outstanding, respectively

42,891


42,891


Accumulated other comprehensive loss

(310

)


(266

)

Noncontrolling interests

18,185


69,471


Total equity

762,360


948,159


Total liabilities and equity

$

5,981,792


$

5,947,341


NGL ENERGY PARTNERS LP AND SUBSIDIARIES

Unaudited Condensed Consolidated Statements of Operations

(in Thousands, except unit and per unit amounts)


Three Months Ended September 30,


Six Months Ended September 30,


2021


2020


2021


2020

REVENUES:


Water Solutions


$

136,210


$

88,678


$

266,436


$

176,743


Crude Oil Logistics


554,830


466,841


1,108,454


742,880


Liquids Logistics


1,063,097


612,324


1,867,902


1,092,322


Other


315


628


Total Revenues


1,754,137


1,168,158


3,242,792


2,012,573


COST OF SALES:


Water Solutions


6,423


579


16,761


5,279


Crude Oil Logistics


498,089


386,771


1,035,346


604,328


Liquids Logistics


1,021,081


577,086


1,798,279


1,031,422


Other


454


908


Total Cost of Sales


1,525,593


964,890


2,850,386


1,641,937


OPERATING COSTS AND EXPENSES:


Operating


69,019


56,054


134,803


121,041


General and administrative


11,450


17,475


27,224


34,633


Depreciation and amortization


69,563


87,469


153,665


171,455


Loss on disposal or impairment of assets, net


13,694


5,954


81,230


17,976


Operating Income (Loss)


64,818


36,316


(4,516

)


25,531


OTHER INCOME (EXPENSE):


Equity in earnings of unconsolidated entities


434


501


646


790


Interest expense


(68,495

)


(46,935

)


(135,625

)


(90,896

)

Gain on early extinguishment of liabilities, net


1,071


13,747


1,122


33,102


Other income, net


730


1,585


1,979


2,620


(Loss) Income From Continuing Operations Before Income Taxes


(1,442

)


5,214


(136,394

)


(28,853

)

INCOME TAX BENEFIT


235


774


685


1,075


(Loss) Income From Continuing Operations


(1,207

)


5,988


(135,709

)


(27,778

)

Loss From Discontinued Operations, net of Tax


(153

)


(1,639

)

Net (Loss) Income


(1,207

)


5,835


(135,709

)


(29,417

)

LESS: NET INCOME ATTRIBUTABLE TO NONCONTROLLING INTERESTS


(330

)


(168

)


(768

)


(219

)

NET (LOSS) INCOME ATTRIBUTABLE TO NGL ENERGY PARTNERS LP


$

(1,537

)


$

5,667


$

(136,477

)


$

(29,636

)

NET LOSS FROM CONTINUING OPERATIONS ALLOCATED TO COMMON UNITHOLDERS


$

(27,236

)


$

(17,933

)


$

(187,128

)


$

(73,748

)

NET LOSS FROM DISCONTINUED OPERATIONS ALLOCATED TO COMMON UNITHOLDERS


$


$

(152

)


$


$

(1,637

)

NET LOSS ALLOCATED TO COMMON UNITHOLDERS


$

(27,236

)


$

(18,085

)


$

(187,128

)


$

(75,385

)

BASIC LOSS PER COMMON UNIT


Loss From Continuing Operations


$

(0.21

)


$

(0.14

)


$

(1.44

)


$

(0.57

)

Loss From Discontinued Operations, net of Tax


$


$


$


$

(0.01

)

Net Loss


$

(0.21

)


$

(0.14

)


$

(1.44

)


$

(0.58

)

DILUTED LOSS PER COMMON UNIT


Loss From Continuing Operations


$

(0.21

)


$

(0.14

)


$

(1.44

)


$

(0.57

)

Loss From Discontinued Operations, net of Tax


$


$


$


$

(0.01

)

Net Loss


$

(0.21

)


$

(0.14

)


$

(1.44

)


$

(0.58

)

BASIC WEIGHTED AVERAGE COMMON UNITS OUTSTANDING


129,593,939


128,771,715


129,593,939


128,771,715


DILUTED WEIGHTED AVERAGE COMMON UNITS OUTSTANDING


129,593,939


128,771,715


129,593,939


128,771,715


EBITDA, ADJUSTED EBITDA AND DISTRIBUTABLE CASH FLOW RECONCILIATION

(Unaudited)


The following table reconciles NGL’s net (loss) income to NGL’s EBITDA, Adjusted EBITDA and Distributable Cash Flow:


Three Months Ended September 30,


Six Months Ended September 30,


2021


2020


2021


2020


(in thousands)

Net (loss) income


$

(1,207

)


$

5,835


$

(135,709

)


$

(29,417

)

Less: Net income attributable to noncontrolling interests


(330

)


(168

)


(768

)


(219

)

Net (loss) income attributable to NGL Energy Partners LP


(1,537

)


5,667


(136,477

)


(29,636

)

Interest expense


68,512


46,840


135,642


90,906


Income tax benefit


(235

)


(827

)


(685

)


(1,128

)

Depreciation and amortization


69,543


86,822


152,900


170,024


EBITDA


136,283


138,502


151,380


230,166


Net unrealized (gains) losses on derivatives


(18,490

)


4,457


(34,754

)


31,128


CMA Differential Roll net losses (gains) (1)


12,805


37,115


Inventory valuation adjustment (2)


(451

)


(1,641

)


767


2,179


Lower of cost or net realizable value adjustments


3,521


(1,531

)


(285

)


(33,534

)

Loss on disposal or impairment of assets, net


13,695


6,063


81,233


19,147


Gain on early extinguishment of liabilities, net


(1,072

)


(13,747

)


(1,159

)


(33,102

)

Equity-based compensation expense (3)


(2,753

)


2,256


(1,793

)


4,558


Acquisition expense (4)


36


169


103


326


Other (5)


2,687


3,253


4,755


7,601


Adjusted EBITDA


$

146,261


$

137,781


$

237,362


$

228,469


Adjusted EBITDA - Discontinued Operations (6)


$


$

(190

)


$


$

(484

)

Adjusted EBITDA - Continuing Operations


$

146,261


$

137,971


$

237,362


$

228,953


Less: Cash interest expense (7)


63,729


43,568


127,088


83,967


Less: Income tax benefit


(235

)


(774

)


(685

)


(1,075

)

Less: Maintenance capital expenditures


16,979


6,830


24,724


15,998


Less: CMA Differential Roll (8)


9,968


33,900


Less: Preferred unit distributions paid


15,108


30,138


Distributable Cash Flow - Continuing Operations


$

55,820


$

73,239


$

52,335


$

99,925


_______

(1)

Adjustment to align, within Adjusted EBITDA, the net gains and losses of the Partnership’s CMA Differential Roll derivative instruments positions with the physical margin being hedged. See “Non-GAAP Financial Measures” section above for a further discussion.

(2)

Amount reflects the difference between the market value of the inventory at the balance sheet date and its cost, adjusted for the impact of seasonal market movements related to our base inventory and the related hedge. See “Non-GAAP Financial Measures” section above for a further discussion.

(3)

Equity-based compensation expense in the table above may differ from equity-based compensation expense reported in the footnotes to our unaudited condensed consolidated financial statements included in the Partnership’s Quarterly Report on Form 10-Q for the quarter ended September 30, 2021. Amounts reported in the table above include expense accruals for bonuses expected to be paid in common units, whereas the amounts reported in the footnotes to our unaudited condensed consolidated financial statements only include expenses associated with equity-based awards that have been formally granted.

(4)

Amounts represent expenses we incurred related to legal and advisory costs associated with acquisitions.

(5)

Amounts for the three months and six months ended September 30, 2021 and 2020 represent non-cash operating expenses related to our Grand Mesa Pipeline, unrealized losses on marketable securities and accretion expense for asset retirement obligations.

(6)

Amounts include the operations of TPSL, Gas Blending and Mid-Con.

(7)

Amounts represent interest expense payable in cash for the period presented, excluding changes in the accrued interest balance.

(8)

Amount represents the cash portion of the adjustments of the Partnership’s CMA Differential Roll derivative instrument positions, as discussed above, that settled during the period.


Contacts

NGL Energy Partners LP
Linda J. Bridges, 918-481-1119
Executive Vice President, Chief Financial Officer and Treasurer
This email address is being protected from spambots. You need JavaScript enabled to view it.

or

David Sullivan, 918-481-1119
Vice President - Finance
This email address is being protected from spambots. You need JavaScript enabled to view it.


Read full story here

Company commits to UN Global Compact and announces additional climate priorities


HARTFORD, Conn.--(BUSINESS WIRE)--The Hartford announced additional climate priorities today, including a commitment to invest $2.5 billion over the next five years in technologies, companies and funds, which are advancing the energy transition and addressing climate change. The company also became a signatory of the United Nations Global Compact, joining organizations worldwide to implement universal sustainability principles that advance societal goals.

“As a 211-year-old insurer and asset manager, we view the transition to a greener society as a business imperative, and we are doing our part,” said The Hartford’s Chairman and CEO Christopher Swift. “We are demonstrating our environmental commitment through our actions across the business, ranging from insurance solutions that encourage sustainable construction to investments by the company in renewable energy. We are proud of our progress and remain determined to use our resources responsibly to address the challenge of climate change.”

The Hartford is one of the first property-casualty insurance companies to sign onto the UN Global Compact, the world’s largest corporate sustainability initiative. The Global Compact brings together companies around the world to align strategies and operations with universal principles on human rights, labor, anti-corruption and the environment. For more on the organization’s mission of committing to sustainability and businesses sharing responsibility to achieve a better world, visit www.unglobalcompact.org.

As part of the new climate priorities, the company anticipates exiting all tar-sands investments by Dec. 31, 2021, two years before the commitment announced in The Hartford’s coal-and-tar-sands policy released in December 2019. Additionally, The Hartford expects to exit coal investment holdings specified in the coal-and-tar-sands policy by the end of 2023, as previously announced.

The Hartford met its goal of 100% renewable-energy-source consumption for its facilities in 2020 – 10 years before the self-imposed deadline – and will continue to maintain the company’s full-renewable status moving forward as a climate priority. Additionally, the company will continue to reduce select1 Greenhouse Gas Emissions (GHGe), in order to achieve a previously stated goal to reduce GHGe by at least 2.1% each year for a total reduction of 46.2% by 2037 compared with the baseline year of 2015. For more information on the new climate priorities, visit https://www.thehartford.com/about-us/environment.

These new priorities are the latest in a series of The Hartford’s commitments to sustainability and environmental stewardship. The company first formalized a climate change statement in 2007 and has adapted the statement to align with the fifth Assessment of the Intergovernmental Panel on Climate Change (IPCC). The company published its first Task Force on Climate Related Financial Disclosure (TCFD) report in 2020 and its first Sustainability Accounting Standards Board (SASB) report in 2021. The Hartford also was recognized in the “Leadership” category by CDP, an organization to which The Hartford has reported its climate change efforts and practices for 15 years.

About The Hartford

The Hartford is a leader in property and casualty insurance, group benefits and mutual funds. With more than 200 years of expertise, The Hartford is widely recognized for its service excellence, sustainability practices, trust and integrity. More information on the company and its financial performance is available at https://www.thehartford.com. Follow us on Twitter at @TheHartford_PR.

The Hartford Financial Services Group, Inc., (NYSE: HIG) operates through its subsidiaries under the brand name, The Hartford, and is headquartered in Hartford, Connecticut. For additional details, please read The Hartford’s legal notice.

HIG-C

Some of the statements in this release may be considered forward-looking statements as defined in the Private Securities Litigation Reform Act of 1995. We caution investors that these forward-looking statements are not guarantees of future performance, and actual results may differ materially. Investors should consider the important risks and uncertainties that may cause actual results to differ. These important risks and uncertainties include those discussed in our 2020 Annual Report on Form 10-K, subsequent Quarterly Reports on Forms 10-Q, and the other filings we make with the Securities and Exchange Commission. We assume no obligation to update this release, which speaks as of the date issued.

From time to time, The Hartford may use its website and/or social media outlets, such as Twitter and Facebook, to disseminate material company information. Financial and other important information regarding The Hartford is routinely accessible through and posted on our website at https://ir.thehartford.com, Twitter account at www.twitter.com/TheHartford_PR and Facebook at https://facebook.com/thehartford. In addition, you may automatically receive email alerts and other information about The Hartford when you enroll your email address by visiting the “Email Alerts” section at https://ir.thehartford.com.


1 Scope 1 and Scope 2 emissions are direct from sources controlled or owned by an organization; Scope 3 emissions include indirect sources of GHGe. For more information, visit the U.S. Environmental Protection Agency’s Center for Corporate Climate Leadership.


Contacts

Media:
Matthew Sturdevant
860-547-8664
This email address is being protected from spambots. You need JavaScript enabled to view it.

Investor :
Susan Spivak Bernstein
860-547-6233
This email address is being protected from spambots. You need JavaScript enabled to view it.

Offshore Source Logo

Offshore Source keeps you updated with relevant information concerning the Offshore Energy Sector.

Any views or opinions represented on this website belong solely to the author and do not represent those of the people, institutions or organizations that Offshore Source or collaborators may or may not have been associated with in a professional or personal capacity, unless explicitly stated.

Corporate Offices

Technology Systems Corporation
8502 SW Kansas Ave
Stuart, FL 34997

info@tscpublishing.com